une 2016 - site principal d'i · une 2016 innovation, science ... aussi offert en français...
TRANSCRIPT
KEY SMALL BUSINESS STATISTICSJUNE 2016
Innovation, Science and Economic Development Canada Small Business Branch
www.ic.gc.ca/sbstatistics
This publication is also available online in HTML in print-ready format at www.ic.gc.ca/sbstatistics.
To obtain a copy of this publication or an alternate format (Braille, large print, etc.), please fill out the Publication Request Form or contact:
Web Services Centre Innovation, Science and Economic Development Canada C.D. Howe Building 235 Queen Street Ottawa, ON K1A 0H5 Canada
Telephone (toll-free in Canada): 1-800-328-6189 Telephone (international): 613-954-5031 TTY (for hearing impaired): 1-866-694-8389 Business hours: 8:30 a.m. to 5:00 p.m. (Eastern Time) Email: [email protected]
Permission to Reproduce
Except as otherwise specifically noted, the information in this publication may be reproduced, in part or in whole and by any means, without charge or further permission from the Department of Industry, provided that due diligence is exercised in ensuring the accuracy of the information reproduced; that the Department of Industry is identified as the source institution; and that the reproduction is not represented as an official version of the information reproduced, or as having been made in affiliation with, or with the endorsement of, the Department of Industry.
For permission to reproduce the information in this publication for commercial purposes, please fill out the Application for Crown Copyright Clearance or contact the Web Services Centre (see contact information above).
© Her Majesty the Queen in Right of Canada, as represented by the Minister of Industry, 2016
Cat. No. Iu186-1E-PDF ISSN 1718-3456
Aussi offert en français sous le titre Principales statistiques relatives aux petites entreprises – Juin 2016.
iKEY SMALL BUSINESS STATISTICS — JUNE 2016
TABLE OF CONTENTS
List of Figures ...................................................................................................................................ii
List of Tables ...................................................................................................................................iii
Foreword ........................................................................................................................................iv
Highlights ........................................................................................................................................vi
1. Number of Businesses............................................................................................................. 1
1.1 How many SMEs are there in Canada? ...................................................................... 1
2. Employment ............................................................................................................................ 4
2.1 How many people work for SMEs? .............................................................................. 4
2.2 How many jobs do SMEs create? ................................................................................ 7
2.3 How many businesses appear and disappear each year? ..................................... 9
3. Growth ................................................................................................................................... 11
3.1 What is the share of high-growth firms? .................................................................... 11
4. Financing ............................................................................................................................... 13
4.1 What types of financing do SMEs use? ..................................................................... 13
5. Innovation.............................................................................................................................. 16
5.1 How much do SMEs innovate? .................................................................................. 16
6. Exports.................................................................................................................................... 18
6.1 How do SMEs contribute to Canada’s exports? ...................................................... 18
7. Contribution to Gross Domestic Product ............................................................................ 21
7.1 How do SMEs contribute to Canada’s gross domestic product? .......................... 21
8. Business Owner Characteristics .......................................................................................... 23
8.1 What is the number of female SME entrepreneurs? ................................................ 23
8.2 What are the age, experience and education levels of SME owners? ................ 25
9. Concluding Remarks ............................................................................................................ 27
ii KEY SMALL BUSINESS STATISTICS — JUNE 2016
Figure 2.1-1: Share of Total Private Employment by Size of Business, 2015 ...................................4
Figure 2.2-1: Percentage of Private Net Employment Change by Business Size, 2005–2015 .....7
Figure 2.2-2: Contribution to Net Change in Private Employment by Business Size, 2005–2015 ......8
Figure 2.3-1: Births and Deaths of SMEs, 2013 ...................................................................................9
Figure 3.1-1: Percentage of High-Growth Firms by Industry, Based upon Revenue and Employment Growth, 2010–2013 .........................................................................11
Figure 3.1-2: Gazelles as a Proportion of all Enterprises with at Least 10 Employees, Based upon Employment and Revenue Growth, 2011–2013 ................................12
Figure 4.1-1: Financing Instruments Used by Start-Up SMEs ..........................................................14
Figure 4.1-2: Financing Instruments Used by SMEs for Business Acquisitions ...............................15
Figure 5.1-1: Percentage of Total Expenditures ($ billions) on R&D by Business Size, 2011–2013 .....17
Figure 5.1-2: Percentage of SMEs Innovating within the Last Three Years by Industrial Sector, 2012–2014 ..................................................................................17
Figure 6.1-1: Proportion of SMEs that Exported Goods and Services in 2014 .............................18
Figure 6.1-2: Proportion of Innovating and Non-Innovating SMEs that Exported in 2014 .........19
Figure 7.1-1: Small Businesses’ Contribution to GDP by Province, 2014 ......................................22
Figure 8.1-1: SME Ownership by Gender, 2014 ..............................................................................23
Figure 8.1-2: Business Ownership by Gender and Industries, 2014 ..............................................24
Figure 8.2-1: Percentage of SME Owners by Age and Business Size, 2014 .................................25
Figure 8.2-2: Percentage of SME Owners by Years of Experience and Business Size, 2014 ......26
Figure 8.2-3: Highest Level of Education Attained by SME Owners, 2014...................................26
LIST OF FIGURES
iiiKEY SMALL BUSINESS STATISTICS — JUNE 2016
Table 1.1-1: Total Number of Employer Businesses by Size and Number of Small and Medium-Sized Businesses per 1,000 Provincial Population, December 2015 .............1
Table 1.1-2: Number of Employer Businesses by Sector and Firm Size (number of employees), December 2015 ...................................................................................2
Table 1.1-3: Number of Employer Businesses by Sector and Number of Employees, December 2015 ................................................................................ 3
Table 2.1-1: Total Private Employment by Province and Establishment Size, 2015 ......................5
Table 2.1-2: Total Private Employment by Industrial Sector and Establishment Size, 2015 .........6
Table 2.3-1: Business Insolvencies by Industry, 2014 ......................................................................10
Table 4.1-1: External Financing Request Rate, 2014 ......................................................................13
Table 4.1-2: SME Financing Authorized in 2014 ..............................................................................13
Table 6.1-1: Export Destinations of SMEs by Business Size, 2014 ...................................................19
Table 6.1-2: Export Destinations of SMEs by Industrial Sector, 2014 .............................................20
LIST OF TABLES
iv KEY SMALL BUSINESS STATISTICS — JUNE 2016
FOREWORDKey Small Business Statistics provides statistical data on the business sector in Canada, focusing on
small and medium-sized enterprises (SMEs). This edition contains data on the following questions:
• How many SMEs are there in Canada?
• How many people work for SMEs?
• How many jobs do SMEs create?
• How many businesses appear and disappear each year?
• What is the share of high-growth firms?
• What types of financing do SMEs use?
• How much do SMEs innovate?
• How do SMEs contribute to Canada’s exports?
• How do SMEs contribute to Canada’s gross domestic product?
• What is the number of female SME entrepreneurs?
• What are the age, experience and education levels of SME owners?
In this publication, the definition of what constitutes a “business” or an “enterprise” may vary slightly
according to the statistical sources used. Below is a list of those sources and links to the definitions that
they use:
• Business Register: www23.statcan.gc.ca/imdb-bmdi/document/1105_D16_T9_V1-eng.htm;
• Survey on Financing and Growth of Small and Medium Enterprises, 2014:
www23.statcan.gc.ca/imdb/p2SV.pl?Function=getSurvey&SDDS=2941;
• Entrepreneurship Indicators Database:
www23.statcan.gc.ca/imdb/p2SV.pl?Function=getSurvey&SDDS=5157;
• Labor Force Survey: www23.statcan.gc.ca/imdb/p2SV.pl?Function=getSurvey&lang=en&db=imdb&ad
m=8&dis=2&SDDS=3701 and CANSIM Table 282-0075;
• Industrial Research and Development:
www23.statcan.gc.ca/imdb/p2SV.pl?Function=getSurvey&SDDS=4201;
1. Self-employed workers include those with incorporated and unincorporated businesses that may or may not use paid help. “Indeterminate” businesses include self-employed and contract workers. British Colombia’s Statistical Service often include self-employed in their statistics, please refer to the source listed above for more details.

vKEY SMALL BUSINESS STATISTICS — JUNE 2016
• Office of the Superintendent of Bankruptcy Canada:
www.ic.gc.ca/eic/site/bsf-osb.nsf/eng/br03356.html; and
• British Columbia’s Statistical Service, Small Business Profile, 2015:
www.bcstats.gov.bc.ca/Files/a4a89f2f-e7dd-48a2-8c7f-df56cadb324b/SmallBusinessProfile2015.pdf.
Innovation, Science and Economic Development Canada (ISED) defines a business based upon
the number of paid employees. For this reason, self-employed and “indeterminate” businesses are
generally not included in the present publication as they do not have paid employees.1
Accordingly, this publication defines an SME as a business establishment with 1–499 paid employees,
more specifically:
• A small business has 1 to 99 paid employees.2
• A medium-sized business has 100 to 499 paid employees.
• A large business has 500 or more paid employees.
The following are other definitions used in this publication:
• Start-up: A business that is two years old or younger.
• High-growth firm (HGF): A business with an average annualized growth rate of greater than
20 percent, over a three-year period, and with 10 or more employees at the beginning of the
period. HGF growth can be recorded in terms of revenue or employment (number of employees).
Notes on data and statistics:
• Many statistics on self-employment are no longer part of Key Small Business Statistics.
• In this report, numbers of industries differ based upon the survey source. In particular, the Survey
on Financing and Growth of Small and Medium Enterprises covers fewer industries than the
Labour Force Survey and the Business Register. Moreover, the Survey on Financing and Growth
of Small and Medium Enterprises aggregates some industries together. As a result, some industry
names will also differ.
This new edition and previous publications are available on the SME Research and Statistics website at
www.ic.gc.ca/SMEresearch.
2. Other groupings exist among this group of enterprises. For instance, enterprises with 1 to 4 employees are defined as micro-enterprises.
vi KEY SMALL BUSINESS STATISTICS — JUNE 2016
HIGHLIGHTS
NUMBER OF BUSINESSES
• As of December 2015, the Canadian economy totalled 1.17 million employer businesses. Of these,
1.14 million (97.9 percent) were small businesses, 21,415 (1.8 percent) were medium-sized businesses
and 2,933 (0.3 percent) were large businesses.
• In 2013, the total number of SME births was 78,430, compared with 83,240 deaths, which resulted
in a net decrease of 4,810 businesses.
EMPLOYMENT
• As of 2015, small businesses employed over 8.2 million individuals in Canada, or 70.5 percent of
the total private labour force. By comparison, medium-sized businesses accounted for 19.8 percent
(2.3 million individuals) and large businesses accounted for 9.7 percent (1.1 million individuals) of
the private sector workforce.
• Small businesses were responsible for the vast majority (87.7 percent) of net employment change 3
between 2005 and 2015 (1.2 million jobs), compared with 7.7 percent for medium-sized businesses
and 4.6 percent for large businesses.
HIGH-GROWTH FIRMS
• High-growth firms are present in every economic sector and are not just concentrated in
knowledge-based industries. In terms of employment, the highest concentrations of HGFs
in Canada during the 2011–2013 period were in construction (5.5 percent); administrative and
support services (5.5 percent); and transportation and warehousing (5.0 percent).
FINANCING
• In 2014, 51.3 percent of SMEs sought external financing, compared with 48.7 percent that did not
request external financing.
• Lacking both a credit history and the collateral needed to secure a loan, over 80 percent of
start-ups used personal financing to finance their new businesses.
3. Net employment change is the difference between total employment in two years.
viiKEY SMALL BUSINESS STATISTICS — JUNE 2016
INNOVATION
• Between 2011 and 2013, small businesses accounted for 27 percent of total research and
development expenditures, spending $13.0 billion over the period.
• In 2014, the highest percentages of SMEs that innovated were found in manufacturing (61.5 percent),
wholesale trade (50.5 percent) and professional, scientific and technical services (45.0 percent).
EXPORTS
• In 2013, Canada exported goods totalling $420 billion, of which $106 billion (25.2 percent) was
exported by SMEs.
• In 2014, 73,000 SMEs (11.8 percent) exported goods and services.
SMALL BUSINESS CONTRIBUTION TO GDP
• In 2014, small businesses contributed an average of 30 percent to the gross domestic product
(GDP) of their province.
• Small businesses in British Columbia and Alberta contributed the highest share to their provincial
GDP at 33 percent and 32 percent respectively.
• Small businesses in Saskatchewan and Quebec contributed 30 percent to their provincial GDP.
FEMALE ENTREPRENEURS
• In 2014, 15.7 percent of SMEs were majority owned by women and 19.7 percent were equally
owned by women and men.
• SMEs owned by female entrepreneurs are most common in information, administration, health
care and recreation; and other services (24.1 percent and 23.0 percent respectively).
BUSINESS OWNER CHARACTERISTICS
• In 2014, the highest percentage of SME owners was in the 50–64 years of age group (47.4 percent
for small businesses and 51.0 percent for medium-sized businesses).
• More than 60 percent of medium-sized business owners have a bachelor’s or a master’s degree,
compared with 38 percent for small businesses.

1 KEY SMALL BUSINESS STATISTICS — JUNE 2016
1. NUMBER OF BUSINESSES
1.1 HOW MANY SMES ARE THERE IN CANADA?
As of December 2015, there were 1.17 million employer businesses in Canada, as shown in Table 1.1-1.
Of these, 1.14 million (97.9 percent) businesses were small businesses, 21,415 (1.8 percent) were
medium-sized businesses and 2,933 (0.3 percent) were large enterprises.
More than half of Canada’s small employer businesses are concentrated in Ontario and Quebec
(407,175 and 235,075 respectively). Western Canada has a robust and growing small business
community led by British Columbia, which had 176,014 small businesses as of December 2015. Among
the Atlantic provinces, Nova Scotia is home to the greatest number of small businesses, totalling 29,298.
Table 1.1-1: Total Number of Employer Businesses by Size and Number of Small and Medium-Sized Businesses per 1,000 Provincial Population, December 2015
Source: Statistics Canada, Business Register, December 2015.
Provinces/TerritoriesEmployer Businesses
Number of SMEs per 1,000 Population (aged 15+ years)
Small(1–99)
Medium(100–499)
Large(500+) Total
Newfoundland and Labrador 17,174 307 45 17,526 39.1
Prince Edward Island 5,838 83 14 5,935 48.7
Nova Scotia 29,298 556 68 29,922 37.3
New Brunswick 25,002 443 64 25,509 40.0
Quebec 235,075 4,301 590 239,966 34.7
Ontario 407,175 8,437 1,189 416,801 36.3
Manitoba 37,776 829 107 38,712 37.3
Saskatchewan 40,453 644 88 41,185 45.5
Alberta 165,792 3,076 437 169,305 50.0
British Columbia 176,014 2,623 329 178,966 45.2
Yukon 1,723 34 0 1,757 57.3
Northwest Territories 1,606 51 1 1,658 48.5
Nunavut 704 31 1 736 29.6
Canada 1,143,630 21,415 2,933 1,167,978 39.2Percentage 97.9 1.8 0.3 100.0
2KEY SMALL BUSINESS STATISTICS — JUNE 2016
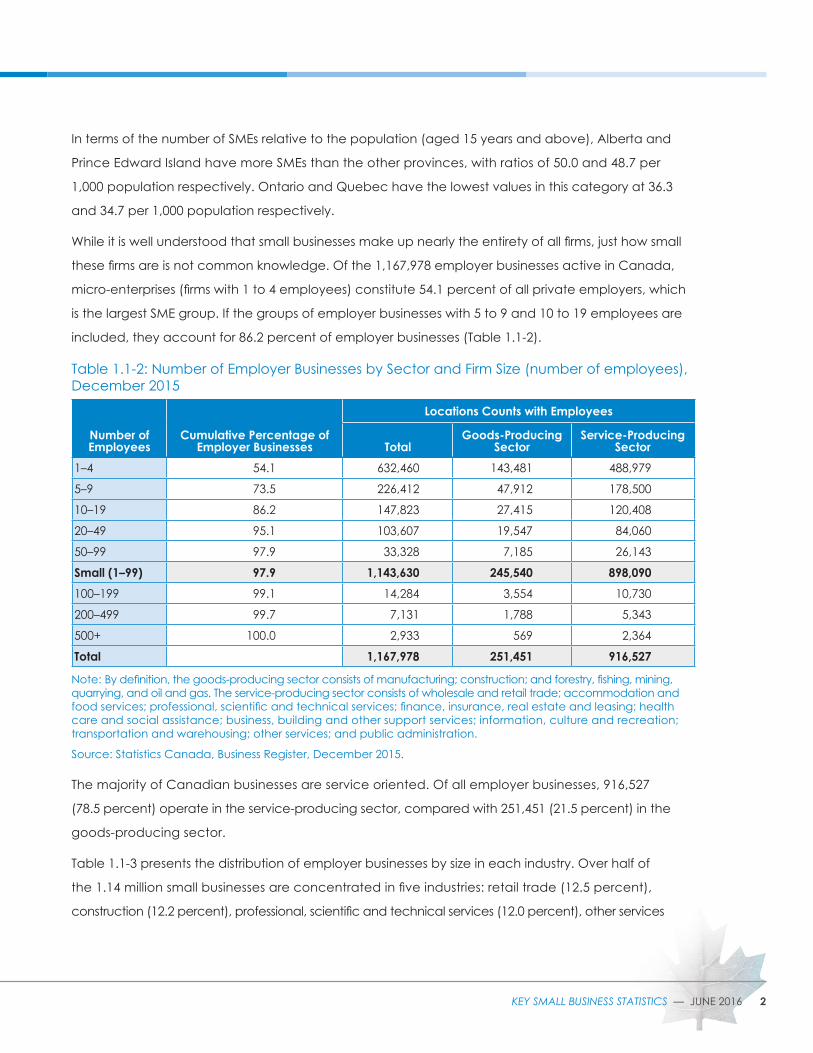
In terms of the number of SMEs relative to the population (aged 15 years and above), Alberta and
Prince Edward Island have more SMEs than the other provinces, with ratios of 50.0 and 48.7 per
1,000 population respectively. Ontario and Quebec have the lowest values in this category at 36.3
and 34.7 per 1,000 population respectively.
While it is well understood that small businesses make up nearly the entirety of all firms, just how small
these firms are is not common knowledge. Of the 1,167,978 employer businesses active in Canada,
micro-enterprises (firms with 1 to 4 employees) constitute 54.1 percent of all private employers, which
is the largest SME group. If the groups of employer businesses with 5 to 9 and 10 to 19 employees are
included, they account for 86.2 percent of employer businesses (Table 1.1-2).
Table 1.1-2: Number of Employer Businesses by Sector and Firm Size (number of employees), December 2015
Note: By definition, the goods-producing sector consists of manufacturing; construction; and forestry, fishing, mining, quarrying, and oil and gas. The service-producing sector consists of wholesale and retail trade; accommodation and food services; professional, scientific and technical services; finance, insurance, real estate and leasing; health care and social assistance; business, building and other support services; information, culture and recreation; transportation and warehousing; other services; and public administration.
Source: Statistics Canada, Business Register, December 2015.
The majority of Canadian businesses are service oriented. Of all employer businesses, 916,527
(78.5 percent) operate in the service-producing sector, compared with 251,451 (21.5 percent) in the
goods-producing sector.
Table 1.1-3 presents the distribution of employer businesses by size in each industry. Over half of
the 1.14 million small businesses are concentrated in five industries: retail trade (12.5 percent),
construction (12.2 percent), professional, scientific and technical services (12.0 percent), other services
Number of Employees
Cumulative Percentage of Employer Businesses
Locations Counts with Employees
TotalGoods-Producing
SectorService-Producing
Sector1–4 54.1 632,460 143,481 488,979
5–9 73.5 226,412 47,912 178,500
10–19 86.2 147,823 27,415 120,408
20–49 95.1 103,607 19,547 84,060
50–99 97.9 33,328 7,185 26,143
Small (1–99) 97.9 1,143,630 245,540 898,090100–199 99.1 14,284 3,554 10,730
200–499 99.7 7,131 1,788 5,343
500+ 100.0 2,933 569 2,364
Total 1,167,978 251,451 916,527
3 KEY SMALL BUSINESS STATISTICS — JUNE 2016
(9.6 percent) and health care and social assistance (9.2 percent). The distribution of medium-sized
businesses is different, with nearly half concentrated across manufacturing (14.6 percent), retail trade
(13.5 percent), health care and social assistance (10.3 percent) and administrative and support,
waste management and remediation services (7.5 percent).
Table 1.1-3: Number of Employer Businesses by Sector and Number of Employees, December 2015
Source: Statistics Canada, Business Register, December 2015.
Industrial Sector
Employer Businesses
Total 1–4 5–9 10–19 20–49 50–99Small (1–99) 100–199 200–499
Medium (100–499)
Large (500+)
Agriculture, forestry, fishing and hunting 47,397 33,251 7,790 3,606 1,951 523 47,121 204 61 265 11Mining, quarrying, and oil and gas extraction 10,446 6,238 1,273 1,106 940 425 9,982 242 136 378 86
Utilities 1,460 523 236 187 236 133 1,315 62 45 107 38
Construction 141,246 85,701 28,494 14,314 8,578 2,546 139,633 1,059 412 1,471 142
Manufacturing 50,902 17,768 10,119 8,202 7,842 3,558 47,489 1,987 1,134 3,121 292
Wholesale trade 60,184 25,458 13,467 10,671 7,339 2,133 59,068 741 315 1,056 60
Retail trade 145,566 53,060 41,987 26,914 15,049 5,555 142,565 2,115 779 2,894 107Transportation and warehousing 63,629 44,399 7,493 5,065 4,075 1,405 62,437 712 351 1,063 129
Information and cultural industries 15,650 8,049 2,713 1,943 1,727 638 15,070 325 193 518 62Finance and insurance 42,762 20,853 6,589 5,857 7,531 1,003 41,833 444 325 769 160Real estate and rental and leasing 49,068 33,990 7,365 4,194 2,392 694 48,635 263 122 385 48Professional, scientific and technical services 138,375 103,809 16,342 9,365 5,799 1,845 137,160 758 343 1,101 114Management of companies and enterprises 11,816 6,586 1,588 1,179 1,111 571 11,035 352 244 596 185Administrative and support, waste management and remediation services 52,800 27,466 10,778 6,538 4,449 1,762 50,993 976 634 1,610 197
Educational services 13,487 5,848 2,507 1,923 1,652 626 12,556 260 237 497 434Health care and social assistance 107,423 60,206 20,621 13,923 7,546 2,567 104,863 1,442 758 2,200 360Arts, entertainment and recreation 17,567 8,305 3,313 2,390 2,228 737 16,973 346 172 518 76Accommodation and food services 79,693 19,347 18,960 18,313 17,053 4,721 78,394 950 292 1,242 57Other services (except public administration) 110,233 69,795 23,400 10,768 4,579 1,068 109,610 424 156 580 43
Public administration 8,274 1,808 1,377 1,365 1,530 818 6,898 622 422 1,044 332
Total 1,167,978 632,460 226,412 147,823 103,607 33,328 1,143,630 14,284 7,131 21,415 2,933
4KEY SMALL BUSINESS STATISTICS — JUNE 2016
2. EMPLOYMENT
2.1 HOW MANY PEOPLE WORK FOR SMES?
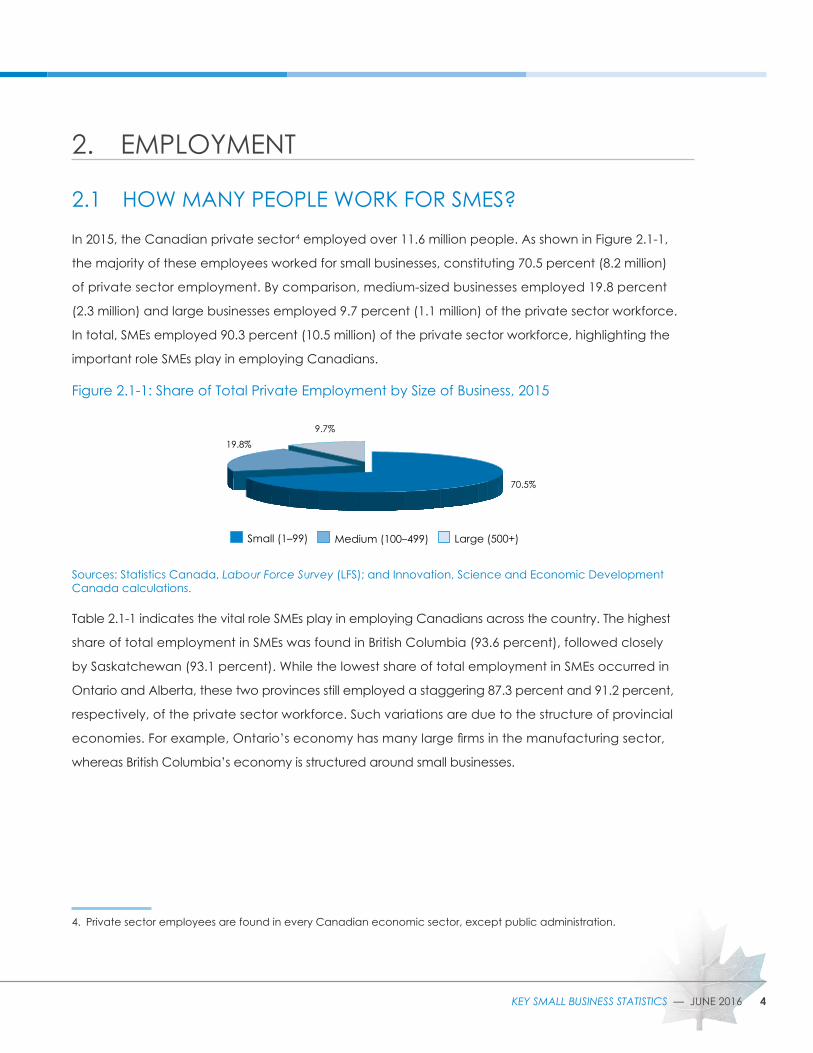
In 2015, the Canadian private sector 4 employed over 11.6 million people. As shown in Figure 2.1-1,
the majority of these employees worked for small businesses, constituting 70.5 percent (8.2 million)
of private sector employment. By comparison, medium-sized businesses employed 19.8 percent
(2.3 million) and large businesses employed 9.7 percent (1.1 million) of the private sector workforce.
In total, SMEs employed 90.3 percent (10.5 million) of the private sector workforce, highlighting the
important role SMEs play in employing Canadians.
Figure 2.1-1: Share of Total Private Employment by Size of Business, 2015
Sources: Statistics Canada, Labour Force Survey (LFS); and Innovation, Science and Economic Development Canada calculations.
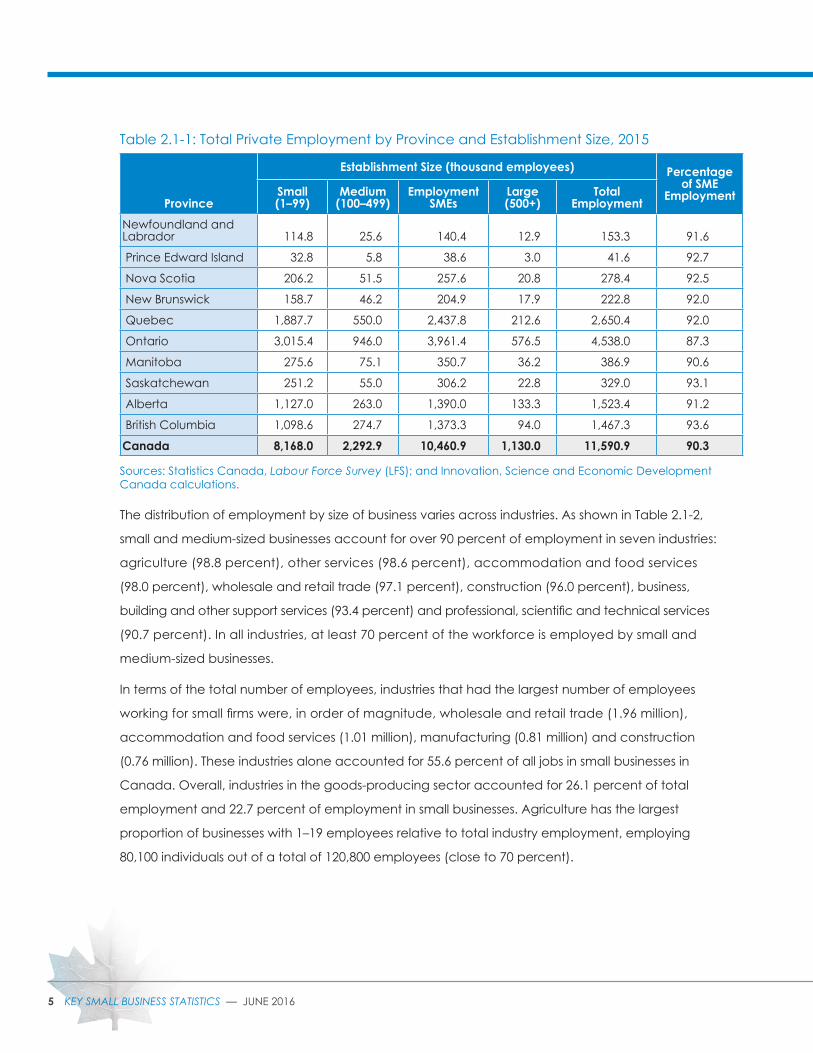
Table 2.1-1 indicates the vital role SMEs play in employing Canadians across the country. The highest
share of total employment in SMEs was found in British Columbia (93.6 percent), followed closely
by Saskatchewan (93.1 percent). While the lowest share of total employment in SMEs occurred in
Ontario and Alberta, these two provinces still employed a staggering 87.3 percent and 91.2 percent,
respectively, of the private sector workforce. Such variations are due to the structure of provincial
economies. For example, Ontario’s economy has many large firms in the manufacturing sector,
whereas British Columbia’s economy is structured around small businesses.
9.7%19.8%
70.5%
Large (500+)Medium (100–499)Small (1–99)
4. Private sector employees are found in every Canadian economic sector, except public administration.
5 KEY SMALL BUSINESS STATISTICS — JUNE 2016
Table 2.1-1: Total Private Employment by Province and Establishment Size, 2015
Sources: Statistics Canada, Labour Force Survey (LFS); and Innovation, Science and Economic Development Canada calculations.
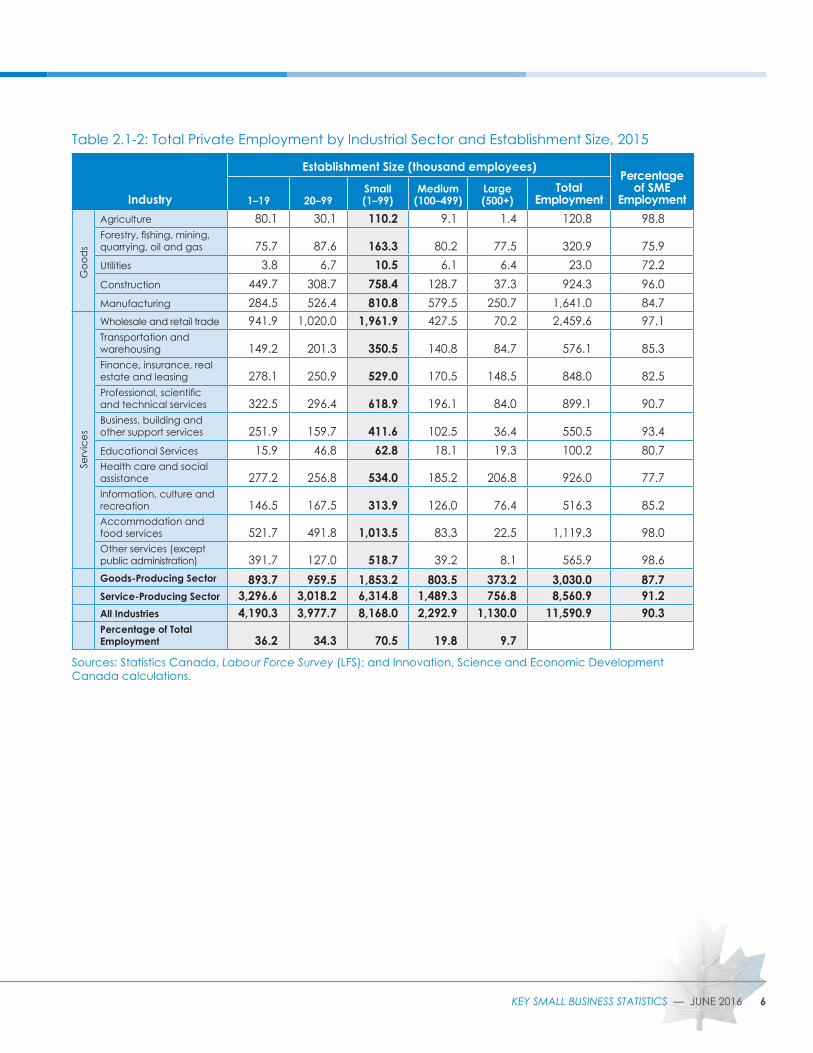
The distribution of employment by size of business varies across industries. As shown in Table 2.1-2,
small and medium-sized businesses account for over 90 percent of employment in seven industries:
agriculture (98.8 percent), other services (98.6 percent), accommodation and food services
(98.0 percent), wholesale and retail trade (97.1 percent), construction (96.0 percent), business,
building and other support services (93.4 percent) and professional, scientific and technical services
(90.7 percent). In all industries, at least 70 percent of the workforce is employed by small and
medium-sized businesses.
In terms of the total number of employees, industries that had the largest number of employees
working for small firms were, in order of magnitude, wholesale and retail trade (1.96 million),
accommodation and food services (1.01 million), manufacturing (0.81 million) and construction
(0.76 million). These industries alone accounted for 55.6 percent of all jobs in small businesses in
Canada. Overall, industries in the goods-producing sector accounted for 26.1 percent of total
employment and 22.7 percent of employment in small businesses. Agriculture has the largest
proportion of businesses with 1–19 employees relative to total industry employment, employing
80,100 individuals out of a total of 120,800 employees (close to 70 percent).
Province
Establishment Size (thousand employees) Percentage of SME
EmploymentSmall (1–99)
Medium (100–499)
Employment SMEs
Large (500+)
Total Employment
Newfoundland and Labrador 114.8 25.6 140.4 12.9 153.3 91.6
Prince Edward Island 32.8 5.8 38.6 3.0 41.6 92.7
Nova Scotia 206.2 51.5 257.6 20.8 278.4 92.5
New Brunswick 158.7 46.2 204.9 17.9 222.8 92.0
Quebec 1,887.7 550.0 2,437.8 212.6 2,650.4 92.0
Ontario 3,015.4 946.0 3,961.4 576.5 4,538.0 87.3
Manitoba 275.6 75.1 350.7 36.2 386.9 90.6
Saskatchewan 251.2 55.0 306.2 22.8 329.0 93.1
Alberta 1,127.0 263.0 1,390.0 133.3 1,523.4 91.2
British Columbia 1,098.6 274.7 1,373.3 94.0 1,467.3 93.6
Canada 8,168.0 2,292.9 10,460.9 1,130.0 11,590.9 90.3
6KEY SMALL BUSINESS STATISTICS — JUNE 2016
Table 2.1-2: Total Private Employment by Industrial Sector and Establishment Size, 2015
Sources: Statistics Canada, Labour Force Survey (LFS); and Innovation, Science and Economic Development Canada calculations.
Industry
Establishment Size (thousand employees)Percentage
of SME Employment1–19 20–99
Small (1–99)
Medium (100–499)
Large (500+)
Total Employment
Goo
ds
Agriculture 80.1 30.1 110.2 9.1 1.4 120.8 98.8Forestry, fishing, mining, quarrying, oil and gas 75.7 87.6 163.3 80.2 77.5 320.9 75.9Utilities 3.8 6.7 10.5 6.1 6.4 23.0 72.2Construction 449.7 308.7 758.4 128.7 37.3 924.3 96.0Manufacturing 284.5 526.4 810.8 579.5 250.7 1,641.0 84.7
Serv
ices
Wholesale and retail trade 941.9 1,020.0 1,961.9 427.5 70.2 2,459.6 97.1Transportation and warehousing 149.2 201.3 350.5 140.8 84.7 576.1 85.3Finance, insurance, real estate and leasing 278.1 250.9 529.0 170.5 148.5 848.0 82.5Professional, scientific and technical services 322.5 296.4 618.9 196.1 84.0 899.1 90.7Business, building and other support services 251.9 159.7 411.6 102.5 36.4 550.5 93.4Educational Services 15.9 46.8 62.8 18.1 19.3 100.2 80.7Health care and social assistance 277.2 256.8 534.0 185.2 206.8 926.0 77.7Information, culture and recreation 146.5 167.5 313.9 126.0 76.4 516.3 85.2Accommodation and food services 521.7 491.8 1,013.5 83.3 22.5 1,119.3 98.0Other services (except public administration) 391.7 127.0 518.7 39.2 8.1 565.9 98.6Goods-Producing Sector 893.7 959.5 1,853.2 803.5 373.2 3,030.0 87.7Service-Producing Sector 3,296.6 3,018.2 6,314.8 1,489.3 756.8 8,560.9 91.2All Industries 4,190.3 3,977.7 8,168.0 2,292.9 1,130.0 11,590.9 90.3Percentage of Total Employment 36.2 34.3 70.5 19.8 9.7
7 KEY SMALL BUSINESS STATISTICS — JUNE 2016
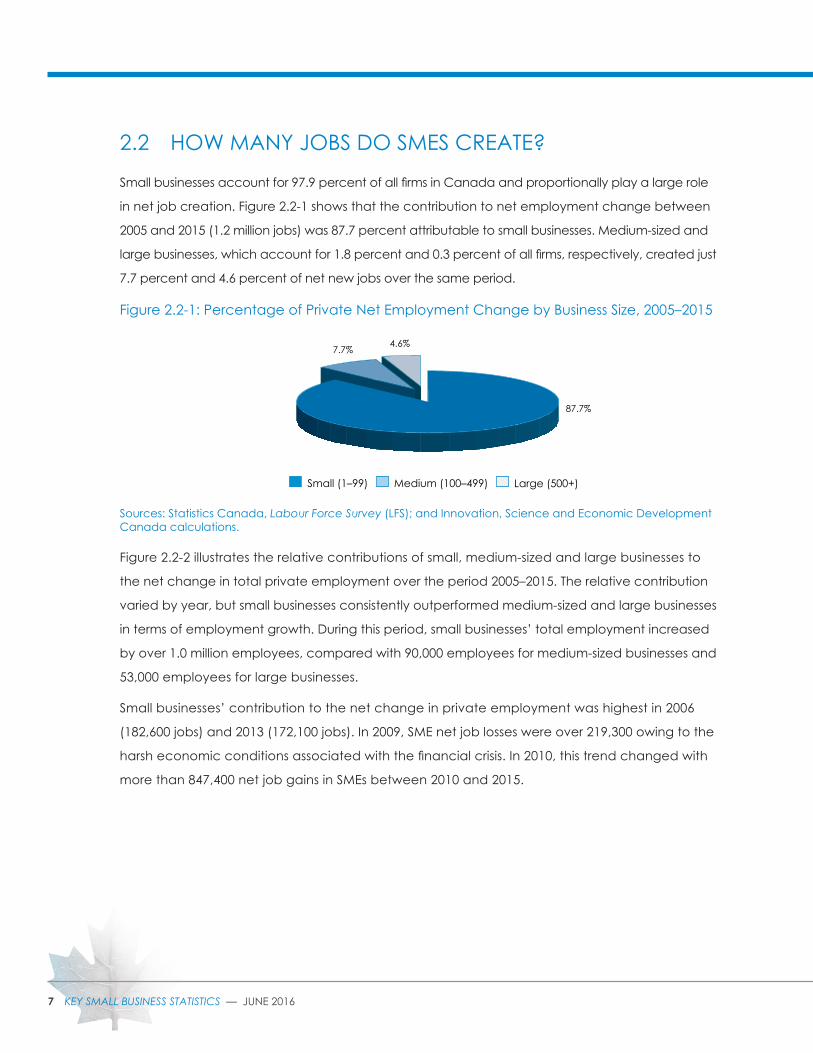
2.2 HOW MANY JOBS DO SMES CREATE?
Small businesses account for 97.9 percent of all firms in Canada and proportionally play a large role
in net job creation. Figure 2.2-1 shows that the contribution to net employment change between
2005 and 2015 (1.2 million jobs) was 87.7 percent attributable to small businesses. Medium-sized and
large businesses, which account for 1.8 percent and 0.3 percent of all firms, respectively, created just
7.7 percent and 4.6 percent of net new jobs over the same period.
Figure 2.2-1: Percentage of Private Net Employment Change by Business Size, 2005–2015
Sources: Statistics Canada, Labour Force Survey (LFS); and Innovation, Science and Economic Development Canada calculations.
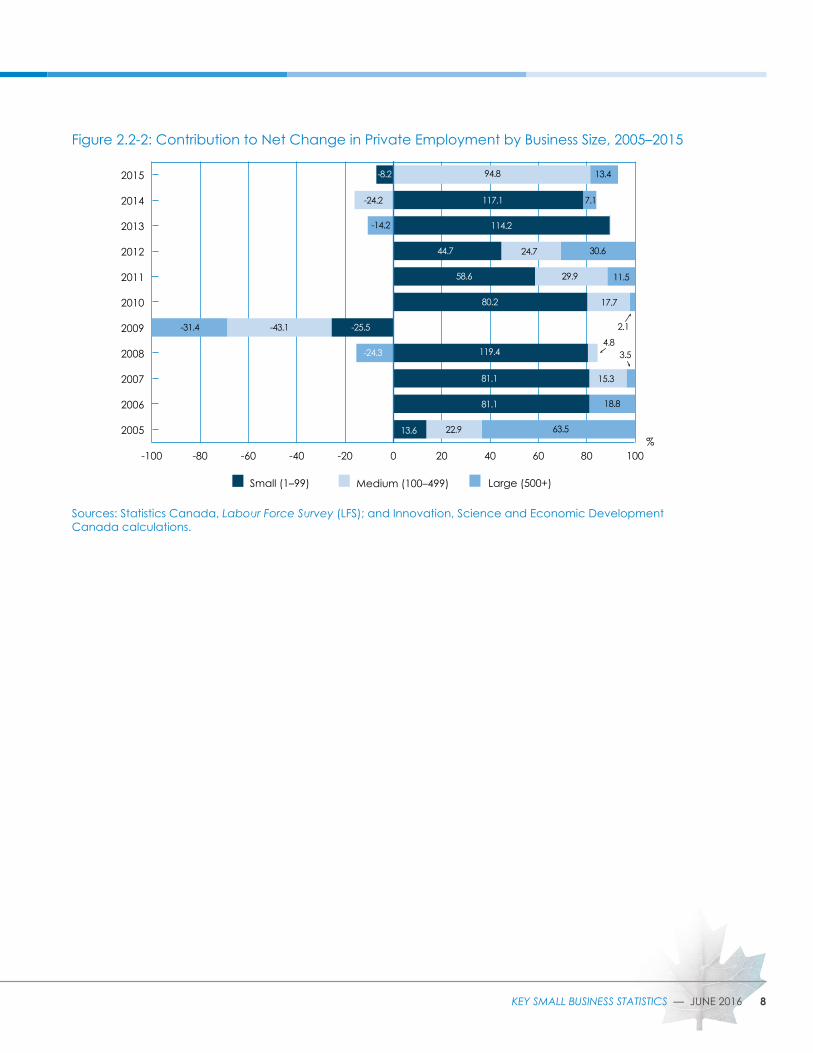
Figure 2.2-2 illustrates the relative contributions of small, medium-sized and large businesses to
the net change in total private employment over the period 2005–2015. The relative contribution
varied by year, but small businesses consistently outperformed medium-sized and large businesses
in terms of employment growth. During this period, small businesses’ total employment increased
by over 1.0 million employees, compared with 90,000 employees for medium-sized businesses and
53,000 employees for large businesses.
Small businesses’ contribution to the net change in private employment was highest in 2006
(182,600 jobs) and 2013 (172,100 jobs). In 2009, SME net job losses were over 219,300 owing to the
harsh economic conditions associated with the financial crisis. In 2010, this trend changed with
more than 847,400 net job gains in SMEs between 2010 and 2015.
4.6%7.7%
87.7%
Large (500+)Medium (100–499)Small (1–99)
8KEY SMALL BUSINESS STATISTICS — JUNE 2016
Figure 2.2-2: Contribution to Net Change in Private Employment by Business Size, 2005–2015
Sources: Statistics Canada, Labour Force Survey (LFS); and Innovation, Science and Economic Development Canada calculations.
-100 -80 -60 -40 -20 0 20 40 60 80 100
Large (500+)Medium (100–499)Small (1–99)
2005
2006
2007
2008
2009
2010
2011
2012
2013
2014
2015
%13.6 22.9
94.8
63.5
18.8
15.3
4.83.5
2.1
17.7
11.5
13.4
7.1
29.9
30.624.7
-43.1-31.4
-24.2
-14.2
81.1
81.1
80.2
58.6
44.7
119.4
114.2
117.1
-25.5
-24.3
-8.2
9 KEY SMALL BUSINESS STATISTICS — JUNE 2016
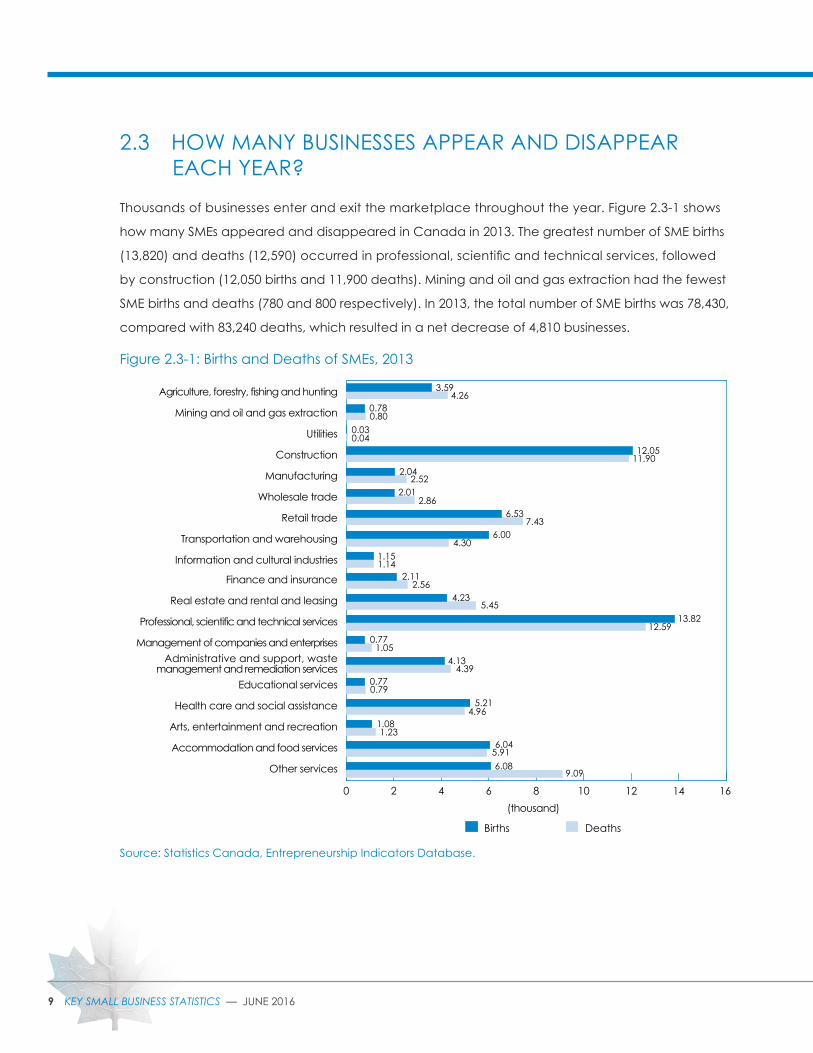
2.3 HOW MANY BUSINESSES APPEAR AND DISAPPEAR EACH YEAR?
Thousands of businesses enter and exit the marketplace throughout the year. Figure 2.3-1 shows
how many SMEs appeared and disappeared in Canada in 2013. The greatest number of SME births
(13,820) and deaths (12,590) occurred in professional, scientific and technical services, followed
by construction (12,050 births and 11,900 deaths). Mining and oil and gas extraction had the fewest
SME births and deaths (780 and 800 respectively). In 2013, the total number of SME births was 78,430,
compared with 83,240 deaths, which resulted in a net decrease of 4,810 businesses.
Figure 2.3-1: Births and Deaths of SMEs, 2013
Source: Statistics Canada, Entrepreneurship Indicators Database.
4.263.59
0.780.80
0.030.04
12.0511.90
2.042.52
2.012.86
6.537.43
6.004.30
1.151.14
2.562.11
4.235.45
0.771.05
4.394.13
5.21
1.23
0.770.79
1.084.96
6.045.916.08
9.09
12.5913.82
(thousand)0 2 4 6 8 10 12 14 16
DeathsBirths
Other services
Accommodation and food services
Arts, entertainment and recreation
Health care and social assistance
Educational services
Administrative and support, wastemanagement and remediation services
Management of companies and enterprises
Professional, scientific and technical services
Real estate and rental and leasing
Finance and insurance
Information and cultural industries
Transportation and warehousing
Retail trade
Wholesale trade
Manufacturing
Construction
Utilities
Mining and oil and gas extraction
Agriculture, forestry, fishing and hunting
10KEY SMALL BUSINESS STATISTICS — JUNE 2016
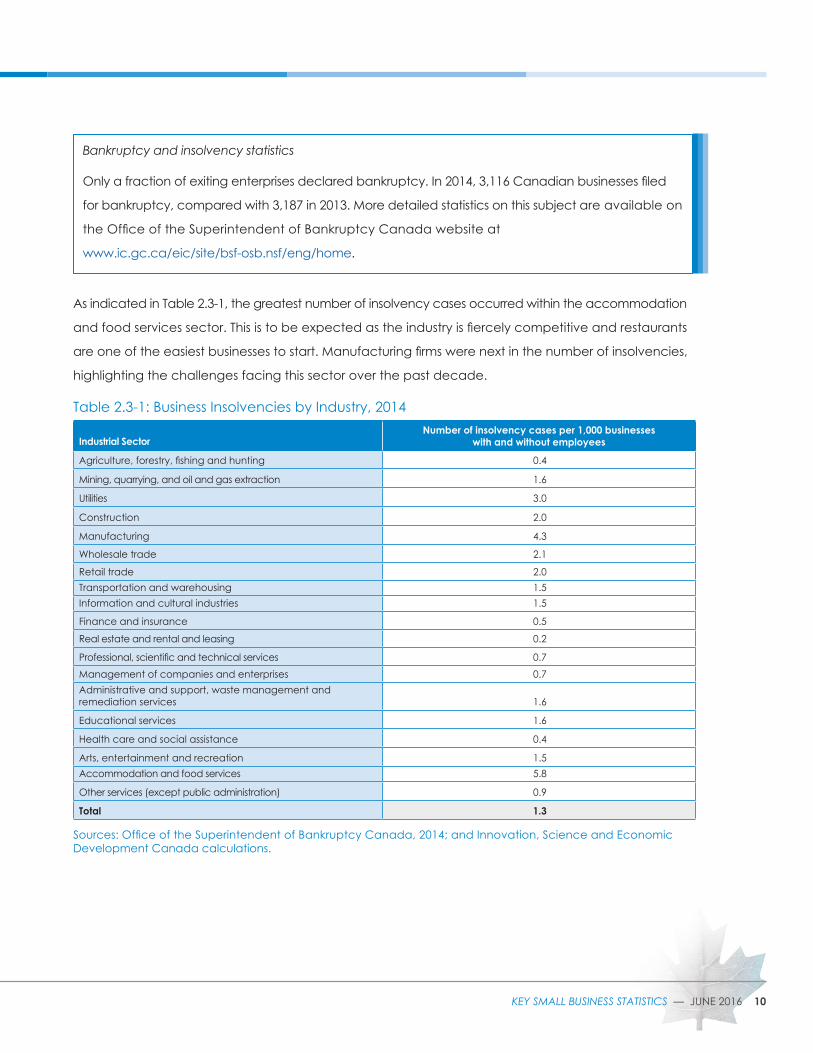
As indicated in Table 2.3-1, the greatest number of insolvency cases occurred within the accommodation
and food services sector. This is to be expected as the industry is fiercely competitive and restaurants
are one of the easiest businesses to start. Manufacturing firms were next in the number of insolvencies,
highlighting the challenges facing this sector over the past decade.
Table 2.3-1: Business Insolvencies by Industry, 2014
Sources: Office of the Superintendent of Bankruptcy Canada, 2014; and Innovation, Science and Economic Development Canada calculations.
Industrial SectorNumber of insolvency cases per 1,000 businesses
with and without employees
Agriculture, forestry, fishing and hunting 0.4
Mining, quarrying, and oil and gas extraction 1.6
Utilities 3.0
Construction 2.0
Manufacturing 4.3
Wholesale trade 2.1
Retail trade 2.0Transportation and warehousing 1.5Information and cultural industries 1.5
Finance and insurance 0.5
Real estate and rental and leasing 0.2
Professional, scientific and technical services 0.7Management of companies and enterprises 0.7Administrative and support, waste management and remediation services 1.6
Educational services 1.6
Health care and social assistance 0.4
Arts, entertainment and recreation 1.5Accommodation and food services 5.8
Other services (except public administration) 0.9
Total 1.3
Bankruptcy and insolvency statistics
Only a fraction of exiting enterprises declared bankruptcy. In 2014, 3,116 Canadian businesses filed
for bankruptcy, compared with 3,187 in 2013. More detailed statistics on this subject are available on
the Office of the Superintendent of Bankruptcy Canada website at
www.ic.gc.ca/eic/site/bsf-osb.nsf/eng/home.
11 KEY SMALL BUSINESS STATISTICS — JUNE 2016
3. GROWTH
3.1 WHAT IS THE SHARE OF HIGH-GROWTH FIRMS?
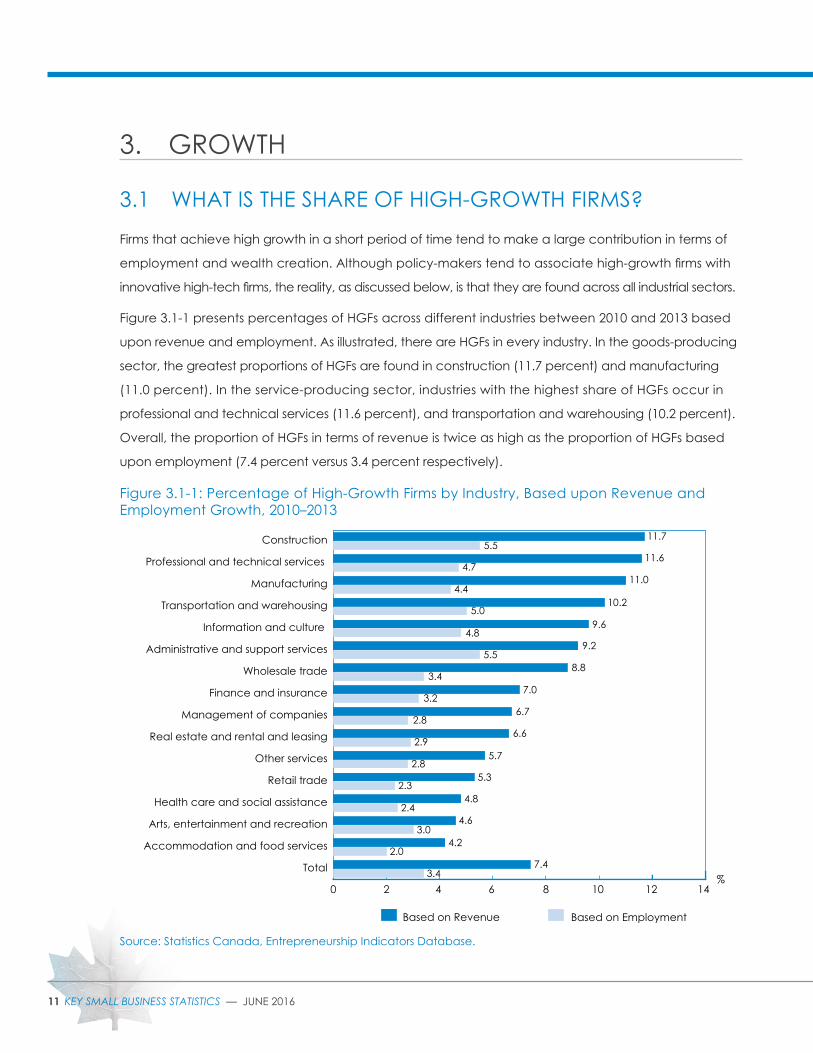
Firms that achieve high growth in a short period of time tend to make a large contribution in terms of
employment and wealth creation. Although policy-makers tend to associate high-growth firms with
innovative high-tech firms, the reality, as discussed below, is that they are found across all industrial sectors.
Figure 3.1-1 presents percentages of HGFs across different industries between 2010 and 2013 based
upon revenue and employment. As illustrated, there are HGFs in every industry. In the goods-producing
sector, the greatest proportions of HGFs are found in construction (11.7 percent) and manufacturing
(11.0 percent). In the service-producing sector, industries with the highest share of HGFs occur in
professional and technical services (11.6 percent), and transportation and warehousing (10.2 percent).
Overall, the proportion of HGFs in terms of revenue is twice as high as the proportion of HGFs based
upon employment (7.4 percent versus 3.4 percent respectively).
Figure 3.1-1: Percentage of High-Growth Firms by Industry, Based upon Revenue and Employment Growth, 2010–2013
Source: Statistics Canada, Entrepreneurship Indicators Database.
5.511.7
11.64.7
4.411.0
10.2
2.4
2.0
4.8
5.0
4.89.6
5.59.2
8.83.4
7.0
3.4
6.73.2
6.6
2.8
4.63.0
4.2
2.8
5.7
5.32.3
2.9
7.4
0 2 4 6 8 10 12 14
Based on EmploymentBased on Revenue
Total
Accommodation and food services
Arts, entertainment and recreation
Health care and social assistance
Retail trade
Other services
Real estate and rental and leasing
Management of companies
Finance and insurance
Wholesale trade
Administrative and support services
Information and culture
Transportation and warehousing
Manufacturing
Professional and technical services
Construction
%
12KEY SMALL BUSINESS STATISTICS — JUNE 2016
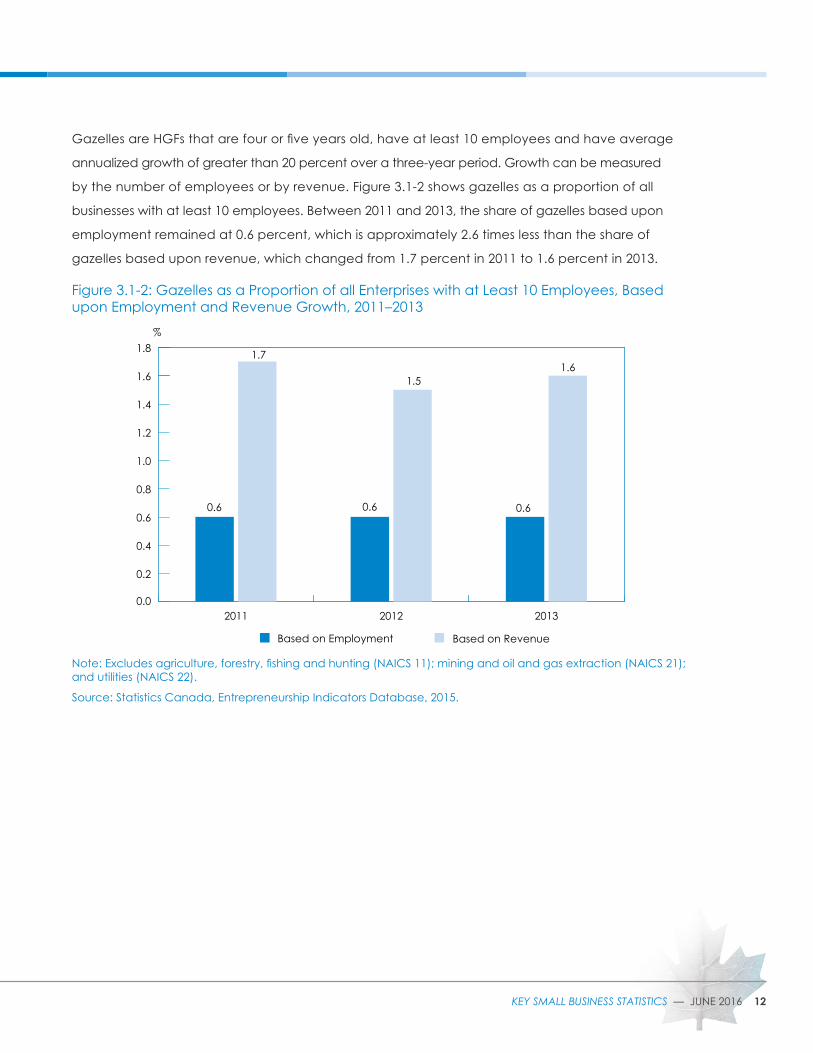
Gazelles are HGFs that are four or five years old, have at least 10 employees and have average
annualized growth of greater than 20 percent over a three-year period. Growth can be measured
by the number of employees or by revenue. Figure 3.1-2 shows gazelles as a proportion of all
businesses with at least 10 employees. Between 2011 and 2013, the share of gazelles based upon
employment remained at 0.6 percent, which is approximately 2.6 times less than the share of
gazelles based upon revenue, which changed from 1.7 percent in 2011 to 1.6 percent in 2013.
Figure 3.1-2: Gazelles as a Proportion of all Enterprises with at Least 10 Employees, Based upon Employment and Revenue Growth, 2011–2013
Note: Excludes agriculture, forestry, fishing and hunting (NAICS 11); mining and oil and gas extraction (NAICS 21); and utilities (NAICS 22).
Source: Statistics Canada, Entrepreneurship Indicators Database, 2015.
0.0
0.2
0.4
0.6
0.8
1.0
1.2
1.4
1.6
1.8
Based on RevenueBased on Employment
201320122011
%
0.6 0.6
1.51.6
0.6
1.7
13 KEY SMALL BUSINESS STATISTICS — JUNE 2016
4. FINANCING
4.1 WHAT TYPES OF FINANCING DO SMES USE?
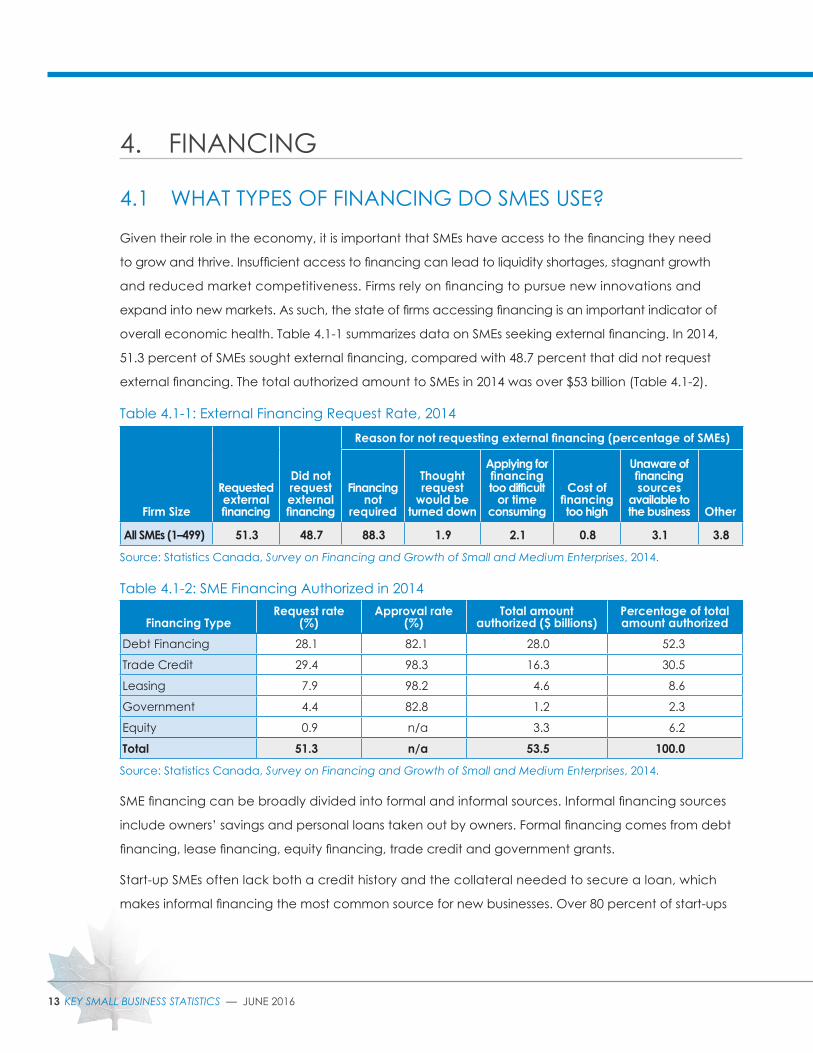
Given their role in the economy, it is important that SMEs have access to the financing they need
to grow and thrive. Insufficient access to financing can lead to liquidity shortages, stagnant growth
and reduced market competitiveness. Firms rely on financing to pursue new innovations and
expand into new markets. As such, the state of firms accessing financing is an important indicator of
overall economic health. Table 4.1-1 summarizes data on SMEs seeking external financing. In 2014,
51.3 percent of SMEs sought external financing, compared with 48.7 percent that did not request
external financing. The total authorized amount to SMEs in 2014 was over $53 billion (Table 4.1-2).
Table 4.1-1: External Financing Request Rate, 2014
Source: Statistics Canada, Survey on Financing and Growth of Small and Medium Enterprises, 2014.
Table 4.1-2: SME Financing Authorized in 2014
Source: Statistics Canada, Survey on Financing and Growth of Small and Medium Enterprises, 2014.
SME financing can be broadly divided into formal and informal sources. Informal financing sources
include owners’ savings and personal loans taken out by owners. Formal financing comes from debt
financing, lease financing, equity financing, trade credit and government grants.
Start-up SMEs often lack both a credit history and the collateral needed to secure a loan, which
makes informal financing the most common source for new businesses. Over 80 percent of start-ups
Firm Size
Requested external financing
Did not request external financing
Reason for not requesting external financing (percentage of SMEs)
Financing not
required
Thought request
would be turned down
Applying for financing too difficult
or time consuming
Cost of financing too high
Unaware of financing sources
available to the business Other
All SMEs (1–499) 51.3 48.7 88.3 1.9 2.1 0.8 3.1 3.8
Financing TypeRequest rate
(%)Approval rate
(%)Total amount
authorized ($ billions)Percentage of total amount authorized
Debt Financing 28.1 82.1 28.0 52.3
Trade Credit 29.4 98.3 16.3 30.5
Leasing 7.9 98.2 4.6 8.6
Government 4.4 82.8 1.2 2.3
Equity 0.9 n/a 3.3 6.2
Total 51.3 n/a 53.5 100.0
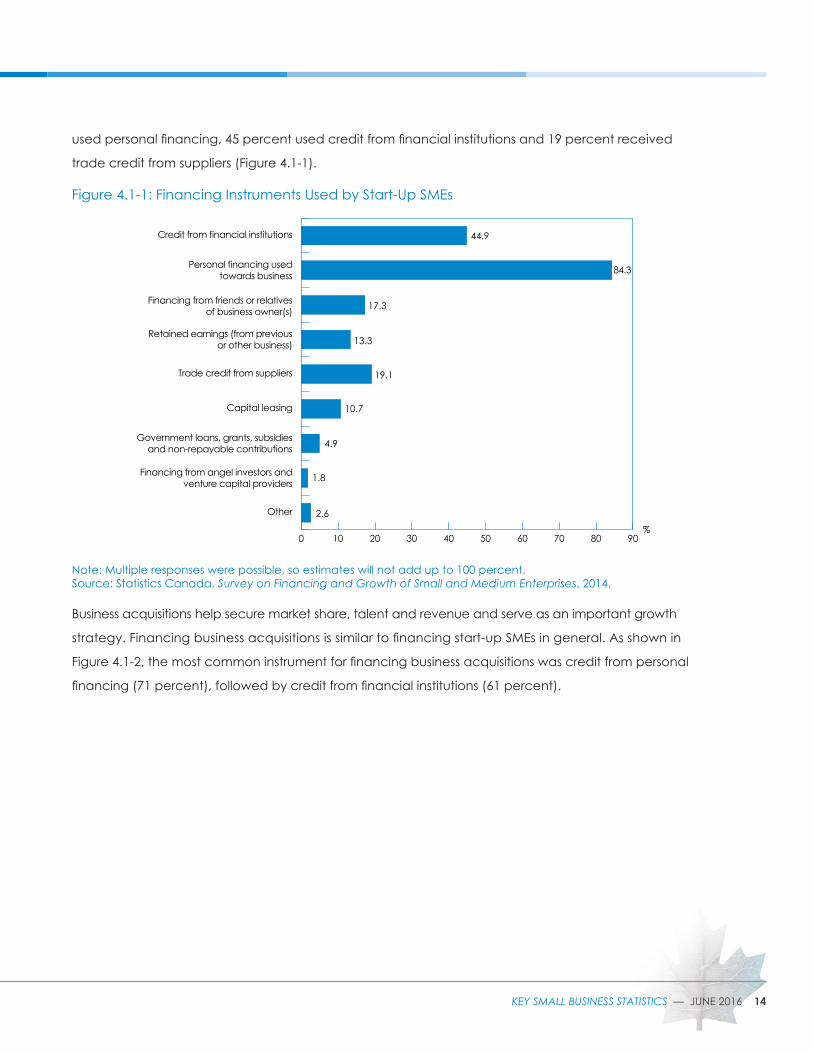
14KEY SMALL BUSINESS STATISTICS — JUNE 2016
used personal financing, 45 percent used credit from financial institutions and 19 percent received
trade credit from suppliers (Figure 4.1-1).
Figure 4.1-1: Financing Instruments Used by Start-Up SMEs
Note: Multiple responses were possible, so estimates will not add up to 100 percent. Source: Statistics Canada, Survey on Financing and Growth of Small and Medium Enterprises, 2014.
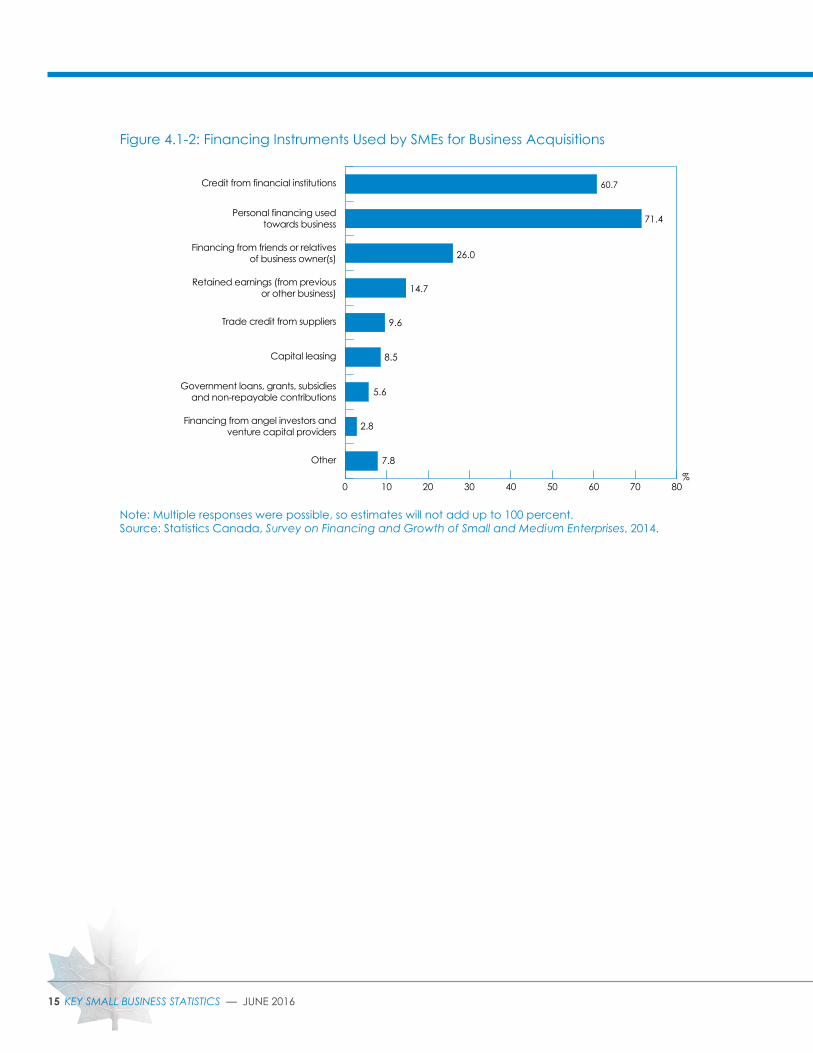
Business acquisitions help secure market share, talent and revenue and serve as an important growth
strategy. Financing business acquisitions is similar to financing start-up SMEs in general. As shown in
Figure 4.1-2, the most common instrument for financing business acquisitions was credit from personal
financing (71 percent), followed by credit from financial institutions (61 percent).
5.5 44.9
4.4 84.3
2.6
17.3
13.3
19.1
4.9
1.8
10.7
0 10 20 30 40 50 60 70 80 90
Other
Financing from angel investors andventure capital providers
Government loans, grants, subsidiesand non-repayable contributions
Capital leasing
Trade credit from suppliers
Retained earnings (from previousor other business)
Financing from friends or relativesof business owner(s)
Personal financing usedtowards business
Credit from financial institutions
%
15 KEY SMALL BUSINESS STATISTICS — JUNE 2016
Figure 4.1-2: Financing Instruments Used by SMEs for Business Acquisitions
Note: Multiple responses were possible, so estimates will not add up to 100 percent. Source: Statistics Canada, Survey on Financing and Growth of Small and Medium Enterprises, 2014.
60.7
71.44.4
7.8
26.0
14.7
9.6
5.6
2.8
8.5
0 10 20 30 40 50 60 70 80
Other
Financing from angel investors andventure capital providers
Government loans, grants, subsidiesand non-repayable contributions
Capital leasing
Trade credit from suppliers
Retained earnings (from previousor other business)
Financing from friends or relativesof business owner(s)
Personal financing usedtowards business
Credit from financial institutions
%
16KEY SMALL BUSINESS STATISTICS — JUNE 2016
5. INNOVATION
5.1 HOW MUCH DO SMES INNOVATE?
In a world with limited resources, the fastest way for SMEs to boost productivity and economic growth
is to innovate. Innovation is often thought to be synonymous with high-technology inventions, but
innovative business behaviour encompasses a broad range of practices, including technological
inventions and operational optimizations, to turn creative ideas into innovations. The Survey on
Financing and Growth of Small and Medium Enterprises, 2014 divides innovations into product, process,
organizational and marketing categories.5 Survey data show that over 41.7 percent of small businesses
and 58.3 percent of medium-sized enterprises implemented at least one type of innovation.
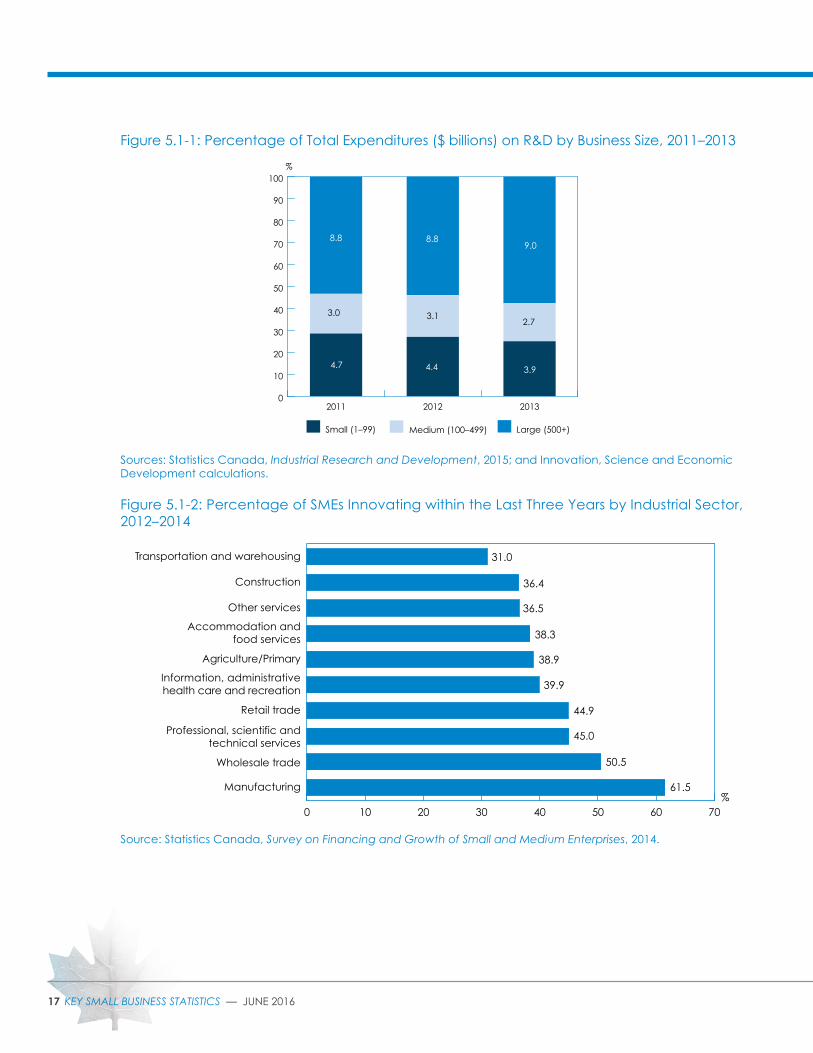
The availability of resources to spend on research and development (R&D) is tied to the size of
businesses. While large businesses make up approximately 0.3 percent of all employer businesses,
Figure 5.1-1 shows that between 2011 and 2013 they accounted for over 50 percent of all R&D spending.
Comparatively, despite representing 97.9 percent of all employer businesses, small businesses accounted
for about 27 percent of total R&D spending. Medium-sized businesses, which make up 1.8 percent of
employer businesses, accounted for about 18 percent of all R&D spending. It is particularly noteworthy
that SME spending on R&D has been consistently declining over the course of the period 2011–2013.
Figure 5.1-2 shows the percentage of SMEs by industry that have innovated within the last three years.
Innovation levels were highest in manufacturing (61.5 percent), wholesale trade (50.5 percent)
and professional, scientific and technical services (45.0 percent). Transportation and warehousing,
and construction have the lowest percentage of innovative businesses, with only 31.0 percent and
36.4 percent of businesses innovating, respectively, within the last three years.
5. This survey excludes the following industries: utilities (NAICS 22), finance and insurance (NAICS 52), management of companies and enterprises (NAICS 55), educational services (NAICS 61) and public administration (NAICS 91). More information on the Survey on Financing and Growth of Small and Medium Enterprises can be found at www.ic.gc.ca/eic/site/061.nsf/eng/h_02774.html.
17 KEY SMALL BUSINESS STATISTICS — JUNE 2016
Figure 5.1-1: Percentage of Total Expenditures ($ billions) on R&D by Business Size, 2011–2013
Sources: Statistics Canada, Industrial Research and Development, 2015; and Innovation, Science and Economic Development calculations.
Figure 5.1-2: Percentage of SMEs Innovating within the Last Three Years by Industrial Sector, 2012–2014
Source: Statistics Canada, Survey on Financing and Growth of Small and Medium Enterprises, 2014.
0
10
20
30
40
50
60
70
80
90
100
Large (500+)Medium (100–499)Small (1–99)
201320122011
8.8
4.7
%
3.0
8.8
4.4
9.0
3.9
3.12.7
0 10 20 30 40 50 60 70
Manufacturing
Wholesale trade
Professional, scientific andtechnical services
Retail trade
Information, administrativehealth care and recreation
Agriculture/Primary
Accommodation andfood services
Other services
Construction
Transportation and warehousing
%
31.0
36.4
36.5
38.3
38.9
39.9
44.9
45.0
61.5
50.5
18KEY SMALL BUSINESS STATISTICS — JUNE 2016
6. EXPORTS
6.1 HOW DO SMES CONTRIBUTE TO CANADA’S EXPORTS?
Exporting is vital to Canada’s economy. It is a driver of economic growth and is strongly correlated with
real gross domestic product growth. Furthermore, exporting can provide a strategically important means of
growing a firm by expanding its market beyond the confines of Canada’s relatively small domestic market.
Canada’s continued commitment to establishing trade agreements reflects this importance.
In 2013, Canada exported goods totalling $420 billion, of which $106 billion was exported by SMEs.
More than 37,000 Canadian SMEs were active exporters of goods to a broad array of international
destinations. While the majority (over 26,000) of these SMEs exported to only one country, a significant
number exported to two and three to five countries (4,200 and 3,700 respectively).6
Data from the Survey on Financing and Growth of Small and Medium Enterprises, 2014, which captures
exports of both goods and services, show that 11.8 percent (73,000) of SMEs exported in 2014. The
percentage of small businesses that export is less than half the percentage of medium-sized enterprises
that export, revealing the important role that size plays in determining the propensity of firms to export
(Figure 6.1-1).
Figure 6.1-1: Proportion of SMEs that Exported Goods and Services in 2014
Sources: Statistics Canada, Survey on Financing and Growth of Small and Medium Enterprises, 2014; and Innovation, Science and Economic Development Canada calculations.
6. Statistics Canada, Trade by Enterprise Characteristics (TEC), 2013. This section uses data from both TEC and the Survey on Financing and Growth of Small and Medium Enterprises, 2014. TEC provides dollar values of exports, but does not include data on trade in services. The Survey on Financing and Growth of Small and Medium Enterprises captures only the percentage of businesses that export both goods and services, but no dollar values.
0
20
40
60
80
100
Did not exportDid export
Medium (100–499)Small (1–99)
11.5
%
88.5
28.0
72.0
19 KEY SMALL BUSINESS STATISTICS — JUNE 2016
As illustrated in Figure 6.1-2, innovative SMEs tend to outperform non-innovators in terms of exports.
This suggests that innovation and exports may be positively correlated, but further research is required
to determine the role of product, process, organizational and marketing innovations in exporting.
Figure 6.1-2: Proportion of Innovating and Non-Innovating SMEs that Exported in 2014
Sources: Statistics Canada, Survey on Financing and Growth of Small and Medium Enterprises, 2014; and Innovation, Science and Economic Development Canada calculations.
In terms of destinations in 2014, Table 6.1-1 indicates that the main destination for Canadian SME exports
continues to be the United States, which accounted for 88.1 percent of total exports of small businesses
and 96.2 percent of exports of medium-sized businesses. In 2014, national SMEs also actively exported to
China and other Asian countries, which cumulatively accounted for over 25 percent of exports of small
businesses and more than 40 percent of exports of medium-sized enterprises. Compared with medium-sized
businesses, the percentage of small enterprises that export is lower in all destination categories except
Europe, where the percentage of small and medium-sized exporters is almost identical (31.6 percent for
small businesses versus 31.2 percent for medium-sized enterprises).
Table 6.1-1: Export Destinations of SMEs by Business Size, 2014
Note: Multiple responses were possible, so estimates add up to more than 100 percent.
Sources: Statistics Canada, Survey on Financing and Growth of Small and Medium Enterprises, 2014; and Innovation, Science and Economic Development Canada calculations.
Business Size (number of employees)
United States Latin America Europe China Other Asia Other
Percentage of ExportersAll SMEs 89.2 16.7 31.3 13.1 15.5 20.61–4 84.4 13.8 32.7 11.5 15.6 18.0
5–19 92.6 16.4 30.2 15.5 13.8 23.9
20–99 91.7 21.4 30.4 11.0 17.0 18.7
Small (1–99) 88.1 15.6 31.6 12.8 15.1 20.1Medium (100–499) 96.2 26.5 31.2 17.7 24.1 27.7
0
20
40
60
80
100
Non-InnovatorInnovator
Non-exporterExporter
%
61.4
38.6
38.9
61.1
20KEY SMALL BUSINESS STATISTICS — JUNE 2016
Further evidence highlighting the centrality of the United States as a major export destination for SMEs
is presented in Table 6.1-2. In particular, the United States is an especially important destination for
manufacturing exports (95.6 percent) and transportation and warehousing exports (91.0 percent).
Canadian service firms actively export to Europe in larger numbers, particularly professional, scientific
and technical services (34.3 percent). China and Europe are important export destinations for
agriculture, forestry and primary industries (20.2 percent and 17.8 percent respectively), while China is
also a prominent importer of transportation and warehousing services (19 percent).
Table 6.1-2: Export Destinations of SMEs by Industrial Sector, 2014
Note 1: “X” denotes data that were deemed confidential by Statistics Canada because of the low number of observations.
Note 2: Multiple responses were possible, so estimates add up to more than 100 percent.
Source: Statistics Canada, Survey on Financing and Growth of Small and Medium Enterprises, 2014.
Industrial Sector
Did NOT export
Did export
United States
Latin America Europe China Other
Asia Other
Percentage of ExportersAgriculture, Forestry, Fishing and Hunting; Mining and Oil and Gas Extraction 89.1 10.9 86.4 10.5 17.8 20.2 12.8 18.4
Construction 98.1 1.9 89.7 X 19.3 X 0.0 11.8
Manufacturing 61.7 38.3 95.6 19.1 31.1 12.4 15.7 20.9
Wholesale Trade 73.1 26.9 86.9 13.4 23.1 12.1 18.6 19.3
Retail Trade 94.2 5.8 95.1 15.5 31.1 7.6 6.4 19.1
Transportation and Warehousing 80.5 19.5 91.0 14.4 21.9 19.0 20.6 12.4
Professional, Scientific and Technical Services 77.4 22.6 83.9 17.3 34.3 12.2 16.5 22.8
Other Services 95.4 4.6 91.9 13.3 11.1 0.0 X 11.1
Information and Cultural Industries; Real Estate and Rental and Leasing; Administrative and Support, Waste Management and Remediation Services; Health Care and Social Assistance; Arts, Entertainment and Recreation 93.0 7.0 85.3 22.0 47.1 10.7 14.0 24.2
Canada Total 88.2 11.8 89.2 16.7 31.3 13.1 15.5 20.6
21 KEY SMALL BUSINESS STATISTICS — JUNE 2016
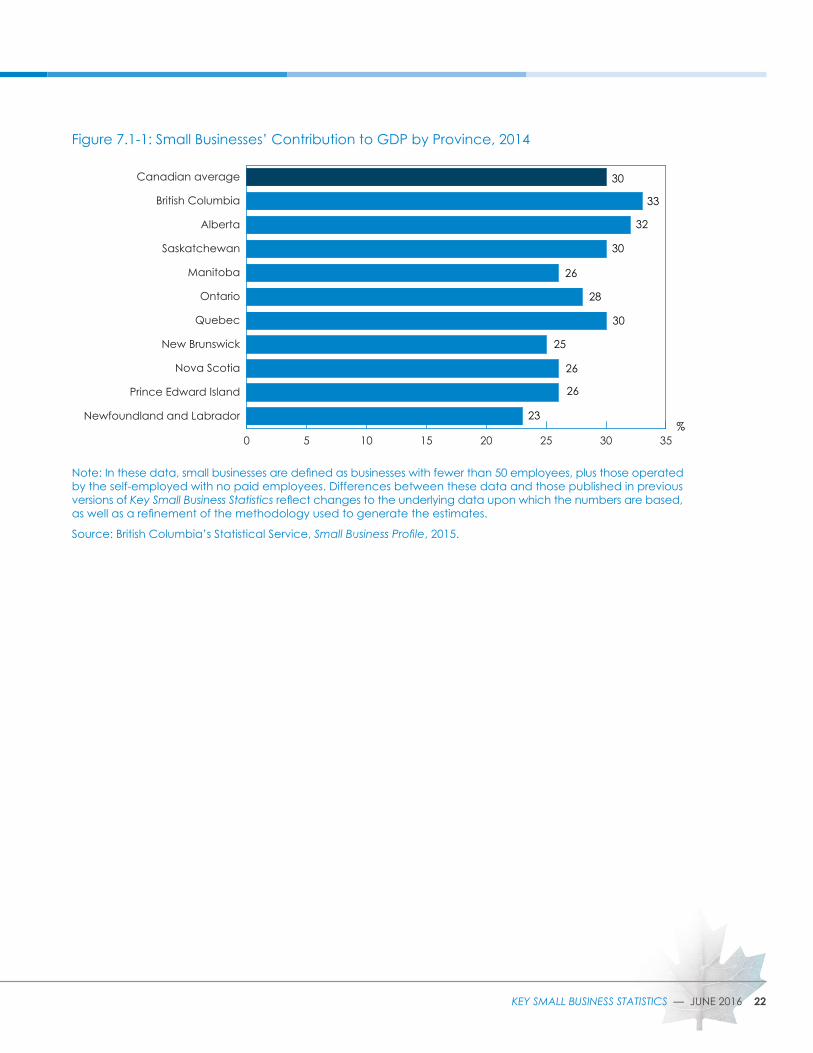
7. CONTRIBUTION TO GROSS DOMESTIC PRODUCT
7.1 HOW DO SMES CONTRIBUTE TO CANADA’S GROSS DOMESTIC PRODUCT?
Gross domestic product is a key measure of economic production that can be used to compare any
two industries’ value added, i.e., the value that an industry, through its activities, adds to its inputs. The
main advantage of the GDP concept is that it avoids double counting; hence, it is considered superior
in gauging economic performance over, for example, revenue, business counts or even employment.
Although the studies discussed below expand the scope of the definition of small business to include
businesses with no paid employees, the self-employed and indeterminate businesses, there are very
few studies available that measure the contribution of small businesses to GDP. Due to the different
approaches to measuring GDP, estimates vary greatly.
The Government of British Columbia’s Statistical Service (BC Stats) measures the small business
contribution to GDP by province using the income-based approach of the System of National
Accounts. BC Stats defines small businesses as those with fewer than 50 employees, plus those
operated by the self-employed with no paid employees. The summary of BC Stats findings is
presented in Figure 7.1-1, which shows small businesses’ contribution to GDP (including public and
private sectors) for Canada and each province in 2014.
Based upon BC Stats data, in 2014 small businesses in British Columbia and Alberta contributed the
most to GDP at 33 percent and 32 percent respectively. This is above the national average of small
businesses contributing 30 percent to national GDP. Contributions from Saskatchewan and Quebec
are equal to the national average. The lowest contributions to GDP by small businesses came from
New Brunswick, and Newfoundland and Labrador (25 percent and 23 percent respectively).
22KEY SMALL BUSINESS STATISTICS — JUNE 2016
Figure 7.1-1: Small Businesses’ Contribution to GDP by Province, 2014
Note: In these data, small businesses are defined as businesses with fewer than 50 employees, plus those operated by the self-employed with no paid employees. Differences between these data and those published in previous versions of Key Small Business Statistics reflect changes to the underlying data upon which the numbers are based, as well as a refinement of the methodology used to generate the estimates.
Source: British Columbia’s Statistical Service, Small Business Profile, 2015.
0 5 10 15 20 25 30 35
Newfoundland and Labrador
Prince Edward Island
Nova Scotia
New Brunswick
Quebec
Ontario
Manitoba
Saskatchewan
Alberta
British Columbia
Canadian average
%
30
33
32
30
26
28
30
25
26
23
26
23 KEY SMALL BUSINESS STATISTICS — JUNE 2016
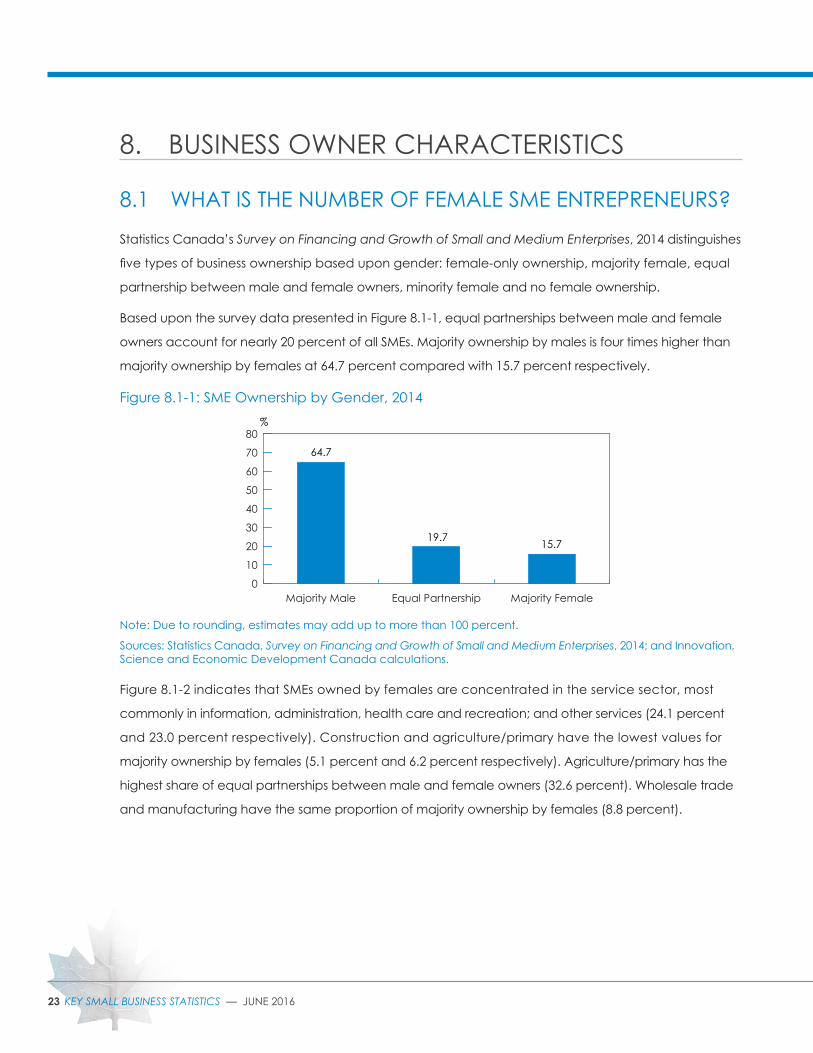
8. BUSINESS OWNER CHARACTERISTICS
8.1 WHAT IS THE NUMBER OF FEMALE SME ENTREPRENEURS?
Statistics Canada’s Survey on Financing and Growth of Small and Medium Enterprises, 2014 distinguishes
five types of business ownership based upon gender: female-only ownership, majority female, equal
partnership between male and female owners, minority female and no female ownership.
Based upon the survey data presented in Figure 8.1-1, equal partnerships between male and female
owners account for nearly 20 percent of all SMEs. Majority ownership by males is four times higher than
majority ownership by females at 64.7 percent compared with 15.7 percent respectively.
Figure 8.1-1: SME Ownership by Gender, 2014
Note: Due to rounding, estimates may add up to more than 100 percent.
Sources: Statistics Canada, Survey on Financing and Growth of Small and Medium Enterprises, 2014; and Innovation, Science and Economic Development Canada calculations.
Figure 8.1-2 indicates that SMEs owned by females are concentrated in the service sector, most
commonly in information, administration, health care and recreation; and other services (24.1 percent
and 23.0 percent respectively). Construction and agriculture/primary have the lowest values for
majority ownership by females (5.1 percent and 6.2 percent respectively). Agriculture/primary has the
highest share of equal partnerships between male and female owners (32.6 percent). Wholesale trade
and manufacturing have the same proportion of majority ownership by females (8.8 percent).
0
10
20
30
40
50
60
70
80
Majority FemaleEqual PartnershipMajority Male
%
64.7
19.7 15.7
24KEY SMALL BUSINESS STATISTICS — JUNE 2016
Figure 8.1-2: Business Ownership by Gender and Industries, 2014
Source: Statistics Canada, Survey on Financing and Growth of Small and Medium Enterprises, 2014.
0 10 20 30 40 50 60 70 80 90
Majority MaleEqual PartnershipMajority Female
Information, waste management,health care and recreation
Other services
Accommodation andfood services
Professional, scientific andtechnical services
Transportation andwarehousing
Retail trade
Wholesale trade
Manufacturing
Construction
Agriculture/Primary
%
61.3
6.2
5.1
32.6
16.978.0
8.820.1
71.28.8
17.373.9
22.122.7
8.0
26.2
24.1
23.0
14.8
20.7
59.7
55.2
15.871.2
52.5
21.4
16.8
69.4
17.4
59.1
25 KEY SMALL BUSINESS STATISTICS — JUNE 2016
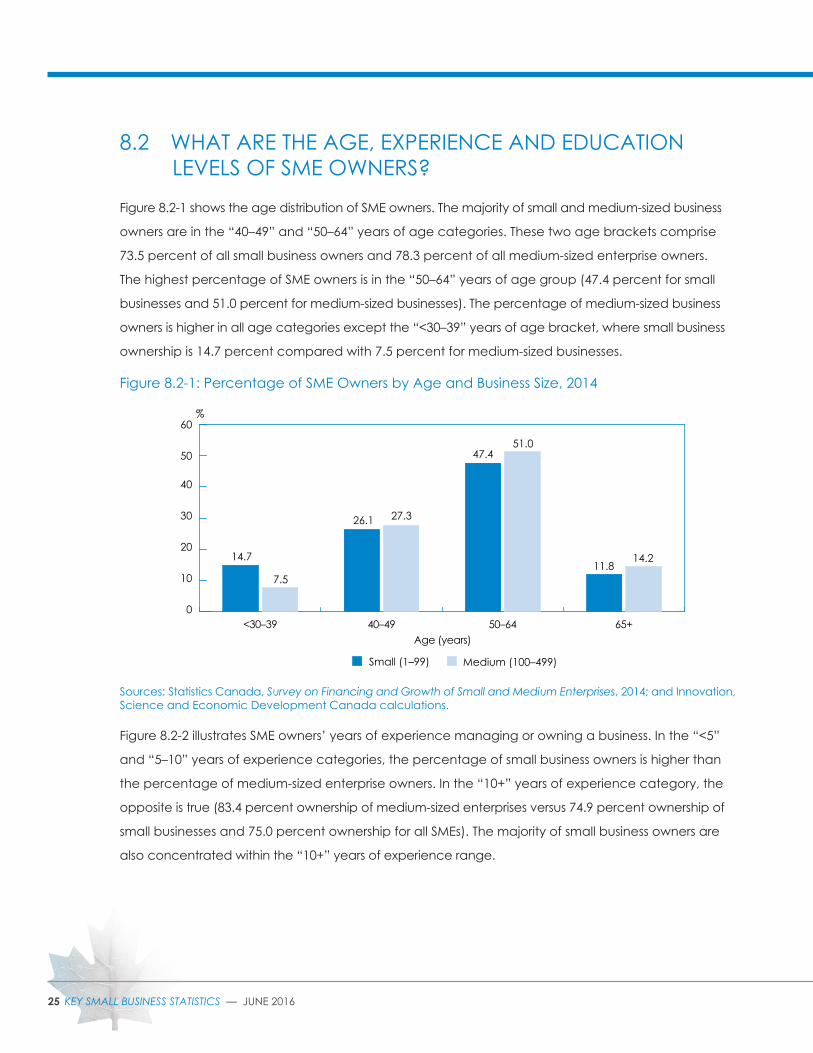
8.2 WHAT ARE THE AGE, EXPERIENCE AND EDUCATION LEVELS OF SME OWNERS?
Figure 8.2-1 shows the age distribution of SME owners. The majority of small and medium-sized business
owners are in the “40–49” and “50–64” years of age categories. These two age brackets comprise
73.5 percent of all small business owners and 78.3 percent of all medium-sized enterprise owners.
The highest percentage of SME owners is in the “50–64” years of age group (47.4 percent for small
businesses and 51.0 percent for medium-sized businesses). The percentage of medium-sized business
owners is higher in all age categories except the “<30–39” years of age bracket, where small business
ownership is 14.7 percent compared with 7.5 percent for medium-sized businesses.
Figure 8.2-1: Percentage of SME Owners by Age and Business Size, 2014
Sources: Statistics Canada, Survey on Financing and Growth of Small and Medium Enterprises, 2014; and Innovation, Science and Economic Development Canada calculations.
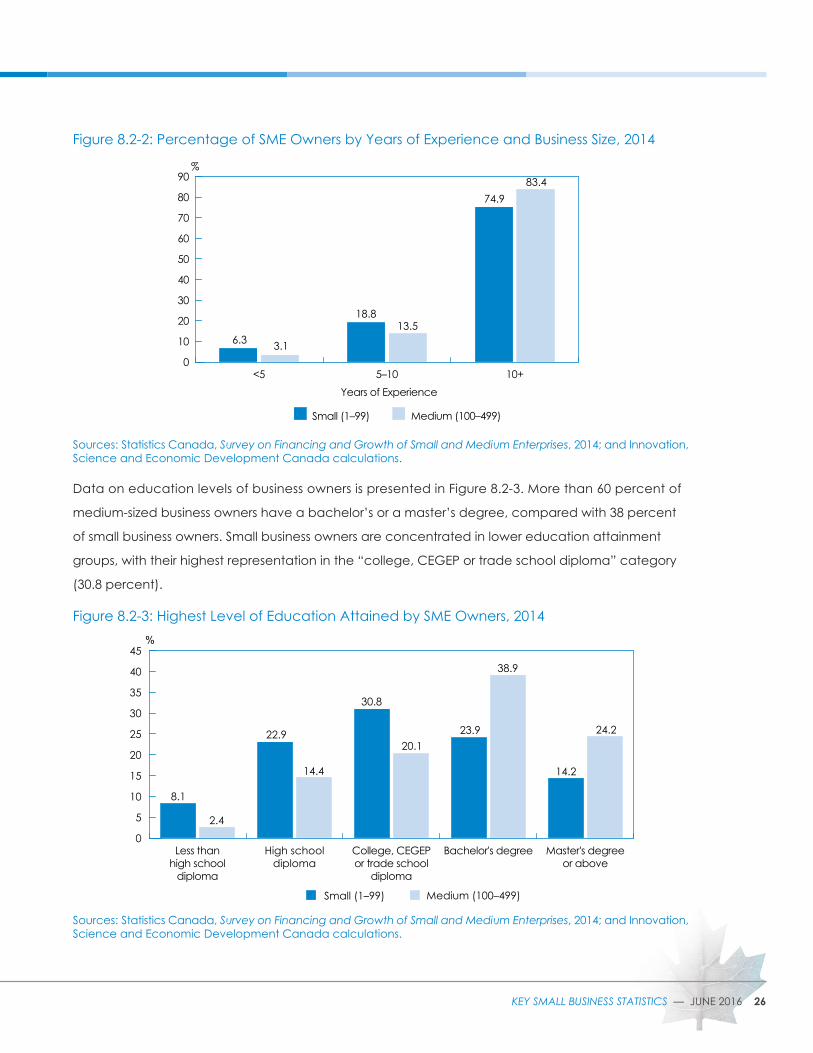
Figure 8.2-2 illustrates SME owners’ years of experience managing or owning a business. In the “<5”
and “5–10” years of experience categories, the percentage of small business owners is higher than
the percentage of medium-sized enterprise owners. In the “10+” years of experience category, the
opposite is true (83.4 percent ownership of medium-sized enterprises versus 74.9 percent ownership of
small businesses and 75.0 percent ownership for all SMEs). The majority of small business owners are
also concentrated within the “10+” years of experience range.
0
10
20
30
40
50
60
Medium (100–499)Small (1–99)
65+50–6440–49<30–39Age (years)
%
14.7
7.5
26.1 27.3
47.451.0
11.814.2
26KEY SMALL BUSINESS STATISTICS — JUNE 2016
Figure 8.2-2: Percentage of SME Owners by Years of Experience and Business Size, 2014
Sources: Statistics Canada, Survey on Financing and Growth of Small and Medium Enterprises, 2014; and Innovation, Science and Economic Development Canada calculations.
Data on education levels of business owners is presented in Figure 8.2-3. More than 60 percent of
medium-sized business owners have a bachelor’s or a master’s degree, compared with 38 percent
of small business owners. Small business owners are concentrated in lower education attainment
groups, with their highest representation in the “college, CEGEP or trade school diploma” category
(30.8 percent).
Figure 8.2-3: Highest Level of Education Attained by SME Owners, 2014
Sources: Statistics Canada, Survey on Financing and Growth of Small and Medium Enterprises, 2014; and Innovation, Science and Economic Development Canada calculations.
Years of Experience
0
10
20
30
40
50
60
70
80
90
Medium (100–499)Small (1–99)
10+5–10<5
%
6.3 3.1
18.813.5
74.983.4
0
5
10
15
20
25
30
35
40
45
Medium (100–499)Small (1–99)
Master's degreeor above
Bachelor's degreeCollege, CEGEPor trade school
diploma
High schooldiploma
Less thanhigh school
diploma
%
8.1
2.4
22.9
14.4
30.8
20.123.9
38.9
14.2
24.2

27 KEY SMALL BUSINESS STATISTICS — JUNE 2016
9. CONCLUDING REMARKSThis publication has summarized the main characteristics of SMEs in Canada, including the population
of SMEs, their distribution and their growth performance and details on the characteristics of business
owners. These metrics highlight the important role SMEs play in the national economy and provide
statistical information for researchers and analysts.