unduplicated counts of cases and recipients by county of
TRANSCRIPT
STATE FISCAL YEAR 2012(JULY 2011 - JUNE 2012)
TEMPORARY ASSISTANCE FOR NEEDY FAMILIES (TANF)
FOR
SUPPLEMENTAL NUTRITION ASSISTANCE PROGRAM (SNAP)
MEDICAID
OF CASES AND RECIPIENTS BY COUNTY OF PHYSICAL RESIDENCE
UNDUPLICATED COUNTS
Department Version
CHILD CARE ASSISTANCE PROGRAM (CCAP)
LOW INCOME HOME ENERGY ASSISTANCE PROGRAM (LIHEAP)

Preface 1
Unduplicated count of TANF cases and recipients 2Unduplicated count of TANF recipients by race 3Unduplicated count of TANF recipients, caretakers and all other recipients 4Unduplicated count of noncaretaker TANF recipients by age group 5Unduplicated count of TANF caretakers by age group 6Unduplicated count of TANF recipients by human service center region 7
Unduplicated count of SNAP cases and recipients 8Unduplicated count of SNAP recipients by race 9Unduplicated count of SNAP recipients by age group 10Unduplicated count of SNAP recipients by human service center region 11
Unduplicated count of Medicaid cases and recipients 12Unduplicated count of Medicaid recipients by race 13Unduplicated count of Medicaid recipients by age group 14Unduplicated count of Medicaid recipients by human service center region 15
Unduplicated count of LIHEAP cases and recipients 16Unduplicated count of LIHEAP recipients by race 17Unduplicated count of LIHEAP recipients by human service center region 18
Unduplicated count of CCAP cases and recipients 19Unduplicated count of CCAP recipients by race 20Unduplicated count of CCAP recipients by age group 21Unduplicated count of CCAP recipients by human service center region 22
APPENDIX A: Caseload Trends (SFY98 - SFY12) 23 - 27APPENDIX B: Recipient Trends (SFY98 - SFY12) 28 - 32APPENDIX C: Unduplicated count of combined TANF/SNAP/Medicaid recipients by county/region 33 - 35
NOTE: The information in this report is as accurate as the data collected in the economic assistance data systems.
TABLE OF CONTENTS
I. TEMPORARY ASSISTANCE FOR NEEDY FAMILIES (TANF)
II. SUPPLEMENTAL NUTRITION ASSISTANCE PROGRAM (SNAP)
III. MEDICAID
IV. LOW INCOME HOME ENERGY ASSISTANCE PROGRAM (LIHEAP)
V. CHILD CARE ASSISTANCE PROGRAM (CCAP)
1
PREFACE
Temporary Assistance for Needy Families (TANF) "represents one of society's more important efforts to assure that financial inability to meet a child's needs shall not force a parent to surrender the satisfaction and responsibility for bringing up the child. …the two fold purpose of TANF is to (1) make it possible for the child to remain in or return to the custody and care of his parents or relatives, … and (2) make it possible for the child's unmet economic needs to be met." This is attempted by "…addressing the economic problems and barriers to self sufficiency that confront today's low income families" (DHS Manual, Chapters 400-10 & 400-17-01).
The Supplemental Nutrition Assistance Program (SNAP) is a uniform nationwide program intended to promote the general welfare and safeguard the health and well-being of the nation's population by raising the levels of nutrition among low-income households. SNAP is administered at the county level by County Social Service Boards in accordance with federal law, federal regulations and instructions prescribed by the U.S. Department of Agriculture's Food and Consumer Service" (DHS Manual, Chapter 430-01-05).
Kim WeisResearch Analyst
The Medicaid Program strengthens and extends the provision of medical care and services to certain groups of people whose resources are insufficient to meet such costs. The Medicaid Program provides an effective base upon which to provide comprehensive and uniform medical services that will enable persons limited by their circumstances to receive needed medical care. Medicaid participates with the medical community in attempting to strengthen existing medical services in the state (DHS Manual, Chapters 510-05-07-05 and 510-05-07-10).
The purpose of the Low Income Home Energy Assistance Program (LIHEAP) is to provide assistance to eligible households to offset the rising costs of home energy that are excessive in relation to household income. Therefore, the benefits provided by North Dakota LIHEAP are not designed to pay the eligible household's total fuel costs, but rather to protect the household against the rising costs of fuel (DHS Manual, Chapter 415-05-10).
The purpose of the Child Care Assistance Program (CCAP) is to increase the availability, affordability, and quality of child care services. The program offers federal funding to states, territories, Indian tribes, and tribal organizations in order to provide low-income families with the financial resources to find and afford quality child care for their children (DHS Manual, Chapter 400-26).
North Dakota Department of Human Services
Phone: (701) 328-8921
Contact Information:Kim Weis
Email: [email protected]
TEMPORARY ASSISTANCE FOR
TANF
NEEDY FAMILIES (TANF)
Note: Unduplicated count refers to cases or persons (recipients) counted once during the fiscal year regardless of the number of months during the year they received TANF benefits. If a recipient lived in more than one county within the year and received TANF benefits in those counties, that person was counted as a resident only for the county that authorized that family's last benefit payment during the year.
NUMBER OF CASES
PERCENT OF TOTAL CASES
NUMBER OF RECIPIENTS
PERCENT OF TOTAL
RECIPIENTS
PERCENT OF COUNTY
POPULATION RECEIVING
2011 COUNTY POPULATION ESTIMATE *
COUNTY POPULATION AS A PERCENT OF
STATE POPULATION
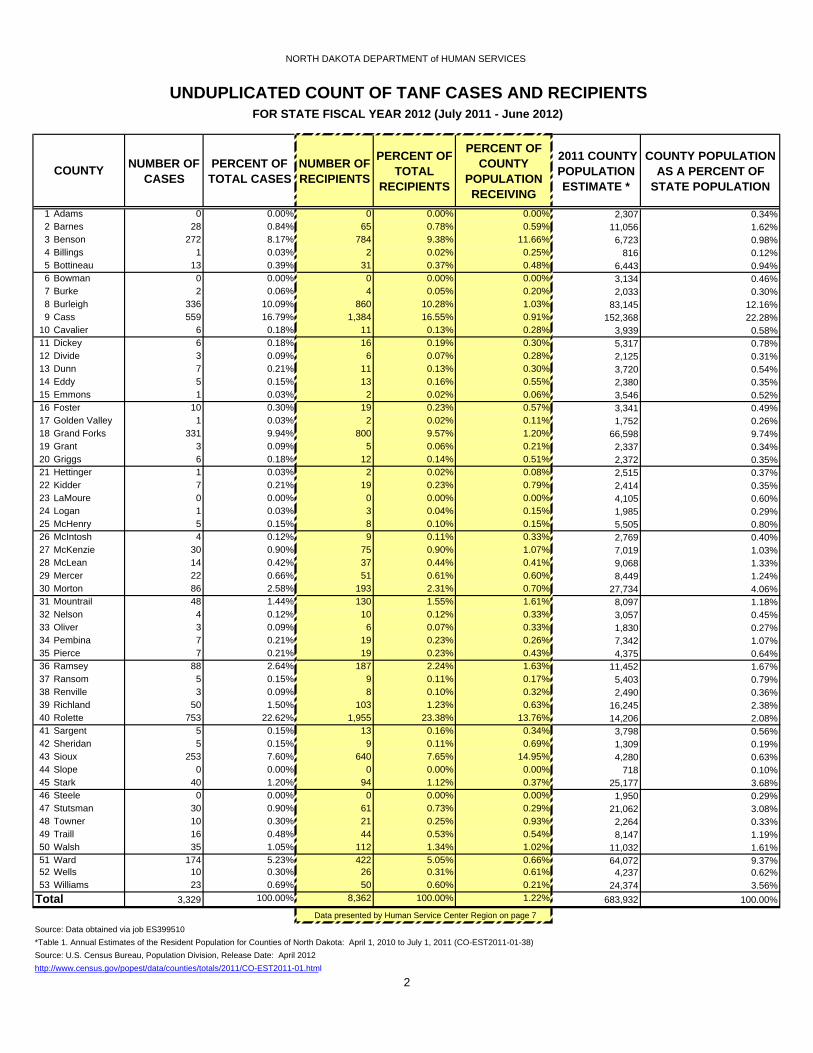
1 Adams 0 0.00% 0 0.00% 0.00% 2,307 0.34%2 Barnes 28 0.84% 65 0.78% 0.59% 11,056 1.62%3 Benson 272 8.17% 784 9.38% 11.66% 6,723 0.98%4 Billings 1 0.03% 2 0.02% 0.25% 816 0.12%5 Bottineau 13 0.39% 31 0.37% 0.48% 6,443 0.94%6 Bowman 0 0.00% 0 0.00% 0.00% 3,134 0.46%7 Burke 2 0.06% 4 0.05% 0.20% 2,033 0.30%8 Burleigh 336 10.09% 860 10.28% 1.03% 83,145 12.16%9 Cass 559 16.79% 1,384 16.55% 0.91% 152,368 22.28%
10 Cavalier 6 0.18% 11 0.13% 0.28% 3,939 0.58%11 Dickey 6 0.18% 16 0.19% 0.30% 5,317 0.78%12 Divide 3 0.09% 6 0.07% 0.28% 2,125 0.31%13 Dunn 7 0.21% 11 0.13% 0.30% 3,720 0.54%14 Eddy 5 0.15% 13 0.16% 0.55% 2,380 0.35%15 Emmons 1 0.03% 2 0.02% 0.06% 3,546 0.52%16 Foster 10 0.30% 19 0.23% 0.57% 3,341 0.49%17 Golden Valley 1 0.03% 2 0.02% 0.11% 1,752 0.26%18 Grand Forks 331 9.94% 800 9.57% 1.20% 66,598 9.74%19 Grant 3 0.09% 5 0.06% 0.21% 2,337 0.34%20 Griggs 6 0.18% 12 0.14% 0.51% 2,372 0.35%21 Hettinger 1 0.03% 2 0.02% 0.08% 2,515 0.37%22 Kidder 7 0.21% 19 0.23% 0.79% 2,414 0.35%23 LaMoure 0 0.00% 0 0.00% 0.00% 4,105 0.60%24 Logan 1 0.03% 3 0.04% 0.15% 1,985 0.29%25 McHenry 5 0.15% 8 0.10% 0.15% 5,505 0.80%26 McIntosh 4 0.12% 9 0.11% 0.33% 2,769 0.40%27 McKenzie 30 0.90% 75 0.90% 1.07% 7,019 1.03%28 McLean 14 0.42% 37 0.44% 0.41% 9,068 1.33%29 Mercer 22 0.66% 51 0.61% 0.60% 8,449 1.24%30 Morton 86 2.58% 193 2.31% 0.70% 27,734 4.06%31 Mountrail 48 1.44% 130 1.55% 1.61% 8,097 1.18%32 Nelson 4 0.12% 10 0.12% 0.33% 3,057 0.45%33 Oliver 3 0.09% 6 0.07% 0.33% 1,830 0.27%34 Pembina 7 0.21% 19 0.23% 0.26% 7,342 1.07%35 Pierce 7 0.21% 19 0.23% 0.43% 4,375 0.64%36 Ramsey 88 2.64% 187 2.24% 1.63% 11,452 1.67%37 Ransom 5 0.15% 9 0.11% 0.17% 5,403 0.79%38 Renville 3 0.09% 8 0.10% 0.32% 2,490 0.36%39 Richland 50 1.50% 103 1.23% 0.63% 16,245 2.38%40 Rolette 753 22.62% 1,955 23.38% 13.76% 14,206 2.08%41 Sargent 5 0.15% 13 0.16% 0.34% 3,798 0.56%42 Sheridan 5 0.15% 9 0.11% 0.69% 1,309 0.19%43 Sioux 253 7.60% 640 7.65% 14.95% 4,280 0.63%44 Slope 0 0.00% 0 0.00% 0.00% 718 0.10%45 Stark 40 1.20% 94 1.12% 0.37% 25,177 3.68%46 Steele 0 0.00% 0 0.00% 0.00% 1,950 0.29%47 Stutsman 30 0.90% 61 0.73% 0.29% 21,062 3.08%48 Towner 10 0.30% 21 0.25% 0.93% 2,264 0.33%49 Traill 16 0.48% 44 0.53% 0.54% 8,147 1.19%50 Walsh 35 1.05% 112 1.34% 1.02% 11,032 1.61%51 Ward 174 5.23% 422 5.05% 0.66% 64,072 9.37%52 Wells 10 0.30% 26 0.31% 0.61% 4,237 0.62%53 Williams 23 0.69% 50 0.60% 0.21% 24,374 3.56%
3,329 100.00% 8,362 100.00% 1.22% 683,932 100.00%
Source: Data obtained via job ES399510*Table 1. Annual Estimates of the Resident Population for Counties of North Dakota: April 1, 2010 to July 1, 2011 (CO-EST2011-01-38)Source: U.S. Census Bureau, Population Division, Release Date: April 2012
2
NORTH DAKOTA DEPARTMENT of HUMAN SERVICES
TotalData presented by Human Service Center Region on page 7
UNDUPLICATED COUNT OF TANF CASES AND RECIPIENTSFOR STATE FISCAL YEAR 2012 (July 2011 - June 2012)
COUNTY
http://www.census.gov/popest/data/counties/totals/2011/CO-EST2011-01.html
AMERICAN INDIAN
ASIAN/ PACIFIC
ISLANDERBLACK CAUCASIAN OTHER NOT
IDENTIFIED
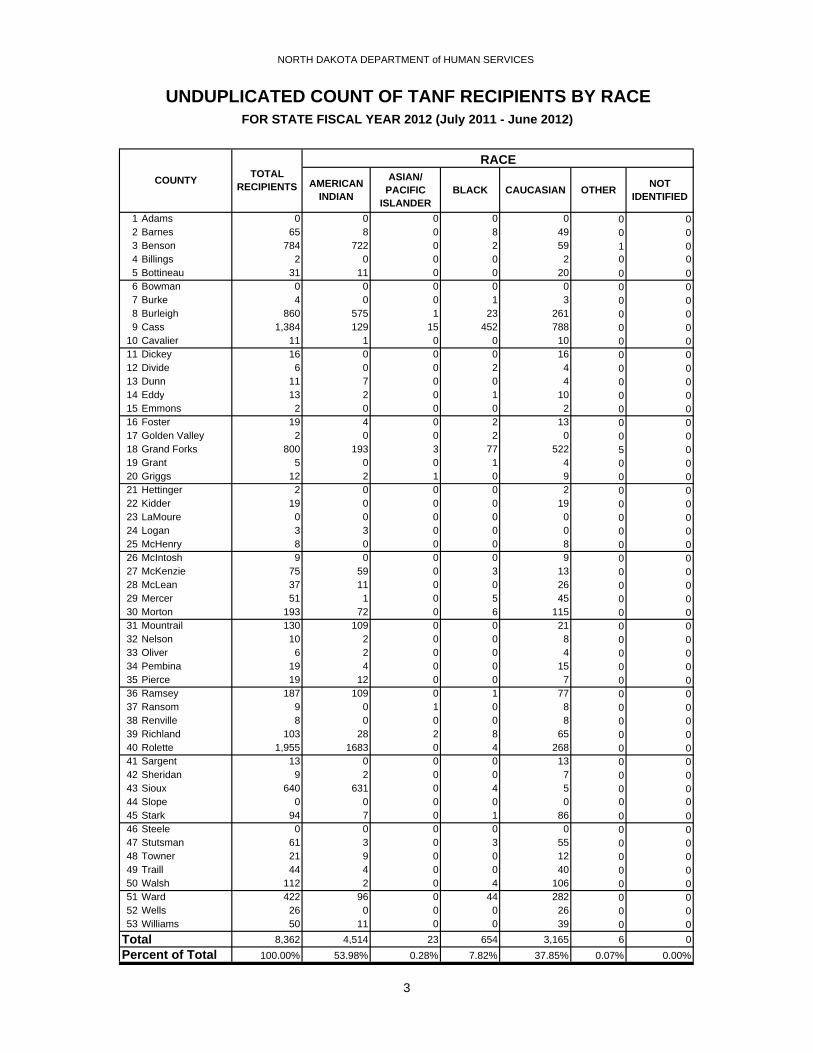
1 Adams 0 0 0 0 0 0 02 Barnes 65 8 0 8 49 0 03 Benson 784 722 0 2 59 1 04 Billings 2 0 0 0 2 0 05 Bottineau 31 11 0 0 20 0 06 Bowman 0 0 0 0 0 0 07 Burke 4 0 0 1 3 0 08 Burleigh 860 575 1 23 261 0 09 Cass 1,384 129 15 452 788 0 0
10 Cavalier 11 1 0 0 10 0 011 Dickey 16 0 0 0 16 0 012 Divide 6 0 0 2 4 0 013 Dunn 11 7 0 0 4 0 014 Eddy 13 2 0 1 10 0 015 Emmons 2 0 0 0 2 0 016 Foster 19 4 0 2 13 0 017 Golden Valley 2 0 0 2 0 0 018 Grand Forks 800 193 3 77 522 5 019 Grant 5 0 0 1 4 0 020 Griggs 12 2 1 0 9 0 021 Hettinger 2 0 0 0 2 0 022 Kidder 19 0 0 0 19 0 023 LaMoure 0 0 0 0 0 0 024 Logan 3 3 0 0 0 0 025 McHenry 8 0 0 0 8 0 026 McIntosh 9 0 0 0 9 0 027 McKenzie 75 59 0 3 13 0 028 McLean 37 11 0 0 26 0 029 Mercer 51 1 0 5 45 0 030 Morton 193 72 0 6 115 0 031 Mountrail 130 109 0 0 21 0 032 Nelson 10 2 0 0 8 0 033 Oliver 6 2 0 0 4 0 034 Pembina 19 4 0 0 15 0 035 Pierce 19 12 0 0 7 0 036 Ramsey 187 109 0 1 77 0 037 Ransom 9 0 1 0 8 0 038 Renville 8 0 0 0 8 0 039 Richland 103 28 2 8 65 0 040 Rolette 1,955 1683 0 4 268 0 041 Sargent 13 0 0 0 13 0 042 Sheridan 9 2 0 0 7 0 043 Sioux 640 631 0 4 5 0 044 Slope 0 0 0 0 0 0 045 Stark 94 7 0 1 86 0 046 Steele 0 0 0 0 0 0 047 Stutsman 61 3 0 3 55 0 048 Towner 21 9 0 0 12 0 049 Traill 44 4 0 0 40 0 050 Walsh 112 2 0 4 106 0 051 Ward 422 96 0 44 282 0 052 Wells 26 0 0 0 26 0 053 Williams 50 11 0 0 39 0 0
8,362 4,514 23 654 3,165 6 0100.00% 53.98% 0.28% 7.82% 37.85% 0.07% 0.00%
NORTH DAKOTA DEPARTMENT of HUMAN SERVICES
UNDUPLICATED COUNT OF TANF RECIPIENTS BY RACEFOR STATE FISCAL YEAR 2012 (July 2011 - June 2012)
3
RACE
Percent of TotalTotal
TOTAL RECIPIENTSCOUNTY

TOTAL NUMBER OF RECIPIENTS
NUMBER OF CARETAKERS ALL OTHER RECIPIENTS
AVERAGE NUMBER OF RECIPIENTS PER
CARETAKER
1 Adams 0 0 0 **2 Barnes 65 16 49 3.13 Benson 784 162 622 3.84 Billings 2 1 1 1.05 Bottineau 31 7 24 3.46 Bowman 0 0 0 **7 Burke 4 0 4 **8 Burleigh 860 250 610 2.49 Cass 1,384 378 1,006 2.7
10 Cavalier 11 2 9 4.511 Dickey 16 4 12 3.012 Divide 6 1 5 5.013 Dunn 11 3 8 2.714 Eddy 13 3 10 3.315 Emmons 2 1 1 1.016 Foster 19 7 12 1.717 Golden Valley 2 0 2 **18 Grand Forks 800 235 565 2.419 Grant 5 1 4 4.020 Griggs 12 5 7 1.421 Hettinger 2 1 1 1.022 Kidder 19 5 14 2.823 LaMoure 0 0 0 **24 Logan 3 0 3 **25 McHenry 8 2 6 3.026 McIntosh 9 3 6 2.027 McKenzie 75 15 60 4.028 McLean 37 9 28 3.129 Mercer 51 14 37 2.630 Morton 193 51 142 2.831 Mountrail 130 25 105 4.232 Nelson 10 3 7 2.333 Oliver 6 1 5 5.034 Pembina 19 3 16 5.335 Pierce 19 5 14 2.836 Ramsey 187 49 138 2.837 Ransom 9 2 7 3.538 Renville 8 2 6 3.039 Richland 103 17 86 5.140 Rolette 1,955 541 1,414 2.641 Sargent 13 4 9 2.342 Sheridan 9 2 7 3.543 Sioux 640 129 511 4.044 Slope 0 0 0 **45 Stark 94 26 68 2.646 Steele 0 0 0 **47 Stutsman 61 18 43 2.448 Towner 21 7 14 2.049 Traill 44 15 29 1.950 Walsh 112 30 82 2.751 Ward 422 137 285 2.152 Wells 26 7 19 2.753 Williams 50 8 42 5.3
8,362 2,207 6,155 2.8100.00% 26.39% 73.61%
4
Percent of Total
COUNTY
Total
NORTH DAKOTA DEPARTMENT of HUMAN SERVICES
UNDUPLICATED COUNT OF TANF RECIPIENTS:NUMBER OF CARETAKERS AND ALL OTHER RECIPIENTS
FOR STATE FISCAL YEAR 2012 (July 2011 - June 2012)
0-5 YEARS
6-15 YEARS
16-17 YEARS
18-19 YEARS
20-44 YEARS
45-64 YEARS
65+ YEARS
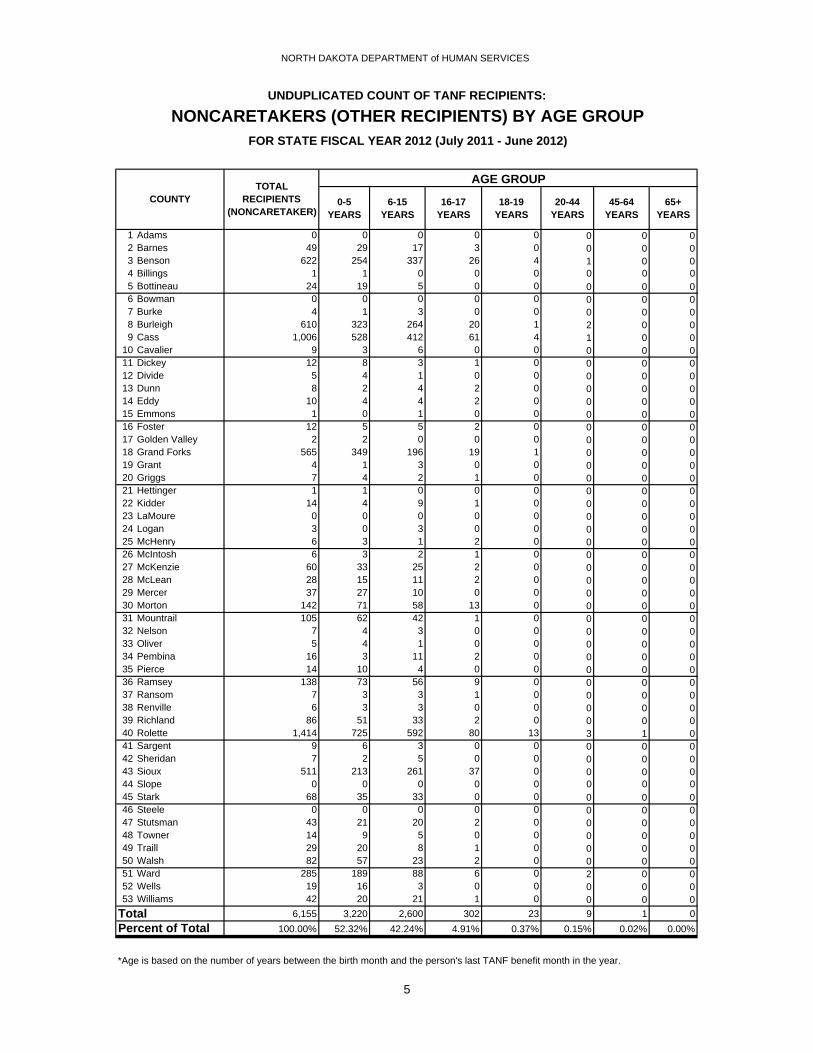
1 Adams 0 0 0 0 0 0 0 02 Barnes 49 29 17 3 0 0 0 03 Benson 622 254 337 26 4 1 0 04 Billings 1 1 0 0 0 0 0 05 Bottineau 24 19 5 0 0 0 0 06 Bowman 0 0 0 0 0 0 0 07 Burke 4 1 3 0 0 0 0 08 Burleigh 610 323 264 20 1 2 0 09 Cass 1,006 528 412 61 4 1 0 0
10 Cavalier 9 3 6 0 0 0 0 011 Dickey 12 8 3 1 0 0 0 012 Divide 5 4 1 0 0 0 0 013 Dunn 8 2 4 2 0 0 0 014 Eddy 10 4 4 2 0 0 0 015 Emmons 1 0 1 0 0 0 0 016 Foster 12 5 5 2 0 0 0 017 Golden Valley 2 2 0 0 0 0 0 018 Grand Forks 565 349 196 19 1 0 0 019 Grant 4 1 3 0 0 0 0 020 Griggs 7 4 2 1 0 0 0 021 Hettinger 1 1 0 0 0 0 0 022 Kidder 14 4 9 1 0 0 0 023 LaMoure 0 0 0 0 0 0 0 024 Logan 3 0 3 0 0 0 0 025 McHenry 6 3 1 2 0 0 0 026 McIntosh 6 3 2 1 0 0 0 027 McKenzie 60 33 25 2 0 0 0 028 McLean 28 15 11 2 0 0 0 029 Mercer 37 27 10 0 0 0 0 030 Morton 142 71 58 13 0 0 0 031 Mountrail 105 62 42 1 0 0 0 032 Nelson 7 4 3 0 0 0 0 033 Oliver 5 4 1 0 0 0 0 034 Pembina 16 3 11 2 0 0 0 035 Pierce 14 10 4 0 0 0 0 036 Ramsey 138 73 56 9 0 0 0 037 Ransom 7 3 3 1 0 0 0 038 Renville 6 3 3 0 0 0 0 039 Richland 86 51 33 2 0 0 0 040 Rolette 1,414 725 592 80 13 3 1 041 Sargent 9 6 3 0 0 0 0 042 Sheridan 7 2 5 0 0 0 0 043 Sioux 511 213 261 37 0 0 0 044 Slope 0 0 0 0 0 0 0 045 Stark 68 35 33 0 0 0 0 046 Steele 0 0 0 0 0 0 0 047 Stutsman 43 21 20 2 0 0 0 048 Towner 14 9 5 0 0 0 0 049 Traill 29 20 8 1 0 0 0 050 Walsh 82 57 23 2 0 0 0 051 Ward 285 189 88 6 0 2 0 052 Wells 19 16 3 0 0 0 0 053 Williams 42 20 21 1 0 0 0 0
6,155 3,220 2,600 302 23 9 1 0100.00% 52.32% 42.24% 4.91% 0.37% 0.15% 0.02% 0.00%
*Age is based on the number of years between the birth month and the person's last TANF benefit month in the year.
5
TotalPercent of Total
FOR STATE FISCAL YEAR 2012 (July 2011 - June 2012)
NORTH DAKOTA DEPARTMENT of HUMAN SERVICES
UNDUPLICATED COUNT OF TANF RECIPIENTS:
NONCARETAKERS (OTHER RECIPIENTS) BY AGE GROUP
COUNTYTOTAL
RECIPIENTS (NONCARETAKER)
AGE GROUP

6-15 YEARS 16-17 YEARS 18-19 YEARS 20-44 YEARS 45-64 YEARS 65+ YEARS
1 Adams 0 0 0 0 0 0 02 Barnes 16 0 0 0 16 0 03 Benson 162 0 0 3 148 11 04 Billings 1 0 0 1 0 0 05 Bottineau 7 0 0 0 7 0 06 Bowman 0 0 0 0 0 0 07 Burke 0 0 0 0 0 0 08 Burleigh 250 0 1 11 228 10 09 Cass 378 0 2 13 339 23 1
10 Cavalier 2 0 0 0 1 1 011 Dickey 4 0 0 0 4 0 012 Divide 1 0 0 0 1 0 013 Dunn 3 0 0 0 3 0 014 Eddy 3 0 0 0 3 0 015 Emmons 1 0 0 0 1 0 016 Foster 7 0 0 0 7 0 017 Golden Valley 0 0 0 0 0 0 018 Grand Forks 235 0 0 8 222 5 019 Grant 1 0 0 0 1 0 020 Griggs 5 0 0 1 3 1 021 Hettinger 1 0 0 1 0 0 022 Kidder 5 0 0 0 4 1 023 LaMoure 0 0 0 0 0 0 024 Logan 0 0 0 0 0 0 025 McHenry 2 0 0 0 2 0 026 McIntosh 3 0 0 1 1 1 027 McKenzie 15 0 0 3 12 0 028 McLean 9 0 0 0 9 0 029 Mercer 14 0 0 0 14 0 030 Morton 51 0 0 0 49 2 031 Mountrail 25 0 0 5 16 4 032 Nelson 3 0 0 0 3 0 033 Oliver 1 0 0 0 1 0 034 Pembina 3 0 0 0 3 0 035 Pierce 5 0 0 1 4 0 036 Ramsey 49 0 0 8 38 3 037 Ransom 2 0 0 0 2 0 038 Renville 2 0 0 0 2 0 039 Richland 17 0 0 1 14 2 040 Rolette 541 0 1 37 482 21 041 Sargent 4 0 0 0 4 0 042 Sheridan 2 0 0 0 2 0 043 Sioux 129 0 0 3 118 8 044 Slope 0 0 0 0 0 0 045 Stark 26 0 0 0 25 1 046 Steele 0 0 0 0 0 0 047 Stutsman 18 0 0 1 16 1 048 Towner 7 0 0 0 7 0 049 Traill 15 0 0 0 15 0 050 Walsh 30 0 0 3 27 0 051 Ward 137 0 2 16 116 3 052 Wells 7 0 0 0 6 1 053 Williams 8 0 0 0 7 1 0
2,207 0 6 117 1,983 100 1100.00% 0.00% 0.27% 5.30% 89.85% 4.53% 0.05%
*Age is based on the number of years between the birth month and the person's last TANF benefit month in the year.
NORTH DAKOTA DEPARTMENT of HUMAN SERVICES
UNDUPLICATED COUNT OF TANF RECIPIENTS:
CARETAKERS BY AGE GROUPFOR STATE FISCAL YEAR 2012 (July 2011 - June 2012)
6
Percent of Total
COUNTYTOTAL
RECIPIENTS (CARETAKERS)
Total
AGE GROUP
NUMBER OF RECIPIENTS
PERCENT OF TOTAL RECIPIENTS
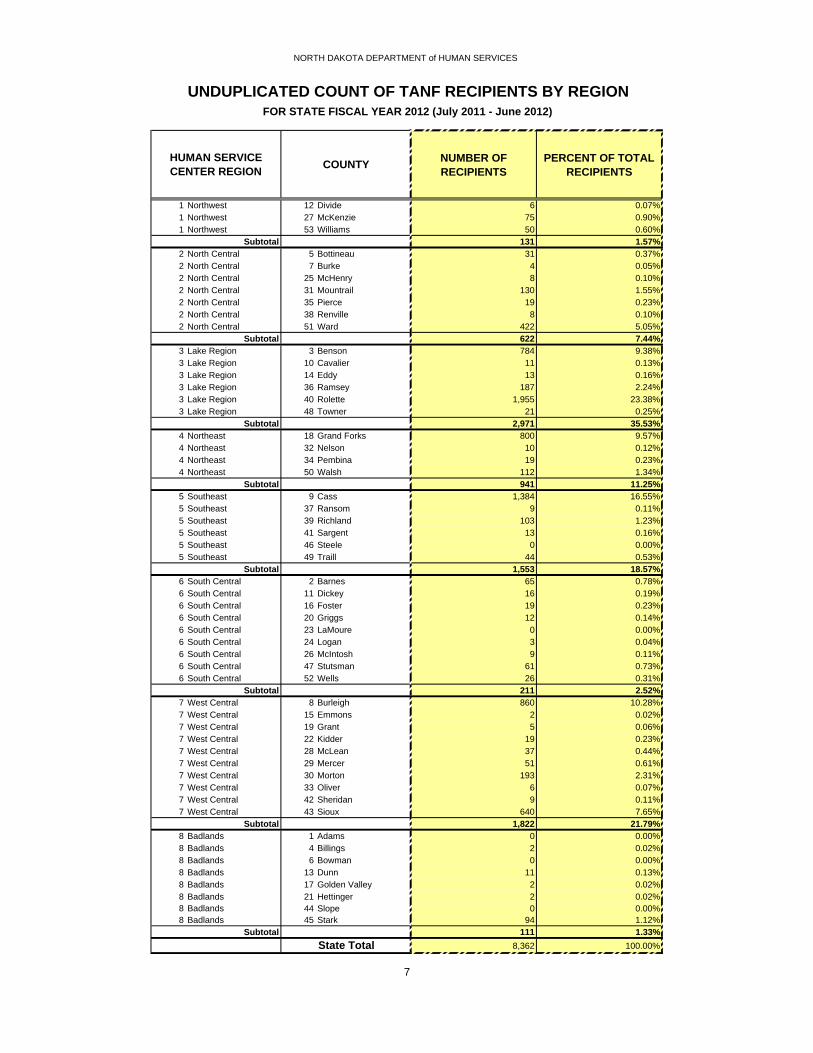
1 Northwest 12 Divide 6 0.07%1 Northwest 27 McKenzie 75 0.90%1 Northwest 53 Williams 50 0.60%
Subtotal 131 1.57%2 North Central 5 Bottineau 31 0.37%2 North Central 7 Burke 4 0.05%2 North Central 25 McHenry 8 0.10%2 North Central 31 Mountrail 130 1.55%2 North Central 35 Pierce 19 0.23%2 North Central 38 Renville 8 0.10%2 North Central 51 Ward 422 5.05%
Subtotal 622 7.44%3 Lake Region 3 Benson 784 9.38%3 Lake Region 10 Cavalier 11 0.13%3 Lake Region 14 Eddy 13 0.16%3 Lake Region 36 Ramsey 187 2.24%3 Lake Region 40 Rolette 1,955 23.38%3 Lake Region 48 Towner 21 0.25%
Subtotal 2,971 35.53%4 Northeast 18 Grand Forks 800 9.57%4 Northeast 32 Nelson 10 0.12%4 Northeast 34 Pembina 19 0.23%4 Northeast 50 Walsh 112 1.34%
Subtotal 941 11.25%5 Southeast 9 Cass 1,384 16.55%5 Southeast 37 Ransom 9 0.11%5 Southeast 39 Richland 103 1.23%5 Southeast 41 Sargent 13 0.16%5 Southeast 46 Steele 0 0.00%5 Southeast 49 Traill 44 0.53%
Subtotal 1,553 18.57%6 South Central 2 Barnes 65 0.78%6 South Central 11 Dickey 16 0.19%6 South Central 16 Foster 19 0.23%6 South Central 20 Griggs 12 0.14%6 South Central 23 LaMoure 0 0.00%6 South Central 24 Logan 3 0.04%6 South Central 26 McIntosh 9 0.11%6 South Central 47 Stutsman 61 0.73%6 South Central 52 Wells 26 0.31%
Subtotal 211 2.52%7 West Central 8 Burleigh 860 10.28%7 West Central 15 Emmons 2 0.02%7 West Central 19 Grant 5 0.06%7 West Central 22 Kidder 19 0.23%7 West Central 28 McLean 37 0.44%7 West Central 29 Mercer 51 0.61%7 West Central 30 Morton 193 2.31%7 West Central 33 Oliver 6 0.07%7 West Central 42 Sheridan 9 0.11%7 West Central 43 Sioux 640 7.65%
Subtotal 1,822 21.79%8 Badlands 1 Adams 0 0.00%8 Badlands 4 Billings 2 0.02%8 Badlands 6 Bowman 0 0.00%8 Badlands 13 Dunn 11 0.13%8 Badlands 17 Golden Valley 2 0.02%8 Badlands 21 Hettinger 2 0.02%8 Badlands 44 Slope 0 0.00%8 Badlands 45 Stark 94 1.12%
Subtotal 111 1.33%8,362 100.00%State Total
7
NORTH DAKOTA DEPARTMENT of HUMAN SERVICES
UNDUPLICATED COUNT OF TANF RECIPIENTS BY REGIONFOR STATE FISCAL YEAR 2012 (July 2011 - June 2012)
HUMAN SERVICE CENTER REGION COUNTY
SNAP
SUPPLEMENTAL NUTRITION ASSISTANCE PROGRAM (SNAP)
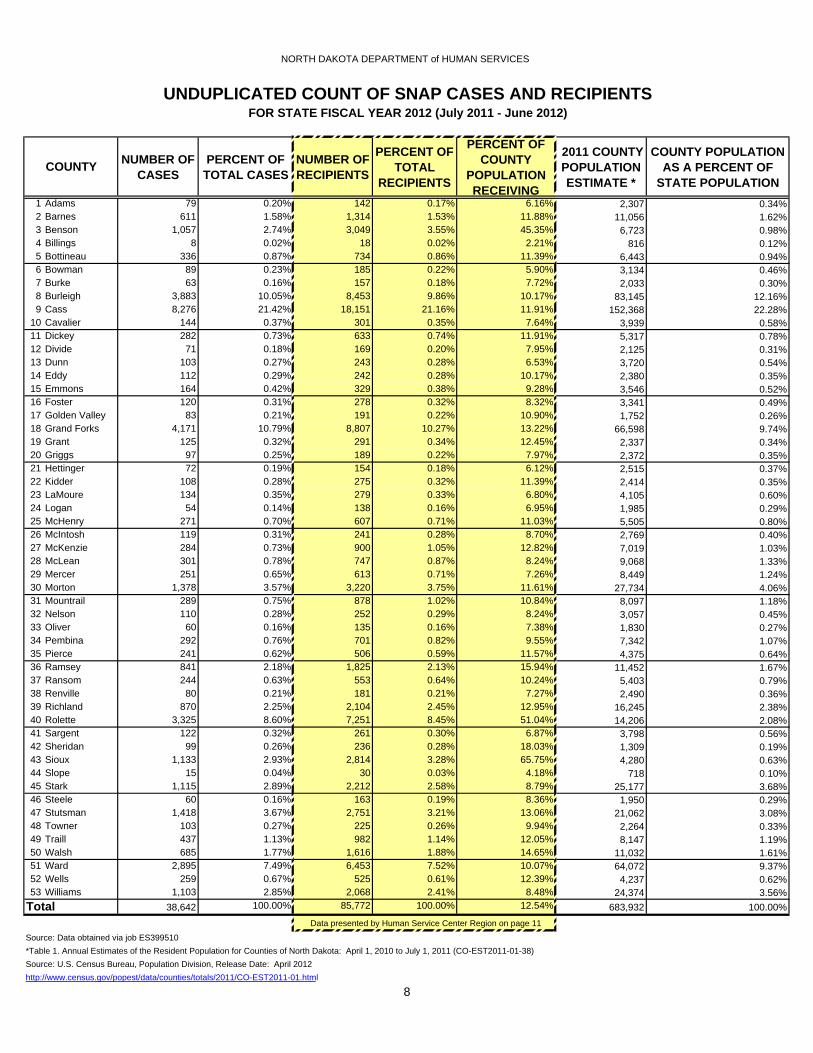
Note: Unduplicated count refers to cases or persons (recipients) counted once during the fiscal year regardless of the number of months during the year they received SNAP benefits. If a recipient (or case) lived in different counties within the year and received SNAP benefits in those counties, that person was counted as a resident only for the county that authorized their last benefit payment during the year.
NUMBER OF CASES
PERCENT OF TOTAL CASES
NUMBER OF RECIPIENTS
PERCENT OF TOTAL
RECIPIENTS
PERCENT OF COUNTY
POPULATION RECEIVING
2011 COUNTY POPULATION ESTIMATE *
COUNTY POPULATION AS A PERCENT OF
STATE POPULATION1 Adams 79 0.20% 142 0.17% 6.16% 2,307 0.34%2 Barnes 611 1.58% 1,314 1.53% 11.88% 11,056 1.62%3 Benson 1,057 2.74% 3,049 3.55% 45.35% 6,723 0.98%4 Billings 8 0.02% 18 0.02% 2.21% 816 0.12%5 Bottineau 336 0.87% 734 0.86% 11.39% 6,443 0.94%6 Bowman 89 0.23% 185 0.22% 5.90% 3,134 0.46%7 Burke 63 0.16% 157 0.18% 7.72% 2,033 0.30%8 Burleigh 3,883 10.05% 8,453 9.86% 10.17% 83,145 12.16%9 Cass 8,276 21.42% 18,151 21.16% 11.91% 152,368 22.28%
10 Cavalier 144 0.37% 301 0.35% 7.64% 3,939 0.58%11 Dickey 282 0.73% 633 0.74% 11.91% 5,317 0.78%12 Divide 71 0.18% 169 0.20% 7.95% 2,125 0.31%13 Dunn 103 0.27% 243 0.28% 6.53% 3,720 0.54%14 Eddy 112 0.29% 242 0.28% 10.17% 2,380 0.35%15 Emmons 164 0.42% 329 0.38% 9.28% 3,546 0.52%16 Foster 120 0.31% 278 0.32% 8.32% 3,341 0.49%17 Golden Valley 83 0.21% 191 0.22% 10.90% 1,752 0.26%18 Grand Forks 4,171 10.79% 8,807 10.27% 13.22% 66,598 9.74%19 Grant 125 0.32% 291 0.34% 12.45% 2,337 0.34%20 Griggs 97 0.25% 189 0.22% 7.97% 2,372 0.35%21 Hettinger 72 0.19% 154 0.18% 6.12% 2,515 0.37%22 Kidder 108 0.28% 275 0.32% 11.39% 2,414 0.35%23 LaMoure 134 0.35% 279 0.33% 6.80% 4,105 0.60%24 Logan 54 0.14% 138 0.16% 6.95% 1,985 0.29%25 McHenry 271 0.70% 607 0.71% 11.03% 5,505 0.80%26 McIntosh 119 0.31% 241 0.28% 8.70% 2,769 0.40%27 McKenzie 284 0.73% 900 1.05% 12.82% 7,019 1.03%28 McLean 301 0.78% 747 0.87% 8.24% 9,068 1.33%29 Mercer 251 0.65% 613 0.71% 7.26% 8,449 1.24%30 Morton 1,378 3.57% 3,220 3.75% 11.61% 27,734 4.06%31 Mountrail 289 0.75% 878 1.02% 10.84% 8,097 1.18%32 Nelson 110 0.28% 252 0.29% 8.24% 3,057 0.45%33 Oliver 60 0.16% 135 0.16% 7.38% 1,830 0.27%34 Pembina 292 0.76% 701 0.82% 9.55% 7,342 1.07%35 Pierce 241 0.62% 506 0.59% 11.57% 4,375 0.64%36 Ramsey 841 2.18% 1,825 2.13% 15.94% 11,452 1.67%37 Ransom 244 0.63% 553 0.64% 10.24% 5,403 0.79%38 Renville 80 0.21% 181 0.21% 7.27% 2,490 0.36%39 Richland 870 2.25% 2,104 2.45% 12.95% 16,245 2.38%40 Rolette 3,325 8.60% 7,251 8.45% 51.04% 14,206 2.08%41 Sargent 122 0.32% 261 0.30% 6.87% 3,798 0.56%42 Sheridan 99 0.26% 236 0.28% 18.03% 1,309 0.19%43 Sioux 1,133 2.93% 2,814 3.28% 65.75% 4,280 0.63%44 Slope 15 0.04% 30 0.03% 4.18% 718 0.10%45 Stark 1,115 2.89% 2,212 2.58% 8.79% 25,177 3.68%46 Steele 60 0.16% 163 0.19% 8.36% 1,950 0.29%47 Stutsman 1,418 3.67% 2,751 3.21% 13.06% 21,062 3.08%48 Towner 103 0.27% 225 0.26% 9.94% 2,264 0.33%49 Traill 437 1.13% 982 1.14% 12.05% 8,147 1.19%50 Walsh 685 1.77% 1,616 1.88% 14.65% 11,032 1.61%51 Ward 2,895 7.49% 6,453 7.52% 10.07% 64,072 9.37%52 Wells 259 0.67% 525 0.61% 12.39% 4,237 0.62%53 Williams 1,103 2.85% 2,068 2.41% 8.48% 24,374 3.56%
38,642 100.00% 85,772 100.00% 12.54% 683,932 100.00%
COUNTY
Source: Data obtained via job ES399510
8
NORTH DAKOTA DEPARTMENT of HUMAN SERVICES
http://www.census.gov/popest/data/counties/totals/2011/CO-EST2011-01.html
TotalData presented by Human Service Center Region on page 11
UNDUPLICATED COUNT OF SNAP CASES AND RECIPIENTS
*Table 1. Annual Estimates of the Resident Population for Counties of North Dakota: April 1, 2010 to July 1, 2011 (CO-EST2011-01-38)Source: U.S. Census Bureau, Population Division, Release Date: April 2012
FOR STATE FISCAL YEAR 2012 (July 2011 - June 2012)
AMERICAN INDIAN
ASIAN/ PACIFIC
ISLANDERBLACK CAUCASIAN OTHER NOT
IDENTIFIED
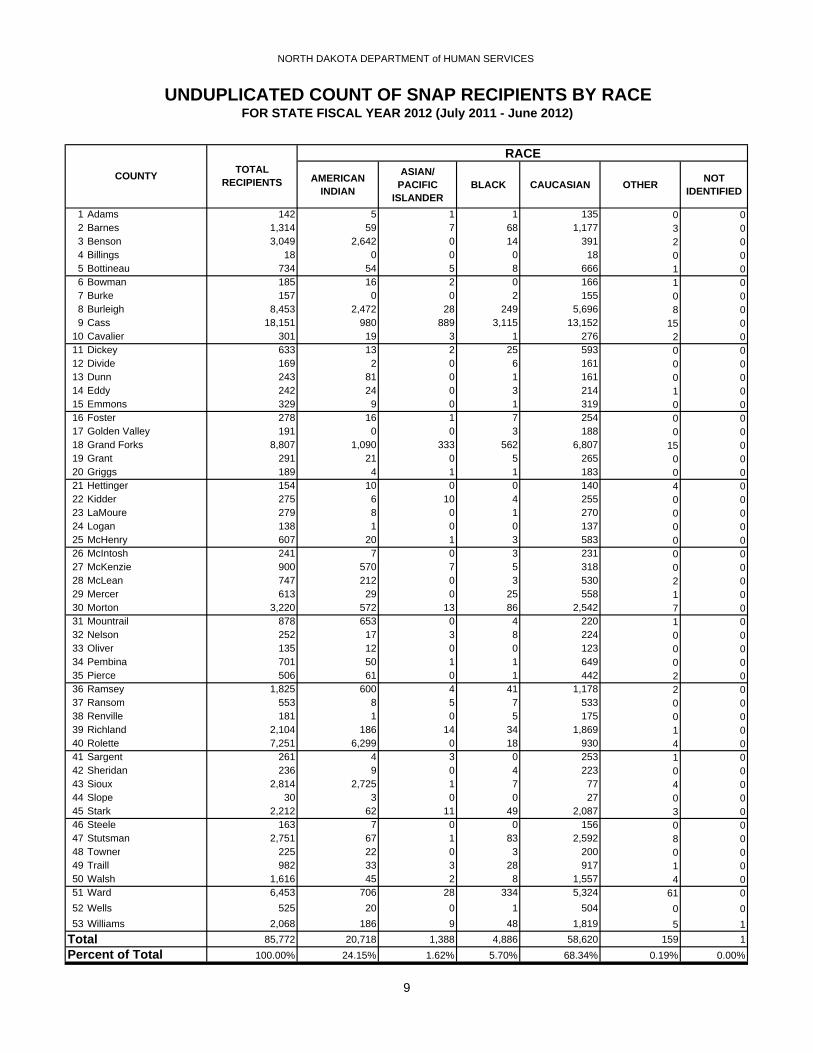
1 Adams 142 5 1 1 135 0 02 Barnes 1,314 59 7 68 1,177 3 03 Benson 3,049 2,642 0 14 391 2 04 Billings 18 0 0 0 18 0 05 Bottineau 734 54 5 8 666 1 06 Bowman 185 16 2 0 166 1 07 Burke 157 0 0 2 155 0 08 Burleigh 8,453 2,472 28 249 5,696 8 09 Cass 18,151 980 889 3,115 13,152 15 0
10 Cavalier 301 19 3 1 276 2 011 Dickey 633 13 2 25 593 0 012 Divide 169 2 0 6 161 0 013 Dunn 243 81 0 1 161 0 014 Eddy 242 24 0 3 214 1 015 Emmons 329 9 0 1 319 0 016 Foster 278 16 1 7 254 0 017 Golden Valley 191 0 0 3 188 0 018 Grand Forks 8,807 1,090 333 562 6,807 15 019 Grant 291 21 0 5 265 0 020 Griggs 189 4 1 1 183 0 021 Hettinger 154 10 0 0 140 4 022 Kidder 275 6 10 4 255 0 023 LaMoure 279 8 0 1 270 0 024 Logan 138 1 0 0 137 0 025 McHenry 607 20 1 3 583 0 026 McIntosh 241 7 0 3 231 0 027 McKenzie 900 570 7 5 318 0 028 McLean 747 212 0 3 530 2 029 Mercer 613 29 0 25 558 1 030 Morton 3,220 572 13 86 2,542 7 031 Mountrail 878 653 0 4 220 1 032 Nelson 252 17 3 8 224 0 033 Oliver 135 12 0 0 123 0 034 Pembina 701 50 1 1 649 0 035 Pierce 506 61 0 1 442 2 036 Ramsey 1,825 600 4 41 1,178 2 037 Ransom 553 8 5 7 533 0 038 Renville 181 1 0 5 175 0 039 Richland 2,104 186 14 34 1,869 1 040 Rolette 7,251 6,299 0 18 930 4 041 Sargent 261 4 3 0 253 1 042 Sheridan 236 9 0 4 223 0 043 Sioux 2,814 2,725 1 7 77 4 044 Slope 30 3 0 0 27 0 045 Stark 2,212 62 11 49 2,087 3 046 Steele 163 7 0 0 156 0 047 Stutsman 2,751 67 1 83 2,592 8 048 Towner 225 22 0 3 200 0 049 Traill 982 33 3 28 917 1 050 Walsh 1,616 45 2 8 1,557 4 051 Ward 6,453 706 28 334 5,324 61 052 Wells 525 20 0 1 504 0 053 Williams 2,068 186 9 48 1,819 5 1
85,772 20,718 1,388 4,886 58,620 159 1100.00% 24.15% 1.62% 5.70% 68.34% 0.19% 0.00%
NORTH DAKOTA DEPARTMENT of HUMAN SERVICES
UNDUPLICATED COUNT OF SNAP RECIPIENTS BY RACEFOR STATE FISCAL YEAR 2012 (July 2011 - June 2012)
9
RACE
Percent of TotalTotal
TOTAL RECIPIENTSCOUNTY

0-6 YEARS 7-18 YEARS 19-29 YEARS 30-49 YEARS 50-60 YEARS 61-79 YEARS 80+ YEARS
1 Adams 142 17 30 18 27 18 21 112 Barnes 1,314 270 285 244 276 103 85 513 Benson 3,049 798 859 515 619 160 84 144 Billings 18 4 3 2 5 0 2 25 Bottineau 734 153 145 112 159 71 71 236 Bowman 185 37 38 23 39 21 20 77 Burke 157 38 34 27 33 14 9 28 Burleigh 8,453 2,068 1,836 1,610 1,797 600 405 1379 Cass 18,151 4,050 3,900 3,684 3,935 1,487 922 173
10 Cavalier 301 46 75 30 67 25 44 1411 Dickey 633 142 113 137 106 51 52 3212 Divide 169 38 46 22 33 13 14 313 Dunn 243 56 53 41 51 18 19 514 Eddy 242 54 52 38 46 23 22 715 Emmons 329 43 69 28 70 33 51 3516 Foster 278 52 77 33 65 18 21 1217 Golden Valley 191 36 43 27 44 16 14 1118 Grand Forks 8,807 2,040 1,759 1,956 1,928 645 396 8319 Grant 291 42 68 34 64 25 34 2420 Griggs 189 33 33 28 32 19 27 1721 Hettinger 154 29 34 24 32 14 11 1022 Kidder 275 53 67 38 65 25 16 1123 LaMoure 279 38 70 31 65 29 30 1624 Logan 138 26 30 10 38 13 10 1125 McHenry 607 104 139 84 134 64 57 2526 McIntosh 241 39 50 30 51 15 31 2527 McKenzie 900 256 263 155 165 35 18 828 McLean 747 152 194 109 166 55 55 1629 Mercer 613 142 142 110 125 31 51 1230 Morton 3,220 708 806 505 719 220 184 7831 Mountrail 878 259 220 167 163 47 17 532 Nelson 252 37 61 40 51 29 26 833 Oliver 135 31 17 29 28 10 14 634 Pembina 701 113 180 93 162 78 59 1635 Pierce 506 81 129 77 110 42 44 2336 Ramsey 1,825 435 397 390 337 148 91 2737 Ransom 553 116 127 88 106 43 48 2538 Renville 181 36 36 35 32 9 22 1139 Richland 2,104 494 494 424 397 157 96 4240 Rolette 7,251 1,738 1,743 1,602 1,431 487 224 2641 Sargent 261 51 55 40 43 25 32 1542 Sheridan 236 35 56 25 64 23 23 1043 Sioux 2,814 671 702 586 654 153 47 144 Slope 30 2 8 2 6 1 7 445 Stark 2,212 495 435 390 453 184 178 7746 Steele 163 31 43 26 35 11 8 947 Stutsman 2,751 526 545 496 608 285 207 8448 Towner 225 52 45 46 46 16 14 649 Traill 982 192 211 185 227 70 80 1750 Walsh 1,616 365 364 279 346 124 106 3251 Ward 6,453 1,577 1,381 1,334 1,339 469 280 7352 Wells 525 103 95 76 111 50 66 2453 Williams 2,068 441 391 377 485 232 114 28
85,772 19,445 19,048 16,512 18,190 6,554 4,579 1,444100.00% 22.67% 22.21% 19.25% 21.21% 7.64% 5.34% 1.68%
*Age is based on the number of years between the birth month and the person's last SNAP benefit month in the year.
NORTH DAKOTA DEPARTMENT of HUMAN SERVICES
UNDUPLICATED COUNT OF SNAP RECIPIENTS BY AGE GROUPFOR STATE FISCAL YEAR 2012 (July 2011 - June 2012)
10
Percent of Total
COUNTY TOTAL RECIPIENTS
Total
AGE GROUP

NUMBER OF RECIPIENTS
PERCENT OF TOTAL RECIPIENTS
1 Northwest 12 Divide 169 0.20%1 Northwest 27 McKenzie 900 1.05%1 Northwest 53 Williams 2,068 2.41%
Subtotal 3,137 3.66%2 North Central 5 Bottineau 734 0.86%2 North Central 7 Burke 157 0.18%2 North Central 25 McHenry 607 0.71%2 North Central 31 Mountrail 878 1.02%2 North Central 35 Pierce 506 0.59%2 North Central 38 Renville 181 0.21%2 North Central 51 Ward 6,453 7.52%
Subtotal 9,516 11.09%3 Lake Region 3 Benson 3,049 3.55%3 Lake Region 10 Cavalier 301 0.35%3 Lake Region 14 Eddy 242 0.28%3 Lake Region 36 Ramsey 1,825 2.13%3 Lake Region 40 Rolette 7,251 8.45%3 Lake Region 48 Towner 225 0.26%
Subtotal 12,893 15.03%4 Northeast 18 Grand Forks 8,807 10.27%4 Northeast 32 Nelson 252 0.29%4 Northeast 34 Pembina 701 0.82%4 Northeast 50 Walsh 1,616 1.88%
Subtotal 11,376 13.26%5 Southeast 9 Cass 18,151 21.16%5 Southeast 37 Ransom 553 0.64%5 Southeast 39 Richland 2,104 2.45%5 Southeast 41 Sargent 261 0.30%5 Southeast 46 Steele 163 0.19%5 Southeast 49 Traill 982 1.14%
Subtotal 22,214 25.90%6 South Central 2 Barnes 1,314 1.53%6 South Central 11 Dickey 633 0.74%6 South Central 16 Foster 278 0.32%6 South Central 20 Griggs 189 0.22%6 South Central 23 LaMoure 279 0.33%6 South Central 24 Logan 138 0.16%6 South Central 26 McIntosh 241 0.28%6 South Central 47 Stutsman 2,751 3.21%6 South Central 52 Wells 525 0.61%
Subtotal 6,348 7.40%7 West Central 8 Burleigh 8,453 9.86%7 West Central 15 Emmons 329 0.38%7 West Central 19 Grant 291 0.34%7 West Central 22 Kidder 275 0.32%7 West Central 28 McLean 747 0.87%7 West Central 29 Mercer 613 0.71%7 West Central 30 Morton 3,220 3.75%7 West Central 33 Oliver 135 0.16%7 West Central 42 Sheridan 236 0.28%7 West Central 43 Sioux 2,814 3.28%
Subtotal 17,113 19.95%8 Badlands 1 Adams 142 0.17%8 Badlands 4 Billings 18 0.02%8 Badlands 6 Bowman 185 0.22%8 Badlands 13 Dunn 243 0.28%8 Badlands 17 Golden Valley 191 0.22%8 Badlands 21 Hettinger 154 0.18%8 Badlands 44 Slope 30 0.03%8 Badlands 45 Stark 2,212 2.58%
Subtotal 3,175 3.70%85,772 100.00%State Total
11
NORTH DAKOTA DEPARTMENT of HUMAN SERVICES
UNDUPLICATED COUNT OF SNAP RECIPIENTS BY REGIONFOR STATE FISCAL YEAR 2012 (July 2011 - June 2012)
HUMAN SERVICE CENTER REGION COUNTY
MEDICAID
MEDICAID PROGRAM
Note: Unduplicated count refers to cases or persons (recipients) counted once during the fiscal year regardless of the number of months during the year they received Medicaid benefits. If a recipient (or case) lived in different counties within the year and received Medicaid benefits in those counties, that person was counted as a resident only for the county that authorized that family's last benefit payment during the year.

NUMBER OF CASES
PERCENT OF TOTAL CASES
NUMBER OF RECIPIENTS
PERCENT OF TOTAL
RECIPIENTS
PERCENT OF COUNTY
POPULATION RECEIVING
2011 COUNTY POPULATION ESTIMATE *
COUNTY POPULATION AS A PERCENT OF
STATE POPULATION
1 Adams 127 0.27% 196 0.22% 8.50% 2,307 0.34%2 Barnes 904 1.94% 1,586 1.75% 14.35% 11,056 1.62%3 Benson 1,127 2.42% 3,084 3.41% 45.87% 6,723 0.98%4 Billings 16 0.03% 26 0.03% 3.19% 816 0.12%5 Bottineau 398 0.86% 758 0.84% 11.76% 6,443 0.94%6 Bowman 153 0.33% 229 0.25% 7.31% 3,134 0.46%7 Burke 89 0.19% 178 0.20% 8.76% 2,033 0.30%8 Burleigh 5,024 10.80% 9,316 10.30% 11.20% 83,145 12.16%9 Cass 9,256 19.90% 18,268 20.20% 11.99% 152,368 22.28%
10 Cavalier 205 0.44% 369 0.41% 9.37% 3,939 0.58%11 Dickey 362 0.78% 665 0.74% 12.51% 5,317 0.78%12 Divide 128 0.28% 234 0.26% 11.01% 2,125 0.31%13 Dunn 194 0.42% 354 0.39% 9.52% 3,720 0.54%14 Eddy 211 0.45% 374 0.41% 15.71% 2,380 0.35%15 Emmons 202 0.43% 329 0.36% 9.28% 3,546 0.52%16 Foster 186 0.40% 331 0.37% 9.91% 3,341 0.49%17 Golden Valley 100 0.21% 192 0.21% 10.96% 1,752 0.26%18 Grand Forks 4,425 9.51% 8,520 9.42% 12.79% 66,598 9.74%19 Grant 154 0.33% 281 0.31% 12.02% 2,337 0.34%20 Griggs 142 0.31% 237 0.26% 9.99% 2,372 0.35%21 Hettinger 137 0.29% 231 0.26% 9.18% 2,515 0.37%22 Kidder 119 0.26% 246 0.27% 10.19% 2,414 0.35%23 LaMoure 179 0.38% 309 0.34% 7.53% 4,105 0.60%24 Logan 123 0.26% 203 0.22% 10.23% 1,985 0.29%25 McHenry 337 0.72% 653 0.72% 11.86% 5,505 0.80%26 McIntosh 216 0.46% 364 0.40% 13.15% 2,769 0.40%27 McKenzie 460 0.99% 1,092 1.21% 15.56% 7,019 1.03%28 McLean 517 1.11% 962 1.06% 10.61% 9,068 1.33%29 Mercer 394 0.85% 711 0.79% 8.42% 8,449 1.24%30 Morton 1,962 4.22% 3,780 4.18% 13.63% 27,734 4.06%31 Mountrail 602 1.29% 1,325 1.46% 16.36% 8,097 1.18%32 Nelson 227 0.49% 368 0.41% 12.04% 3,057 0.45%33 Oliver 66 0.14% 141 0.16% 7.70% 1,830 0.27%34 Pembina 445 0.96% 852 0.94% 11.60% 7,342 1.07%35 Pierce 345 0.74% 609 0.67% 13.92% 4,375 0.64%36 Ramsey 1,151 2.47% 2,075 2.29% 18.12% 11,452 1.67%37 Ransom 408 0.88% 709 0.78% 13.12% 5,403 0.79%38 Renville 126 0.27% 226 0.25% 9.08% 2,490 0.36%39 Richland 1,063 2.29% 2,133 2.36% 13.13% 16,245 2.38%40 Rolette 2,582 5.55% 6,092 6.73% 42.88% 14,206 2.08%41 Sargent 152 0.33% 273 0.30% 7.19% 3,798 0.56%42 Sheridan 100 0.21% 195 0.22% 14.90% 1,309 0.19%43 Sioux 916 1.97% 2,488 2.75% 58.13% 4,280 0.63%44 Slope 17 0.04% 29 0.03% 4.04% 718 0.10%45 Stark 1,685 3.62% 2,826 3.12% 11.22% 25,177 3.68%46 Steele 70 0.15% 160 0.18% 8.21% 1,950 0.29%47 Stutsman 1,731 3.72% 2,947 3.26% 13.99% 21,062 3.08%48 Towner 158 0.34% 300 0.33% 13.25% 2,264 0.33%49 Traill 495 1.06% 935 1.03% 11.48% 8,147 1.19%50 Walsh 961 2.07% 1,794 1.98% 16.26% 11,032 1.61%51 Ward 3,642 7.83% 6,837 7.56% 10.67% 64,072 9.37%52 Wells 302 0.65% 558 0.62% 13.17% 4,237 0.62%53 Williams 1,425 3.06% 2,503 2.77% 10.27% 24,374 3.56%
46,516 100.00% 90,453 100.00% 13.23% 683,932 100.00%
NORTH DAKOTA DEPARTMENT of HUMAN SERVICES
COUNTY
UNDUPLICATED COUNT OF MEDICAID CASES AND RECIPIENTSFOR STATE FISCAL YEAR 2012 (July 2011 - June 2012)
12
Data presented by Human Service Center Region on page 15
Source: Data obtained via job ES399510
http://www.census.gov/popest/data/counties/totals/2011/CO-EST2011-01.html
Total
*Table 1. Annual Estimates of the Resident Population for Counties of North Dakota: April 1, 2010 to July 1, 2011 (CO-EST2011-01-38)Source: U.S. Census Bureau, Population Division, Release Date: April 2012
AMERICAN INDIAN
ASIAN/ PACIFIC
ISLANDERBLACK CAUCASIAN OTHER NOT IDENTIFIED
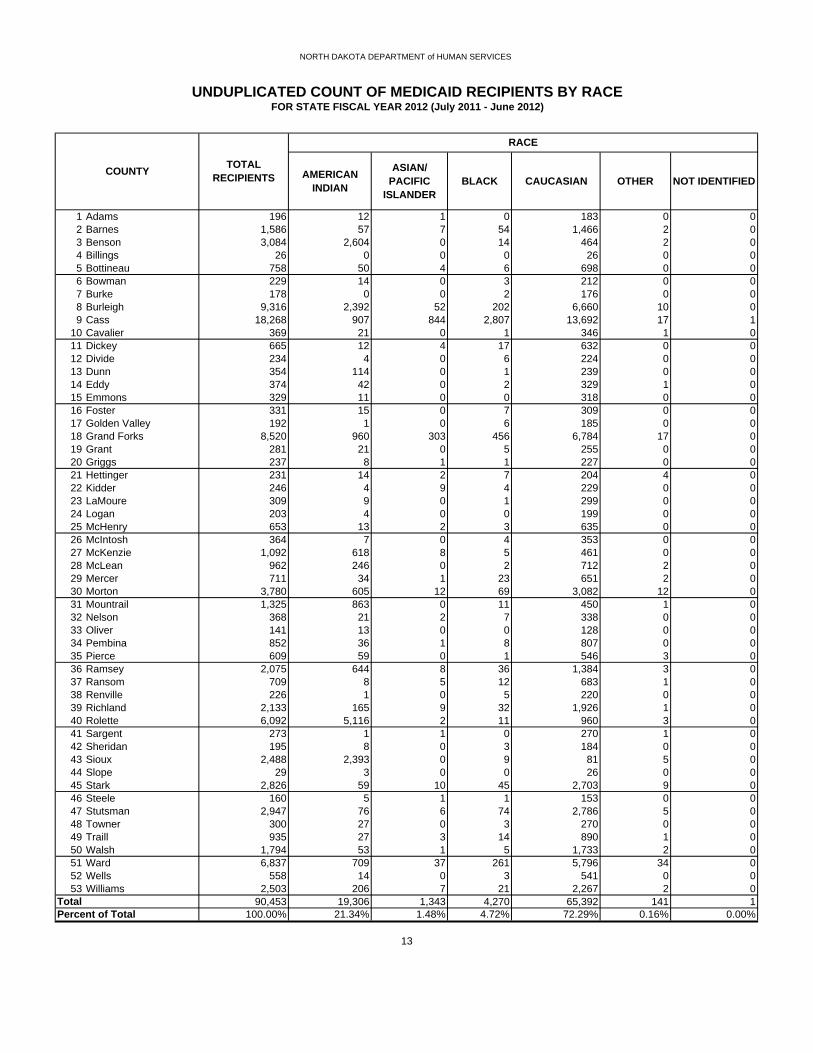
1 Adams 196 12 1 0 183 0 02 Barnes 1,586 57 7 54 1,466 2 03 Benson 3,084 2,604 0 14 464 2 04 Billings 26 0 0 0 26 0 05 Bottineau 758 50 4 6 698 0 06 Bowman 229 14 0 3 212 0 07 Burke 178 0 0 2 176 0 08 Burleigh 9,316 2,392 52 202 6,660 10 09 Cass 18,268 907 844 2,807 13,692 17 1
10 Cavalier 369 21 0 1 346 1 011 Dickey 665 12 4 17 632 0 012 Divide 234 4 0 6 224 0 013 Dunn 354 114 0 1 239 0 014 Eddy 374 42 0 2 329 1 015 Emmons 329 11 0 0 318 0 016 Foster 331 15 0 7 309 0 017 Golden Valley 192 1 0 6 185 0 018 Grand Forks 8,520 960 303 456 6,784 17 019 Grant 281 21 0 5 255 0 020 Griggs 237 8 1 1 227 0 021 Hettinger 231 14 2 7 204 4 022 Kidder 246 4 9 4 229 0 023 LaMoure 309 9 0 1 299 0 024 Logan 203 4 0 0 199 0 025 McHenry 653 13 2 3 635 0 026 McIntosh 364 7 0 4 353 0 027 McKenzie 1,092 618 8 5 461 0 028 McLean 962 246 0 2 712 2 029 Mercer 711 34 1 23 651 2 030 Morton 3,780 605 12 69 3,082 12 031 Mountrail 1,325 863 0 11 450 1 032 Nelson 368 21 2 7 338 0 033 Oliver 141 13 0 0 128 0 034 Pembina 852 36 1 8 807 0 035 Pierce 609 59 0 1 546 3 036 Ramsey 2,075 644 8 36 1,384 3 037 Ransom 709 8 5 12 683 1 038 Renville 226 1 0 5 220 0 039 Richland 2,133 165 9 32 1,926 1 040 Rolette 6,092 5,116 2 11 960 3 041 Sargent 273 1 1 0 270 1 042 Sheridan 195 8 0 3 184 0 043 Sioux 2,488 2,393 0 9 81 5 044 Slope 29 3 0 0 26 0 045 Stark 2,826 59 10 45 2,703 9 046 Steele 160 5 1 1 153 0 047 Stutsman 2,947 76 6 74 2,786 5 048 Towner 300 27 0 3 270 0 049 Traill 935 27 3 14 890 1 050 Walsh 1,794 53 1 5 1,733 2 051 Ward 6,837 709 37 261 5,796 34 052 Wells 558 14 0 3 541 0 053 Williams 2,503 206 7 21 2,267 2 0
90,453 19,306 1,343 4,270 65,392 141 1100.00% 21.34% 1.48% 4.72% 72.29% 0.16% 0.00%
13
Percent of TotalTotal
NORTH DAKOTA DEPARTMENT of HUMAN SERVICES
UNDUPLICATED COUNT OF MEDICAID RECIPIENTS BY RACEFOR STATE FISCAL YEAR 2012 (July 2011 - June 2012)
COUNTY TOTAL RECIPIENTS
RACE

0-5 6-18 19-20 21-64 65 and over
1 Adams 196 42 43 1 58 522 Barnes 1,586 314 440 44 541 2473 Benson 3,084 748 1,174 95 953 1144 Billings 26 9 6 2 8 15 Bottineau 758 185 198 25 239 1116 Bowman 229 62 61 10 49 477 Burke 178 44 64 8 52 108 Burleigh 9,316 2,449 2,504 331 3,182 8509 Cass 18,268 4,799 5,363 680 6,334 1,092
10 Cavalier 369 59 108 13 108 8111 Dickey 665 173 158 20 170 14412 Divide 234 55 58 7 73 4113 Dunn 354 88 104 13 105 4414 Eddy 374 75 109 3 116 7115 Emmons 329 57 93 12 88 7916 Foster 331 62 96 6 95 7217 Golden Valley 192 53 78 5 40 1618 Grand Forks 8,520 2,305 2,382 347 2,925 56119 Grant 281 45 86 11 68 7120 Griggs 237 47 63 9 57 6121 Hettinger 231 53 73 6 53 4622 Kidder 246 62 86 10 65 2323 LaMoure 309 62 93 6 84 6424 Logan 203 45 45 2 42 6925 McHenry 653 139 212 19 207 7626 McIntosh 364 70 85 11 85 11327 McKenzie 1,092 296 410 41 292 5328 McLean 962 205 306 24 289 13829 Mercer 711 164 199 28 202 11830 Morton 3,780 914 1,147 104 1,247 36831 Mountrail 1,325 370 433 66 384 7232 Nelson 368 53 95 12 120 8833 Oliver 141 45 39 5 40 1234 Pembina 852 192 286 24 243 10735 Pierce 609 116 180 28 154 13136 Ramsey 2,075 457 610 90 684 23437 Ransom 709 146 193 23 203 14438 Renville 226 51 64 8 54 4939 Richland 2,133 536 675 83 651 18840 Rolette 6,092 1,500 2,066 224 2,045 25741 Sargent 273 65 83 10 77 3842 Sheridan 195 38 60 12 58 2743 Sioux 2,488 594 863 110 869 5244 Slope 29 6 10 0 5 845 Stark 2,826 772 729 86 853 38646 Steele 160 40 55 4 49 1247 Stutsman 2,947 641 807 108 1,037 35448 Towner 300 68 89 9 86 4849 Traill 935 214 275 24 272 15050 Walsh 1,794 425 550 63 543 21351 Ward 6,837 1,769 2,011 243 2,287 52752 Wells 558 119 133 17 194 9553 Williams 2,503 729 751 87 731 205
90,453 22,627 26,901 3,229 29,466 8,230100.00% 25.02% 29.74% 3.57% 32.58% 9.10%
*Age is based on the number of years between the birth month and the person's last Medicaid benefit month in the year.
14
TotalPercent of Total
NORTH DAKOTA DEPARTMENT of HUMAN SERVICES
UNDUPLICATED COUNT OF MEDICAID RECIPIENTS BY AGE GROUPFOR STATE FISCAL YEAR 2012 (July 2011 - June 2012)
COUNTY TOTAL RECIPIENTS
AGE GROUP

NUMBER OF RECIPIENTS
PERCENT OF TOTAL RECIPIENTS
1 Northwest 12 Divide 234 0.26%1 Northwest 27 McKenzie 1,092 1.21%1 Northwest 53 Williams 2,503 2.77%
Subtotal 3,829 4.23%2 North Central 5 Bottineau 758 0.84%2 North Central 7 Burke 178 0.20%2 North Central 25 McHenry 653 0.72%2 North Central 31 Mountrail 1,325 1.46%2 North Central 35 Pierce 609 0.67%2 North Central 38 Renville 226 0.25%2 North Central 51 Ward 6,837 7.56%
Subtotal 10,586 11.70%3 Lake Region 3 Benson 3,084 3.41%3 Lake Region 10 Cavalier 369 0.41%3 Lake Region 14 Eddy 374 0.41%3 Lake Region 36 Ramsey 2,075 2.29%3 Lake Region 40 Rolette 6,092 6.73%3 Lake Region 48 Towner 300 0.33%
Subtotal 12,294 13.59%4 Northeast 18 Grand Forks 8,520 9.42%4 Northeast 32 Nelson 368 0.41%4 Northeast 34 Pembina 852 0.94%4 Northeast 50 Walsh 1,794 1.98%
Subtotal 11,534 12.75%5 Southeast 9 Cass 18,268 20.20%5 Southeast 37 Ransom 709 0.78%5 Southeast 39 Richland 2,133 2.36%5 Southeast 41 Sargent 273 0.30%5 Southeast 46 Steele 160 0.18%5 Southeast 49 Traill 935 1.03%
Subtotal 22,478 24.85%6 South Central 2 Barnes 1,586 1.75%6 South Central 11 Dickey 665 0.74%6 South Central 16 Foster 331 0.37%6 South Central 20 Griggs 237 0.26%6 South Central 23 LaMoure 309 0.34%6 South Central 24 Logan 203 0.22%6 South Central 26 McIntosh 364 0.40%6 South Central 47 Stutsman 2,947 3.26%6 South Central 52 Wells 558 0.62%
Subtotal 7,200 7.96%7 West Central 8 Burleigh 9,316 10.30%7 West Central 15 Emmons 329 0.36%7 West Central 19 Grant 281 0.31%7 West Central 22 Kidder 246 0.27%7 West Central 28 McLean 962 1.06%7 West Central 29 Mercer 711 0.79%7 West Central 30 Morton 3,780 4.18%7 West Central 33 Oliver 141 0.16%7 West Central 42 Sheridan 195 0.22%7 West Central 43 Sioux 2,488 2.75%
Subtotal 18,449 20.40%8 Badlands 1 Adams 196 0.22%8 Badlands 4 Billings 26 0.03%8 Badlands 6 Bowman 229 0.25%8 Badlands 13 Dunn 354 0.39%8 Badlands 17 Golden Valley 192 0.21%8 Badlands 21 Hettinger 231 0.26%8 Badlands 44 Slope 29 0.03%8 Badlands 45 Stark 2,826 3.12%
Subtotal 4,083 4.51%90,453 100.00%State Total
15
NORTH DAKOTA DEPARTMENT of HUMAN SERVICES
UNDUPLICATED COUNT OF MEDICAID RECIPIENTS BY REGIONFOR STATE FISCAL YEAR 2012 (July 2011 - June 2012)
HUMAN SERVICE CENTER REGION COUNTY

LIHEAP
ASSISTANCE PROGRAM (LIHEAP)LOW INCOME HOME ENERGY
Note: Unduplicated count refers to cases or persons (recipients) counted once during the fiscal year regardless of the number of months during the year they received LIHEAP benefits. If a recipient (or case) lived in different counties within the year and received LIHEAP benefits in those counties, that person was counted as a resident only for the county that authorized that family's last benefit payment during the year.
NUMBER OF CASES
PERCENT OF TOTAL CASES
NUMBER OF RECIPIENTS
PERCENT OF TOTAL
RECIPIENTS
PERCENT OF COUNTY
POPULATION RECEIVING
2011 COUNTY POPULATION ESTIMATE *
COUNTY POPULATION AS A PERCENT OF
STATE POPULATION
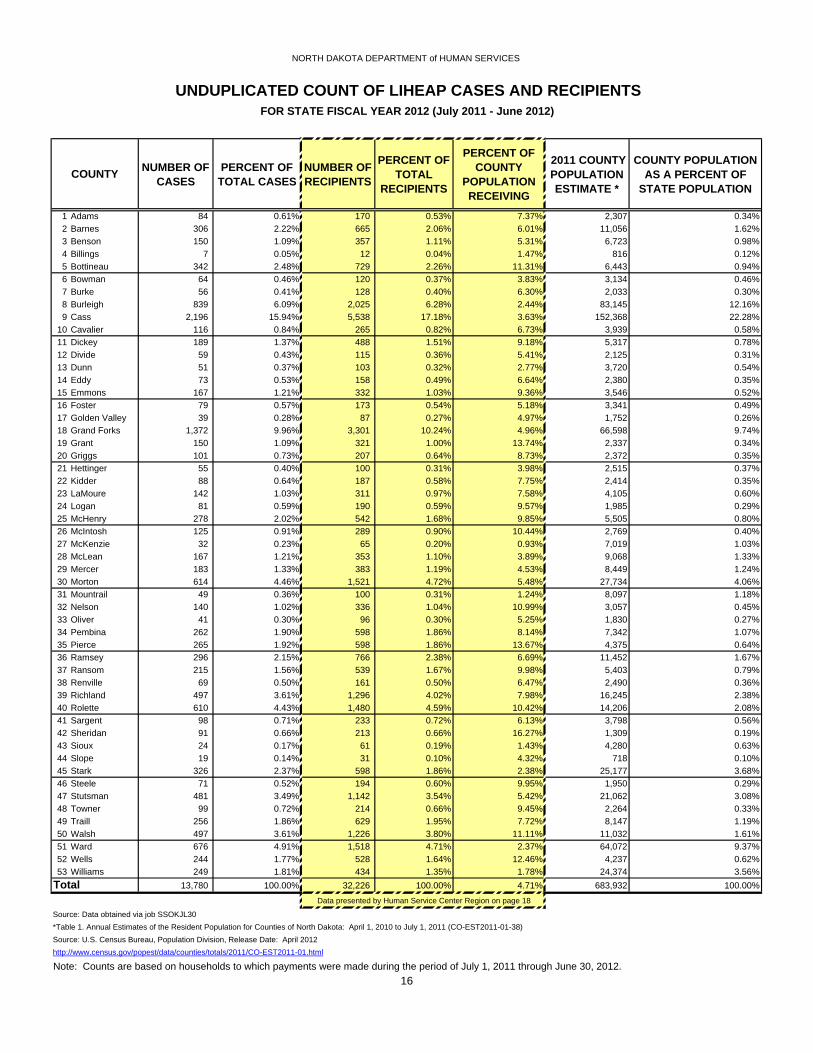
1 Adams 84 0.61% 170 0.53% 7.37% 2,307 0.34%2 Barnes 306 2.22% 665 2.06% 6.01% 11,056 1.62%3 Benson 150 1.09% 357 1.11% 5.31% 6,723 0.98%4 Billings 7 0.05% 12 0.04% 1.47% 816 0.12%5 Bottineau 342 2.48% 729 2.26% 11.31% 6,443 0.94%6 Bowman 64 0.46% 120 0.37% 3.83% 3,134 0.46%7 Burke 56 0.41% 128 0.40% 6.30% 2,033 0.30%8 Burleigh 839 6.09% 2,025 6.28% 2.44% 83,145 12.16%9 Cass 2,196 15.94% 5,538 17.18% 3.63% 152,368 22.28%
10 Cavalier 116 0.84% 265 0.82% 6.73% 3,939 0.58%11 Dickey 189 1.37% 488 1.51% 9.18% 5,317 0.78%12 Divide 59 0.43% 115 0.36% 5.41% 2,125 0.31%13 Dunn 51 0.37% 103 0.32% 2.77% 3,720 0.54%14 Eddy 73 0.53% 158 0.49% 6.64% 2,380 0.35%15 Emmons 167 1.21% 332 1.03% 9.36% 3,546 0.52%16 Foster 79 0.57% 173 0.54% 5.18% 3,341 0.49%17 Golden Valley 39 0.28% 87 0.27% 4.97% 1,752 0.26%18 Grand Forks 1,372 9.96% 3,301 10.24% 4.96% 66,598 9.74%19 Grant 150 1.09% 321 1.00% 13.74% 2,337 0.34%20 Griggs 101 0.73% 207 0.64% 8.73% 2,372 0.35%21 Hettinger 55 0.40% 100 0.31% 3.98% 2,515 0.37%22 Kidder 88 0.64% 187 0.58% 7.75% 2,414 0.35%23 LaMoure 142 1.03% 311 0.97% 7.58% 4,105 0.60%24 Logan 81 0.59% 190 0.59% 9.57% 1,985 0.29%25 McHenry 278 2.02% 542 1.68% 9.85% 5,505 0.80%26 McIntosh 125 0.91% 289 0.90% 10.44% 2,769 0.40%27 McKenzie 32 0.23% 65 0.20% 0.93% 7,019 1.03%28 McLean 167 1.21% 353 1.10% 3.89% 9,068 1.33%29 Mercer 183 1.33% 383 1.19% 4.53% 8,449 1.24%30 Morton 614 4.46% 1,521 4.72% 5.48% 27,734 4.06%31 Mountrail 49 0.36% 100 0.31% 1.24% 8,097 1.18%32 Nelson 140 1.02% 336 1.04% 10.99% 3,057 0.45%33 Oliver 41 0.30% 96 0.30% 5.25% 1,830 0.27%34 Pembina 262 1.90% 598 1.86% 8.14% 7,342 1.07%35 Pierce 265 1.92% 598 1.86% 13.67% 4,375 0.64%36 Ramsey 296 2.15% 766 2.38% 6.69% 11,452 1.67%37 Ransom 215 1.56% 539 1.67% 9.98% 5,403 0.79%38 Renville 69 0.50% 161 0.50% 6.47% 2,490 0.36%39 Richland 497 3.61% 1,296 4.02% 7.98% 16,245 2.38%40 Rolette 610 4.43% 1,480 4.59% 10.42% 14,206 2.08%41 Sargent 98 0.71% 233 0.72% 6.13% 3,798 0.56%42 Sheridan 91 0.66% 213 0.66% 16.27% 1,309 0.19%43 Sioux 24 0.17% 61 0.19% 1.43% 4,280 0.63%44 Slope 19 0.14% 31 0.10% 4.32% 718 0.10%45 Stark 326 2.37% 598 1.86% 2.38% 25,177 3.68%46 Steele 71 0.52% 194 0.60% 9.95% 1,950 0.29%47 Stutsman 481 3.49% 1,142 3.54% 5.42% 21,062 3.08%48 Towner 99 0.72% 214 0.66% 9.45% 2,264 0.33%49 Traill 256 1.86% 629 1.95% 7.72% 8,147 1.19%50 Walsh 497 3.61% 1,226 3.80% 11.11% 11,032 1.61%51 Ward 676 4.91% 1,518 4.71% 2.37% 64,072 9.37%52 Wells 244 1.77% 528 1.64% 12.46% 4,237 0.62%53 Williams 249 1.81% 434 1.35% 1.78% 24,374 3.56%
13,780 100.00% 32,226 100.00% 4.71% 683,932 100.00%
Source: Data obtained via job SSOKJL30
16
http://www.census.gov/popest/data/counties/totals/2011/CO-EST2011-01.html
*Table 1. Annual Estimates of the Resident Population for Counties of North Dakota: April 1, 2010 to July 1, 2011 (CO-EST2011-01-38)Source: U.S. Census Bureau, Population Division, Release Date: April 2012
NORTH DAKOTA DEPARTMENT of HUMAN SERVICES
COUNTY
UNDUPLICATED COUNT OF LIHEAP CASES AND RECIPIENTSFOR STATE FISCAL YEAR 2012 (July 2011 - June 2012)
Note: Counts are based on households to which payments were made during the period of July 1, 2011 through June 30, 2012.
Data presented by Human Service Center Region on page 18
Total

AMERICAN INDIAN ASIAN BLACK
HAWAIIAN/ PACIFIC
ISLANDERCAUCASIAN OTHER NOT IDENTIFIED
1 Adams 170 8 0 0 0 160 2 02 Barnes 665 36 3 3 0 620 3 03 Benson 357 46 0 0 0 311 0 04 Billings 12 0 0 0 0 12 0 05 Bottineau 729 45 3 7 0 670 4 06 Bowman 120 4 2 0 0 112 2 07 Burke 128 0 0 0 0 128 0 08 Burleigh 2,025 420 17 17 4 1,553 14 09 Cass 5,538 302 324 821 12 3,864 215 0
10 Cavalier 265 15 2 4 0 242 2 011 Dickey 488 3 2 7 0 453 18 512 Divide 115 0 0 0 0 115 0 013 Dunn 103 17 0 0 1 85 0 014 Eddy 158 3 0 0 0 151 4 015 Emmons 332 0 0 14 0 318 0 016 Foster 173 1 0 1 0 171 0 017 Golden Valley 87 0 0 0 0 86 1 018 Grand Forks 3,301 352 105 120 9 2,645 69 119 Grant 321 8 0 7 0 306 0 020 Griggs 207 0 0 2 0 202 3 021 Hettinger 100 3 0 1 0 96 0 022 Kidder 187 0 0 0 0 180 7 023 LaMoure 311 7 0 4 0 300 0 024 Logan 190 0 0 0 0 190 0 025 McHenry 542 3 3 18 0 518 0 026 McIntosh 289 0 2 0 0 280 7 027 McKenzie 65 0 0 0 0 65 0 028 McLean 353 13 0 3 0 333 4 029 Mercer 383 11 0 24 0 346 0 230 Morton 1,521 227 2 20 0 1,245 27 031 Mountrail 100 2 0 0 0 95 3 032 Nelson 336 8 14 0 0 309 0 533 Oliver 96 0 0 0 0 88 8 034 Pembina 598 31 0 15 0 546 6 035 Pierce 598 39 0 6 0 553 0 036 Ramsey 766 183 3 10 0 563 7 037 Ransom 539 1 1 7 6 517 7 038 Renville 161 0 0 6 0 155 0 039 Richland 1,296 81 9 60 0 1,117 29 040 Rolette 1,480 1,084 4 24 0 365 3 041 Sargent 233 5 1 0 0 227 0 042 Sheridan 213 1 0 4 0 208 0 043 Sioux 61 0 0 0 0 61 0 044 Slope 31 0 0 2 0 29 0 045 Stark 598 19 0 5 0 574 0 046 Steele 194 3 0 0 0 191 0 047 Stutsman 1,142 8 0 8 0 1,117 9 048 Towner 214 14 0 5 0 195 0 049 Traill 629 26 0 12 0 591 0 050 Walsh 1,226 33 1 18 0 1,075 97 251 Ward 1,518 139 3 34 5 1,294 43 052 Wells 528 7 0 16 0 504 1 053 Williams 434 43 1 4 0 384 2 0
32,226 3,251 502 1,309 37 26,515 597 15 100.00% 10.09% 1.56% 4.06% 0.11% 82.28% 1.85% 0.05%
*LIHEAP data is recorded at the household rather than the individual level. Racial Identification is recorded only for the member of the householdwho signs the application for assistance. For purposes of this table, all persons in a household are assumed to be of the same race.
17
COUNTY TOTAL RECIPIENTS
RACE
**Individuals residing within the boundaries of a reservation that are served by a heating assistance program administered by the Tribe are not included in these counts.
Total
NORTH DAKOTA DEPARTMENT of HUMAN SERVICES
UNDUPLICATED COUNT OF LIHEAP RECIPIENTS BY RACEFOR STATE FISCAL YEAR 2012 (July 2011 - June 2012)
Percent of Total
NUMBER OF RECIPIENTS
PERCENT OF TOTAL RECIPIENTS
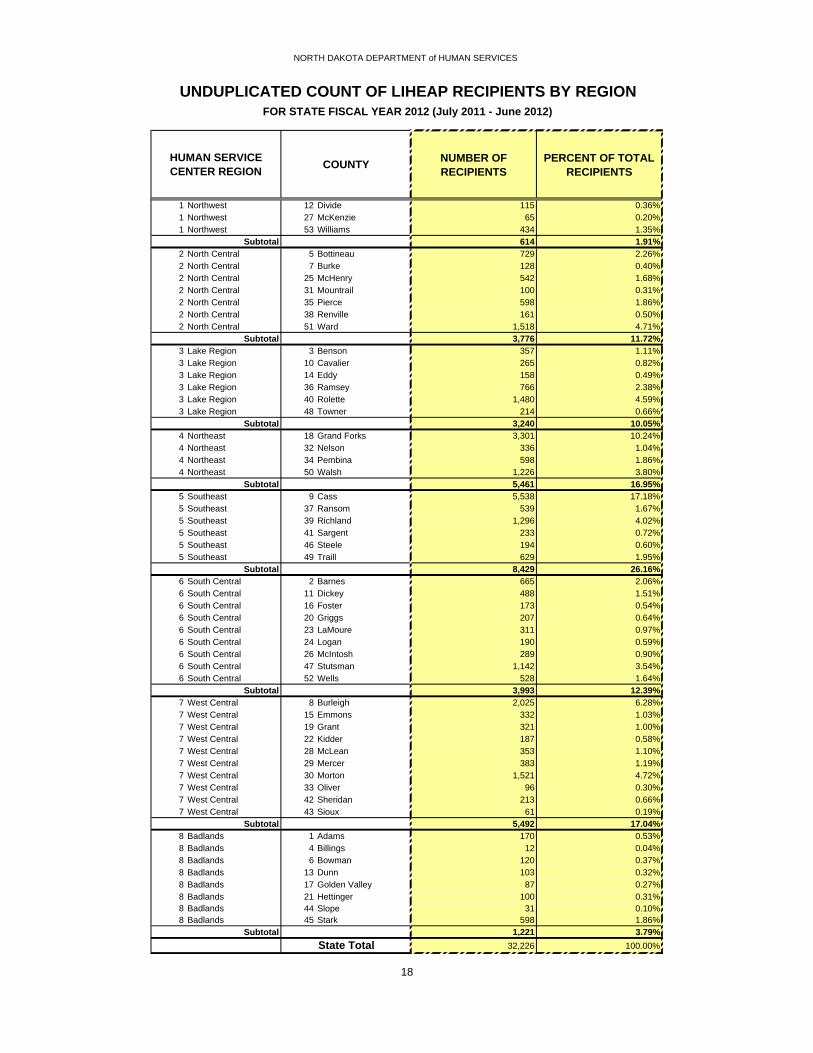
1 Northwest 12 Divide 115 0.36%1 Northwest 27 McKenzie 65 0.20%1 Northwest 53 Williams 434 1.35%
Subtotal 614 1.91%2 North Central 5 Bottineau 729 2.26%2 North Central 7 Burke 128 0.40%2 North Central 25 McHenry 542 1.68%2 North Central 31 Mountrail 100 0.31%2 North Central 35 Pierce 598 1.86%2 North Central 38 Renville 161 0.50%2 North Central 51 Ward 1,518 4.71%
Subtotal 3,776 11.72%3 Lake Region 3 Benson 357 1.11%3 Lake Region 10 Cavalier 265 0.82%3 Lake Region 14 Eddy 158 0.49%3 Lake Region 36 Ramsey 766 2.38%3 Lake Region 40 Rolette 1,480 4.59%3 Lake Region 48 Towner 214 0.66%
Subtotal 3,240 10.05%4 Northeast 18 Grand Forks 3,301 10.24%4 Northeast 32 Nelson 336 1.04%4 Northeast 34 Pembina 598 1.86%4 Northeast 50 Walsh 1,226 3.80%
Subtotal 5,461 16.95%5 Southeast 9 Cass 5,538 17.18%5 Southeast 37 Ransom 539 1.67%5 Southeast 39 Richland 1,296 4.02%5 Southeast 41 Sargent 233 0.72%5 Southeast 46 Steele 194 0.60%5 Southeast 49 Traill 629 1.95%
Subtotal 8,429 26.16%6 South Central 2 Barnes 665 2.06%6 South Central 11 Dickey 488 1.51%6 South Central 16 Foster 173 0.54%6 South Central 20 Griggs 207 0.64%6 South Central 23 LaMoure 311 0.97%6 South Central 24 Logan 190 0.59%6 South Central 26 McIntosh 289 0.90%6 South Central 47 Stutsman 1,142 3.54%6 South Central 52 Wells 528 1.64%
Subtotal 3,993 12.39%7 West Central 8 Burleigh 2,025 6.28%7 West Central 15 Emmons 332 1.03%7 West Central 19 Grant 321 1.00%7 West Central 22 Kidder 187 0.58%7 West Central 28 McLean 353 1.10%7 West Central 29 Mercer 383 1.19%7 West Central 30 Morton 1,521 4.72%7 West Central 33 Oliver 96 0.30%7 West Central 42 Sheridan 213 0.66%7 West Central 43 Sioux 61 0.19%
Subtotal 5,492 17.04%8 Badlands 1 Adams 170 0.53%8 Badlands 4 Billings 12 0.04%8 Badlands 6 Bowman 120 0.37%8 Badlands 13 Dunn 103 0.32%8 Badlands 17 Golden Valley 87 0.27%8 Badlands 21 Hettinger 100 0.31%8 Badlands 44 Slope 31 0.10%8 Badlands 45 Stark 598 1.86%
Subtotal 1,221 3.79%32,226 100.00%State Total
18
NORTH DAKOTA DEPARTMENT of HUMAN SERVICES
UNDUPLICATED COUNT OF LIHEAP RECIPIENTS BY REGIONFOR STATE FISCAL YEAR 2012 (July 2011 - June 2012)
HUMAN SERVICE CENTER REGION COUNTY
CCAP
CHILD CARE ASSISTANCE PROGRAM (CCAP)
Note: Unduplicated count refers to cases or persons (recipients) counted once during the fiscal year regardless of the number of months during the year they received CCAP benefits. If a recipient (or case) lived in different counties within the year and received CCAP benefits in those counties, that person was counted as a resident only for the county that authorized that family's last benefit payment during the year.

NUMBER OF CASES
PERCENT OF TOTAL CASES
NUMBER OF RECIPIENTS
PERCENT OF TOTAL
RECIPIENTS
PERCENT OF COUNTY
POPULATION RECEIVING
2011 COUNTY POPULATION ESTIMATE *
COUNTY POPULATION AS A PERCENT OF
STATE POPULATION
1 Adams 10 0.28% 25 0.41% 1.08% 2,307 0.34%2 Barnes 59 1.63% 89 1.46% 0.80% 11,056 1.62%3 Benson 18 0.50% 30 0.49% 0.45% 6,723 0.98%4 Billings 0 0.00% 0 0.00% 0.00% 816 0.12%5 Bottineau 32 0.88% 45 0.74% 0.70% 6,443 0.94%6 Bowman 5 0.14% 8 0.13% 0.26% 3,134 0.46%7 Burke 0 0.00% 0 0.00% 0.00% 2,033 0.30%8 Burleigh 450 12.42% 677 11.10% 0.81% 83,145 12.16%9 Cass 958 26.43% 1,585 26.00% 1.04% 152,368 22.28%
10 Cavalier 7 0.19% 12 0.20% 0.30% 3,939 0.58%11 Dickey 31 0.86% 68 1.12% 1.28% 5,317 0.78%12 Divide 3 0.08% 7 0.11% 0.33% 2,125 0.31%13 Dunn 1 0.03% 1 0.02% 0.03% 3,720 0.54%14 Eddy 6 0.17% 9 0.15% 0.38% 2,380 0.35%15 Emmons 9 0.25% 16 0.26% 0.45% 3,546 0.52%16 Foster 15 0.41% 24 0.39% 0.72% 3,341 0.49%17 Golden Valley 5 0.14% 7 0.11% 0.40% 1,752 0.26%18 Grand Forks 457 12.61% 762 12.50% 1.14% 66,598 9.74%19 Grant 3 0.08% 6 0.10% 0.26% 2,337 0.34%20 Griggs 6 0.17% 9 0.15% 0.38% 2,372 0.35%21 Hettinger 5 0.14% 6 0.10% 0.24% 2,515 0.37%22 Kidder 7 0.19% 13 0.21% 0.54% 2,414 0.35%23 LaMoure 7 0.19% 13 0.21% 0.32% 4,105 0.60%24 Logan 4 0.11% 7 0.11% 0.35% 1,985 0.29%25 McHenry 20 0.55% 29 0.48% 0.53% 5,505 0.80%26 McIntosh 12 0.33% 21 0.34% 0.76% 2,769 0.40%27 McKenzie 9 0.25% 11 0.18% 0.16% 7,019 1.03%28 McLean 19 0.52% 33 0.54% 0.36% 9,068 1.33%29 Mercer 19 0.52% 35 0.57% 0.41% 8,449 1.24%30 Morton 144 3.97% 247 4.05% 0.89% 27,734 4.06%31 Mountrail 14 0.39% 18 0.30% 0.22% 8,097 1.18%32 Nelson 6 0.17% 12 0.20% 0.39% 3,057 0.45%33 Oliver 1 0.03% 2 0.03% 0.11% 1,830 0.27%34 Pembina 23 0.63% 33 0.54% 0.45% 7,342 1.07%35 Pierce 17 0.47% 29 0.48% 0.66% 4,375 0.64%36 Ramsey 80 2.21% 127 2.08% 1.11% 11,452 1.67%37 Ransom 25 0.69% 36 0.59% 0.67% 5,403 0.79%38 Renville 6 0.17% 10 0.16% 0.40% 2,490 0.36%39 Richland 89 2.46% 165 2.71% 1.02% 16,245 2.38%40 Rolette 321 8.86% 683 11.20% 4.81% 14,206 2.08%41 Sargent 6 0.17% 10 0.16% 0.26% 3,798 0.56%42 Sheridan 5 0.14% 7 0.11% 0.53% 1,309 0.19%43 Sioux 14 0.39% 44 0.72% 1.03% 4,280 0.63%44 Slope 0 0.00% 0 0.00% 0.00% 718 0.10%45 Stark 134 3.70% 218 3.58% 0.87% 25,177 3.68%46 Steele 1 0.03% 3 0.05% 0.15% 1,950 0.29%47 Stutsman 89 2.46% 143 2.35% 0.68% 21,062 3.08%48 Towner 15 0.41% 27 0.44% 1.19% 2,264 0.33%49 Traill 19 0.52% 30 0.49% 0.37% 8,147 1.19%50 Walsh 52 1.43% 88 1.44% 0.80% 11,032 1.61%51 Ward 340 9.38% 530 8.69% 0.83% 64,072 9.37%52 Wells 6 0.17% 11 0.18% 0.26% 4,237 0.62%53 Williams 40 1.10% 76 1.25% 0.31% 24,374 3.56%
3,624 100.00% 6,097 100.00% 0.89% 683,932 100.00%
19
Total
NORTH DAKOTA DEPARTMENT of HUMAN SERVICES
COUNTY
UNDUPLICATED COUNT OF CCAP CASES AND RECIPIENTSFOR STATE FISCAL YEAR 2012 (July 2011 - June 2012)
Data presented by Human Service Center Region on page 22
http://www.census.gov/popest/data/counties/totals/2011/CO-EST2011-01.html
*Table 1. Annual Estimates of the Resident Population for Counties of North Dakota: April 1, 2010 to July 1, 2011 (CO-EST2011-01-38)Source: U.S. Census Bureau, Population Division, Release Date: April 2012
Source: Data obtained via job SSKJCC22
AMERICAN INDIAN ASIAN BLACK CAUCASIAN MULTI-
RACIAL OTHER NOT IDENTIFIED
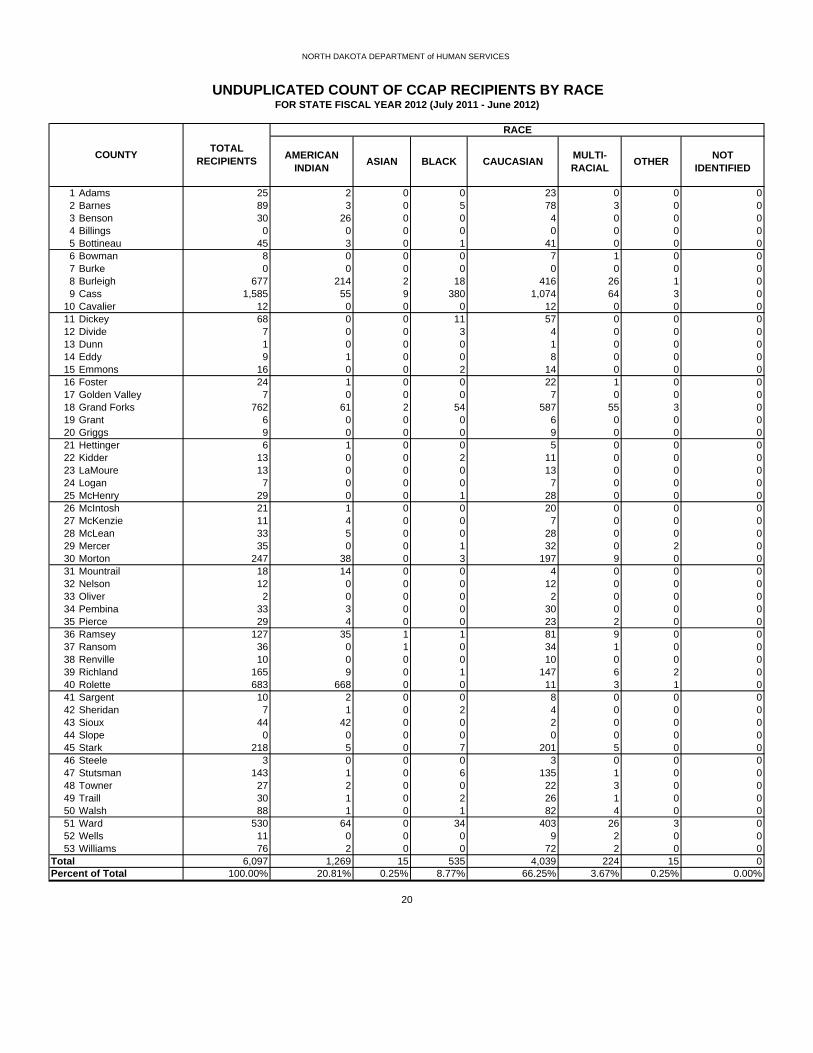
1 Adams 25 2 0 0 23 0 0 02 Barnes 89 3 0 5 78 3 0 03 Benson 30 26 0 0 4 0 0 04 Billings 0 0 0 0 0 0 0 05 Bottineau 45 3 0 1 41 0 0 06 Bowman 8 0 0 0 7 1 0 07 Burke 0 0 0 0 0 0 0 08 Burleigh 677 214 2 18 416 26 1 09 Cass 1,585 55 9 380 1,074 64 3 0
10 Cavalier 12 0 0 0 12 0 0 011 Dickey 68 0 0 11 57 0 0 012 Divide 7 0 0 3 4 0 0 013 Dunn 1 0 0 0 1 0 0 014 Eddy 9 1 0 0 8 0 0 015 Emmons 16 0 0 2 14 0 0 016 Foster 24 1 0 0 22 1 0 017 Golden Valley 7 0 0 0 7 0 0 018 Grand Forks 762 61 2 54 587 55 3 019 Grant 6 0 0 0 6 0 0 020 Griggs 9 0 0 0 9 0 0 021 Hettinger 6 1 0 0 5 0 0 022 Kidder 13 0 0 2 11 0 0 023 LaMoure 13 0 0 0 13 0 0 024 Logan 7 0 0 0 7 0 0 025 McHenry 29 0 0 1 28 0 0 026 McIntosh 21 1 0 0 20 0 0 027 McKenzie 11 4 0 0 7 0 0 028 McLean 33 5 0 0 28 0 0 029 Mercer 35 0 0 1 32 0 2 030 Morton 247 38 0 3 197 9 0 031 Mountrail 18 14 0 0 4 0 0 032 Nelson 12 0 0 0 12 0 0 033 Oliver 2 0 0 0 2 0 0 034 Pembina 33 3 0 0 30 0 0 035 Pierce 29 4 0 0 23 2 0 036 Ramsey 127 35 1 1 81 9 0 037 Ransom 36 0 1 0 34 1 0 038 Renville 10 0 0 0 10 0 0 039 Richland 165 9 0 1 147 6 2 040 Rolette 683 668 0 0 11 3 1 041 Sargent 10 2 0 0 8 0 0 042 Sheridan 7 1 0 2 4 0 0 043 Sioux 44 42 0 0 2 0 0 044 Slope 0 0 0 0 0 0 0 045 Stark 218 5 0 7 201 5 0 046 Steele 3 0 0 0 3 0 0 047 Stutsman 143 1 0 6 135 1 0 048 Towner 27 2 0 0 22 3 0 049 Traill 30 1 0 2 26 1 0 050 Walsh 88 1 0 1 82 4 0 051 Ward 530 64 0 34 403 26 3 052 Wells 11 0 0 0 9 2 0 053 Williams 76 2 0 0 72 2 0 0
6,097 1,269 15 535 4,039 224 15 0100.00% 20.81% 0.25% 8.77% 66.25% 3.67% 0.25% 0.00%
NORTH DAKOTA DEPARTMENT of HUMAN SERVICES
UNDUPLICATED COUNT OF CCAP RECIPIENTS BY RACEFOR STATE FISCAL YEAR 2012 (July 2011 - June 2012)
20
Percent of TotalTotal
RACE
COUNTY TOTAL RECIPIENTS

Under 2 2 Only 3 Only 4-5 6-13 Over 13 Unknown
1 Adams 25 4 4 5 6 6 0 02 Barnes 89 21 13 14 16 25 0 03 Benson 30 5 6 3 8 8 0 04 Billings 0 0 0 0 0 0 0 05 Bottineau 45 7 10 8 11 9 0 06 Bowman 8 3 1 0 2 2 0 07 Burke 0 0 0 0 0 0 0 08 Burleigh 677 172 99 84 190 132 0 09 Cass 1,585 311 219 216 417 422 0 0
10 Cavalier 12 4 1 4 2 1 0 011 Dickey 68 9 9 7 16 27 0 012 Divide 7 2 0 0 2 3 0 013 Dunn 1 0 0 0 0 1 0 014 Eddy 9 3 1 2 2 1 0 015 Emmons 16 5 1 3 4 3 0 016 Foster 24 2 1 2 8 11 0 017 Golden Valley 7 1 1 1 3 1 0 018 Grand Forks 762 175 97 108 204 178 0 019 Grant 6 2 0 0 3 1 0 020 Griggs 9 1 1 2 5 0 0 021 Hettinger 6 3 0 2 1 0 0 022 Kidder 13 2 2 1 2 6 0 023 LaMoure 13 0 1 2 2 8 0 024 Logan 7 1 0 1 1 4 0 025 McHenry 29 9 5 4 6 5 0 026 McIntosh 21 5 4 4 4 4 0 027 McKenzie 11 4 4 2 0 1 0 028 McLean 33 6 7 4 7 9 0 029 Mercer 35 8 3 4 12 8 0 030 Morton 247 48 31 38 51 79 0 031 Mountrail 18 7 2 2 3 4 0 032 Nelson 12 2 2 1 4 3 0 033 Oliver 2 1 0 1 0 0 0 034 Pembina 33 2 3 7 6 15 0 035 Pierce 29 5 5 3 11 5 0 036 Ramsey 127 33 15 19 30 30 0 037 Ransom 36 7 5 6 12 6 0 038 Renville 10 2 2 1 0 5 0 039 Richland 165 43 25 15 29 53 0 040 Rolette 683 145 79 74 142 243 0 041 Sargent 10 3 1 2 1 3 0 042 Sheridan 7 3 0 0 1 3 0 043 Sioux 44 6 4 6 11 17 0 044 Slope 0 0 0 0 0 0 0 045 Stark 218 39 37 29 58 55 0 046 Steele 3 0 0 1 1 1 0 047 Stutsman 143 35 15 19 35 39 0 048 Towner 27 4 3 4 10 6 0 049 Traill 30 9 3 2 13 3 0 050 Walsh 88 22 8 19 25 14 0 051 Ward 530 115 75 83 132 125 0 052 Wells 11 3 2 2 4 0 0 053 Williams 76 21 9 6 24 16 0 0
6,097 1,320 816 823 1,537 1,601 0 0100.00% 21.65% 13.38% 13.50% 25.21% 26.26% 0.00% 0.00%
*Age is based on the number of years between the birth month and the person's last CCAP benefit month in the year.
21
Percent of TotalTotal
NORTH DAKOTA DEPARTMENT of HUMAN SERVICES
UNDUPLICATED COUNT OF CCAP RECIPIENTS BY AGE GROUPFOR STATE FISCAL YEAR 2012 (July 2011 - June 2012)
COUNTY TOTAL RECIPIENTS
AGE GROUP

NUMBER OF RECIPIENTS
PERCENT OF TOTAL RECIPIENTS
1 Northwest 12 Divide 7 0.11%1 Northwest 27 McKenzie 11 0.18%1 Northwest 53 Williams 76 1.25%
Subtotal 94 1.54%2 North Central 5 Bottineau 45 0.74%2 North Central 7 Burke 0 0.00%2 North Central 25 McHenry 29 0.48%2 North Central 31 Mountrail 18 0.30%2 North Central 35 Pierce 29 0.48%2 North Central 38 Renville 10 0.16%2 North Central 51 Ward 530 8.69%
Subtotal 661 10.84%3 Lake Region 3 Benson 30 0.49%3 Lake Region 10 Cavalier 12 0.20%3 Lake Region 14 Eddy 9 0.15%3 Lake Region 36 Ramsey 127 2.08%3 Lake Region 40 Rolette 683 11.20%3 Lake Region 48 Towner 27 0.44%
Subtotal 888 14.56%4 Northeast 18 Grand Forks 762 12.50%4 Northeast 32 Nelson 12 0.20%4 Northeast 34 Pembina 33 0.54%4 Northeast 50 Walsh 88 1.44%
Subtotal 895 14.68%5 Southeast 9 Cass 1,585 26.00%5 Southeast 37 Ransom 36 0.59%5 Southeast 39 Richland 165 2.71%5 Southeast 41 Sargent 10 0.16%5 Southeast 46 Steele 3 0.05%5 Southeast 49 Traill 30 0.49%
Subtotal 1,829 30.00%6 South Central 2 Barnes 89 1.46%6 South Central 11 Dickey 68 1.12%6 South Central 16 Foster 24 0.39%6 South Central 20 Griggs 9 0.15%6 South Central 23 LaMoure 13 0.21%6 South Central 24 Logan 7 0.11%6 South Central 26 McIntosh 21 0.34%6 South Central 47 Stutsman 143 2.35%6 South Central 52 Wells 11 0.18%
Subtotal 385 6.31%7 West Central 8 Burleigh 677 11.10%7 West Central 15 Emmons 16 0.26%7 West Central 19 Grant 6 0.10%7 West Central 22 Kidder 13 0.21%7 West Central 28 McLean 33 0.54%7 West Central 29 Mercer 35 0.57%7 West Central 30 Morton 247 4.05%7 West Central 33 Oliver 2 0.03%7 West Central 42 Sheridan 7 0.11%7 West Central 43 Sioux 44 0.72%
Subtotal 1,080 17.71%8 Badlands 1 Adams 25 0.41%8 Badlands 4 Billings 0 0.00%8 Badlands 6 Bowman 8 0.13%8 Badlands 13 Dunn 1 0.02%8 Badlands 17 Golden Valley 7 0.11%8 Badlands 21 Hettinger 6 0.10%8 Badlands 44 Slope 0 0.00%8 Badlands 45 Stark 218 3.58%
Subtotal 265 4.35%6,097 100.00%State Total
22
NORTH DAKOTA DEPARTMENT of HUMAN SERVICES
UNDUPLICATED COUNT OF CCAP RECIPIENTS BY REGIONFOR STATE FISCAL YEAR 2012 (July 2011 - June 2012)
HUMAN SERVICE CENTER REGION COUNTY
APPENDIX A
CASELOAD TRENDS
SFY 1998 SFY 1999 SFY 2000 SFY 2001 SFY 2003 SFY 2004 SFY 2005 SFY 2006 SFY 2007 SFY 2008 SFY 2009 SFY 2010 SFY 2011 SFY 2012
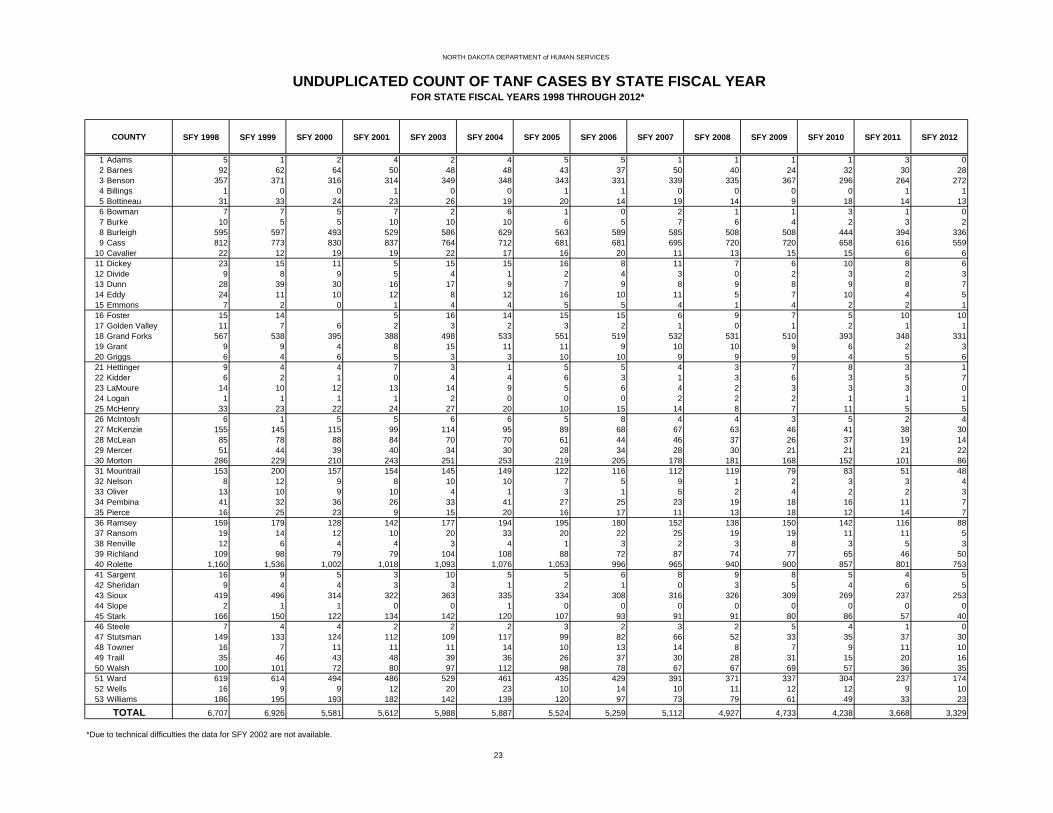
1 Adams 5 1 2 4 2 4 5 5 1 1 1 1 3 02 Barnes 92 62 64 50 48 48 43 37 50 40 24 32 30 283 Benson 357 371 316 314 349 348 343 331 339 335 367 296 264 2724 Billings 1 0 0 1 0 0 1 1 0 0 0 0 1 15 Bottineau 31 33 24 23 26 19 20 14 19 14 9 18 14 136 Bowman 7 7 5 7 2 6 1 0 2 1 1 3 1 07 Burke 10 5 5 10 10 10 6 5 7 6 4 2 3 28 Burleigh 595 597 493 529 586 629 563 589 585 508 508 444 394 3369 Cass 812 773 830 837 764 712 681 681 695 720 720 658 616 559
10 Cavalier 22 12 19 19 22 17 16 20 11 13 15 15 6 611 Dickey 23 15 11 5 15 15 16 8 11 7 6 10 8 612 Divide 9 8 9 5 4 1 2 4 3 0 2 3 2 313 Dunn 28 39 30 16 17 9 7 9 8 9 8 9 8 714 Eddy 24 11 10 12 8 12 16 10 11 5 7 10 4 515 Emmons 7 2 0 1 4 4 5 5 4 1 4 2 2 116 Foster 15 14 5 16 14 15 15 6 9 7 5 10 1017 Golden Valley 11 7 6 2 3 2 3 2 1 0 1 2 1 118 Grand Forks 567 538 395 388 498 533 551 519 532 531 510 393 348 33119 Grant 9 9 4 8 15 11 11 9 10 10 9 6 2 320 Griggs 6 4 6 5 3 3 10 10 9 9 9 4 5 621 Hettinger 9 4 4 7 3 1 5 5 4 3 7 8 3 122 Kidder 6 2 1 0 4 4 6 3 1 3 6 3 5 723 LaMoure 14 10 12 13 14 9 5 6 4 2 3 3 3 024 Logan 1 1 1 1 2 0 0 0 2 2 2 1 1 125 McHenry 33 23 22 24 27 20 10 15 14 8 7 11 5 526 McIntosh 6 1 5 5 6 6 5 8 4 4 3 5 2 427 McKenzie 155 145 115 99 114 95 89 68 67 63 46 41 38 3028 McLean 85 78 88 84 70 70 61 44 46 37 26 37 19 1429 Mercer 51 44 39 40 34 30 28 34 28 30 21 21 21 2230 Morton 286 229 210 243 251 253 219 205 178 181 168 152 101 8631 Mountrail 153 200 157 154 145 149 122 116 112 119 79 83 51 4832 Nelson 8 12 9 8 10 10 7 5 9 1 2 3 3 433 Oliver 13 10 9 10 4 1 3 1 5 2 4 2 2 334 Pembina 41 32 36 26 33 41 27 25 23 19 18 16 11 735 Pierce 16 25 23 9 15 20 16 17 11 13 18 12 14 736 Ramsey 159 179 128 142 177 194 195 180 152 138 150 142 116 8837 Ransom 19 14 12 10 20 33 20 22 25 19 19 11 11 538 Renville 12 6 4 4 3 4 1 3 2 3 8 3 5 339 Richland 109 98 79 79 104 108 88 72 87 74 77 65 46 5040 Rolette 1,160 1,536 1,002 1,018 1,093 1,076 1,053 996 965 940 900 857 801 75341 Sargent 16 9 5 3 10 5 5 6 8 9 8 5 4 542 Sheridan 9 4 4 3 3 1 2 1 0 3 5 4 6 543 Sioux 419 496 314 322 363 335 334 308 316 326 309 269 237 25344 Slope 2 1 1 0 0 1 0 0 0 0 0 0 0 045 Stark 166 150 122 134 142 120 107 93 91 91 80 86 57 4046 Steele 7 4 4 2 2 2 3 2 3 2 5 4 1 047 Stutsman 149 133 124 112 109 117 99 82 66 52 33 35 37 3048 Towner 16 7 11 11 11 14 10 13 14 8 7 9 11 1049 Traill 35 46 43 48 39 36 26 37 30 28 31 15 20 1650 Walsh 100 101 72 80 97 112 98 78 67 67 69 57 36 3551 Ward 619 614 494 486 529 461 435 429 391 371 337 304 237 17452 Wells 16 9 9 12 20 23 10 14 10 11 12 12 9 1053 Williams 186 195 193 182 142 139 120 97 73 79 61 49 33 23
6,707 6,926 5,581 5,612 5,988 5,887 5,524 5,259 5,112 4,927 4,733 4,238 3,668 3,329
*Due to technical difficulties the data for SFY 2002 are not available.
23
COUNTY
TOTAL
NORTH DAKOTA DEPARTMENT of HUMAN SERVICES
FOR STATE FISCAL YEARS 1998 THROUGH 2012*UNDUPLICATED COUNT OF TANF CASES BY STATE FISCAL YEAR

SFY 1998 SFY 1999 SFY 2000 SFY 2001 SFY 2003 SFY 2004 SFY 2005 SFY 2006 SFY 2007 SFY 2008 SFY 2009 SFY 2010 SFY 2011 SFY 2012
1 Adams 67 49 55 63 81 81 87 73 68 68 65 84 88 792 Barnes 367 346 360 369 421 419 431 435 455 465 471 558 605 6113 Benson 484 458 455 484 581 599 621 669 714 755 798 867 924 1,0574 Billings 15 16 14 16 10 6 9 11 8 9 11 12 12 85 Bottineau 198 194 195 207 219 241 261 240 260 284 287 316 324 3366 Bowman 63 63 68 82 74 70 69 74 66 70 86 103 96 897 Burke 47 37 38 43 42 50 44 42 45 51 51 47 50 638 Burleigh 2,220 2,167 2,200 2,347 2,668 2,862 2,887 2,972 2,957 3,094 3,324 3,626 3,967 3,8839 Cass 3,395 3,322 3,265 3,535 4,042 4,475 4,545 4,864 5,020 5,415 6,280 7,436 8,083 8,276
10 Cavalier 109 106 97 115 112 114 110 124 122 129 137 145 147 14411 Dickey 192 177 176 165 212 224 213 213 217 222 235 272 300 28212 Divide 64 56 55 48 47 38 42 42 40 51 72 81 67 7113 Dunn 86 89 79 77 91 91 76 76 73 66 74 92 110 10314 Eddy 86 68 69 87 86 100 94 102 104 100 101 117 116 11215 Emmons 73 68 71 91 90 100 99 98 96 101 116 145 16416 Foster 91 84 74 91 99 99 106 106 102 113 119 120 121 12017 Golden Valley 49 44 42 49 46 66 65 73 73 71 76 87 92 8318 Grand Forks 2,127 2,157 2,160 2,287 2,487 2,641 2,637 2,789 2,770 2,965 3,379 3,807 4,231 4,17119 Grant 106 98 96 104 120 123 114 102 110 106 109 118 121 12520 Griggs 86 89 82 113 92 101 96 91 97 96 85 113 109 9721 Hettinger 64 50 55 61 56 59 72 65 72 60 70 80 83 7222 Kidder 46 38 39 45 46 45 55 51 49 44 70 86 105 10823 LaMoure 75 69 71 92 96 102 80 84 94 95 111 125 124 13424 Logan 59 48 41 45 50 41 36 50 49 40 43 57 59 5425 McHenry 226 204 187 208 215 229 211 218 218 218 235 268 246 27126 McIntosh 79 62 64 73 99 112 113 112 95 104 93 114 117 11927 McKenzie 295 285 258 241 260 250 260 258 261 241 247 278 274 28428 McLean 257 261 256 295 299 302 271 267 258 262 256 287 309 30129 Mercer 189 165 152 175 204 206 202 199 211 231 240 249 264 25130 Morton 980 918 876 962 1,033 1,157 1,174 1,179 1,182 1,235 1,321 1,518 1,488 1,37831 Mountrail 272 295 276 275 291 304 290 301 302 312 302 333 316 28932 Nelson 54 49 53 71 80 93 65 76 83 74 87 110 112 11033 Oliver 35 37 39 36 31 32 40 38 30 41 47 52 53 6034 Pembina 272 231 238 222 216 246 245 239 209 214 249 278 288 29235 Pierce 127 140 136 168 182 179 186 186 181 188 199 220 227 24136 Ramsey 601 595 541 605 652 722 742 735 734 763 801 875 901 84137 Ransom 93 100 107 126 160 169 177 177 212 193 221 256 264 24438 Renville 63 66 48 54 75 75 69 62 59 61 74 79 75 8039 Richland 574 536 479 533 576 600 605 617 623 623 704 819 890 87040 Rolette 1,807 1,743 1,779 1,940 2,230 2,371 2,481 2,531 2,505 2,564 2,751 3,066 3,298 3,32541 Sargent 88 80 86 91 86 94 84 87 87 89 119 121 115 12242 Sheridan 66 69 76 85 80 75 83 78 76 87 99 113 101 9943 Sioux 614 541 499 522 608 707 743 786 845 894 955 1,016 1,065 1,13344 Slope 17 20 17 16 14 14 13 12 11 9 10 11 15 1545 Stark 1,003 989 958 1,032 1,110 1,173 1,169 1,155 1,137 1,156 1,212 1,336 1,242 1,11546 Steele 50 50 47 45 43 47 46 49 40 35 50 54 56 6047 Stutsman 856 787 798 873 976 1,041 1,058 1,115 1,109 1,155 1,201 1,395 1,494 1,41848 Towner 72 72 54 64 68 78 71 77 80 80 93 97 101 10349 Traill 252 237 246 260 262 286 273 288 297 304 320 461 400 43750 Walsh 518 465 459 576 518 558 574 558 557 560 591 623 662 68551 Ward 2,211 2,223 2,218 2,448 2,596 2,693 2,632 2,755 2,774 2,827 2,896 3,182 3,256 2,89552 Wells 160 131 142 165 183 181 175 181 187 197 216 231 241 25953 Williams 856 870 847 818 865 890 898 850 805 800 823 920 911 1,103
22,856 22,114 21,722 23,575 25,881 27,621 27,800 28,633 28,831 29,982 32,567 36,827 38,860 38,642
*Due to technical difficulties the data for SFY 2002 are not available.24
TOTAL
COUNTY
NORTH DAKOTA DEPARTMENT of HUMAN SERVICES
UNDUPLICATED COUNT OF SNAP CASES BY STATE FISCAL YEARFOR STATE FISCAL YEARS 1998 THROUGH 2012*
SFY 1998 SFY 1999 SFY 2000 SFY 2001 SFY 2003 SFY 2004 SFY 2005 SFY 2006 SFY 2007 SFY 2008 SFY 2009 SFY 2010 SFY 2011 SFY 2012
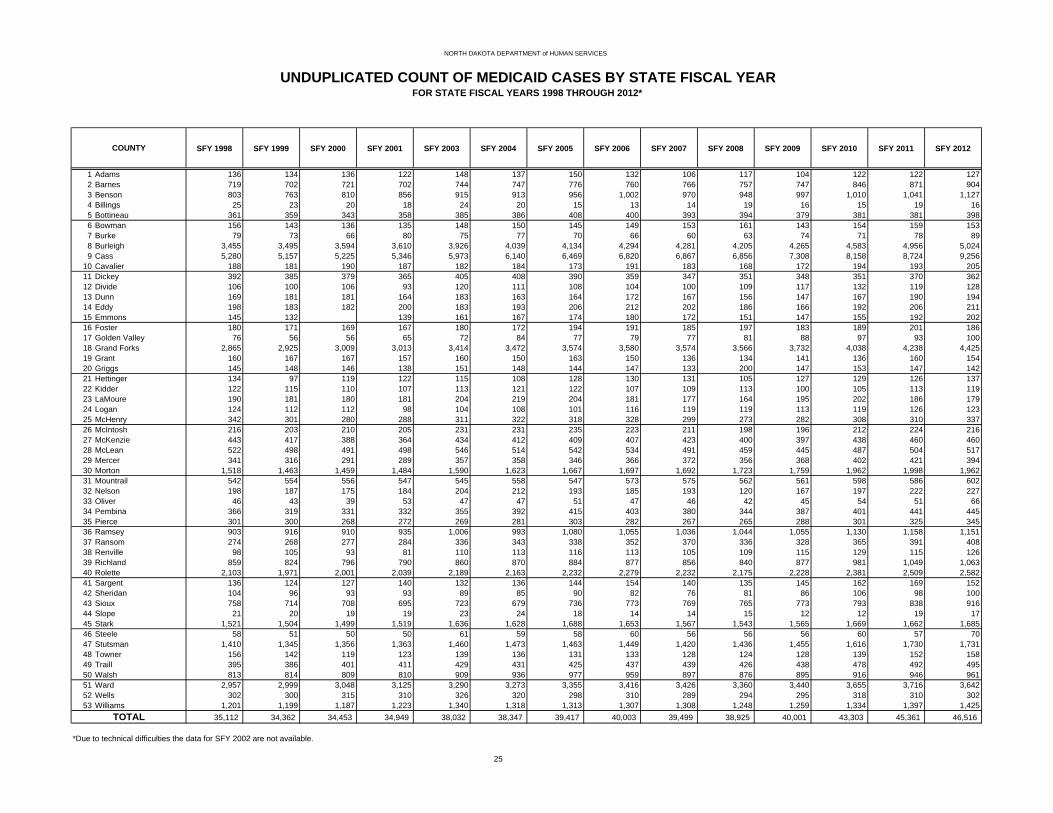
1 Adams 136 134 136 122 148 137 150 132 106 117 104 122 122 1272 Barnes 719 702 721 702 744 747 776 760 766 757 747 846 871 9043 Benson 803 763 810 856 915 913 956 1,002 970 948 997 1,010 1,041 1,1274 Billings 25 23 20 18 24 20 15 13 14 19 16 15 19 165 Bottineau 361 359 343 358 385 386 408 400 393 394 379 381 381 3986 Bowman 156 143 136 135 148 150 145 149 153 161 143 154 159 1537 Burke 79 73 66 80 75 77 70 66 60 63 74 71 78 898 Burleigh 3,455 3,495 3,594 3,610 3,926 4,039 4,134 4,294 4,281 4,205 4,265 4,583 4,956 5,0249 Cass 5,280 5,157 5,225 5,346 5,973 6,140 6,469 6,820 6,867 6,856 7,308 8,158 8,724 9,256
10 Cavalier 188 181 190 187 182 184 173 191 183 168 172 194 193 20511 Dickey 392 385 379 365 405 408 390 359 347 351 348 351 370 36212 Divide 106 100 106 93 120 111 108 104 100 109 117 132 119 12813 Dunn 169 181 181 164 183 163 164 172 167 156 147 167 190 19414 Eddy 198 183 182 200 183 193 206 212 202 186 166 192 206 21115 Emmons 145 132 139 161 167 174 180 172 151 147 155 192 20216 Foster 180 171 169 167 180 172 194 191 185 197 183 189 201 18617 Golden Valley 76 56 56 65 72 84 77 79 77 81 88 97 93 10018 Grand Forks 2,865 2,925 3,009 3,013 3,414 3,472 3,574 3,580 3,574 3,566 3,732 4,038 4,238 4,42519 Grant 160 167 167 157 160 150 163 150 136 134 141 136 160 15420 Griggs 145 148 146 138 151 148 144 147 133 200 147 153 147 14221 Hettinger 134 97 119 122 115 108 128 130 131 105 127 129 126 13722 Kidder 122 115 110 107 113 121 122 107 109 113 100 105 113 11923 LaMoure 190 181 180 181 204 219 204 181 177 164 195 202 186 17924 Logan 124 112 112 98 104 108 101 116 119 119 113 119 126 12325 McHenry 342 301 280 288 311 322 318 328 299 273 282 308 310 33726 McIntosh 216 203 210 205 231 231 235 223 211 198 196 212 224 21627 McKenzie 443 417 388 364 434 412 409 407 423 400 397 438 460 46028 McLean 522 498 491 498 546 514 542 534 491 459 445 487 504 51729 Mercer 341 316 291 289 357 358 346 366 372 356 368 402 421 39430 Morton 1,518 1,463 1,459 1,484 1,590 1,623 1,667 1,697 1,692 1,723 1,759 1,962 1,998 1,96231 Mountrail 542 554 556 547 545 558 547 573 575 562 561 598 586 60232 Nelson 198 187 175 184 204 212 193 185 193 120 167 197 222 22733 Oliver 46 43 39 53 47 47 51 47 46 42 45 54 51 6634 Pembina 366 319 331 332 355 392 415 403 380 344 387 401 441 44535 Pierce 301 300 268 272 269 281 303 282 267 265 288 301 325 34536 Ramsey 903 916 910 935 1,006 993 1,080 1,055 1,036 1,044 1,055 1,130 1,158 1,15137 Ransom 274 268 277 284 336 343 338 352 370 336 328 365 391 40838 Renville 98 105 93 81 110 113 116 113 105 109 115 129 115 12639 Richland 859 824 796 790 860 870 884 877 856 840 877 981 1,049 1,06340 Rolette 2,103 1,971 2,001 2,039 2,189 2,163 2,232 2,279 2,232 2,175 2,228 2,381 2,509 2,58241 Sargent 136 124 127 140 132 136 144 154 140 135 145 162 169 15242 Sheridan 104 96 93 93 89 85 90 82 76 81 86 106 98 10043 Sioux 758 714 708 695 723 679 736 773 769 765 773 793 838 91644 Slope 21 20 19 19 23 24 18 14 14 15 12 12 19 1745 Stark 1,521 1,504 1,499 1,519 1,636 1,628 1,688 1,653 1,567 1,543 1,565 1,669 1,662 1,68546 Steele 58 51 50 50 61 59 58 60 56 56 56 60 57 7047 Stutsman 1,410 1,345 1,356 1,363 1,460 1,473 1,463 1,449 1,420 1,436 1,455 1,616 1,730 1,73148 Towner 156 142 119 123 139 136 131 133 128 124 128 139 152 15849 Traill 395 386 401 411 429 431 425 437 439 426 438 478 492 49550 Walsh 813 814 809 810 909 936 977 959 897 876 895 916 946 96151 Ward 2,957 2,999 3,048 3,125 3,290 3,273 3,355 3,416 3,426 3,360 3,440 3,655 3,716 3,64252 Wells 302 300 315 310 326 320 298 310 289 294 295 318 310 30253 Williams 1,201 1,199 1,187 1,223 1,340 1,318 1,313 1,307 1,308 1,248 1,259 1,334 1,397 1,425
35,112 34,362 34,453 34,949 38,032 38,347 39,417 40,003 39,499 38,925 40,001 43,303 45,361 46,516
*Due to technical difficulties the data for SFY 2002 are not available.
25
COUNTY
TOTAL
NORTH DAKOTA DEPARTMENT of HUMAN SERVICES
UNDUPLICATED COUNT OF MEDICAID CASES BY STATE FISCAL YEARFOR STATE FISCAL YEARS 1998 THROUGH 2012*
SFY 1998 SFY 1999 SFY 2000 SFY 2001 SFY 2003 SFY 2004 SFY 2005 SFY 2006 SFY 2007 SFY 2008 SFY 2009 SFY 2010 SFY 2011 SFY 2012
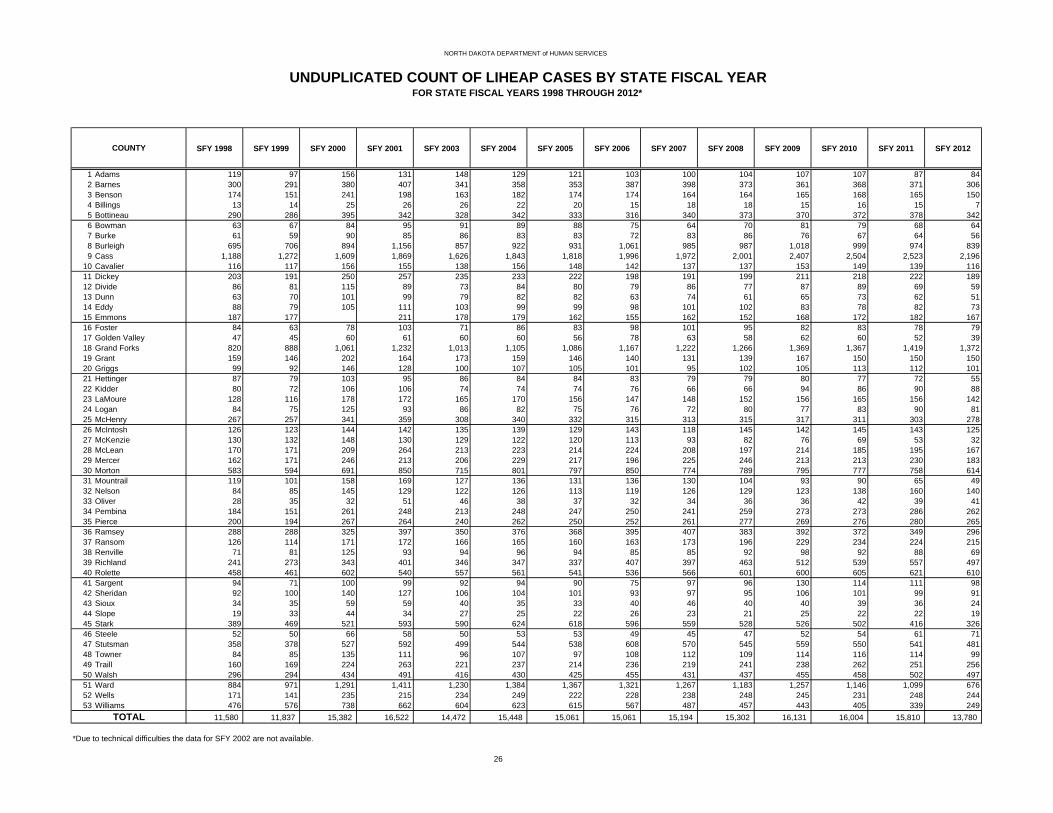
1 Adams 119 97 156 131 148 129 121 103 100 104 107 107 87 842 Barnes 300 291 380 407 341 358 353 387 398 373 361 368 371 3063 Benson 174 151 241 198 163 182 174 174 164 164 165 168 165 1504 Billings 13 14 25 26 26 22 20 15 18 18 15 16 15 75 Bottineau 290 286 395 342 328 342 333 316 340 373 370 372 378 3426 Bowman 63 67 84 95 91 89 88 75 64 70 81 79 68 647 Burke 61 59 90 85 86 83 83 72 83 86 76 67 64 568 Burleigh 695 706 894 1,156 857 922 931 1,061 985 987 1,018 999 974 8399 Cass 1,188 1,272 1,609 1,869 1,626 1,843 1,818 1,996 1,972 2,001 2,407 2,504 2,523 2,196
10 Cavalier 116 117 156 155 138 156 148 142 137 137 153 149 139 11611 Dickey 203 191 250 257 235 233 222 198 191 199 211 218 222 18912 Divide 86 81 115 89 73 84 80 79 86 77 87 89 69 5913 Dunn 63 70 101 99 79 82 82 63 74 61 65 73 62 5114 Eddy 88 79 105 111 103 99 99 98 101 102 83 78 82 7315 Emmons 187 177 211 178 179 162 155 162 152 168 172 182 16716 Foster 84 63 78 103 71 86 83 98 101 95 82 83 78 7917 Golden Valley 47 45 60 61 60 60 56 78 63 58 62 60 52 3918 Grand Forks 820 888 1,061 1,232 1,013 1,105 1,086 1,167 1,222 1,266 1,369 1,367 1,419 1,37219 Grant 159 146 202 164 173 159 146 140 131 139 167 150 150 15020 Griggs 99 92 146 128 100 107 105 101 95 102 105 113 112 10121 Hettinger 87 79 103 95 86 84 84 83 79 79 80 77 72 5522 Kidder 80 72 106 106 74 74 74 76 66 66 94 86 90 8823 LaMoure 128 116 178 172 165 170 156 147 148 152 156 165 156 14224 Logan 84 75 125 93 86 82 75 76 72 80 77 83 90 8125 McHenry 267 257 341 359 308 340 332 315 313 315 317 311 303 27826 McIntosh 126 123 144 142 135 139 129 143 118 145 142 145 143 12527 McKenzie 130 132 148 130 129 122 120 113 93 82 76 69 53 3228 McLean 170 171 209 264 213 223 214 224 208 197 214 185 195 16729 Mercer 162 171 246 213 206 229 217 196 225 246 213 213 230 18330 Morton 583 594 691 850 715 801 797 850 774 789 795 777 758 61431 Mountrail 119 101 158 169 127 136 131 136 130 104 93 90 65 4932 Nelson 84 85 145 129 122 126 113 119 126 129 123 138 160 14033 Oliver 28 35 32 51 46 38 37 32 34 36 36 42 39 4134 Pembina 184 151 261 248 213 248 247 250 241 259 273 273 286 26235 Pierce 200 194 267 264 240 262 250 252 261 277 269 276 280 26536 Ramsey 288 288 325 397 350 376 368 395 407 383 392 372 349 29637 Ransom 126 114 171 172 166 165 160 163 173 196 229 234 224 21538 Renville 71 81 125 93 94 96 94 85 85 92 98 92 88 6939 Richland 241 273 343 401 346 347 337 407 397 463 512 539 557 49740 Rolette 458 461 602 540 557 561 541 536 566 601 600 605 621 61041 Sargent 94 71 100 99 92 94 90 75 97 96 130 114 111 9842 Sheridan 92 100 140 127 106 104 101 93 97 95 106 101 99 9143 Sioux 34 35 59 59 40 35 33 40 46 40 40 39 36 2444 Slope 19 33 44 34 27 25 22 26 23 21 25 22 22 1945 Stark 389 469 521 593 590 624 618 596 559 528 526 502 416 32646 Steele 52 50 66 58 50 53 53 49 45 47 52 54 61 7147 Stutsman 358 378 527 592 499 544 538 608 570 545 559 550 541 48148 Towner 84 85 135 111 96 107 97 108 112 109 114 116 114 9949 Traill 160 169 224 263 221 237 214 236 219 241 238 262 251 25650 Walsh 296 294 434 491 416 430 425 455 431 437 455 458 502 49751 Ward 884 971 1,291 1,411 1,230 1,384 1,367 1,321 1,267 1,183 1,257 1,146 1,099 67652 Wells 171 141 235 215 234 249 222 228 238 248 245 231 248 24453 Williams 476 576 738 662 604 623 615 567 487 457 443 405 339 249
11,580 11,837 15,382 16,522 14,472 15,448 15,061 15,061 15,194 15,302 16,131 16,004 15,810 13,780
*Due to technical difficulties the data for SFY 2002 are not available.
26
COUNTY
TOTAL
NORTH DAKOTA DEPARTMENT of HUMAN SERVICES
UNDUPLICATED COUNT OF LIHEAP CASES BY STATE FISCAL YEARFOR STATE FISCAL YEARS 1998 THROUGH 2012*
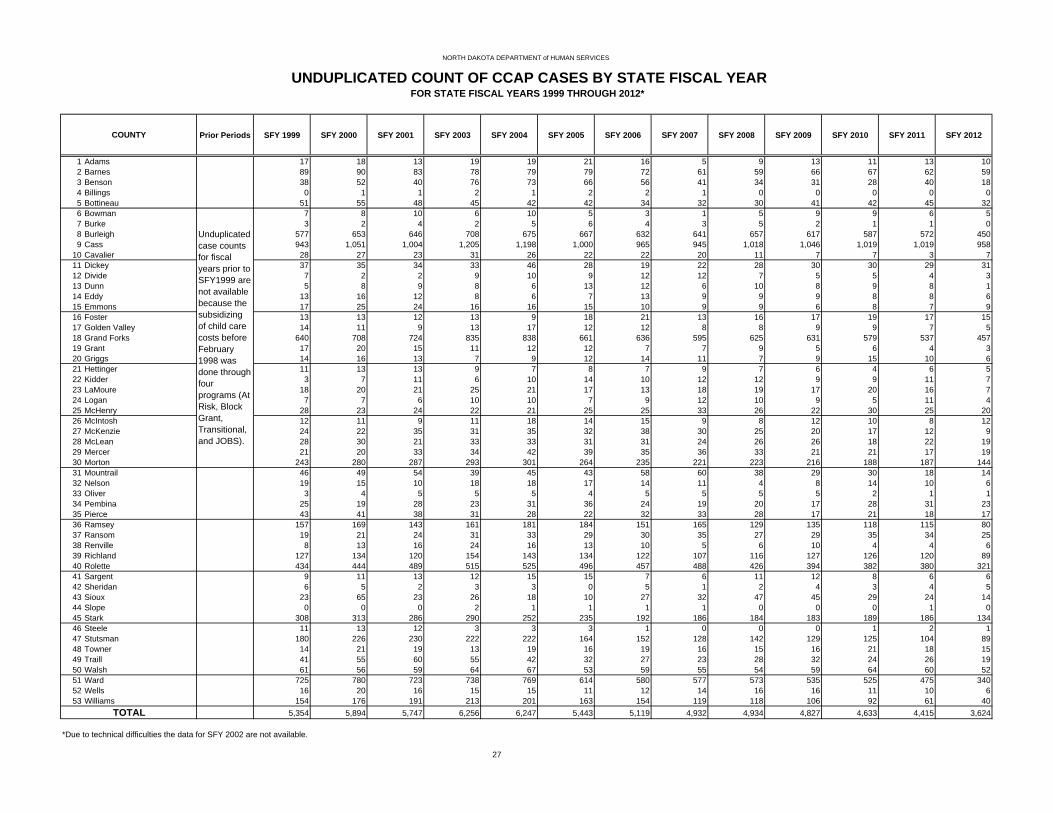
Prior Periods SFY 1999 SFY 2000 SFY 2001 SFY 2003 SFY 2004 SFY 2005 SFY 2006 SFY 2007 SFY 2008 SFY 2009 SFY 2010 SFY 2011 SFY 2012
1 Adams 17 18 13 19 19 21 16 5 9 13 11 13 102 Barnes 89 90 83 78 79 79 72 61 59 66 67 62 593 Benson 38 52 40 76 73 66 56 41 34 31 28 40 184 Billings 0 1 1 2 1 2 2 1 0 0 0 0 05 Bottineau 51 55 48 45 42 42 34 32 30 41 42 45 326 Bowman 7 8 10 6 10 5 3 1 5 9 9 6 57 Burke 3 2 4 2 5 6 4 3 5 2 1 1 08 Burleigh 577 653 646 708 675 667 632 641 657 617 587 572 4509 Cass 943 1,051 1,004 1,205 1,198 1,000 965 945 1,018 1,046 1,019 1,019 958
10 Cavalier 28 27 23 31 26 22 22 20 11 7 7 3 711 Dickey 37 35 34 33 46 28 19 22 28 30 30 29 3112 Divide 7 2 2 9 10 9 12 12 7 5 5 4 313 Dunn 5 8 9 8 6 13 12 6 10 8 9 8 114 Eddy 13 16 12 8 6 7 13 9 9 9 8 8 615 Emmons 17 25 24 16 16 15 10 9 9 6 8 7 916 Foster 13 13 12 13 9 18 21 13 16 17 19 17 1517 Golden Valley 14 11 9 13 17 12 12 8 8 9 9 7 518 Grand Forks 640 708 724 835 838 661 636 595 625 631 579 537 45719 Grant 17 20 15 11 12 12 7 7 9 5 6 4 320 Griggs 14 16 13 7 9 12 14 11 7 9 15 10 621 Hettinger 11 13 13 9 7 8 7 9 7 6 4 6 522 Kidder 3 7 11 6 10 14 10 12 12 9 9 11 723 LaMoure 18 20 21 25 21 17 13 18 19 17 20 16 724 Logan 7 7 6 10 10 7 9 12 10 9 5 11 425 McHenry 28 23 24 22 21 25 25 33 26 22 30 25 2026 McIntosh 12 11 9 11 18 14 15 9 8 12 10 8 1227 McKenzie 24 22 35 31 35 32 38 30 25 20 17 12 928 McLean 28 30 21 33 33 31 31 24 26 26 18 22 1929 Mercer 21 20 33 34 42 39 35 36 33 21 21 17 1930 Morton 243 280 287 293 301 264 235 221 223 216 188 187 14431 Mountrail 46 49 54 39 45 43 58 60 38 29 30 18 1432 Nelson 19 15 10 18 18 17 14 11 4 8 14 10 633 Oliver 3 4 5 5 5 4 5 5 5 5 2 1 134 Pembina 25 19 28 23 31 36 24 19 20 17 28 31 2335 Pierce 43 41 38 31 28 22 32 33 28 17 21 18 1736 Ramsey 157 169 143 161 181 184 151 165 129 135 118 115 8037 Ransom 19 21 24 31 33 29 30 35 27 29 35 34 2538 Renville 8 13 16 24 16 13 10 5 6 10 4 4 639 Richland 127 134 120 154 143 134 122 107 116 127 126 120 8940 Rolette 434 444 489 515 525 496 457 488 426 394 382 380 32141 Sargent 9 11 13 12 15 15 7 6 11 12 8 6 642 Sheridan 6 5 2 3 3 0 5 1 2 4 3 4 543 Sioux 23 65 23 26 18 10 27 32 47 45 29 24 1444 Slope 0 0 0 2 1 1 1 1 0 0 0 1 045 Stark 308 313 286 290 252 235 192 186 184 183 189 186 13446 Steele 11 13 12 3 3 3 1 0 0 0 1 2 147 Stutsman 180 226 230 222 222 164 152 128 142 129 125 104 8948 Towner 14 21 19 13 19 16 19 16 15 16 21 18 1549 Traill 41 55 60 55 42 32 27 23 28 32 24 26 1950 Walsh 61 56 59 64 67 53 59 55 54 59 64 60 5251 Ward 725 780 723 738 769 614 580 577 573 535 525 475 34052 Wells 16 20 16 15 15 11 12 14 16 16 11 10 653 Williams 154 176 191 213 201 163 154 119 118 106 92 61 40
5,354 5,894 5,747 6,256 6,247 5,443 5,119 4,932 4,934 4,827 4,633 4,415 3,624
*Due to technical difficulties the data for SFY 2002 are not available.
27
TOTAL
COUNTY
Unduplicated case counts for fiscal years prior to SFY1999 are not available because the subsidizing of child care costs before February 1998 was done through four programs (At Risk, Block Grant, Transitional, and JOBS).
NORTH DAKOTA DEPARTMENT of HUMAN SERVICES
UNDUPLICATED COUNT OF CCAP CASES BY STATE FISCAL YEARFOR STATE FISCAL YEARS 1999 THROUGH 2012*

APPENDIX B
RECIPIENT TRENDS

SFY 1998 SFY 1999 SFY 2000 SFY 2001 SFY 2003 SFY 2004 SFY 2005 SFY 2006 SFY 2007 SFY 2008 SFY 2009 SFY 2010 SFY 2011 SFY 2012
1 Adams 16 4 6 8 5 10 12 12 1 1 1 1 5 02 Barnes 236 167 173 125 127 115 112 91 122 91 49 69 72 653 Benson 1,136 988 972 933 1,023 1,003 976 939 955 960 1,015 806 741 7844 Billings 3 0 0 2 0 0 2 2 0 0 0 0 4 25 Bottineau 84 90 75 61 57 39 44 32 54 42 23 43 34 316 Bowman 16 16 11 18 6 13 3 0 7 3 5 8 2 07 Burke 26 14 20 37 28 29 9 11 16 15 15 5 8 48 Burleigh 1,589 1,361 1,399 1,468 1,566 1,709 1,498 1,600 1,626 1,431 1,354 1,095 998 8609 Cass 2,165 2,107 2,510 2,585 2,041 1,917 1,791 1,839 1,830 1,926 1,905 1,654 1,520 1,384
10 Cavalier 65 37 67 57 63 52 48 64 31 36 44 38 14 1111 Dickey 66 47 37 15 43 42 39 20 20 17 13 19 23 1612 Divide 18 18 18 12 8 1 7 11 7 0 3 5 3 613 Dunn 87 89 81 41 46 30 25 27 24 25 27 28 21 1114 Eddy 59 33 27 37 25 35 47 34 30 12 18 24 14 1315 Emmons 15 5 3 11 13 10 16 16 3 13 4 5 216 Foster 42 33 24 10 53 38 40 38 13 27 16 13 23 1917 Golden Valley 26 17 15 3 12 10 10 4 3 0 2 5 2 218 Grand Forks 1,560 1,274 1,101 1,077 1,269 1,393 1,430 1,343 1,386 1,389 1,347 995 870 80019 Grant 33 30 18 23 47 28 24 20 25 27 20 14 2 520 Griggs 13 16 14 17 11 9 28 31 27 27 30 12 11 1221 Hettinger 21 11 8 14 6 1 9 8 11 10 22 25 9 222 Kidder 19 5 3 0 7 10 17 7 3 7 17 8 16 1923 LaMoure 37 22 31 39 35 21 14 14 5 6 7 7 8 024 Logan 3 2 2 3 5 0 0 0 5 6 6 3 3 325 McHenry 100 66 61 65 85 60 24 42 31 17 14 27 13 826 McIntosh 14 4 15 11 16 19 16 21 10 12 8 9 3 927 McKenzie 466 441 366 296 302 274 251 180 176 181 130 98 98 7528 McLean 248 181 244 245 207 176 150 121 129 106 78 102 44 3729 Mercer 136 116 99 107 94 91 63 80 64 77 51 43 46 5130 Morton 788 596 575 658 655 699 626 539 461 493 452 369 261 19331 Mountrail 431 480 472 458 419 421 335 333 321 315 207 209 144 13032 Nelson 19 28 22 23 25 25 24 15 24 3 5 13 8 1033 Oliver 30 20 21 29 10 4 8 2 11 4 9 6 5 634 Pembina 120 74 89 62 87 102 73 76 60 48 55 36 30 1935 Pierce 44 57 70 18 36 48 46 50 30 43 37 31 33 1936 Ramsey 441 416 350 378 455 535 538 495 406 334 367 349 283 18737 Ransom 41 35 33 24 52 96 54 63 66 43 47 23 23 938 Renville 33 17 12 18 6 12 4 7 5 9 25 8 19 839 Richland 297 269 225 206 259 271 244 186 227 197 196 147 103 10340 Rolette 3,420 3,046 2,934 2,933 3,066 2,951 2,865 2,704 2,588 2,511 2,439 2,288 2,130 1,95541 Sargent 39 22 18 9 24 11 12 13 18 22 13 12 11 1342 Sheridan 19 12 14 11 9 2 4 2 0 4 11 9 9 943 Sioux 1,098 944 790 802 914 928 894 826 812 838 797 669 586 64044 Slope 6 2 2 0 2 0 0 0 0 0 0 0 045 Stark 442 409 325 351 353 278 273 226 229 236 206 224 127 9446 Steele 21 15 9 3 6 4 7 3 6 5 16 7 2 047 Stutsman 395 328 338 299 278 288 263 226 166 125 90 83 84 6148 Towner 45 14 26 28 29 35 19 33 29 19 14 17 26 2149 Traill 113 131 140 159 104 85 61 87 74 67 86 42 47 4450 Walsh 289 213 201 227 271 315 267 200 178 188 192 151 102 11251 Ward 1,573 1,413 1,299 1,271 1,367 1,193 1,132 1,083 972 934 839 735 562 42252 Wells 49 22 23 38 55 57 26 31 21 24 24 29 18 2653 Williams 478 515 553 518 368 372 302 236 173 194 140 115 94 50
18,530 16,272 15,938 15,835 16,046 15,872 14,776 14,043 13,504 13,110 12,500 10,732 9,319 8,362
*Due to technical difficulties the data for SFY 2002 are not available.
28
COUNTY
TOTAL
NORTH DAKOTA DEPARTMENT of HUMAN SERVICES
UNDUPLICATED COUNT OF TANF RECIPIENTS BY STATE FISCAL YEARFOR STATE FISCAL YEARS 1998 THROUGH 2012*
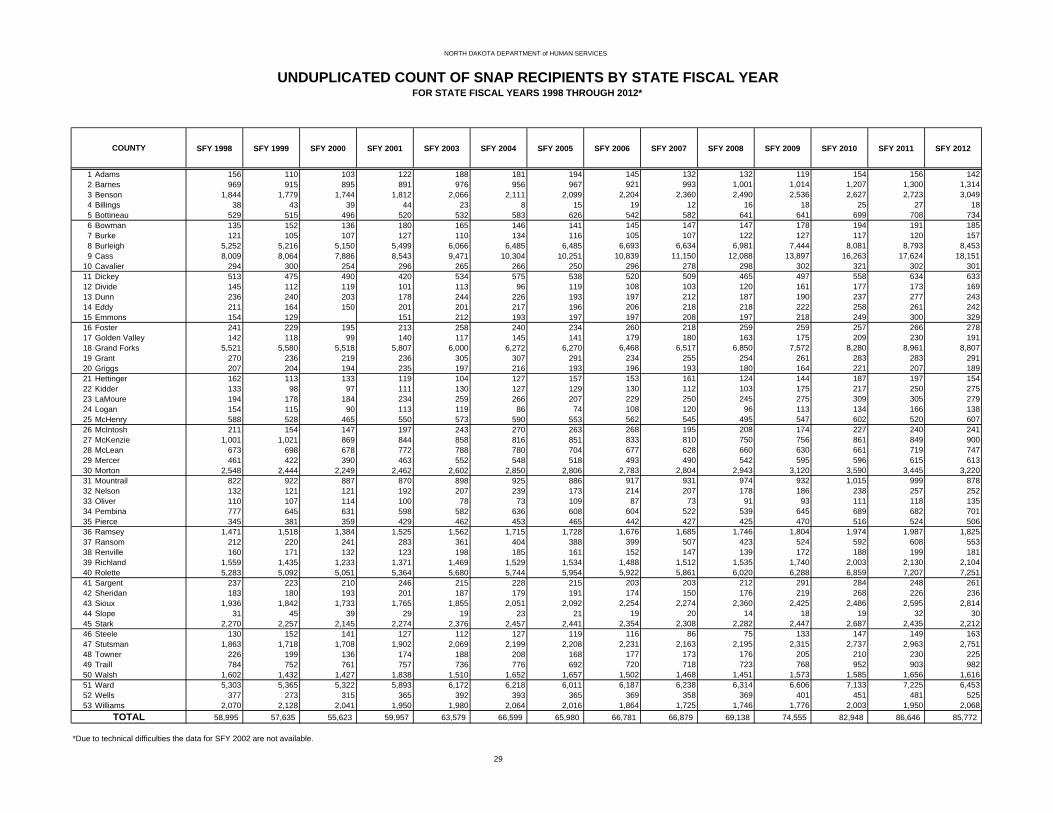
SFY 1998 SFY 1999 SFY 2000 SFY 2001 SFY 2003 SFY 2004 SFY 2005 SFY 2006 SFY 2007 SFY 2008 SFY 2009 SFY 2010 SFY 2011 SFY 2012
1 Adams 156 110 103 122 188 181 194 145 132 132 119 154 156 1422 Barnes 969 915 895 891 976 956 967 921 993 1,001 1,014 1,207 1,300 1,3143 Benson 1,844 1,779 1,744 1,812 2,066 2,111 2,099 2,204 2,360 2,490 2,536 2,627 2,723 3,0494 Billings 38 43 39 44 23 8 15 19 12 16 18 25 27 185 Bottineau 529 515 496 520 532 583 626 542 582 641 641 699 708 7346 Bowman 135 152 136 180 165 146 141 145 147 147 178 194 191 1857 Burke 121 105 107 127 110 134 116 105 107 122 127 117 120 1578 Burleigh 5,252 5,216 5,150 5,499 6,066 6,485 6,485 6,693 6,634 6,981 7,444 8,081 8,793 8,4539 Cass 8,009 8,064 7,886 8,543 9,471 10,304 10,251 10,839 11,150 12,088 13,897 16,263 17,624 18,151
10 Cavalier 294 300 254 296 265 266 250 296 278 298 302 321 302 30111 Dickey 513 475 490 420 534 575 538 520 509 465 497 558 634 63312 Divide 145 112 119 101 113 96 119 108 103 120 161 177 173 16913 Dunn 236 240 203 178 244 226 193 197 212 187 190 237 277 24314 Eddy 211 164 150 201 201 217 196 206 218 218 222 258 261 24215 Emmons 154 129 151 212 193 197 197 208 197 218 249 300 32916 Foster 241 229 195 213 258 240 234 260 218 259 259 257 266 27817 Golden Valley 142 118 99 140 117 145 141 179 180 163 175 209 230 19118 Grand Forks 5,521 5,580 5,518 5,807 6,000 6,272 6,270 6,468 6,517 6,850 7,572 8,280 8,961 8,80719 Grant 270 236 219 236 305 307 291 234 255 254 261 283 283 29120 Griggs 207 204 194 235 197 216 193 196 193 180 164 221 207 18921 Hettinger 162 113 133 119 104 127 157 153 161 124 144 187 197 15422 Kidder 133 98 97 111 130 127 129 130 112 103 175 217 250 27523 LaMoure 194 178 184 234 259 266 207 229 250 245 275 309 305 27924 Logan 154 115 90 113 119 86 74 108 120 96 113 134 166 13825 McHenry 588 528 465 550 573 590 553 562 545 495 547 602 520 60726 McIntosh 211 154 147 197 243 270 263 268 195 208 174 227 240 24127 McKenzie 1,001 1,021 869 844 858 816 851 833 810 750 756 861 849 90028 McLean 673 698 678 772 788 780 704 677 628 660 630 661 719 74729 Mercer 461 422 390 463 552 548 518 493 490 542 595 596 615 61330 Morton 2,548 2,444 2,249 2,462 2,602 2,850 2,806 2,783 2,804 2,943 3,120 3,590 3,445 3,22031 Mountrail 822 922 887 870 898 925 886 917 931 974 932 1,015 999 87832 Nelson 132 121 121 192 207 239 173 214 207 178 186 238 257 25233 Oliver 110 107 114 100 78 73 109 87 73 91 93 111 118 13534 Pembina 777 645 631 598 582 636 608 604 522 539 645 689 682 70135 Pierce 345 381 359 429 462 453 465 442 427 425 470 516 524 50636 Ramsey 1,471 1,518 1,384 1,525 1,562 1,715 1,728 1,676 1,685 1,746 1,804 1,974 1,987 1,82537 Ransom 212 220 241 283 361 404 388 399 507 423 524 592 608 55338 Renville 160 171 132 123 198 185 161 152 147 139 172 188 199 18139 Richland 1,559 1,435 1,233 1,371 1,469 1,529 1,534 1,488 1,512 1,535 1,740 2,003 2,130 2,10440 Rolette 5,283 5,092 5,051 5,364 5,680 5,744 5,954 5,922 5,861 6,020 6,288 6,859 7,207 7,25141 Sargent 237 223 210 246 215 228 215 203 203 212 291 284 248 26142 Sheridan 183 180 193 201 187 179 191 174 150 176 219 268 226 23643 Sioux 1,936 1,842 1,733 1,765 1,855 2,051 2,092 2,254 2,274 2,360 2,425 2,486 2,595 2,81444 Slope 31 45 39 29 19 23 21 19 20 14 18 19 32 3045 Stark 2,270 2,257 2,145 2,274 2,376 2,457 2,441 2,354 2,308 2,282 2,447 2,687 2,435 2,21246 Steele 130 152 141 127 112 127 119 116 86 75 133 147 149 16347 Stutsman 1,863 1,718 1,708 1,902 2,069 2,199 2,208 2,231 2,163 2,195 2,315 2,737 2,963 2,75148 Towner 226 199 136 174 188 208 168 177 173 176 205 210 230 22549 Traill 784 752 761 757 736 776 692 720 718 723 768 952 903 98250 Walsh 1,602 1,432 1,427 1,838 1,510 1,652 1,657 1,502 1,468 1,451 1,573 1,585 1,656 1,61651 Ward 5,303 5,365 5,322 5,893 6,172 6,218 6,011 6,187 6,238 6,314 6,606 7,133 7,225 6,45352 Wells 377 273 315 365 392 393 365 369 358 369 401 451 481 52553 Williams 2,070 2,128 2,041 1,950 1,980 2,064 2,016 1,864 1,725 1,746 1,776 2,003 1,950 2,068
58,995 57,635 55,623 59,957 63,579 66,599 65,980 66,781 66,879 69,138 74,555 82,948 86,646 85,772
*Due to technical difficulties the data for SFY 2002 are not available.
29
TOTAL
COUNTY
NORTH DAKOTA DEPARTMENT of HUMAN SERVICES
UNDUPLICATED COUNT OF SNAP RECIPIENTS BY STATE FISCAL YEARFOR STATE FISCAL YEARS 1998 THROUGH 2012*

SFY 1998 SFY 1999 SFY 2000 SFY 2001 SFY 2003 SFY 2004 SFY 2005 SFY 2006 SFY 2007 SFY 2008 SFY 2009 SFY 2010 SFY 2011 SFY 2012
1 Adams 221 193 181 172 265 244 277 233 176 187 154 195 185 1962 Barnes 1,183 1,159 1,133 1,098 1,320 1,298 1,280 1,230 1,252 1,284 1,239 1,452 1,548 1,5863 Benson 1,816 1,789 1,831 1,923 2,452 2,484 2,531 2,570 2,596 2,639 2,717 2,725 2,775 3,0844 Billings 50 46 51 36 57 41 29 28 23 39 30 30 32 265 Bottineau 626 631 606 610 763 745 787 735 732 737 705 719 729 7586 Bowman 228 210 193 187 249 239 199 201 225 239 225 247 246 2297 Burke 137 133 124 158 161 168 143 135 132 134 161 147 162 1788 Burleigh 5,853 5,946 6,093 6,114 7,423 7,736 7,730 7,937 7,848 7,902 8,018 8,673 9,343 9,3169 Cass 9,147 9,238 9,504 9,711 11,728 12,056 12,306 12,962 12,900 13,331 14,318 16,051 17,228 18,268
10 Cavalier 329 344 353 327 368 339 331 378 351 329 325 382 361 36911 Dickey 609 594 612 579 759 783 735 652 633 613 597 598 656 66512 Divide 160 148 159 136 205 184 193 180 161 171 207 228 217 23413 Dunn 292 316 300 261 361 329 309 322 331 303 275 340 360 35414 Eddy 316 286 290 298 299 323 325 330 328 315 261 328 353 37415 Emmons 219 176 189 296 294 316 300 290 248 241 256 309 32916 Foster 307 289 281 258 350 311 335 352 315 333 310 322 339 33117 Golden Valley 159 114 125 130 177 185 166 172 156 158 180 188 186 19218 Grand Forks 5,339 5,445 5,452 5,433 6,767 7,004 6,985 6,998 6,942 7,030 7,261 7,761 8,279 8,52019 Grant 242 253 244 232 320 291 315 274 252 257 266 270 289 28120 Griggs 220 226 211 207 264 277 267 260 227 293 242 270 253 23721 Hettinger 216 141 175 171 174 169 198 212 206 152 192 234 223 23122 Kidder 185 177 162 165 210 221 201 178 185 202 211 229 236 24623 LaMoure 289 264 277 286 402 398 360 330 324 288 309 324 325 30924 Logan 175 157 157 134 166 162 147 180 186 185 183 206 223 20325 McHenry 615 546 502 554 658 664 675 664 579 517 515 566 558 65326 McIntosh 308 296 307 299 383 366 389 369 321 315 285 318 346 36427 McKenzie 970 976 883 805 1,089 1,027 1,024 1,011 947 923 932 998 1,047 1,09228 McLean 871 846 847 896 1,051 1,001 1,000 991 881 836 791 902 915 96229 Mercer 556 538 496 524 784 760 671 706 682 649 666 703 756 71130 Morton 2,737 2,620 2,576 2,661 3,232 3,319 3,233 3,285 3,241 3,429 3,387 3,829 3,885 3,78031 Mountrail 956 1,095 1,095 1,095 1,248 1,284 1,246 1,257 1,293 1,248 1,262 1,351 1,322 1,32532 Nelson 260 244 229 246 337 351 302 321 310 218 252 293 341 36833 Oliver 91 96 79 104 100 100 122 88 91 85 84 101 110 14134 Pembina 599 492 537 531 678 805 776 748 709 634 730 776 818 85235 Pierce 499 510 460 461 530 550 573 508 469 474 535 545 591 60936 Ramsey 1,582 1,634 1,580 1,617 1,948 1,991 2,062 2,016 1,934 1,971 1,972 2,137 2,171 2,07537 Ransom 392 376 384 398 549 572 560 591 618 550 572 647 701 70938 Renville 162 180 159 134 227 206 203 194 166 180 191 217 212 22639 Richland 1,481 1,410 1,317 1,316 1,730 1,783 1,784 1,768 1,660 1,665 1,736 2,009 2,099 2,13340 Rolette 4,921 4,636 4,623 4,678 5,406 5,413 5,529 5,537 5,350 5,414 5,472 5,769 6,020 6,09241 Sargent 257 226 237 254 285 255 265 275 244 240 270 290 293 27342 Sheridan 188 166 158 165 191 163 161 135 124 136 162 216 196 19543 Sioux 1,695 1,623 1,544 1,482 1,916 1,978 2,012 2,134 2,063 2,100 2,097 2,171 2,298 2,48844 Slope 43 37 31 31 45 35 27 21 22 23 25 23 32 2945 Stark 2,568 2,565 2,530 2,481 3,028 2,974 2,934 2,875 2,676 2,613 2,628 2,813 2,794 2,82646 Steele 124 107 110 107 147 144 140 141 117 117 134 132 121 16047 Stutsman 2,178 2,121 2,151 2,152 2,526 2,571 2,514 2,470 2,322 2,341 2,346 2,726 2,998 2,94748 Towner 275 224 185 197 253 280 219 233 211 208 225 241 296 30049 Traill 678 691 733 764 865 882 825 851 822 797 820 889 921 93550 Walsh 1,349 1,406 1,397 1,401 1,765 1,827 1,876 1,843 1,649 1,613 1,667 1,718 1,778 1,79451 Ward 5,290 5,467 5,502 5,654 6,643 6,611 6,460 6,686 6,499 6,448 6,627 7,087 7,096 6,83752 Wells 469 430 455 449 560 549 493 502 442 436 447 527 533 55853 Williams 2,077 2,156 2,160 2,221 2,667 2,636 2,478 2,430 2,257 2,183 2,180 2,360 2,513 2,503
62,509 61,989 61,781 62,492 76,377 77,378 77,018 77,799 75,470 75,732 77,637 84,529 88,618 90,453
*Due to technical difficulties the data for SFY 2002 are not available.
30
COUNTY
TOTAL
NORTH DAKOTA DEPARTMENT of HUMAN SERVICES
UNDUPLICATED COUNT OF MEDICAID RECIPIENTS BY STATE FISCAL YEARFOR STATE FISCAL YEARS 1998 THROUGH 2012*

SFY 1998 SFY 1999 SFY 2000 SFY 2001 SFY 2003 SFY 2004 SFY 2005 SFY 2006 SFY 2007 SFY 2008 SFY 2009 SFY 2010 SFY 2011 SFY 2012
1 Adams 297 204 328 274 313 251 242 206 193 207 218 211 171 1702 Barnes 765 775 931 955 774 855 813 863 864 824 792 821 807 6653 Benson 414 352 551 504 356 468 409 393 373 375 382 379 369 3574 Billings 36 37 69 70 78 59 51 32 35 31 22 30 24 125 Bottineau 687 718 860 769 730 842 748 703 757 817 787 817 794 7296 Bowman 138 149 180 200 196 182 179 125 126 116 178 164 134 1207 Burke 124 120 194 195 198 190 173 155 171 179 168 139 142 1288 Burleigh 1,847 1,851 2,184 2,868 2,143 2,289 2,355 2,725 2,430 2,405 2,521 2,533 2,420 2,0259 Cass 2,928 3,188 3,988 4,727 4,104 4,563 4,494 5,072 4,914 5,005 6,170 6,501 6,457 5,538
10 Cavalier 318 313 413 406 331 339 325 314 296 298 333 350 320 26511 Dickey 519 469 599 621 610 557 573 479 446 450 479 508 552 48812 Divide 171 159 233 182 159 186 165 166 186 165 182 197 133 11513 Dunn 144 154 231 213 168 186 178 137 157 123 142 145 124 10314 Eddy 232 180 240 260 242 248 246 213 230 258 192 182 198 15815 Emmons 385 358 425 364 346 323 289 314 291 331 339 357 33216 Foster 232 163 172 220 166 213 189 234 233 225 184 185 180 17317 Golden Valley 114 111 129 138 157 137 124 162 139 120 125 132 110 8718 Grand Forks 2,117 2,280 2,658 3,173 2,508 2,732 2,682 2,864 3,047 3,160 3,399 3,404 3,506 3,30119 Grant 383 374 480 380 388 360 317 303 275 296 356 309 310 32120 Griggs 272 220 369 307 215 271 240 225 217 214 223 245 231 20721 Hettinger 193 149 192 177 154 142 143 152 134 137 147 133 149 10022 Kidder 187 171 229 238 177 170 173 162 135 137 197 197 204 18723 LaMoure 307 282 406 401 426 444 373 352 356 374 356 379 359 31124 Logan 202 158 238 191 180 158 152 157 155 179 169 195 217 19025 McHenry 645 610 758 832 727 875 777 703 689 691 686 680 634 54226 McIntosh 277 285 275 307 306 332 288 321 260 308 301 328 311 28927 McKenzie 363 355 373 318 360 324 302 251 207 169 155 155 120 6528 McLean 398 379 458 565 485 506 480 500 445 422 471 381 417 35329 Mercer 356 397 516 488 469 572 512 432 513 534 460 447 520 38330 Morton 1,564 1,587 1,730 2,129 1,857 2,039 2,004 2,141 1,964 2,050 2,034 2,003 1,955 1,52131 Mountrail 299 244 352 377 272 327 292 318 288 233 198 196 143 10032 Nelson 181 191 294 264 261 287 249 259 289 286 269 304 356 33633 Oliver 80 97 71 140 108 89 94 83 82 87 82 95 91 9634 Pembina 391 334 649 561 465 571 545 569 545 610 661 655 679 59835 Pierce 524 490 624 628 567 680 593 590 600 648 598 632 644 59836 Ramsey 834 820 881 1,102 967 989 972 1,008 1,051 1,037 1,044 986 902 76637 Ransom 269 246 322 374 360 395 358 383 423 472 572 605 571 53938 Renville 156 209 286 207 226 234 212 188 198 200 223 227 214 16139 Richland 590 688 855 998 908 945 886 994 959 1,185 1,282 1,369 1,426 1,29640 Rolette 1,229 1,239 1,472 1,412 1,414 1,454 1,336 1,300 1,332 1,455 1,448 1,508 1,514 1,48041 Sargent 255 187 212 246 216 237 202 180 244 222 313 273 248 23342 Sheridan 247 263 342 296 257 267 237 200 200 213 232 220 218 21343 Sioux 95 98 166 139 109 88 79 86 104 91 103 108 97 6144 Slope 35 82 112 75 45 48 40 43 34 32 46 35 41 3145 Stark 935 1,133 1,117 1,355 1,329 1,364 1,347 1,267 1,195 1,068 1,041 1,045 850 59846 Steele 137 154 202 155 142 159 136 123 105 109 130 141 178 19447 Stutsman 855 947 1,254 1,424 1,221 1,341 1,309 1,435 1,300 1,271 1,315 1,306 1,311 1,14248 Towner 233 244 322 245 224 282 250 223 225 216 235 230 234 21449 Traill 447 467 593 733 633 613 589 572 520 596 577 646 626 62950 Walsh 744 725 1,008 1,246 1,001 1,068 1,004 1,120 1,009 996 1,116 1,144 1,247 1,22651 Ward 2,215 2,527 3,210 3,543 3,127 3,624 3,412 3,256 3,121 2,907 3,050 2,724 2,648 1,51852 Wells 377 295 475 460 523 554 473 455 465 467 453 453 496 52853 Williams 1,161 1,378 1,626 1,501 1,349 1,364 1,374 1,158 993 900 866 827 692 434
28,904 29,606 36,429 40,014 35,065 37,816 36,019 36,641 35,543 36,641 38,014 38,218 37,651 32,226
*Due to technical difficulties the data for SFY 2002 are not available.
31
COUNTY
TOTAL
NORTH DAKOTA DEPARTMENT of HUMAN SERVICES
UNDUPLICATED COUNT OF LIHEAP RECIPIENTS BY STATE FISCAL YEARFOR STATE FISCAL YEARS 1998 THROUGH 2012*
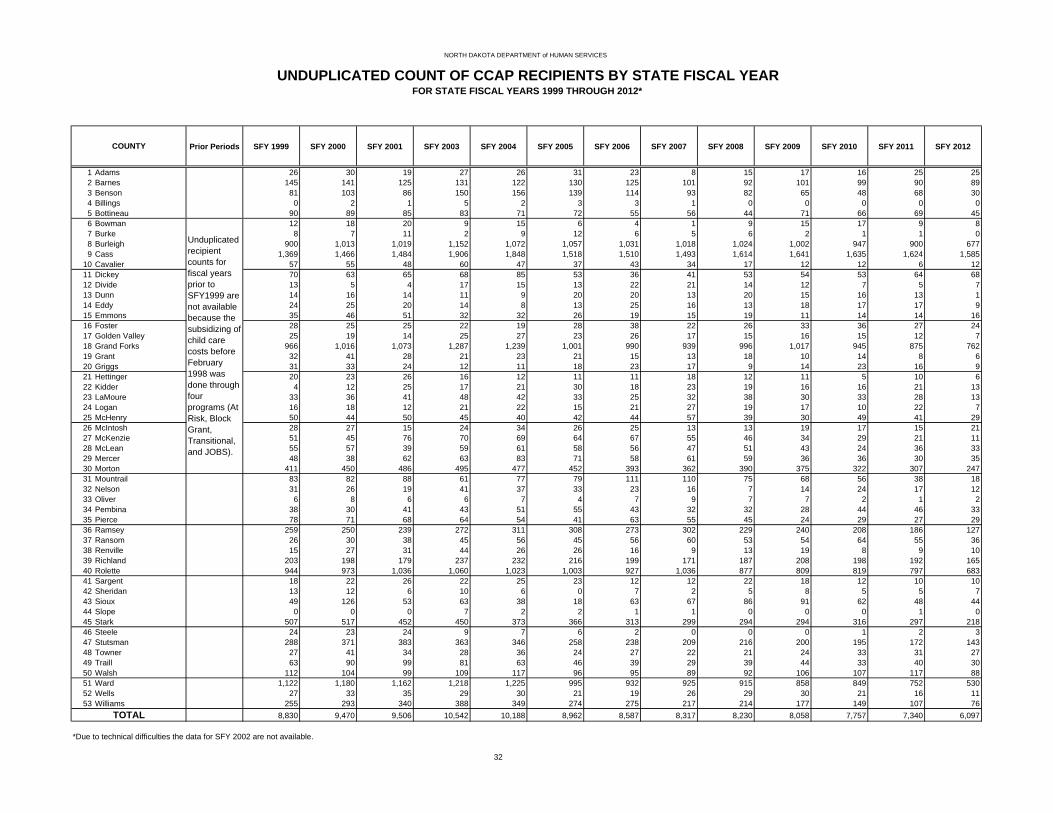
Prior Periods SFY 1999 SFY 2000 SFY 2001 SFY 2003 SFY 2004 SFY 2005 SFY 2006 SFY 2007 SFY 2008 SFY 2009 SFY 2010 SFY 2011 SFY 2012
1 Adams 26 30 19 27 26 31 23 8 15 17 16 25 252 Barnes 145 141 125 131 122 130 125 101 92 101 99 90 893 Benson 81 103 86 150 156 139 114 93 82 65 48 68 304 Billings 0 2 1 5 2 3 3 1 0 0 0 0 05 Bottineau 90 89 85 83 71 72 55 56 44 71 66 69 456 Bowman 12 18 20 9 15 6 4 1 9 15 17 9 87 Burke 8 7 11 2 9 12 6 5 6 2 1 1 08 Burleigh 900 1,013 1,019 1,152 1,072 1,057 1,031 1,018 1,024 1,002 947 900 6779 Cass 1,369 1,466 1,484 1,906 1,848 1,518 1,510 1,493 1,614 1,641 1,635 1,624 1,585
10 Cavalier 57 55 48 60 47 37 43 34 17 12 12 6 1211 Dickey 70 63 65 68 85 53 36 41 53 54 53 64 6812 Divide 13 5 4 17 15 13 22 21 14 12 7 5 713 Dunn 14 16 14 11 9 20 20 13 20 15 16 13 114 Eddy 24 25 20 14 8 13 25 16 13 18 17 17 915 Emmons 35 46 51 32 32 26 19 15 19 11 14 14 1616 Foster 28 25 25 22 19 28 38 22 26 33 36 27 2417 Golden Valley 25 19 14 25 27 23 26 17 15 16 15 12 718 Grand Forks 966 1,016 1,073 1,287 1,239 1,001 990 939 996 1,017 945 875 76219 Grant 32 41 28 21 23 21 15 13 18 10 14 8 620 Griggs 31 33 24 12 11 18 23 17 9 14 23 16 921 Hettinger 20 23 26 16 12 11 11 18 12 11 5 10 622 Kidder 4 12 25 17 21 30 18 23 19 16 16 21 1323 LaMoure 33 36 41 48 42 33 25 32 38 30 33 28 1324 Logan 16 18 12 21 22 15 21 27 19 17 10 22 725 McHenry 50 44 50 45 40 42 44 57 39 30 49 41 2926 McIntosh 28 27 15 24 34 26 25 13 13 19 17 15 2127 McKenzie 51 45 76 70 69 64 67 55 46 34 29 21 1128 McLean 55 57 39 59 61 58 56 47 51 43 24 36 3329 Mercer 48 38 62 63 83 71 58 61 59 36 36 30 3530 Morton 411 450 486 495 477 452 393 362 390 375 322 307 24731 Mountrail 83 82 88 61 77 79 111 110 75 68 56 38 1832 Nelson 31 26 19 41 37 33 23 16 7 14 24 17 1233 Oliver 6 8 6 6 7 4 7 9 7 7 2 1 234 Pembina 38 30 41 43 51 55 43 32 32 28 44 46 3335 Pierce 78 71 68 64 54 41 63 55 45 24 29 27 2936 Ramsey 259 250 239 272 311 308 273 302 229 240 208 186 12737 Ransom 26 30 38 45 56 45 56 60 53 54 64 55 3638 Renville 15 27 31 44 26 26 16 9 13 19 8 9 1039 Richland 203 198 179 237 232 216 199 171 187 208 198 192 16540 Rolette 944 973 1,036 1,060 1,023 1,003 927 1,036 877 809 819 797 68341 Sargent 18 22 26 22 25 23 12 12 22 18 12 10 1042 Sheridan 13 12 6 10 6 0 7 2 5 8 5 5 743 Sioux 49 126 53 63 38 18 63 67 86 91 62 48 4444 Slope 0 0 0 7 2 2 1 1 0 0 0 1 045 Stark 507 517 452 450 373 366 313 299 294 294 316 297 21846 Steele 24 23 24 9 7 6 2 0 0 0 1 2 347 Stutsman 288 371 383 363 346 258 238 209 216 200 195 172 14348 Towner 27 41 34 28 36 24 27 22 21 24 33 31 2749 Traill 63 90 99 81 63 46 39 29 39 44 33 40 3050 Walsh 112 104 99 109 117 96 95 89 92 106 107 117 8851 Ward 1,122 1,180 1,162 1,218 1,225 995 932 925 915 858 849 752 53052 Wells 27 33 35 29 30 21 19 26 29 30 21 16 1153 Williams 255 293 340 388 349 274 275 217 214 177 149 107 76
8,830 9,470 9,506 10,542 10,188 8,962 8,587 8,317 8,230 8,058 7,757 7,340 6,097
*Due to technical difficulties the data for SFY 2002 are not available.
NORTH DAKOTA DEPARTMENT of HUMAN SERVICES
UNDUPLICATED COUNT OF CCAP RECIPIENTS BY STATE FISCAL YEARFOR STATE FISCAL YEARS 1999 THROUGH 2012*
32
COUNTY
TOTAL
Unduplicated recipient counts for fiscal years prior to SFY1999 are not available because the subsidizing of child care costs before February 1998 was done through four programs (At Risk, Block Grant, Transitional, and JOBS).

APPENDIX C
UNDUPLICATED COUNT OFCOMBINED TANF/SNAP/MEDICAID RECIPIENTS
BY COUNTY AND BY REGION

NUMBER OF RECIPIENTS
PERCENT OF TOTAL RECIPIENTS
PERCENT OF COUNTY POPULATION RECEIVING
2011 COUNTY POPULATION ESTIMATE *
COUNTY POPULATION AS A PERCENT OF
STATE POPULATION
1 Adams 261 0.23% 11.31% 2,307 0.34%2 Barnes 1,922 1.68% 17.38% 11,056 1.62%3 Benson 3,632 3.17% 54.02% 6,723 0.98%4 Billings 39 0.03% 4.78% 816 0.12%5 Bottineau 984 0.86% 15.27% 6,443 0.94%6 Bowman 304 0.27% 9.70% 3,134 0.46%7 Burke 234 0.20% 11.51% 2,033 0.30%8 Burleigh 11,324 9.88% 13.62% 83,145 12.16%9 Cass 23,331 20.36% 15.31% 152,368 22.28%
10 Cavalier 466 0.41% 11.83% 3,939 0.58%11 Dickey 901 0.79% 16.95% 5,317 0.78%12 Divide 277 0.24% 13.04% 2,125 0.31%13 Dunn 413 0.36% 11.10% 3,720 0.54%14 Eddy 419 0.37% 17.61% 2,380 0.35%15 Emmons 477 0.42% 13.45% 3,546 0.52%16 Foster 423 0.37% 12.66% 3,341 0.49%17 Golden Valley 283 0.25% 16.15% 1,752 0.26%18 Grand Forks 11,099 9.69% 16.67% 66,598 9.74%19 Grant 389 0.34% 16.65% 2,337 0.34%20 Griggs 307 0.27% 12.94% 2,372 0.35%21 Hettinger 282 0.25% 11.21% 2,515 0.37%22 Kidder 335 0.29% 13.88% 2,414 0.35%23 LaMoure 408 0.36% 9.94% 4,105 0.60%24 Logan 265 0.23% 13.35% 1,985 0.29%25 McHenry 855 0.75% 15.53% 5,505 0.80%26 McIntosh 431 0.38% 15.57% 2,769 0.40%27 McKenzie 1,279 1.12% 18.22% 7,019 1.03%28 McLean 1,176 1.03% 12.97% 9,068 1.33%29 Mercer 895 0.78% 10.59% 8,449 1.24%30 Morton 4,602 4.02% 16.59% 27,734 4.06%31 Mountrail 1,483 1.29% 18.32% 8,097 1.18%32 Nelson 437 0.38% 14.30% 3,057 0.45%33 Oliver 186 0.16% 10.16% 1,830 0.27%34 Pembina 1,077 0.94% 14.67% 7,342 1.07%35 Pierce 767 0.67% 17.53% 4,375 0.64%36 Ramsey 2,471 2.16% 21.58% 11,452 1.67%37 Ransom 876 0.76% 16.21% 5,403 0.79%38 Renville 289 0.25% 11.61% 2,490 0.36%39 Richland 2,759 2.41% 16.98% 16,245 2.38%40 Rolette 8,239 7.19% 58.00% 14,206 2.08%41 Sargent 382 0.33% 10.06% 3,798 0.56%42 Sheridan 280 0.24% 21.39% 1,309 0.19%43 Sioux 3,165 2.76% 73.95% 4,280 0.63%44 Slope 43 0.04% 5.99% 718 0.10%45 Stark 3,415 2.98% 13.56% 25,177 3.68%46 Steele 213 0.19% 10.92% 1,950 0.29%47 Stutsman 3,730 3.25% 17.71% 21,062 3.08%48 Towner 357 0.31% 15.77% 2,264 0.33%49 Traill 1,293 1.13% 15.87% 8,147 1.19%50 Walsh 2,302 2.01% 20.87% 11,032 1.61%51 Ward 8,834 7.71% 13.79% 64,072 9.37%52 Wells 694 0.61% 16.38% 4,237 0.62%53 Williams 3,288 2.87% 13.49% 24,374 3.56%
114,593 100.00% 16.76% 683,932 100.00%
Source: Data obtained via job ES399510
33
COUNTY
TotalData presented by Human Service Center Region on page 34
Source: U.S. Census Bureau, Population Division, Release Date: April 2012http://www.census.gov/popest/data/counties/totals/2011/CO-EST2011-01.html
*Table 1. Annual Estimates of the Resident Population for Counties of North Dakota: April 1, 2010 to July 1, 2011 (CO-EST2011-01-38)
NORTH DAKOTA DEPARTMENT of HUMAN SERVICES
UNDUPLICATED COUNT OF COMBINED ECONOMIC ASSISTANCE RECIPIENTS
FOR STATE FISCAL YEAR 2012 (July 2011 - June 2012)INCLUDING TANF, SNAP, AND MEDICAID

NUMBER OF RECIPIENTS
PERCENT OF TOTAL RECIPIENTS
1 Northwest 12 Divide 277 0.24%1 Northwest 27 McKenzie 1,279 1.12%1 Northwest 53 Williams 3,288 2.87%
Subtotal 4,844 4.23%2 North Central 5 Bottineau 984 0.86%2 North Central 7 Burke 234 0.20%2 North Central 25 McHenry 855 0.75%2 North Central 31 Mountrail 1,483 1.29%2 North Central 35 Pierce 767 0.67%2 North Central 38 Renville 289 0.25%2 North Central 51 Ward 8,834 7.71%
Subtotal 13,446 11.73%3 Lake Region 3 Benson 3,632 3.17%3 Lake Region 10 Cavalier 466 0.41%3 Lake Region 14 Eddy 419 0.37%3 Lake Region 36 Ramsey 2,471 2.16%3 Lake Region 40 Rolette 8,239 7.19%3 Lake Region 48 Towner 357 0.31%
Subtotal 15,584 13.60%4 Northeast 18 Grand Forks 11,099 9.69%4 Northeast 32 Nelson 437 0.38%4 Northeast 34 Pembina 1,077 0.94%4 Northeast 50 Walsh 2,302 2.01%
Subtotal 14,915 13.02%5 Southeast 9 Cass 23,331 20.36%5 Southeast 37 Ransom 876 0.76%5 Southeast 39 Richland 2,759 2.41%5 Southeast 41 Sargent 382 0.33%5 Southeast 46 Steele 213 0.19%5 Southeast 49 Traill 1,293 1.13%
Subtotal 28,854 25.18%6 South Central 2 Barnes 1,922 1.68%6 South Central 11 Dickey 901 0.79%6 South Central 16 Foster 423 0.37%6 South Central 20 Griggs 307 0.27%6 South Central 23 LaMoure 408 0.36%6 South Central 24 Logan 265 0.23%6 South Central 26 McIntosh 431 0.38%6 South Central 47 Stutsman 3,730 3.25%6 South Central 52 Wells 694 0.61%
Subtotal 9,081 7.92%7 West Central 8 Burleigh 11,324 9.88%7 West Central 15 Emmons 477 0.42%7 West Central 19 Grant 389 0.34%7 West Central 22 Kidder 335 0.29%7 West Central 28 McLean 1,176 1.03%7 West Central 29 Mercer 895 0.78%7 West Central 30 Morton 4,602 4.02%7 West Central 33 Oliver 186 0.16%7 West Central 42 Sheridan 280 0.24%7 West Central 43 Sioux 3,165 2.76%
Subtotal 22,829 19.92%8 Badlands 1 Adams 261 0.23%8 Badlands 4 Billings 39 0.03%8 Badlands 6 Bowman 304 0.27%8 Badlands 13 Dunn 413 0.36%8 Badlands 17 Golden Valley 283 0.25%8 Badlands 21 Hettinger 282 0.25%8 Badlands 44 Slope 43 0.04%8 Badlands 45 Stark 3,415 2.98%
Subtotal 5,040 4.40%114,593 100.00%State Total
34
NORTH DAKOTA DEPARTMENT of HUMAN SERVICES
FOR STATE FISCAL YEAR 2012 (July 2011 - June 2012)
HUMAN SERVICE CENTER REGION COUNTY
INCLUDING TANF, SNAP, AND MEDICAID
ASSISTANCE RECIPIENTS BY REGIONUNDUPLICATED COUNT OF COMBINED ECONOMIC

SFY 2007 SFY 2008 SFY 2009 SFY 2010 SFY 2011 SFY 2012
1 Adams 234 246 215 268 254 2612 Barnes 1,530 1,566 1,560 1,818 1,929 1,9223 Benson 2,989 3,082 3,150 3,241 3,298 3,6324 Billings 26 44 38 48 46 395 Bottineau 881 913 917 947 958 9846 Bowman 289 306 298 324 322 3047 Burke 154 165 191 173 189 2348 Burleigh 9,195 9,438 9,817 10,594 11,453 11,3249 Cass 15,587 16,342 18,141 20,781 22,337 23,331
10 Cavalier 421 425 424 473 470 46611 Dickey 793 752 762 804 895 90112 Divide 189 212 259 278 260 27713 Dunn 397 351 325 403 423 41314 Eddy 376 381 339 396 414 41915 Emmons 366 319 328 356 433 47716 Foster 384 418 392 407 417 42317 Golden Valley 221 214 246 277 296 28318 Grand Forks 8,634 8,902 9,471 10,262 11,097 11,09919 Grant 353 356 374 388 385 38920 Griggs 291 359 298 358 335 30721 Hettinger 260 202 241 297 294 28222 Kidder 219 231 258 299 325 33523 LaMoure 418 386 446 470 453 40824 Logan 226 220 228 265 291 26525 McHenry 763 702 741 830 758 85526 McIntosh 373 384 336 393 433 43127 McKenzie 1,108 1,057 1,091 1,195 1,213 1,27928 McLean 1,047 1,027 978 1,083 1,117 1,17629 Mercer 817 806 859 893 932 89530 Morton 3,886 4,114 4,211 4,814 4,776 4,60231 Mountrail 1,443 1,425 1,409 1,549 1,520 1,48332 Nelson 363 280 322 390 445 43733 Oliver 112 124 121 146 161 18634 Pembina 874 844 937 991 1,022 1,07735 Pierce 652 646 708 731 764 76736 Ramsey 2,302 2,332 2,377 2,590 2,612 2,47137 Ransom 756 687 753 839 889 87638 Renville 221 226 259 291 288 28939 Richland 2,110 2,099 2,311 2,620 2,759 2,75940 Rolette 6,833 6,971 7,230 7,769 8,146 8,23941 Sargent 324 333 401 407 395 38242 Sheridan 202 223 264 324 288 28043 Sioux 2,659 2,712 2,759 2,841 2,976 3,16544 Slope 28 27 34 35 47 4345 Stark 3,306 3,268 3,430 3,708 3,546 3,41546 Steele 148 149 185 192 188 21347 Stutsman 3,008 3,030 3,155 3,604 3,895 3,73048 Towner 272 258 284 312 345 35749 Traill 1,033 1,046 1,085 1,271 1,230 1,29350 Walsh 2,149 2,106 2,214 2,273 2,325 2,30251 Ward 8,251 8,254 8,511 9,200 9,333 8,83452 Wells 533 542 590 638 667 69453 Williams 2,722 2,696 2,726 2,989 3,085 3,288
92,728 94,198 98,999 108,845 113,729 114,593
NORTH DAKOTA DEPARTMENT of HUMAN SERVICES
35
COUNTY
TOTAL
UNDUPLICATED COUNT OF COMBINED ECONOMIC ASSISTANCE RECIPIENTS (INCLUDING TANF, SNAP, & MEDICAID) BY STATE FISCAL
YEARFOR STATE FISCAL YEARS 2007 THROUGH 2012