understanding water: the drop of life - skovdyrkerne · understanding water: the drop of life a...
TRANSCRIPT

Understanding Water:Understanding Water:Understanding Water:Understanding Water:Understanding Water:The Drop of LifeThe Drop of LifeThe Drop of LifeThe Drop of LifeThe Drop of Life
A Teacher’s Guide BookA Teacher’s Guide BookA Teacher’s Guide BookA Teacher’s Guide BookA Teacher’s Guide Bookby Nepal Prakriti Pathshalaby Nepal Prakriti Pathshalaby Nepal Prakriti Pathshalaby Nepal Prakriti Pathshalaby Nepal Prakriti Pathshala

Authors:Authors:Authors:Authors:Authors:Brinda DewanSanjeevani Yonzon Shrestha
Nepal Prakriti Pathshala Creative TeamNepal Prakriti Pathshala Creative TeamNepal Prakriti Pathshala Creative TeamNepal Prakriti Pathshala Creative TeamNepal Prakriti Pathshala Creative TeamNabin BaidyaBudhi Ratna DangolEva SkytteEmilSelsingAbin Shrestha
ISBN:978-9937-8277-1-3Printed 2010
This educational material is under Nepal Prakriti Pathshala’s Copyright and may be freely copied for educationaluse, provided the source is acknowledged.If you require our help, advice regarding any activities, ideas to improve environment within school, to establishnature clubs or just revive old ones or if you just want to share your stories, please contact:
Nepal Prakriti PathshalaWildlife Conservation NepalPO Box No 13781Kathmandu Nepal
Or write to us at [email protected]

w

w

wACKNOWLEDGEMENTACKNOWLEDGEMENTACKNOWLEDGEMENTACKNOWLEDGEMENTACKNOWLEDGEMENT
The development of this manual has been through many meetings, workshops andinteractions with different teachers, academicians and school principals. And NepalPrakriti Pathshala (NPP), a joint venture of Wildlife Conservation Nepal and Danish ForestryExtension, would like to express gratitude to many individuals and institutions that havedirectly and indirectly helped in bringing out this manual.
NPP would like to express its sincere gratitude to Mr. Mahashram Sharma Director General,Department of Education, for his invaluable guidance. Our heart felt appreciation to Ms.Rajyalaxmi Nakarmi, Deputy Director, Department of Education for her constant support.
The Project is grateful to all the teachers who gave their time and effort in making thisteachers’ guide possible especially Ms. Eva Skytte, Nature Interpreter from Denmark andMr. Prakash Deep Rai.
NPP would like to thank the illustrator Abin Man Shrestha for his beautiful illustrations andto the creative team at WCN for their valuable research and painstaking work in publishingthe manual.
Lastly, NPP is most grateful to DANIDA Denmark for their belief in NPP and their kindsupport without which this manual would not have been possible.

w

w
11111
NOTE TO THE TEACHERNOTE TO THE TEACHERNOTE TO THE TEACHERNOTE TO THE TEACHERNOTE TO THE TEACHER 2INTRODUCTIONINTRODUCTIONINTRODUCTIONINTRODUCTIONINTRODUCTION 3
UNDERSTANDING WATERUNDERSTANDING WATERUNDERSTANDING WATERUNDERSTANDING WATERUNDERSTANDING WATERWater Cycle In The Classroom 4Build Your Aquifer 6Learning The Unique Property of Water 8
KNOWING MY WATER BODYKNOWING MY WATER BODYKNOWING MY WATER BODYKNOWING MY WATER BODYKNOWING MY WATER BODYLooking Around 10Mapping The Water Body 12
HOW HEALTHY IS MY WATER BODYHOW HEALTHY IS MY WATER BODYHOW HEALTHY IS MY WATER BODYHOW HEALTHY IS MY WATER BODYHOW HEALTHY IS MY WATER BODYThe Abiotic Factors That Affect My Water 14How Clear Is My Water 16Measuring Stream Flow By Float Method 18Chemicals In My Water 20What Lives In My Water Body 22
ANNEXANNEXANNEXANNEXANNEXHow Healthy Is My Water BodyAbiotic Components 24Biotic Components 26Water Macroinvertibrate Key 27Fun Facts 30Tips To Conserve Water 31
GLOSSARYGLOSSARYGLOSSARYGLOSSARYGLOSSARY 32REFERENCEREFERENCEREFERENCEREFERENCEREFERENCE 32
Con
tent
s
w

w
NOTE TO THE TEACHERNOTE TO THE TEACHERNOTE TO THE TEACHERNOTE TO THE TEACHERNOTE TO THE TEACHER
WCN Nepal Prakriti Pathshala’s (NPP) objective is to provide quality materials onEnvironment Education to make classroom lectures more fun, and impart knowledge onthe environment. Thus, NPP is introducing a series of Teacher’s Guides to teachers.
This manual deals with water. It will support students to understand and value water, themost essential element for survival of life. The students will also learn to use differenttools to access information (i.e. libraries, internet, videos) to collect information andknowledge and share it with their colleagues.
This manual has been developed through the outcome of many workshops andbrainstorming sessions with teachers, Nature Interpreters and environment educators ofNepal and Denmark. However, we consider this as a new tool for learning and thus inviteyour valuable suggestions and creative ideas.
In the end we hope that this teaching manual helps the teachers and your studentsunderstand “Water : The Drop of Life”.
22222

wW
ater
: The
Dro
p of
Lif
eINTRODUCTIONINTRODUCTIONINTRODUCTIONINTRODUCTIONINTRODUCTION
Water is the basic necessities for life on earth. All organisms contain it; many live in itwhile others absorb or drink it to survive. There is so much water on Earth that the planetis sometimes refered to as Oceanus or the Blue Planet. The oceans cover 71% of earth’ssurface and are the largest reservoir of water on earth. However, this is salty water andcannot be utilised by humans directly for drinking and other domestic purposes. About97 percent of water is in the oceans and only three percent accounts for freshwater. Themajority of this freshwater, about 67 percent, is locked up in glaciers and icecaps. Of theremaining freshwater, most of it is below our feet, as groundwater and only 0.3 percentcontained in rivers and lakes is available for consumption. Thus water, even thoughplenty is a scarce resource for us.
Based on the renewable annual supply of water i.e supply from both surface runoff andgroundwater replenishment, Iceland the richest country in water resources. Annually itgets 606,500 m3 whereas Kuwait on the other hand gets only 11m3 water every year,making it the country with least amount of annual renewable supply of water.
Nepal, however is ranked second rich in fresh water resources. It has more than 6000rivers and streams that rise from four main drainage basins: Sapta Koshi, Gandaki, Karnaliand Mahakali. The total area of all the rivers and streams in Nepal is estimated to beabout 395,000 hectares. Different rivers of Nepal support many aquatic flora and fauna.Fishes of Nepal are unique depicting the characteristic of three major regions: i) verycold water fishes of the high mountains, ii) cold water fishes of the midlands, and iii)warm water fishes of the lowlands. Nepal has 185 fish species recorded so far.
Despite its importance and abundance, water is a most poorly managed resource, inNepal. We waste and pollute it. In the cities, massive unplanned infrastructuraldevelopment leaves little or no space for ground water recharge. This in turn causes runoff and floodings.
In various parts of the world the water demand exceeds supply and as the world popula-tion continues to rise, so does the water demand. Water is vital to our survival. Preservingwater for ecosystem services has emerged as the biggest challenge of the 21st century.We must begin today to make wise choices on how we use, treat and regard water tosustain our future generation
33333

w
Act
ivit
y 1
w
Activity: Water Cycle in the classroomActivity: Water Cycle in the classroomActivity: Water Cycle in the classroomActivity: Water Cycle in the classroomActivity: Water Cycle in the classroom
ConceptConceptConceptConceptConceptThe water that you drank this morning may have fallen from the sky as rain just last week,but the water itself has been around since the time of earth’s early days as a planet. Theearth has a limited amount of water and it keeps going round and round in what we callthe “Water Cycle”. Water cycle is the pathway by which water is recycled in nature. Waterevaporates, travels into the air and becomes part of a cloud, falls down to the earth asrain or snow and then flows into rivers, lakes, seas and oceans. Some go down the soiland recharge ground water storage. It again returns to the air through evaporation. Thisway the water keeps on moving and changing from solid to liquid to gas, over and overagain in a never-ending cycle.
PurposePurposePurposePurposePurposeThis activity will help the students understand the concept of water cycle and explainhow this cycle recycles the earth’s water supply in nature.
CHAPTER 1: UNDERSTANDING WATERCHAPTER 1: UNDERSTANDING WATERCHAPTER 1: UNDERSTANDING WATERCHAPTER 1: UNDERSTANDING WATERCHAPTER 1: UNDERSTANDING WATER
Water cycle in nature
44444

wResources & MaterialsResources & MaterialsResources & MaterialsResources & MaterialsResources & Materials
WWWWWatatatatater Cyer Cyer Cyer Cyer Cycle in the Class:cle in the Class:cle in the Class:cle in the Class:cle in the Class:1. Soil2. Water3. Large, clear plastic container or an old aquarium4. Plastic wrap5. Tape or large elastic band6. Bag of ice (optional)7. Heat lamp (optional)8. A small bowl
Measuring rMeasuring rMeasuring rMeasuring rMeasuring rainfainfainfainfainfall: Making mall: Making mall: Making mall: Making mall: Making my wy wy wy wy watatatatatererererergaugegaugegaugegaugegauge1. Clear plastic soda bottle2. Pair of scissors3. Permanent marker with a sharp point4. Small stones or gravel5. Water6. Ruler
Activities & ProceduresActivities & ProceduresActivities & ProceduresActivities & ProceduresActivities & ProceduresWWWWWatatatatater Cyer Cyer Cyer Cyer Cycle in the Classcle in the Classcle in the Classcle in the Classcle in the Class1. Arrange the soil in the container to makemountains, plateaus, hills, etc., and a lake basin.Place the bowl in the lake basin. Fill the bowlwith water.
2. Plant moss and /or other plants in the soil.
3. Cover the container tightly with plastic wrapand secure it by means of tape or the band.
4. Set the container in a sunny area and watchwhat happens over a couple of days.
5. After a day or two, condensation forms on theplastic. When the condensation droplets getlarger, they begin to run down toward the centerof the plastic and drop back into the small cup.
The water evaporates from the cup creatingcondensation on the underside of the plastic.
6. When enough moisture collects, it will fall ontothe landforms as precipitation.
7. In order to speed the process, a bag of ice maybe placed on one end of the covered container,while a heat lamp is focused on the other.
Measuring rMeasuring rMeasuring rMeasuring rMeasuring rainfainfainfainfainfall: Making mall: Making mall: Making mall: Making mall: Making my wy wy wy wy watatatatatererererergaugegaugegaugegaugegauge1. Cut off the top part of the bottle.
2. Fill the curved part of the bottom of the bottlewith small stones or aquarium gravel. This willput weight your rain gauge to keep it from fallingover.
3. Pour enough water into the bottle to cover thestones. Use the marker to draw a line at the topsurface of the water. Mark a “0” next to the line.This is your baseline.
4. Use the ruler and marker to measure 1cm, 2cm, up the bottle from the baseline. Draw a lineat each cm mark and label the lines.
5. When it starts raining, put the rain gaugeoutside to catch the rainwater.
6. When the rain stops, check to see how manycms of rain fell into your rain gauge.
7. You can record how much rain falls in a weekor a month and make a chart. On the chart, listthe date it rained and how many inches of rainfell. Add up the rainfall at the end of the week ormonth.
ImporImporImporImporImportttttant! Be sure the rant! Be sure the rant! Be sure the rant! Be sure the rant! Be sure the rain gauge is fain gauge is fain gauge is fain gauge is fain gauge is filled tilled tilled tilled tilled tooooothe baseline befthe baseline befthe baseline befthe baseline befthe baseline before yore yore yore yore you begin collecting.ou begin collecting.ou begin collecting.ou begin collecting.ou begin collecting.
Weight
plastic wrap
Demonstration of water cycle in the classroom
55555

w
Act
ivit
y 2
w
Activity: Build your AquiferActivity: Build your AquiferActivity: Build your AquiferActivity: Build your AquiferActivity: Build your Aquifer
ConceptConceptConceptConceptConceptWhen rain falls on our watersheds, some of the water soaks through the organic layer,down through the soils and becomes ground water. How fast and how far it movesdepends on the type of soil. Gravel has large air spaces so water moves quickly into andthrough it. Sand has smaller spaces, so the water may not travel quite as quickly throughit. Areas of saturated soil from which it is possible to pump water are called “aquifers”.Often these aquifers are composed of fractured rock, sand or gravel since these soilscan hold large amounts of water and the water can be more easily pumped from themthan from very fine grained soils.
Many communities obtain their drinking water and water for irrigation from theseunderground sources. Unfortunately, ground water can become contaminated byharmful chemicals, such as lawn care products and household cleaners that were usedor disposed of improperly, and any number of other pollutants, that can enter the soiland rock, polluting the aquifer and eventually the well. Such contamination can pose asignificant threat to human health.
PurposePurposePurposePurposePurposeThis experiment will help students understand how water is stored in an aquifer, howground water can become contaminated, and how this contamination ends up in adrinking water well. They will see how careless use and disposal of harmful contaminantsabove the ground can potentially end up in the drinking water below the ground. Toexamine how substances can travel with the water through the soil into the aquifer.
66666

wResources & MaterialsResources & MaterialsResources & MaterialsResources & MaterialsResources & Materials1. Beaker/plastic cup2. Sand3. Moulding clay4. Gravel5. Aquarium rock6. Food colour7. Pitcher of water
Activities & ProceduresActivities & ProceduresActivities & ProceduresActivities & ProceduresActivities & Procedures1. Fill the beaker/cup 1/4th with sand.
2. Slowly add water into the sand and watch thesand absorb the water. Continue dropping wateron the sand until it is saturated, but not standing.(This shows how water is stored in the ground.)
3. Flatten the clay into a disk that covers half ofthe cup. Place the clay on top of the sand. Attachthe clay to one side of the cup. Drop water ontothe clay in the same spot.
4. Water will collect and slide onto the sectionof sand that is not covered by the clay whichshows an area where water cannot permeate(confining area).
5. Spread gravel across the clay and sand (thefull diameter of the cup) creating the next layerof earth.
6. Add the next layer of aquarim rocks above thegarvel. Form a small hill with the rock against oneside of the cup.
7. Pour a small amount of water slowly down theside of the cup. Pour a small amount of waterslowly down the rock hill, filling the valley.Students will observe how the water is storedaround the rocks. A small puddle may stand andcan be identified as surface water (lake).
8. Add one or two drops of food coloring on therock hill area, close to the cup wall.
9. See how the food coloring spreads through therocks, into the surface water and into the bottomof the cup. Record the time it takes for the waterto reach the bottom of the glass. This is howpollution spreads and can get into our wells.
Aquifer in a cup
77777

w
Act
ivit
y 3
w
Activity: Learning the Unique PropertiesActivity: Learning the Unique PropertiesActivity: Learning the Unique PropertiesActivity: Learning the Unique PropertiesActivity: Learning the Unique Propertiesof Waterof Waterof Waterof Waterof Water
ConceptConceptConceptConceptConceptThe density of water is dependent on its temperature. Normally, liquids become denseon cooling. However, water does not follow this typical behaviour and is most dense asa liquid at 4oC. Therfore, solid ice at 0°C is less dense than water at 4°C. This is why icefloats on water. This unusual behaviour of water known as Anomalous ExpansionAnomalous ExpansionAnomalous ExpansionAnomalous ExpansionAnomalous Expansion ofwater causes thermal stratification of lakes in temperate regions. Initially, the surfacewater in water bodies starts cooling. Upon reaching the temperature of 4oC, the surfacewater descends to the bottom as it denser. Upon further cooling between 4-0 degreesoC, a temperature gradient is set up in depths of the water body whereby, the bottom-most layer is at 4°C and the temperature gradually drops as one goes upwards. At 0 oC,ice is formed. If the temperature falls further, the top layer expands and remains on thetop till it freezes. This phenomenon is useful for the preservation of aquatic life in verycold temperatures as even though the upper layer is frozen the water near the bottom isat 4°C and the fishes etc. can survive in it easily.
Temperate lakes have three distinct layers during the summer characterized bytemperature. The upper layer is usually warm water with high dissolved oxygen (DO)concentration.The temperatures change rapidly in the middle layer with depth and themiddle layer has a moderate level of dissolved oxygen. The lowest layer has colder anddenser water which also has lower concentration of dissolved oxygen as it is not exposedto the atmosphere. During the summer, the middle layer prevents the exchange ofnutrients and DO from the bottom of the water sytem to the upper layers. As the weatherbecomes colder, the surface water also gradually cools and sinks to the bottom as itbecomes denser with the fall in temperature to 4°C. This mixing brings the DO from thesurface to the to the bottom while the nutrients from the bottom is carried to the top.During the winter the cold temperature causes the lake to separate into layers of differentdensities. With spring, the surface water reaches maximum density when it warms upto 4°C and sinks through the lower levels of less dense water to the bottom. In thisprocess, tne DO from the surface is carried to the bottom and the nutrients from thebottom to the surface. During the spring, the temperature and the DO of the lake isuniform in the entire lake.
PurposePurposePurposePurposePurposeThe activity will help the students understand the effect of temperature on the densityof water and the concept of anamolous expansion of water
88888

wResources & MaterialsResources & MaterialsResources & MaterialsResources & MaterialsResources & Materials
How Hot and Cold WHow Hot and Cold WHow Hot and Cold WHow Hot and Cold WHow Hot and Cold Watatatatater behave Activityer behave Activityer behave Activityer behave Activityer behave Activity:::::1. Large clear jar or small aquarium2. Smaller jar3. Two small bottles4. Red and blue food colours/ink5. Jug6. Hot and cold water
Ice is lightIce is lightIce is lightIce is lightIce is lighter than wer than wer than wer than wer than watatatatater and oil er and oil er and oil er and oil er and oil ActivityActivityActivityActivityActivity:::::1. Clear drinking glass/beaker2. Coloured ice cubes3. Cooking oil4. Water5. Spoon or 1 kitchen tongs( Optional)
Activities&ProceduresActivities&ProceduresActivities&ProceduresActivities&ProceduresActivities&ProceduresHot and Cold WaterHot and Cold WaterHot and Cold WaterHot and Cold WaterHot and Cold Water
1. Submerge and invert the smaller jar and rest iton the bottom of the larger jar to act as a platformfor the two small bottles.
2. Mix ice, water and about 5 drops of blue foodcolouring to make cold blue water. Use hot wateror boil a kettle to make hot water and colour red.Fill one bottle with the cold blue water and theother with the hot red water.
3.Carefully submerge the bottles into the largejar and rest them on the smaller jar.
ObserObserObserObserObser vvvvvations:ations:ations:ations:ations:
The cold water will descend and the hot waterwill rise– depending on the volume of the largejar, this will continue for many minutes.
Ice is lightIce is lightIce is lightIce is lightIce is lighter than wer than wer than wer than wer than watatatatater and oiler and oiler and oiler and oiler and oil
1. Fill 1/3 of the glass with water. Next, carefullytop up with oil (hold the glass on an angle andpour slowly).
2. Carefully place the coloured ice cube in theoil using tongs so the cube does not fall too deep
ObserObserObserObserObser vvvvvations:ations:ations:ations:ations:
As the ice melts, a droplet collects at the bottomof the cube, causing it to tilt
Once the droplet is heavy enough, it sinks to thebottom of the oil layer – several droplets maycollect here before penetrating into the waterlayer. Eventually, the droplet penetrates the oillayer and mixes into the water layer.
Coloured iceColoured iceColoured iceColoured iceColoured ice
cubecubecubecubecube
Oi lO i lO i lO i lO i l
WaterWaterWaterWaterWater
Colder blue waterColder blue waterColder blue waterColder blue waterColder blue water
going down going down going down going down going down
Hotter red waterHotter red waterHotter red waterHotter red waterHotter red water
going upgoing upgoing upgoing upgoing up
Demonstration of the hot and cold waterexperiment in the class
Demonstration of the experiment in the class
99999

w
Act
ivit
y 4
w
Activity: Looking AroundActivity: Looking AroundActivity: Looking AroundActivity: Looking AroundActivity: Looking Around
ConceptConceptConceptConceptConceptNaturally, water is absorbed to the land, rivers and streams as it flows from the highlandsto the lowlands and ultimately released to the sea. In a small scale, both inorganic andorganic pollutants safely decompose throughout the stream, and they don’t harm thewater bodies. But in an excessive scale, these pollutants have a harmful effect on them.There are a wide variety of pollutants that can affect water and the plants and animalsthat live in the water. Not all pollution is human produced and there are sometimes“natural” reasons for some pollution like volcanic eruptions.
There are six major types of water pollutants:
*Biodegradable wastes*Plant nutrients*Heat*Sediments*Hazardous and toxic chemicals*Radioactive wastes
PurposePurposePurposePurposePurpose
This activity will enable the students to study the area in their vicinity and to analyze thedifferent types of pollution and their causes. Ultimately, students will get a clearunderstanding of how careless use and disposal of wastes and other pollutants isdestroying our water bodies. This particular activity will give the students an opportunityto go beyond their classrooms to understand pollution.
CCCCCHAPTER 2:KNOWING MY WATER BODYHAPTER 2:KNOWING MY WATER BODYHAPTER 2:KNOWING MY WATER BODYHAPTER 2:KNOWING MY WATER BODYHAPTER 2:KNOWING MY WATER BODY
1010101010

wResources & MaterialsResources & MaterialsResources & MaterialsResources & MaterialsResources & Materials1. Paper2. Pencils3. Clipboards4. Rubber gloves5. Plastic bags
Activities & ProceduresActivities & ProceduresActivities & ProceduresActivities & ProceduresActivities & ProceduresFIELD VISIT
1. Arrange a field trip to a wetland area.
2. Designate a record keeper to record thefindings during the field trip.
3. When you get to your wetland look around thewetland area and find as many sources/types ofpollution as possible.
4. The designated recorder will record thedifferent types of pollution found.
5. After recording the different types of pollutionpass out gloves and bags. Then pick up the litterpollution and take back to school and put industbins. After returning back to the classroomdiscuss the pollution observed and the methodsto prevent littering around water bodies. Sincethe visible pollution is often in the form of litter,discuss with your friends the pollution that maybe present, but not seen and the different causesof water pollution.
1111111111

w
Act
ivit
y 5
w
Activity: Mapping the water bodyActivity: Mapping the water bodyActivity: Mapping the water bodyActivity: Mapping the water bodyActivity: Mapping the water body
ConceptConceptConceptConceptConceptNatural forms of pollution have existed since the beginning of this earth and humanshave little control over it. On the other hand the major sources of pollution affecting ustoday are due to human activities and therefore susceptible to human control.
Green Maps are an educational and environmental communication tool for advocacyand public awareness. Green MapsGreen MapsGreen MapsGreen MapsGreen Maps are locally created environmentally themed mapswhich plot the locations of a community’s natural, cultural and sustainable resourcessuch as recycling centers, heritage sites, community gardens, toxic waste sites andsocially conscious businesses.
The purpose of a Green Map is to serve as a guide for sustainable living and to helpeveryone get involved with their community’s natural and man-made environment.
PurposePurposePurposePurposePurposeThis activity will help the students understand the concept of maps while at the sametime help to analyze the surroundings around them and analize the differentenvironmentally benificial and detrimental activities in the area. The students will beable to develop a simple map of the surveyed area representing all the different activitiesand landmarks they have observed during the survey.
Green map
`12`12`12`12`12

wResources & MaterialsResources & MaterialsResources & MaterialsResources & MaterialsResources & Materials1. Chart paper2. Marker pens3. Color pens4. Pencils5. Eraser6. Compass ( Optional)
Activities & ProceduresActivities & ProceduresActivities & ProceduresActivities & ProceduresActivities & Procedures
11111. Ge. Ge. Ge. Ge. Getting stting stting stting stting stttttararararartttttededededed
• Start by choosing an area to explore. Draw orstudy a map showing landmarks and crossroadsof the built environment, including streets, parksand gardens. Check the icons and see if youalready know where some eco-sites are located.
• Discuss the target audience (neighbors, cityresidents, tourists, students, planners & policymakers) and the general outline and goals foryour Green Map.
2. Sur2. Sur2. Sur2. Sur2. Survey the Area and Rvey the Area and Rvey the Area and Rvey the Area and Rvey the Area and Recorecorecorecorecord Yd Yd Yd Yd Your Findingsour Findingsour Findingsour Findingsour Findings
• You might want to begin by looking at eco-friendly transportation, recycling/reuse sites,cultural and historic places that make yourcommunity special, natural areas, habitats andgardens.
• You can point out polluted hot spots along withsites that degrade your environment. While youare in the field, use notebooks to keep track ofthe location of each green site. Some places maybe very small, but if they are important for theenvironment record them as well.
• You can also collect notes on noises andsmells, to share the general impressions aboutthe area.
3. Discuss and Or3. Discuss and Or3. Discuss and Or3. Discuss and Or3. Discuss and Organize the Green Sitganize the Green Sitganize the Green Sitganize the Green Sitganize the Green Siteseseseses
• Your Mapmaking team should then discuss thesites you’ve found and decide which of the Iconsdescribe them best . All members of your teamshould compare their lists of green sites, thenshare the combined list with your class andcommunity. You can Create your own icon or youcan select from the general icons provided inmaps.
Once your final list is complete, organize your listof green sites by type of site and also by location.
4. Mak4. Mak4. Mak4. Mak4. Make ye ye ye ye your Mapour Mapour Mapour Mapour Map
• Plot the Icons in the appropriate places on yourmap. To identify each site, you can:
a) put the site’s name right on the map next tothe Icon
b) number each Icon on the map, then put anumerical list on the side
c) number the sites on the map, then put bothicon and site name in a list on the side. Includethe site’s contact information and coordinates.
• Write a short survey to help gather moreinformation from local residents, shopkeepersand other community members about wildlife,significant organizations, public transportation,cherished cultural sites, and other green placesin your area.
• Check the library for books on local tourismand natural/cultural history. Check withcommunity and government offices, includingPlanning Boards and the Parks Department, tofind out who is working “behind the scenes” forconservation and a healthier environment. Checkbulletin boards for information on eco-eventsand meetings that might lead you to find moresites or discover greening initiatives alreadyunder way in your community. Participate orVolunteer for such causes during your free time.An extra hand of help will always be welcome.
6666666666666666666666666666666666666666666666666666666666666666666666666666666666666666666666666666
1313131313

w
Act
ivit
y 6
w
ConceptConceptConceptConceptConceptThere are various parameters of water that affect its characteristics which in turnaffects the entire ecological system. Few important abiotic factors or parameters areas follows:
pH:pH:pH:pH:pH: It is an important measurement of how acidic or alkaline (basic) the water is. pH ismeasured on a scale of 0 to 14, with 0 being the most acidic, and 14 being the mostbasic. Distilled water, which has no impurities, is neutral, and has a pH of 7. Theaddition or presence of different compounds affects the pH of water according to itscharacteristics. At both very high or low pH, the water cannot support most organisms.Serious problems occur in lakes with pH below 5, and above 9.
TTTTTurbidityurbidityurbidityurbidityurbidity: : : : : This refers to how clear or how cloudy the water is. Clear water has a lowturbidity level and cloudy or muddy water has a high turbidity level. High levels of turbiditycan be caused by suspended particles in the water such as soil, sediments, sewage,and plankton. Soil can get in the water by erosion or runoff from nearby lands. Sedimentscan be stirred up by too much activity in the water, either by fish or humans. Sewage isa result of waste discharge and high levels of plankton may be due to excessive nutrientsin the water.
TTTTTemperemperemperemperemperature: ature: ature: ature: ature: It is the measure of how much heat energy water contains. A stream’stemperature is affected by the season, but also by the source of water, the geographicarea of a stream, the shape of the channel and whether the stream is shaded. Hightemperature enhances the rate of photosynthesis of aquatic plants and the growth ofmicroorganisms which increase the taste, odor, and color of the water. Most aquaticorganisms require a specific temperature range, and many of our sport fish requirecold water. If temperatures are outside the optimal range for a prolonged period, itputs stress on the organisms and ultimately causes death. Variation of water tempera-ture caused by anthropogenic activities should not exceed by 1°C in the summer and2°C in the winter.
PurposePurposePurposePurposePurpose
Different abiotic factors affect the quality of water. This activity will help students tounderstand different abiotic factors of the water sample collected from their surroundingsand its implications to the biotic factors.
CHAPTER CHAPTER CHAPTER CHAPTER CHAPTER 33333: HOW HEALTHY IS MY WATER: HOW HEALTHY IS MY WATER: HOW HEALTHY IS MY WATER: HOW HEALTHY IS MY WATER: HOW HEALTHY IS MY WATER BODY BODY BODY BODY BODY
Activity: The abiotic factors that affect myActivity: The abiotic factors that affect myActivity: The abiotic factors that affect myActivity: The abiotic factors that affect myActivity: The abiotic factors that affect mywaterwaterwaterwaterwater
HydrHydrHydrHydrHydrococococochoric Acid lemon cofhoric Acid lemon cofhoric Acid lemon cofhoric Acid lemon cofhoric Acid lemon coffffffee Pure Wee Pure Wee Pure Wee Pure Wee Pure Watatatatate Dee Dee Dee Dee Detttttererererergent Sodium Hydrgent Sodium Hydrgent Sodium Hydrgent Sodium Hydrgent Sodium Hydroxide ( a base)oxide ( a base)oxide ( a base)oxide ( a base)oxide ( a base)
pH Scale
1414141414

wResources & MaterialsResources & MaterialsResources & MaterialsResources & MaterialsResources & Materials1. pH test kits (litmus solution or litmus paper)2. Turbidity tube3. Field thermometer4. Pipette
Activities & ProceduresActivities & ProceduresActivities & ProceduresActivities & ProceduresActivities & ProcedurespH measurementpH measurementpH measurementpH measurementpH measurement
1. Dip one strip of indicator (litmus) paper in tothe stream and pull it out quickly.
2. Wait 1 minute.
3. Compare the color of the litmus paper to thepH color key on the pH box.
4. Record the number associated with the correctcolor match on the student worksheet.
5. Another easy experiment can be conducted tosee how respiration alone in absence ofphotosynthesis and regular mixing of waterlayers also changes the pH level of water. Take asmall beaker or a big test tube with the tap water.Test it with a litmus paper.
If the turbidity of the water is high, there will be manysuspended particles in it. These solid particles willblock sunlight and prevent aquatic plants fromgetting the sunlight they need for photosynthesis. Theplants will produce less oxygen thereby decreasingthe Dissolved Oxygen (DO) levels. The plants will diemore easily and be decomposed by bacteria in thewater, which will reduce the DO levels even further.Suspended particles in the water also absorbadditional heat from sunlight which will result inwarmer water. Warm water is not able to hold as muchoxygen as cold water so DO levels will decrease,especially near the surface.
TTTTTemperemperemperemperemperatureatureatureatureature
1. Dip the thermometer into a moving part of thestream or river.
2. Wait for the temperature to stop changing (atleast 1 minute)
3. Lead the temperature and record on thestudent worksheet.
TTTTTurbidityurbidityurbidityurbidityurbidity
(Turbidity tube)
1. Fill the turbidity tube with the water sample
2. Take your filled turbidity tube to a shaded spot.If there is no shade, use your body to block thesun from shining on the tube.
3. With your hand over the opening, shake thetube vigorously. This will help to re-suspend anysediment that has settled to the bottom.
4. Look down through the tube toward the targetdisk on the bottom of the tube.
5. If the disk is visible, record the water level incentimeters (cm).
6. If the disk is not visible, slowly release waterfrom the release valve until the disk becomesvisible. Record the water level in centimeters(cm) on the worksheet.
7. This method is more appropriate for shallowwater.
1515151515

w
Act
ivit
y 7
w
Activity: How clear is my waterActivity: How clear is my waterActivity: How clear is my waterActivity: How clear is my waterActivity: How clear is my water
ConceptConceptConceptConceptConceptAll streams have naturally occurring suspended sediments from decayed organic matter,minerals and sediments carried down from upstream. Light’s ability to pass throughwater depends on how much suspended material is present. Transparency is the measureof how turbid the water is or how cloudy the water is. Low transparency is detrimental toaquatic life. Silt, micro organisms, plant fibers, chemicals, sewage, and plankton arethe common sources of turbidity. Turbidity of the water prevents the sunlight frompenetrating into the water and reaching to the aquatic plants thereby reducing the rateof photosynthesis. This in turn reduces the oxygen level in the water while increasing thelevel of carbon dioxide.
PurposePurposePurposePurposePurposeThrough this experiment the students will be able to measure the clarity of the waterbody.
Secchi disc
1616161616
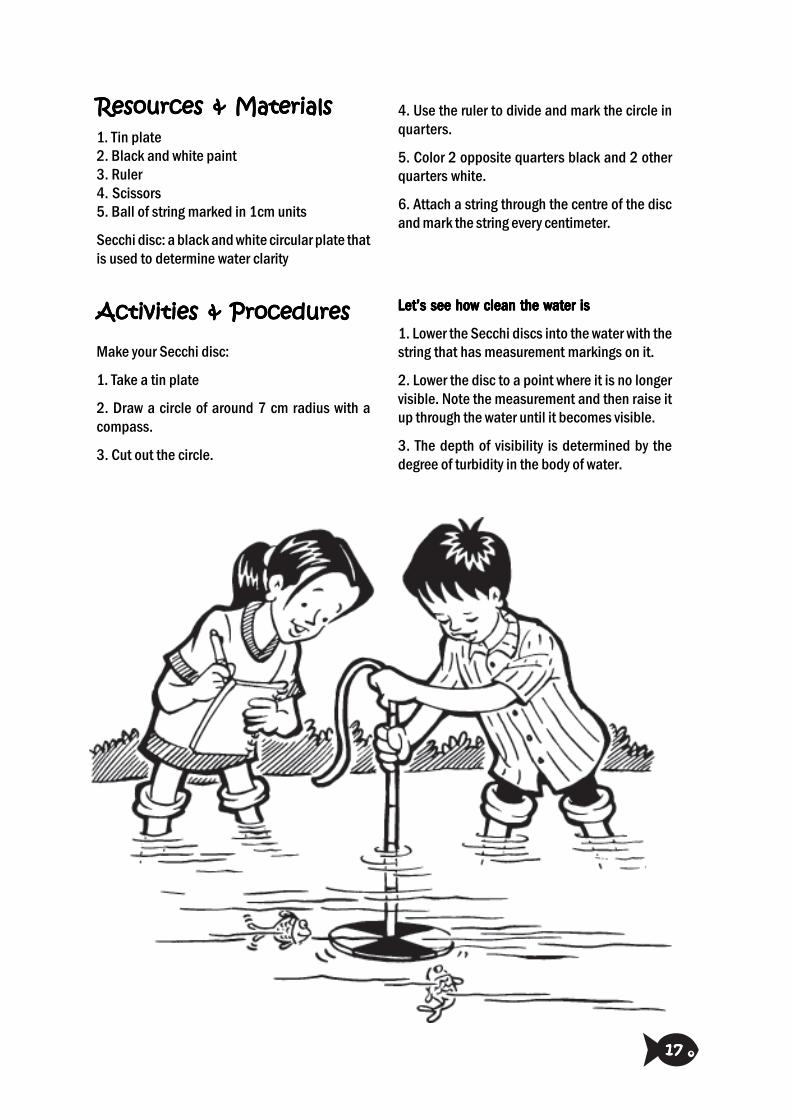
wResources & MaterialsResources & MaterialsResources & MaterialsResources & MaterialsResources & Materials1. Tin plate2. Black and white paint3. Ruler4. Scissors5. Ball of string marked in 1cm units
Secchi disc: a black and white circular plate thatis used to determine water clarity
Activities & ProceduresActivities & ProceduresActivities & ProceduresActivities & ProceduresActivities & Procedures
Make your Secchi disc:
1. Take a tin plate
2. Draw a circle of around 7 cm radius with acompass.
3. Cut out the circle.
LeLeLeLeLet’s see how clean the wt’s see how clean the wt’s see how clean the wt’s see how clean the wt’s see how clean the watatatatater iser iser iser iser is
1. Lower the Secchi discs into the water with thestring that has measurement markings on it.
2. Lower the disc to a point where it is no longervisible. Note the measurement and then raise itup through the water until it becomes visible.
3. The depth of visibility is determined by thedegree of turbidity in the body of water.
4. Use the ruler to divide and mark the circle inquarters.
5. Color 2 opposite quarters black and 2 otherquarters white.
6. Attach a string through the centre of the discand mark the string every centimeter.
1717171717

w
Act
ivit
y 8
w
Activity: Measuring stream flow by FloatActivity: Measuring stream flow by FloatActivity: Measuring stream flow by FloatActivity: Measuring stream flow by FloatActivity: Measuring stream flow by FloatMethodMethodMethodMethodMethod
ConceptConceptConceptConceptConceptThe amount of water flowing in a stream or river directly affects its habitat quality andmay impact the usage of the waterway. The more water there is, the longer it takes toheat up or cool down. Fish and other aquatic organisms require certain volumes of waterfor their survival. Stream flow is a measure of the velocity of stream waters. In otherwords, data on stream flow give information on how fast water is moving past a givenpoint over a given time period.
Velocity: Velocity or rate of flow is the distance the water flows in a certain period oftime.
V = travel distance/ travel time = L/t
The speed of water, or its velocity, varies greatly between different areas of a stream. Astream’s velocity can change from day to day and from year to year depending on variousfactors such as the rainfall pattern, levels of pollution, erosion, etc.
PurposePurposePurposePurposePurposeThe basic idea is to measure the time that it takes the object to float a specified distancedownstream. Float method is an inexpensive and simple method to measure surfacevelocity
1818181818

wResources & MaterialsResources & MaterialsResources & MaterialsResources & MaterialsResources & Materials1. Stop-watch2. Highly visible buoyant objects like ping pongballs/empty plastic bottles3. Measuring tape
Activities & ProceduresActivities & ProceduresActivities & ProceduresActivities & ProceduresActivities & Procedures1. Choose a suitable straight stretch of the riverwith minimum turbulence
2. Mark the start and end point of your reach.
3. If possible, travel time should exceed 20seconds.
4. Drop your object into the stream a few metersahead of the starting point.
5. Start the stopwatch when the object crossesthe start position and stop the watch when itcrosses the finishing point. Take atleast 3readings
Usually in a stream high velocity is considered goodas high velocity or stream flow also increases theamount of DO because of the greater movement ofwater which increases the amount of oxygenabsorbed.
Velocity or the stream flow increases after a heavyrainfall. It also on the other hand might increaseerosion of the banks, carrying with it sediment andother pollutants.
1919191919
w
Act
ivit
y 9
w
Activity: Chemicals in my waterActivity: Chemicals in my waterActivity: Chemicals in my waterActivity: Chemicals in my waterActivity: Chemicals in my waterConceptConceptConceptConceptConceptDissolved OxyDissolved OxyDissolved OxyDissolved OxyDissolved Oxygengengengengen
Almost all animals and plants need oxygen to survive. Fish and some aquatic insectshave gills to extract oxygen from the water. Different organisms need varying levels ofoxygen to survive. Low levels or absence of oxygen in an aquatic environment mean thesystem is going to lose or has lost those creatures that depend on high levels of oxygen.
A certain amount of oxygen diffuses into the water from the air. Fast moving water andwaves mix oxygen into the water. Aquatic plants and algae also add oxygen to the waterthrough the process of photosynthesis. Low Dissolved Oxygen concentration is damagingto aquatic life - only the hardiest organisms survive. In order to maintain stable fishpopulations DO of no less than 5.0 mg/l during early life stages of the fish is required.As the temperatures rise, because the metabolic rates of the organisms increase, theOxygen Demand also increase but the solubility of oxygen is lower at highertemperatures.Generally DO is low during night as the plants respire and photosynthesisis absent thus DO levels can fluctuate quite dramatically throughout a 24 hour cycle.
NitrNitrNitrNitrNitratatatatateeeee
Nitrates are a form of nitrogen. Nitrates stimulate the growth of plankton and waterweedsthat provide food for fish. This may increase the fish population. However, in excess amountsthey can cause significant water quality problems. If algae grow too wildly, oxygen levels willbe reduced and fish will die. Humans also add nitrates to the environment through poorlyfunctioning sewage and septic systems, fertilizers, and feed a lot of run-off.
Since nitrogen is a plant nutrient, it encourages excessive aquatic plant growth thatleads to eutreutreutreutreutrophicationophicationophicationophicationophication. Water with high levels of fertilizers such as nitrates andphosphates support huge amounts of aquatic plant and algae growth. When these plantsdie, the organisms that decompose them use up tremendous amounts of oxygen in thewater. The decomposition process can use up all oxygen in the water suffocating aquaticanimal life in the process. Eutrophication is one of the major water quality problems weface today.
PhosphatPhosphatPhosphatPhosphatPhosphateeeee
Phosphorous is found in natural rocks, domestic sewage and decaying vegetablematter. Phosphorous as phosphate is an essential element for life as a nutrient and asa key element in the metabolic processes of all living organisms. Nearly all fertilizerscontain phosphates. Phosphates stimulate the growth of plankton and water plantsthat provide food for fish. This may increase the fish population and improve thewaterway’s quality of life. If too much phosphate is present, algae and water weedsgrow wildly, choke the waterway, and use up large amounts of oxygen killing fish and aquaticorganisms in the water body.
PurposePurposePurposePurposePurpose
The students will be able to understand the various chemical parameters that affectthe water body.
2020202020

wResources & MaterialsResources & MaterialsResources & MaterialsResources & MaterialsResources & MaterialsDO test kitsNitrate test kitsPhosphate test kits
Activities & ProceduresActivities & ProceduresActivities & ProceduresActivities & ProceduresActivities & Procedures1. Collect the water sample from below the surfaceof the water body.
2. Submerge the sampling bottle and let thewater flow into the bottle for several minutes.
3. Make sure there are no air bubbles in thesample jar when you remove it from the water.
4. Follow the directions on the Dissolved oxygenkit.
TTTTTesesesesesting the sampleting the sampleting the sampleting the sampleting the sample
DISSOLDISSOLDISSOLDISSOLDISSOLVED OVED OVED OVED OVED OXYXYXYXYXYGENGENGENGENGEN
1. Slowly open the lid of DO bottle and add 11drops of Dissolved Oxygen Reagent1.
2. Add 11 drops of Dissolved Oxygen Reagent
3. Recap the DO bottle and carefully remove theexcess solution.
4. Shake the bottle by inverting several times.Precipitate will form.
5. Allow the precipitate to settle about 5minutes. The sample is now fixed and ready fortest. (The sample need not be testedimmediately after being fixed.)
6. Remove the cap of the DO bottle and add 1mlof Dissolved Oxygen reagent 3
7. Carefully throw the overflowing solution andrecap the bottle and shake by inverting until theprecipitate dissolves.
8. Light straw yellow to brown-orange color willdevelop, depending on the oxygen content of thesample.
9. Measures 10 ml sample in the 10ml syringeand transfer it to the test-tube and add I drop ofDissolved Oxygen Reagent 4. The color willchange from yellow to blue (or dark purpledepending on the oxygen content).
10. Fill 1ml syringe with Dissolved OxygenReagent
11. Slowly add the Dissolved Oxygen reagent 5in solution drop by drop. Shake the tube aftereach drop. Continue adding the reagent till theblue color just disappears and turns colorless.
Calculation:Calculation:Calculation:Calculation:Calculation:
Dissolved Oxygen (mg/l) = Drops of DissolvedDissolvedDissolvedDissolvedDissolvedoxyoxyoxyoxyoxygen reagent 5 gen reagent 5 gen reagent 5 gen reagent 5 gen reagent 5 consumed X 0.8
NITRATE TEST NITRATE TEST NITRATE TEST NITRATE TEST NITRATE TEST
1. Take 5ml watersample in 50mltest tube usingsyringe. Heat thetube andevaporate all thewater.
2. Cool and add 8 drops of Nitrate Reagent 1.
3. Shake briskly and dissolve residue and add2ml of distilled water and shake. Wait for it tocool down.
4. Add 1 ml of Nitrate Reagent 2. and shake .Then transfer to vial and add 1.5ml of distilledwater.
5. Match the observed color with the Nitratecolor-chart within one minute.
PHOSPHAPHOSPHAPHOSPHAPHOSPHAPHOSPHATE TESTE TESTE TESTE TESTE TESTTTTT
1. Take 5ml sample in the vial using syringe andadd 4 drops of Phosphorus Reagent 1 and shake.Then add 1 drop of Phosphorus Reagent 2 andshake.
2. Match the observed color with the Phosphoruscolor-chart.
In most uncontaminated lakes the phosphateconcentration is 0.01-0.03 mg/L and therecommended maximum concentration for rivers andstreams is 0.1 mg/L
Nitrates are good indicatorsof pollution. Usually nitrateconcentrations in naturalstreams and rivers are lessthan 2 to 3 mg/l. An increasein the nitrate levels is anindication of inorganicpollution.
Dissolved oxygen is one of the best indicators of thehealth of a water ecosystem. Dissolved oxygen canrange from 0-18 parts per million (ppm), but mostnatural water systems require 5-6 parts per millionto support a diverse population. A decrease in thedissolved oxygen levels is usually an indication of aninflux of some type of organic pollutant.
2121212121

w
Act
ivit
y 1
0
w
Activity: What lives in my water bodyActivity: What lives in my water bodyActivity: What lives in my water bodyActivity: What lives in my water bodyActivity: What lives in my water body
ConceptConceptConceptConceptConceptThe aquatic macrmacrmacrmacrmacro invero invero invero invero invertttttebrebrebrebrebratatatatates es es es es are the tiny invertebrates, visible to the eye, living inour water systems. These macro invertebrates include many types of insects as well asother animals such as worms, mollusks and tiny crustaceans. These organisms areinfluenced by various external factors such as climate, condition of the water includingchemical conditions, temperature, clarity, velocity, depth, food availability, presence ofpredators. Often, polluted water has a high number of organisms but the number ofdifferent types of species is greatly reduced.
The types and abundance of macro invertebrates in the water body is an importantindicator of water quality. Different macro invertebrates tolerate different types of streamconditions. Depending on what we find, we can make predictions about water quality.
GrGrGrGrGroup 1 oup 1 oup 1 oup 1 oup 1 - Sensitive or Intolerant SpeciesOrganisms that are easily killed, impaired or driven off by bad water quality: these includestonefly, dobsonfly and mayfly nymphs, caddis fly larvae, water pennies and snails.
GrGrGrGrGroup 2 oup 2 oup 2 oup 2 oup 2 - Somewhat Tolerant SpeciesOrganisms that have the ability to live under varying conditions. You may find them ingood or poor quality water. These organisms include amphipods, scuds, beetle andcranefly larvae, crayfish and dragonfly nymphs.
GrGrGrGrGroup 3 oup 3 oup 3 oup 3 oup 3 - Tolerant SpeciesOrganisms capable of withstanding poor water quality: these include leeches, snails,aquatic worms, midge larvae and sowbugs.
PurposePurposePurposePurposePurpose
In this activity, students will collect and observe macro invertebrates in an aquatic systemand investigate the diversity of living organisms in a specific area through observationand charting.
2222222222

wResources & MaterialsResources & MaterialsResources & MaterialsResources & MaterialsResources & Materials1. Net2. Plastic pan3. Petri dishes4. Magnifying glasses or microscope (optional)
Activities & ProceduresActivities & ProceduresActivities & ProceduresActivities & ProceduresActivities & Procedures1. Select a sampling site that is safe and easilyaccessible.
2. Wade into the water body and place your netso the mouth of the net is perpendicular to andfacing the flow of water.
3. Stand upstream of the net and disturb thestream bottom with your feet and hands.
4. Scoop material from the stream bottom withthe net. Try to scoop up as little sediment aspossible as this will make it difficult to sort themacro invertebrates.
5. Carefully remove attached organisms from thestones in the sampling area. The stream bottommaterial and organisms will be carried by thecurrent into the net.
6. Hand picks organisms from sticks and otherstructures.
7. Continue this process until you have at least100 organisms
7. Hold your sampling net over a plastic pan anduse a bucket of stream water to wash the materialinto the pan.
8. If your sample contains a lot of rocks or debris,stir the sample in the pan to suspend the animals,then pour the suspended material back into yournet. Rinse the debris from the pan, and then washthe animals in the net back into the pan.
9. Pour most of the water from the pan, so that thematerials and animals are no longer floating.Distribute the material evenly in the bottom ofthe pan.
10. Add some stream water back into the pan foreasier sorting.
11. Sort and identify the macro invertebrates.
12. Use Petri dishes to group similar organisms.
13. Keep track of the number of types of organismson the student worksheet.
14. Count of number of different types of eachorganism in each sample.
15. Present the data in the tables or graph.
2323232323

w
How Healthy is my Water BodyHow Healthy is my Water BodyHow Healthy is my Water BodyHow Healthy is my Water BodyHow Healthy is my Water Body
Abiotic ComponentsAbiotic ComponentsAbiotic ComponentsAbiotic ComponentsAbiotic ComponentsSitSitSitSitSite Obsere Obsere Obsere Obsere Obser vvvvvations:ations:ations:ations:ations:1 Site Name: __________________
2 Date: ______________________
3 Time: ______________________
4 Type of waterbody (e.g., stream, lake, wetland):
____________________________________________
5 Weather today: ___________________________________________
6 Turbidity and color of water: ___________________________________________
7 Water odor: ___________________________________________
8 Water temp:
____________________________________________
9 What type of land uses are in the immediate area? ____________________________________________
10 Is the area shaded by trees? _____________________
11 List all microorganisms that you observed in this aquaticecosystem:_________________________________________________
_________________________________________________
_________________________________________________
_________________________________________________
_________________________________________________
Ann
ex 1
2424242424

w12. List all other abiotic factors you can observe that might be important in this aquaticecosystem:
YYYYYour Rour Rour Rour Rour ResultsesultsesultsesultsesultsParametersParametersParametersParametersParameters Allowable RangeAllowable RangeAllowable RangeAllowable RangeAllowable Range
Ortho phosphates
Nitrates
Turbidity
Dissolved Oxygen
pH 6 to 9
5-6 mg/l
Less than 2 to 3 mg/l
Lakes: 0.01-0.03 mg/l
Rivers & Streams: 0.1 mg/l
Water DepthWater DepthWater DepthWater DepthWater Depth
For water over 4 feet
For water less than 2 feet
2 to 4 feet of water(Secchi disc on the bottom)
2 to 4 feet of water
For water less than 2 feet(Secchi disc on the bottom)
Sechhi Disc VisibilitySechhi Disc VisibilitySechhi Disc VisibilitySechhi Disc VisibilitySechhi Disc Visibility
Disappears in less than 1 foot (30 cm)
Disappears in less than 1 to 2 feet(31 to 60 cm)Disappear in less than 2.1 to 4 feet(61 to 120 cm)
Visible at more than 4 feet(121 cm or more)
Disappears at less than 1 foot(less than 30 cm)
Visible but black/white boundarynot defined clearly
Visible but black/white boundarydefined clearly
Disappears at less than 1 foot(less than 30 cm)
Disappears at less than 1 to 2 feet(31 to 60 cm)
Visible but black/white boundarynot defined clearly
Visible but black/white boundarydefined clearly
TTTTTurbidity Ratingurbidity Ratingurbidity Ratingurbidity Ratingurbidity Rating
Moderately Turbid
Slightly Turbid
Clear
Turbid
Turbid
Turbid
Moderately Turbid
Moderately Turbid
Clear
Clear
Slightly Turbid
2525252525
w
Ann
ex 2
w
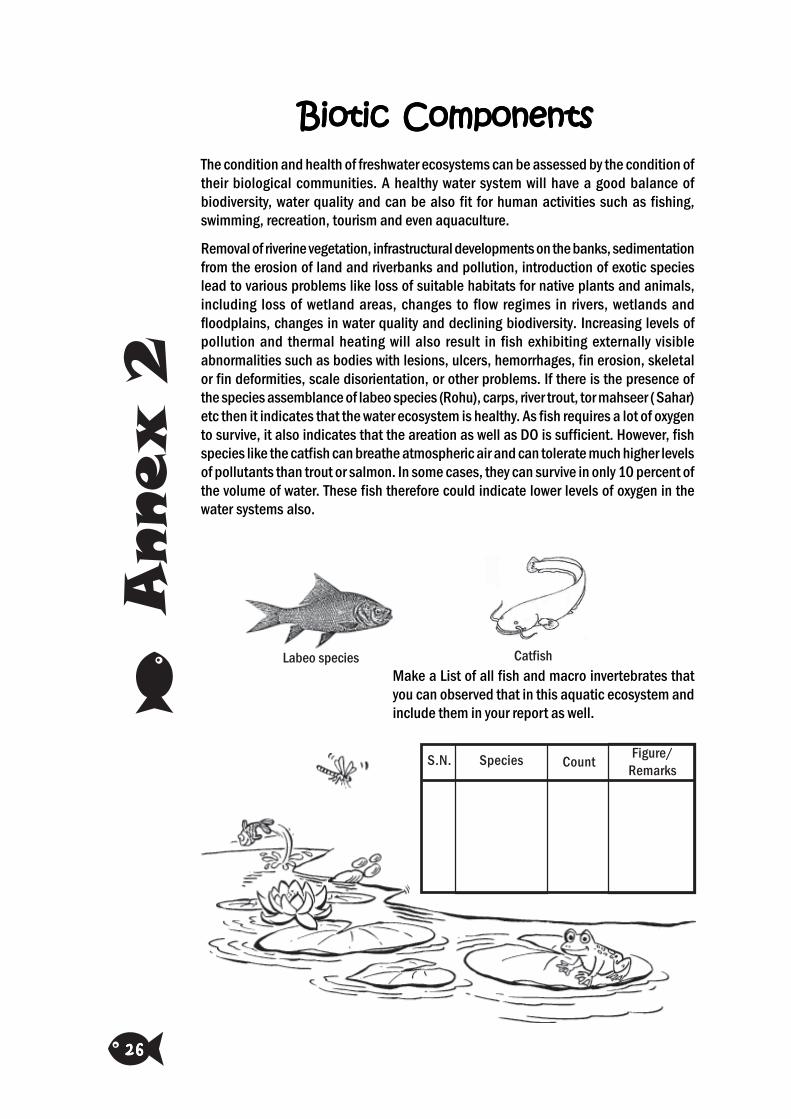
The condition and health of freshwater ecosystems can be assessed by the condition oftheir biological communities. A healthy water system will have a good balance ofbiodiversity, water quality and can be also fit for human activities such as fishing,swimming, recreation, tourism and even aquaculture.
Removal of riverine vegetation, infrastructural developments on the banks, sedimentationfrom the erosion of land and riverbanks and pollution, introduction of exotic specieslead to various problems like loss of suitable habitats for native plants and animals,including loss of wetland areas, changes to flow regimes in rivers, wetlands andfloodplains, changes in water quality and declining biodiversity. Increasing levels ofpollution and thermal heating will also result in fish exhibiting externally visibleabnormalities such as bodies with lesions, ulcers, hemorrhages, fin erosion, skeletalor fin deformities, scale disorientation, or other problems. If there is the presence ofthe species assemblance of labeo species (Rohu), carps, river trout, tor mahseer ( Sahar)etc then it indicates that the water ecosystem is healthy. As fish requires a lot of oxygento survive, it also indicates that the areation as well as DO is sufficient. However, fishspecies like the catfish can breathe atmospheric air and can tolerate much higher levelsof pollutants than trout or salmon. In some cases, they can survive in only 10 percent ofthe volume of water. These fish therefore could indicate lower levels of oxygen in thewater systems also.
Biotic ComponentsBiotic ComponentsBiotic ComponentsBiotic ComponentsBiotic Components
Labeo species CatfishMake a List of all fish and macro invertebrates thatyou can observed that in this aquatic ecosystem andinclude them in your report as well.
Species Count Figure/Remarks
S.N.
2626262626

w
Stonefly nymph: Stonefly nymphs have two long tails.Their size range from 7-12 mm long. Most Stoneflynymphs eat dead plants and algae. Some species arecarnivorous. Stonefly nymphs require well oxygenatedwater so are consequently found in rivers and streamsamongst the rocks and bottom debris, a few speciescan also be found in the rocky shoals of cold lakes.
Dobsonfly nymph: The dobsonfly nymph feed onsmaller aquatic invertebrates. They are large larvae upto 3 inches (7.5 cm) in length. They are most often foundin fast moving streams.
Mayfly nymph: Mayfly Nymphs usually have three longtails or. Some species have leaf-like side gills alongtheir abdomen. They have a single claw on each leg,short antennae and sometimes, wing pads. MayflyNymphs live under stones in fast-flowing water oramong plants in slow streams. Some species live insmall burrows at the bottom of the stream.
Caddisfly larvae: The Caddisfly Larva (plural – larvae)are worm-like with three pairs of well-developed legson the first three body segments and hooks on the lastone. They live in a wide range of environments fromfast flowing streams to freshwater ponds. Caddisfliesare related to butterflies and moths.The CaddisflyLarva cannot tolerate low oxygen levels.
Water pennies:The water penny is the aquatic larva ofa beetle; the adult of the species is not aquatic. Thebody is often stuck flat to surfaces and looks like atiny round leaf.
Water macroinvertibrate keyWater macroinvertibrate keyWater macroinvertibrate keyWater macroinvertibrate keyWater macroinvertibrate keyGroup 1 Group 1 Group 1 Group 1 Group 1 - Sensitive or Intolerant Species
2727272727

w
GrGrGrGrGroup 2 oup 2 oup 2 oup 2 oup 2 - Somewhat Tolerant Species
Scuds: Scuds are tiny crustaceans, close relatives ofcrayfish, water fleas, and shrimp. They probably lookthe most like shrimp. Scuds live in water, such asstreams, ponds, and lakes. They are rarely found inrivers. They like shallow water and do best in waterwhere there are no fish. Scuds have two pairs ofantennae (like all crustaceans) and seven pairs of legs(like isopods).
Beetle: Water beetle name for aquatic beetles ofseveral families. They are widespread in quiet streamsand ponds. They are black, brown, or greenish, .08 to1.57 in. (3-40 mm) long, with smooth oval bodies andhairy, oarlike hind legs. They feed on small insects onthe surface and seldom dive.
Cranefly larvae: Cranefly larvae are brownish-green tosomewhat transparent or whitish; pointed or roundedat one end and a set of disk-like spiracles at the other.They are up to 3 inches in length. They indicatemoderately clean water; seldomly found in pollutedwaters.
Crayfish : Crayfish, crawfish, or crawdads arefreshwater crustaceans resembling small lobsters, towhich they are related. they are also mostly found inbrooks and streams where there is fresh runningwater. Most crayfish cannot tolerate polluted water.Crayfish feed on living and dead animals and plants.
Dragonfly nymphs: Dragonfly Nymphs are short andchunky with wing pads and internal gills. Their six legsare all located near the head. Dragonfly nymphs liveon plants, among stones, leaf litter, or at the bottomof ponds or slow-flowing rivers. They feed mostly onother insects in the water. Sometimes, they can becannibals and eat each other. Some of the largerspecies have been known to feed on small fish andtadpoles.2828282828

wGrGrGrGrGroup 3 oup 3 oup 3 oup 3 oup 3 - Tolerant Species
Leeches: Leeches are segmented, cylindrical wormswith a sucker on each end, one being a mouth.Leeches are found in warm, slow-flowing rivers orponds. They prefer shallow water, and live under rocksand debris, or on plants, where they attach themselvesto something solid.Many leeches feed on the bloodof vertebrates. Leeches are able to survive where thereis not much oxygen. They can also tolerate variouschemical pollutants.
Aquatic worms: Aquatic worms can be found anywherethere is fresh water, including lakes, ponds, marshes,and streams. They prefer shallow water. As the wormeats mud with its head down below, the dirt comesout the back end of the worm. This soil-moving is veryimportant to keep the stream or lake healthy. Aquaticworms also break down pollutants which settle to thebottom and poison the water.
Midge lar vae: These are sometimes called'bloodworms' because of their bright red colour, butthey are not worms at all. They are midge larvae. Thelarvae eat the dead organic material at the bottom ofthe pond. They can tolerate very low oxygen levels andare often found in very large numbers in the sludge atthe bottom of stagnant ponds.
Sowbugs: The sowbug is a scavenger that uses itsseven pairs of legs to move around the bottom ofstreams and ponds feeding on dead plants. Itbreathes through gills located on its belly. The isopodseyes are very sensitive to light; therefore, it is usuallyactive only at night. It can live in water with low oxygentypical of polluted water.
Snails: Freshwater snails are similar to slugs but havea spiral shell encasing their soft bodies. Freshwatersnails live in calm parts of streams or ponds, attachedto plants or rocks.They feed on algae, and dead anddecaying plants in the water.
2929292929

w
FUN FACTSFUN FACTSFUN FACTSFUN FACTSFUN FACTS
e Did you know that you could get drunk on water? Well, drinking too much watercauses the sodium levels in the bloodstream to dilute causing imbalance ofwater in your brain. This is called ‘water intoxication’.
e Wonder why ice floats on water? That is because ice is about 9% lighter thanwater.
e Once you drink water, it leaves your stomach in about 5 minutes!
e A person can live without food for a few weeks but a person can only live withoutwater for a few days.
e The father of medicine, Hippocrates, told people to boil their water and strain itbefore drinking it.
e Water makes up 80% of an earthworm, 70% of a chicken, and 70% of anelephant
e Water makes up 90% of a tomato, 80% of pineapples and corn, and 70% of atree.
e By the time a person feels thirsty, his or her body has lost over 1 percent of itstotal water amount.
e The weight a person loses directly after intense physical activity is weight fromwater, not fat.
Ann
ex 3
w
3030303030

w A
nnex 4
w
Water conservation is the most cost-effective and environmentally sound way to reduceour demand for water. We use water in many ways, but are we using it wisely? Here are afew things that you can do to ensure that you do not waste water:
\ Try to do one thing each day that will result in saving water. Don’t worry if thesavings are minimal, every drop counts! You can make a difference.
\ Remember to use only the amount you actually need.
\ Make sure that your home is leak-free. Many homes have leaking pipes that gounnoticed.
\ Do not leave the tap running while you are brushing your teeth or soaping yourface and body. Just run it long enough to wet your toothbrush or yourself, andthen shut it off until you need to rinse.
\ Avoid flushing the toilet unnecessarily. Put a brick or any other weight thatoccupies space to cut down on the amount of water needed for each flush.
\ Don't use your toilet as a wastepaper basket. It has its purpose, and use it forthat only.
\ Do not throw away water that has been used for washing vegetables, rice ordals, use it to water plants or to clean the floors, etc
\ You can store water in a variety of ways. A simple method is to place a drum ona raisedplatform directly under the rainwater collection source.
\ You can also collect water in a bucket during the rainy season.
\ Always, always shut off the faucet when you are finished using the water.
\ Don't pour chemicals down the drain or on the ground.
\ Don't pour chemicals down the storm sewer.
TIPS TO CONSERVE WATERTIPS TO CONSERVE WATERTIPS TO CONSERVE WATERTIPS TO CONSERVE WATERTIPS TO CONSERVE WATER
3131313131

w
GlossaryGlossaryGlossaryGlossaryGlossaryBiosphere: Biosphere is the zone of the earthwhere life is found. The biosphere extends tothe upper areas of the atmosphere wherebirds and insects can be found and reachesdeep into the ground or to the bottom of theocean. The biosphere extends to any placewhere life of any kind can exist on Earth.
Dissolved oxygen: Dissolved oxygen is theamount of oxygen that is dissolved in water.The oxygen dissolves in the water by diffusionfrom the surrounding air; aeration of waterthat has tumbled over falls and rapids; andas a product of photosynthesis.
Eutrophication: Physical, chemical andbiological changes that take place in a waterbody when it receives inputs of plantnutrients- mostly nitrates and phosphatesfrom natural erosion and runoff from thesurrounding land.
pH: pH is the numeric value that indicates therelative acidity or alkalinity of a substance ina scale of 0 to 14 with the neutral point at 7.Acid solutions have a pH below 7 while thebases have a pH value greater than 7.
Sediment - Solid material that originatesmostly from disintegrated rocks and is
transported by, suspended in, or deposited fromwater; it includes chemical and biochemicalprecipitates and decomposed organic material suchas humus. The quantity, characteristics, and causeof the occurrence of sediment in streams areinfluenced by the quantity and intensity ofprecipitation.
Stream flow: Streamflow is the amount of waterflowing in streams, rivers, and other channels over adesignated point over a fixed period of time. It isoften expressed as cubic feet per second (ft/sec).Streamflow is the main mechanism by which watermoves from the land to the oceans.
Temperature: The degree of hotness or coldness of abody or environment.Temperature is measured withthermometers in a variety of temperature scales. TheCelsius scale is most widely used scale fortemperature measuring purposes.
Thermal stratification: Horizontal layers of differingdensities of water produced in a lake by temperaturechanges at different depths.
Water quality : The chemical, physical, andbiological characteristics of water with respect to itssuitability for a particular use.
Water shed: The land area from which surface runoffdrains into a stream channel, lake,reservoir or otherbody of water; also called a drainage basin.
ReferencesReferencesReferencesReferencesReferencesAmerican Forest Foundation. Project Learning Tree: Environmental Education PreK-8 Activity Guide2006Miller, Jr. G. T. (2002). Living in the Environment, Wardsworth Publication Company, Belmont,CaliforniaStream Side Science: Lesson Plans and Water Related Activities (http://extension.usu.edu/waterquality)www.sciencenetlinks.com
3232323232

ISBN:978-9937-8277-1-3Printed 2010