understanding water flows and air venting features of
TRANSCRIPT

Water 2020, 12, 2106; doi:10.3390/w12082106 www.mdpi.com/journal/water
Technical Note
Understanding Water Flows and Air Venting Features of Spillway—A Case Study James Yang 1,2,*, Penghua Teng 2,*, Qiancheng Xie 3,* and Shicheng Li 2,*
1 Vattenfall, R&D Hydraulic Laboratory, 81426, Älvkarleby, Sweden 2 Department of Civil and Architectural Engineering, Royal Institute of Technology,
10044 Stockholm, Sweden 3 Division of Fluid and Experimental Mechanics, Luleå University of Technology, 97754 Luleå, Sweden * Correspondence: [email protected] (J.Y.); [email protected] (P.T.); [email protected] (Q.X.);
[email protected] (S.L.)
Received: 26 June 2020; Accepted: 22 July 2020; Published: 24 July 2020
Abstract: For safe spillway discharge of floods, attention is paid to the water flow. The resulting air flow inside the facility, an issue of personnel security, is sometimes disregarded. The spillway in question comprises two surface gates and two bottom outlet gates lying right below. Air passages to the outlet gates include an original gallery and a recently constructed vertical shaft. To understand water-air flow behavior, 3D CFD modelling is performed in combination with the physical model tests. The simulations are made with fully opened radial gates and at the full pool water level (FPWL). The results show that the operation of only the bottom outlets leads to an air supply amounting to ~57 m3/s, with the air flow rates 35 and 22 m3/s to the left and right outlets. The air supply to the right outlet comes from both the shaft and the gallery. The averaged air velocity in the shaft and the gallery are approximately 5 and 7 m/s. If only the surface gates are fully open, the water jet impinges upon the canal bottom, which encloses the air space leading to the bottom outlets; the air flow rate fluctuates about zero. If all the four gates are open, the total air demand is limited to ~10 m3/s, which is mainly attributable to the shear action of the meeting jets downstream. The air demand differs significantly among the flow cases. It is not the simultaneous discharge of all openings that results in the largest air demand. The flood release from only the two outlets is the most critical situation for the operation of the facility. The findings should provide reference for spillways with the same or similar layout.
Keywords: spillway; flood discharge; air-water flow; air demand; CFD
1. Introduction
In a high-head dam facility, flood discharge from a surface spillway or low-level outlet leads to high-velocity flow that entrains air in the surface water. In connection with new and even existing installations, air entrainment caused by free-surface flows has been a topic for many research projects, which is due to its complexity by nature and engineering implications. A general reference on air entrainment and energy dissipation in spillways and other hydraulic structures is written by Chanson [1]. More descriptions and practical examples are found in [2‒5]. A recent, albeit partial, review of the subject is made by Lian et al. [6] and Yang et al. [7]. An immediate consequence of air entrainment is the safety margin of sidewalls that shape the waterway. Because of the volume bulking of the surface water, sufficient wall heights are required to accommodate the flow. For bottom outlets, this concerns the choice of conduit height (free board). The second aspect is the air-carrying capacity of the flow that entails air supply, whereby formation of negative air pressure in a confined space and other unfavorable consequences are avoided.

Water 2020, 12, 2106 2 of 11
A long tunnel is often used as a flood discharge structure in large dams. The high-velocity flow requires often air supply of significant capacity through air shafts [6]. In Sweden, a large number of bottom outlets run through dam bodies. The space above the outflows is connected to air-supply or inspection galleries. The operation experiences of 38 such outlets were surveyed by Dath and Mathiesen [8]. It is found that many safety or security issues are attributable to air supply.
The hydropower scheme in question, situated in central Sweden, belongs to this category. The facility was commissioned in 1943, with upgrades and extensions during the 1970s. The main dam is of embankment type with a concrete wall as impervious core, having a maximum structural height of 25 m and a crest length of 480 m. The flood discharge structure, with two bottom and two surface gates, is located in the middle of the dam. The layout of the dam is shown in Figure 1.
The mean annual flow at the dam is around 40 m3/s. The power station is located underground, equipped with two generating units with Francis turbines, operating at a gross head of ∼120 m and a total turbine flow of 100 m3/s. The installed turbine capacity is 120 MW; the average annual production amounts to 350 GWh. After the competition of the dam, the bottom outlets were sealed. Based upon the safety evaluations, engineering measures were undertaken during 2006 to raise the safety level of the dam. Both outlets were refurbished, with the installation of upward-going radial gates, which means they become then operable for flood discharge. Each outlet has a width of 6.00 m and a full opening height of 2.50 m, with the floor elevation +167.00 m.
(a) (b)
Figure 1. Hydropower scheme examined: (a) dam layout; (b) downstream view of spillway.
Above the outlets, there are two surface gates, also with upward-going radial gates, each having the same width as the outlets, 6.00 m. Their sill elevation is +182.10 m. The full pool water level (FPWL) is +185.60 m. All gates are maneuvered with hydraulic cylinders after refurbishment (one cylinder for each outlet gate and two for each surface one). If one outlet opens together with the surface gate above, the two water jets interact downstream in the channel. Figures 2 and 3 show the layout of the spillway with two air supply passages.
No matter whether the surface gates operate or not, the high-velocity flow from the bottom outlets entails always air supply. If only the surface gates open for discharge, air supply might also be necessary. The structure includes two separate air-supply passages to the flow. Constructed together with the dam, the original air passage is a gallery in the middle spillway pier. Its intake (denoted as R) is sheltered by a hut with a door (1.92 m by 0.82 m) facing downstream. The gallery cross-section is 2.40 m by 1.00 m in size (area 2.40 m2). A secondary door (denoted as S) exists in the middle, 2.22 m by 0.70 m. At the end of the gallery, the air is sucked into the outlet gate chambers via two door openings (left opening C and right opening D), 2.22 m by 1.45 m each.

Water 2020, 12, 2106 3 of 11
(a) (b)
Figure 2. Spillway Layout with two air passages: (a) downstream view; (b) cross-section along dam axis.
(a)
(b)
Figure 3. Longitudinal profile through the centerline of each outlet: (a) along the left outlet; (b) along the right outlet. Opening D is at the end of the gallery.
During the past operations of the spillway, high-velocity air-flow movements were experienced in the facility, which affected the work environment. An air shaft was, therefore, added to the left of the spillway (not on both sides). Its cross-section is 3.30 m by 2.20 m (area 7.26 m2). In its upper part, four shuttered openings (M), one facing left, one facing right and two facing downstream, act as air intake; their total area is 6.00 m2. The air enters the left gate chamber via sideward opening N; its area is 6.00 m2. The two air passages are shared by the flows.
Understanding air motions in the spaces affected by flood discharges will provide the plant owner with necessary information and help avoid unexpected consequences. This is also an issue

Water 2020, 12, 2106 4 of 11
concerning personnel safety. In connection with prototype and laboratory model tests, CFD modelling is performed to clarify the air-flow issue in the facility. As air flow is not correctly scaled in the physical model [9,10], CFD helps quantify the air demand at discharges from combinations of the gated openings. The results provide reference for spillways with the same or similar layout.
2. CFD Model Setup
Figure 4 illustrates the topography up- and downstream of the dam, which is based on echo-sounding and drone scanning. The reservoir included in the computational domain stretches 100 m from the vertical front of the spillway and 100 m along the dam. The upstream terrain with the vertical training walls is reproduced in the model. There are two horizontal beams that support the walls. Affecting the approach flow to the spillway, they are included in the geometrical setup. The length of the tailrace canal included amounts to 90 m. The tailwater immediately downstream of the spillway affects the water-air mixing at the impinging location and air flow in the system.
No symmetry condition exists for the flow of water and air at the spillway. At their fully open positions, the radial gates of the bottom outlet throttle the air passages and affect the air flow; they are therefore included as part of the geometrical configuration.
The Volume of Fluid (VOF) model is adopted for simulations of two-phase flows from the spillway discharges [11]. A set of momentum equations are shared by the two phases of water and air; the VOF of each phase is calculated for each cell in the domain. Water is treated as primary phase and the air as secondary one. Applications of the VOF approach to solutions of free-surface flows are found in [7,12‒22]. Together with the implicit numerical scheme, it is suitable to represent the free-surface turbulent flows with air entrainment.
Figure 4. The spillway with reservoir topography and discharge channel.
The simulations are composed of three representative cases. All the gates are fully opened (free discharge) and the reservoir level is kept at the FPWL. • Case 1: discharge from the two outlet gates; • Case 2: discharge from the two surface gates; and • Case 3: simultaneous discharges from all the four gates.
Small cells are used in areas close to the solid boundaries, across the water surface and in the jet impact zones in Cases 2 and 3. The dimensionless wall distance, defined as y+ = uτd/υ, is in the range of 10−50, where υ = kinematic viscosity of water, uτ = shear velocity and d = distance of the first cell from the wall boundary. The value of y+ should be between 10 and 100 to reasonably represent the near-wall regions. The Enhanced Wall Function is chosen for the viscous layer. The American Society of Mechanical Engineering (ASME) editorial policy statement provides guidelines for estimation of discretization errors, in which the grid convergence index (GCI) method helps check the grid convergence [23]. The purpose is to guarantee grid-independent solutions. For Cases 1, 2 and 3, the number of cells is 950,000, 1,350,000 and 1,750,000, respectively. Figure 5 shows the grid for Case 1 (the spillway’s upstream front is extended upwards to seal the two surface openings).
The vertical boundaries in the reservoir include two parts. The water part is given as pressure inlet with hydrostatic pressure. The air part above the water surface, together with the upper boundaries of the computational domain and the gallery entrance, is specified as pressure inlet with

Water 2020, 12, 2106 5 of 11
the atmospheric pressure. The tailwater boundary is specified as free outflow, where neither flow velocity nor depth is known.
(a) (b)
Figure 5. Numerical grid for discharge from two outlets (Case 1). The cell number is 950,000. (a) Upstream view; (b) side view.
3. Results and Discussions
Parallel to the CFD simulations, physical model tests are also performed. A scale model is built at Vattenfall’s R&D hydraulic laboratory, Älvkarleby. The same topographical and geometrical data including the spillway layout are used for the studies. Its scale is 1:30 and the model is based on the Froude similitude. The whole model, including the reservoir and tailwater topography and the spillway, is constructed in polystyrene material with the CNC milling technique. For the spillway, high-density polystyrene is used to guarantee its robustness. A magnetic flow meter measures the flow rate in the model. Calibrated point gauges read the water levels in the upstream area. Figure 6 shows the spillway layout in the model.
Most scale models of spillways are subjected to the atmospheric pressure. If negative air pressure exists in flow-affected spaces (like the cavity of an aerator), the air supply cannot be correctly simulated in the model. In other words, any attempt of upscaling from the model to its prototype would lead to non-negligible error if the water velocity is not sufficiently high. As far as the water discharge is concerned, comparisons are made with the prototype CFD simulations.
(a) (b)
Figure 6. Spillway in the physical model (scale 1:30). (a) Upstream view; (b) downstream view.
Figure 7 illustrates, for Case 3, the convergence of the water-flow discharge (Qw) with the simulation time (t). Table 1 summarizes the steady-state Qw results of the three cases.

Water 2020, 12, 2106 6 of 11
Figure 7. CFD results of Qw in Case 3: simultaneous discharges from two surface and bottom gates.
Table 1. Results of Qw, comparisons between physical tests and CFD.
Case 1 2 3
Qw (m3/s) Model tests 485 135 605
CFD modeling 494 130 607
Relative error (%) 1.9 −3.7 0.3
The model tests show that the CFD simulations give close results to the model testing except for in Case 2 of the free surface discharge, in which the relative error is −3.7%. The sources of errors in both physical and numerical modeling were discussed in [24]. The flow behavior and air demand for each case are discussed below.
3.1. Discharge From Both Outlet Gates (Case 1)
Case 1 refers to the simultaneous discharge from both outlets, with the surface gates in the closed positions. Figure 8 showcases the water-air flow pattern along the center plane of the left outlet. The full gate opening is 2.50 m. At the gates, the average water velocity is 16.6 m/s; the Froude number (F) is equal to 3.35. The two horizontal beams intrude in the water and affect the approach flow to the outlets. Obviously, the discharge capacity would be higher without them. The outlet radial gates throttle the air passage to the outflow and affect the air flow rate. The flow in the downstream channel is supercritical, which is evidenced in the model and prototype tests (Figure 9). Due to higher water stage in the river valley downstream, the flow in the channel features a hydraulic jump at its end.
Figure 8. Case 1, water-air flow field colored by velocity magnitude, along the left outlet’s centerplane.

Water 2020, 12, 2106 7 of 11
(a) (b)
Figure 9. Supercritical flow in the spillway channel: (a) in the hydraulic model with hydraulic jump at the channel end; (b) in the prototype, with the left surface spillway partially opened for discharge.
Figure 10 illustrates, at cross-sections A, B, C and D, the convergence of the air flow rate Qa. A and B refer to the mid-height location of the shaft and the mid-length location of the horizontal gallery. The Qa values at A and B represent the flow rates in the shaft and the gallery. It is seen that even when the simulation has converged (t > 9 s) the air flow reaches its so-called steady state, there are still small fluctuations. Table 2 summarizes the steady-state values of Qa and the air-flow velocity Va.
(a) (b)
Figure 10. (a) Cross-sections A, B, C and D; (b) simulated Qa values in Case 1.
Table 2. Case 1, averaged Qa and Va values at sections A, B, C and D.
Cross-section A B C D
Qa (m3/s) 41.2 15.5 6.4 21.9
Va (m/s) 5.67 6.46 1.98 6.80
Figure 11 shows the air flow patterns in the gallery, from the shaft to the left chamber and from the left to the right chamber (from opening C to D). At the entrance R to the gallery, the local velocity amounts to 8‒9 m/s. After passing the narrower S opening, the air flow accelerates in the upper part and reaches 15‒16 m/s at maximum. The flow velocity is obviously not uniform in the gallery (Figure 11a). The air-flow velocity reaches 6‒7 m/s at the shaft intakes (M) and 8‒10 m/s in the shaft and the left chamber (Figure 11b). With air from both the left chamber and the gallery, the flow velocity is as high as 15‒16 m/s through opening D (Figure 11c). To stay in the gallery and at the door openings is obviously improper during the flood release.
Hydraulic jump

Water 2020, 12, 2106 8 of 11
(a)
(b) (c)
Figure 11. Case 1, air-flow patterns colored by velocity magnitude: (a) along the gallery’s center plane; (b) along the shaft’s center plane (parallel to dam axis); (c) along vertical plane through the centroids of door openings C and D.
The gallery’s cross-sectional area is 2.40 m2 (at B), while the shaft’s area is 7.26 m2 (at A). The entrance door (R) and the secondary door (S) have even smaller sizes than the gallery. This means that the shaft has a much larger area and lower resistance to the air flow. The simulations show that Qa in the shaft is 41.2 m3/s, almost three times as high as in the gallery. Part of the air (6.4 m3/s) from the shaft leaves the left chamber and enters, via opening C and D, the right chamber. The air demand of the left outlet is thus 41.2 ‒ 6.4 = 34.8 m3/s. The air supply to the right outlet is 21.9 m3/s and comes from both the gallery and the left chamber. This means that, even the discharges from the bottom outlets are almost identical, their amounts of air supply differ, which is mainly due to the air passage layouts (area, length, local head losses, etc.). As a result, the air pressures above the water flow also differ. The averaged steady-state pressure drop is approximately 100 Pa downstream of the left outlet gate and 300 Pa downstream of the right one.
3.2. Discharge From Both Surface Gates (Case 2)
Case 2 refers to water release from two surface gates, with the outlets in the closed position. Figure 12 shows the water-air flow patterns and the change of the Qa with time. The water jets impinge on the channel bottom, generating a supercritical flow downstream. As the surface openings and the outlets have the same width, the jets cover the whole outlet width and enclose the air space behind. There is hardly any air exchange with the atmosphere. Due to the unsteadiness of the flow, the air flows in the air passages only oscillate about zero; the frequency period is approximately 5 s.

Water 2020, 12, 2106 9 of 11
(a)
(b)
Figure 12. Case 2: (a) air-water flow pattern along the right outlet’s centerplane; (b) change of Qa as a function of t.
3.3. Simultaneous Discharges From All Gates (Case 3)
In Case 3, all the gates are fully open for flood discharge. Figure 13 showcases the flow pattern and the change of air flow with time. The air flow results are summarised in Table 3. The air venting demand is obviously low in this case, only 5.0 m3/s for the left outlet and 4.9 m3/s for the right one. For this case, the air passages are sufficiently large; the throttling effects are negligible.
(a)
(b)
Figure 13. Case 3: (a) flow pattern along the right outlet’s centerplane; (b) the Qa changes.
Table 3. Case 3: time-averaged Qa and Va values at A, B, C and D.
Cross-section A B C D
Qa (m3/s) 7.1 2.8 2.1 4.9
Va (m/s) 0.98 1.17 0.65 1.52
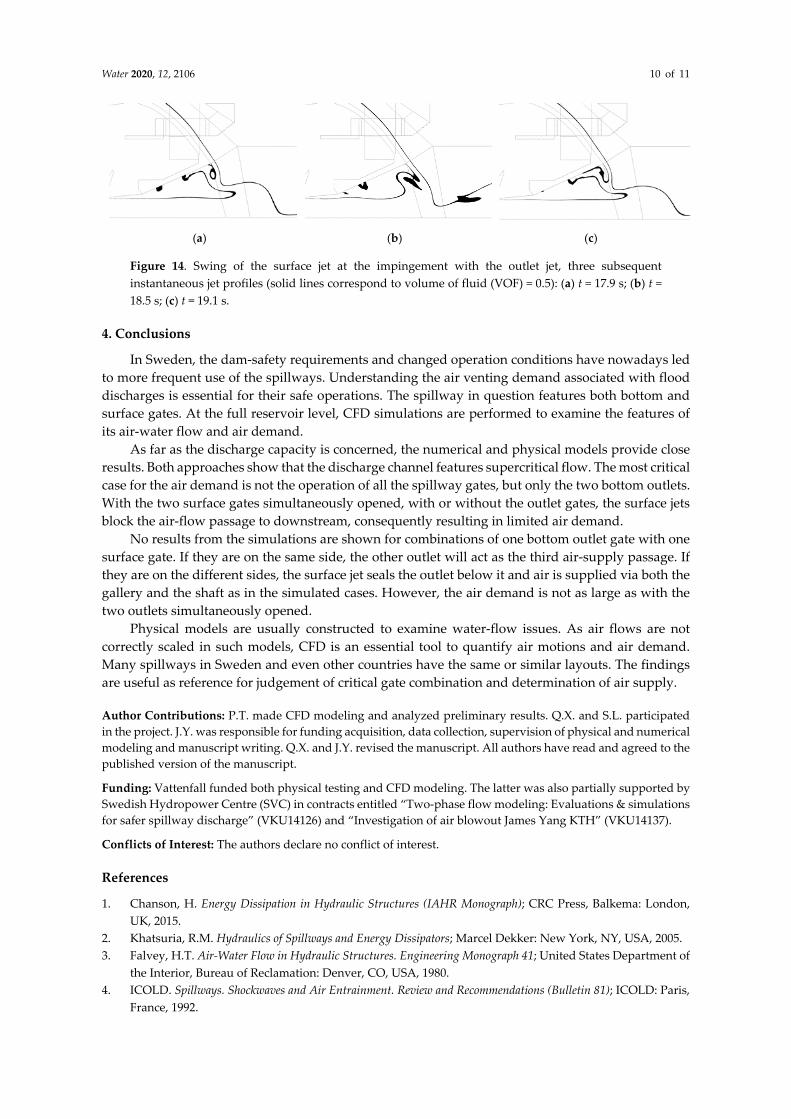
The flow is supercritical in the channel downstream. The surface water jet interacts with the horizontal jet from the outlet lying below, causing strong turbulent mixing at their meeting location. The air demand is mainly ascribable to the shear action between the two jets and the mixing upstream of the impingement. The fluctuations in the air flows are attributable to the interplay between the two jets that leads to the swing of the surface water jet, which is observed in both the numerical simulation and model tests. The jet configurations at three subsequent time instants in the CFD are illustrated in Figure 14.
Water 2020, 12, 2106 10 of 11
(a)
(b)
(c)
Figure 14. Swing of the surface jet at the impingement with the outlet jet, three subsequent instantaneous jet profiles (solid lines correspond to volume of fluid (VOF) = 0.5): (a) t = 17.9 s; (b) t = 18.5 s; (c) t = 19.1 s.
4. Conclusions
In Sweden, the dam-safety requirements and changed operation conditions have nowadays led to more frequent use of the spillways. Understanding the air venting demand associated with flood discharges is essential for their safe operations. The spillway in question features both bottom and surface gates. At the full reservoir level, CFD simulations are performed to examine the features of its air-water flow and air demand.
As far as the discharge capacity is concerned, the numerical and physical models provide close results. Both approaches show that the discharge channel features supercritical flow. The most critical case for the air demand is not the operation of all the spillway gates, but only the two bottom outlets. With the two surface gates simultaneously opened, with or without the outlet gates, the surface jets block the air-flow passage to downstream, consequently resulting in limited air demand.
No results from the simulations are shown for combinations of one bottom outlet gate with one surface gate. If they are on the same side, the other outlet will act as the third air-supply passage. If they are on the different sides, the surface jet seals the outlet below it and air is supplied via both the gallery and the shaft as in the simulated cases. However, the air demand is not as large as with the two outlets simultaneously opened.
Physical models are usually constructed to examine water-flow issues. As air flows are not correctly scaled in such models, CFD is an essential tool to quantify air motions and air demand. Many spillways in Sweden and even other countries have the same or similar layouts. The findings are useful as reference for judgement of critical gate combination and determination of air supply.
Author Contributions: P.T. made CFD modeling and analyzed preliminary results. Q.X. and S.L. participated in the project. J.Y. was responsible for funding acquisition, data collection, supervision of physical and numerical modeling and manuscript writing. Q.X. and J.Y. revised the manuscript. All authors have read and agreed to the published version of the manuscript.
Funding: Vattenfall funded both physical testing and CFD modeling. The latter was also partially supported by Swedish Hydropower Centre (SVC) in contracts entitled “Two-phase flow modeling: Evaluations & simulations for safer spillway discharge” (VKU14126) and “Investigation of air blowout James Yang KTH” (VKU14137).
Conflicts of Interest: The authors declare no conflict of interest.
References
1. Chanson, H. Energy Dissipation in Hydraulic Structures (IAHR Monograph); CRC Press, Balkema: London, UK, 2015.
2. Khatsuria, R.M. Hydraulics of Spillways and Energy Dissipators; Marcel Dekker: New York, NY, USA, 2005. 3. Falvey, H.T. Air-Water Flow in Hydraulic Structures. Engineering Monograph 41; United States Department of
the Interior, Bureau of Reclamation: Denver, CO, USA, 1980. 4. ICOLD. Spillways. Shockwaves and Air Entrainment. Review and Recommendations (Bulletin 81); ICOLD: Paris,
France, 1992.

Water 2020, 12, 2106 11 of 11
5. Brown, C.H.; Tullis, B.P.; Lindon, M.C. Air venting requirements for low-level outlet works: Does size really matter? In Proceedings of the Dam Safety 2006, Boston, MA, USA, 10–14 September 2006.
6. Lian, J.; Qi, C.; Liu, F.; Gou, W.; Pan, S.; Ouyang, Q. Air entrainment and air demand in the spillway tunnel at the Jinping-I Dam. Appl. Sci. 2017, 7, 930.
7. Yang, J.; Liu, T.; Dai, W.; Teng, P. Transient air-water flow and air demand following an opening outlet gate. Model. Simul. Eng. 2018, 2018, 3194935.
8. Dath, J.; Mathiesen, M. Pre-Studies of Hydraulic Design: Inventory and General Evaluations of Bottom Outlets in Swedish Dams; Elforsk AB: Stockholm, Sweden, 2007.
9. Chanson, H.; Gualtieri, C. Similitude and scale effects of air entrainment in hydraulic jumps. J. Hydraul. Res. 2008, 46, 35–44.
10. Pfister, M.; Chanson, H. Two-phase air-water flows: Scale effects in physical modeling. J. Hydrodyn. Ser. B 2014, 26, 291–298.
11. ANSYS Inc. ANSYS FLUENT Theory Guide; ANSYS: Canonsburg, PA, USA, 2016. 12. Damiron, D. CFD Modelling of Dam Spillway Aerator. Master’s Thesis, Lund University, Lund, Sweden, 2015. 13. Bayon, A.; Toro, J.P.; Bombardelli, F.A.; Matos, J.; López-Jiménez, P.A. Influence of VOF technique,
turbulence model and discretization scheme on the numerical simulation of the non-aerated, skimming flow in stepped spillways. J. Hydro Environ. Res. 2017, 19, 137–149.
14. Wan, H.; Li, R.; Gualtieri, C.; Yang, H.; Feng, J. Numerical simulation of hydrodynamics and reaeration over a stepped spillway by the SPH method. Water 2017, 9, 565.
15. Valero, D.; Bung, D.B.; Crookston, B.M. Energy dissipation of a type III basin under design and adverse conditions for stepped and smooth spillways. J. Hydraul. Eng. 2018, 144, 04018036.
16. Valero, D.; Viti, N.; Gualtieri, C. Numerical simulation of hydraulic jumps. Part 1: Experimental data for modelling performance assessment. Water 2019, 11, 36.
17. Viti, N.; Valero, D.; Gualtieri, C. Numerical simulation of hydraulic jumps. Part 2: Recent results and future outlook. Water 2019, 11, 28.
18. Savage, B.M.; Johnson, M.C. Flow over ogee spillway: Physical and numerical model case study. J. Hydraul. Eng. 2001, 127, 640–649.
19. Chatila, J.; Tabbara, M. Computational modeling of flow over an ogee spillway. Comput. Struct. 2004, 82, 1805–1812.
20. Pelletier, D. Verification, validation, and uncertainty in computational fluids. Can. J. Civ. Eng. 2010, 37, 1003–1013.
21. Satrapa, L.; Broucek, M.; Kralik, M.; Zukal, M. Gated spillways—Numerical and physical modelling. In Proceedings of the 25th ICOLD Congress, Stavanger, Norway, 14–19 June 2015.
22. Teng, P.H.; Yang, J. CFD modelling of two-phase flow of a spillway chute aerator of large width. J. Appl. Water Eng. Res. 2016, 4, 163–177.
23. Celik, I.B.; Ghia, U.; Roache, P.J. Procedure for estimation and reporting of uncertainty due to discretization in CFD applications. Trans. ASME J. Fluids Eng. 2008, 130, 078001-1–078001-4.
24. Yang, J.; Andreasson, P.; Teng, P.H.; Xie, Q.C. The past and present of discharge capacity modelling for spillways—A Swedish perspective. Fluids 2019, 4, 10.
© 2020 by the authors. Licensee MDPI, Basel, Switzerland. This article is an open access article distributed under the terms and conditions of the Creative Commons Attribution (CC BY) license (http://creativecommons.org/licenses/by/4.0/).