understanding vsa - atoast2trading · pdf fileunderstanding vsa volume is not difficult to...
TRANSCRIPT
Understanding VSAVolume is not difficult to understand once the basic principles of supply and demand are understood.
This requires you to relate the volume with price action.
You will start to realise that you can read the market – a very precious skill that only a few people share.
INTRO:To understand what the volume is saying to you, you have to ask yourself again;“What has the price done on this volume”?The price spread is the difference between the highest and lowest trading points reached during thetimeframe you are looking at, which may be weekly, daily, hourly, or whatever other timeframe youchoose.
Volume shows the activity of trading during a specific period. If the volume is taken in isolation it meansvery little – volume should be looked at in relative terms. Therefore, if you compare today's volume withvolume during the previous thirty days (or bars) it is easy to see if today's volume is high, low or averagecompared to the volume seen in the past. If you stand thirty people in a line, it is easy for you to see whothe tall ones are, compared to the others. This is a skill of human observation, so you will have noproblems identifying whether the volume is relatively high, low or average.Compare this volume information with the price spread and you will then know how bullish or bearish theprofessional wholesalers really are. The more practice you have, by taking this professional approach, thebetter you will become.
To make it easier for you to understand volume, compare it to the accelerator of your automobile. Thinkabout the results you would expect from pressing the accelerator when approaching ‘resistance’, such as ahill. Imagine you are an engineer monitoring a car's performance by remote control. Your instrumentsonly allow you to see the power applied to the accelerator pedal (volume) and a second engineer is lookingat the cars actual motion (price movement). The second engineer informs you that the car is movingforward uphill; however, this uphill movement is not in keeping with your observation of power to theaccelerator pedal, which you observe is very low. You would naturally be somewhat sceptical, as youknow a car cannot go uphill without sufficient power being applied.
You may conclude that this movement uphill could not possibly be a genuine lasting movement, and that itis probably caused by some reason other than power application. You may even disbelieve what yourinstruments are telling you, as it is obvious that cars cannot travel uphill unless power is applied to theaccelerator pedal. Now you are thinking more like a professional trader!Many traders are mystified if the same thing happens in the stock market. Remember, any market, just likean automobile, has ‘momentum’ that will cause movement even when the power has been turned off. Thisexample explains why markets can momentarily rise on a low volume up-move. However, all moves withdiffering types of volume activity can be explained using the “accelerator pedal” analogy.
What is Bullish & Bearish Volume?

There are only two basic definitions for bullish and bearish volume:1. Bullish volume is increasing volume on up-moves and decreasing volume on down-moves.2. Bearish volume is increasing volume on down-moves and decreasing volume on up-moves.
You need to look at the price spread and price action in relation to the volume. The market is an on-going story, unfolding bar by bar. The art of reading the market is to take an overall view, not to concentrate on individual bars. For example, once a market has finished distributing, the ‘smart money’ will want to trap you into thinking that the market is going up. So, near the end of a distribution phase you may, but not always, see either an up-thrust (see later) or low volume up-bars. Both of these observations mean little on their own. However, because there is weakness in the background, these signs now become very significant signs of weakness, and the perfect place to take a short position. Any current action that is taking place cannot alter the strength or weakness that is embedded (and latent)in the background. It is vital to remember that near background indications are just as important as themost recent.
Down-bars: If prices are dropping on volume that is less than the previous two bars (or candles), especially if spreads are narrow, with the price closing in the middle or high of the bar, this indicates that there is ‘no selling pressure’.
Up-bars: Weakness manifests itself on up-bars, especially when spreads are narrow, with volume less than the previous two bars(or candles). This shows that there is ‘no demand’ from professional traders.
Accumulation & DistributionAccumulationTo accumulate means to buy as much of the stock as possible, without significantly putting the priceup against your own buying, until there are few, or no more shares available at the price level you havebeen buying at. This buying usually happens after a bear move has taken place in the stock market(which will be reflected by looking at the Index).To the syndicate trader, the lower prices now look attractive. Not all of the issued stock can beaccumulated straight away, since most of the stock is tied up. For example, banks retain stock to coverloans, and directors retain stock to keep control in their company. It is the floating supply that thesyndicate traders are after.Once most of the stock has been removed from the hands of other traders (ordinary privateindividuals), there will be little, or no stock left to sell into a mark-up in price (which would normallycause the price to drop). At this point of ‘critical mass’, the resistance to higher prices has beenremoved from the market. If accumulation has taken place in lots of other stocks, by many otherprofessionals, at a similar time (because market conditions are right), we have the makings of a bullmarket. Once a bullish move starts, it will continue without resistance, as the supply has now beenremoved from the market.
DistributionAt the potential top of a bull market, many professional traders will be looking to sell stock bought at lowerlevels to take profits. Most of these traders will place large orders to sell, not at the current price available,but at a specified price range. Any selling has to be absorbed by the market-makers, who have to create a'market’. Some sell orders will be filled immediately, some go, figuratively, 'onto the books‘. The marketmakersin turn have to resell, which has to be accomplished without putting the price down against theirown, or other traders’ selling. This process is known as distribution, and it will normally take some timefor the process to complete.In the early stages of distribution, if the selling is so great that prices are forced down, the selling will stop
and the price will be supported, which gives the market-maker, and other traders, the chance to sell morestock on the next wave up. Once the professionals have sold most of their holdings, a bear market starts,because markets tend to fall without professional support.
The Buying ClimaxBrief Definition: An imbalance of supply and demand causing a bull market to transform into a bearmarket.Explanation: If the volume is seen to be exceptionally high, accompanied by narrow spreads into newhigh ground, you can be assured that this is a ‘buying climax’.It is called a buying climax because to create this phenomenon there has to be a hugedemand for buying from the public, fund managers, banks and so on. It is into thisbuying frenzy, that syndicate traders and market-makers will dump their holdings, to suchan extent that higher prices are now impossible. In the last phase of the buying climax,the market will be seen to close in the middle or high of the bar.
The Selling ClimaxBrief Definition: An imbalance of supply and demand causing a bear market to transform into a bullmarket.Explanation: This is the exact opposite of a buying climax. The volume will be extremely high ondown-moves, accompanied by narrow spreads, with the price entering fresh low ground.The only difference is that on the lows, just before the market begins to turn, the pricewill be seen to close in the middle or low of the bar.To create this phenomenon requires a huge amount of selling, such as that witnessedfollowing the tragic events of the terrorist attacks on the World Trade Centre in NewYork on September the 11th 2001.Note that the above principles seem to go against your natural thinking (i.e. market strength actuallyappears on down-bars and weakness, in reality, appears on up-bars). Once you have learned to grasp thisconcept, you will be on your way to thinking much more like a professional trader.
Resistance & Crowd BehaviourWe have all heard of the term ‘resistance’, but what exactly is meant by this loosely used term? Well, inthe context of market mechanics, resistance to any up-move is caused by somebody selling the stock assoon as a rally starts. In this case, the floating supply has not yet been removed. The act of selling into arally is bad news for higher prices. This is why the supply (resistance) has to be removed before a stockcan rally (rise in price).Once an up-move does take place, then like sheep, all other traders will be inclined to follow. This conceptis normally referred to as ‘herd instinct’ (or crowd behaviour). As human beings, we are free to acthowever we see fit, but when presented with danger or opportunity, most people act with surprisingpredictability. It is this knowledge of crowd behaviour that helps the professional syndicate traders tochoose their moment to make a large profit. Make no mistake – professional traders are predatory beastsand uninformed traders represent the symbolic ‘lamb to the slaughter’.We shall return to the concept of ‘herd instinct’ again, but for now, consider the importance of thisphenomenon, and what it means to you as a trader. Unless the laws of human behaviour change, thisprocess will always be present in the financial markets. You must always try to be aware of ‘HerdInstinct’.There are only two main principles at work in the stock market, which will cause a market to turn. Both of

these principles will arrive in varying intensities producing larger or smaller moves:1. The ‘herd’ will panic after observing substantial falls in a market (usually on bad news) and willusually follow its instinct to sell. As a trader who is aware of crowd psychology, you must askyourself, “Are the trading syndicates and market-makers prepared to absorb the panic selling at theseprice levels?” If they are, then this is a good sign that indicates market strength.2. After substantial rises, the ‘herd’ will become annoyed at missing the up-move, and will rush in andbuy, usually on good news. This includes traders who already have long positions, and want more. Atthis stage, you need to ask yourself, “Are the trading syndicates selling into the buying?” If so, thenthis is a severe sign of weakness.Does this mean that the dice is always loaded against you when you enter the market? Are you destinedalways to be manipulated? Well, yes and no.A professional trader isolates himself from the ‘herd’ and becomes a predator rather than a victim. Heunderstands and recognises the principles that drive the markets and refuses to be misled by good or badnews, tips, advice, brokers, or well-meaning friends. When the market is being shaken-out on bad news, heis in there buying. When the ‘herd’ is buying and the news is good, he is looking to sell.
How to Tell if a Market is Weak or Strong
Buy and sell orders from traders around the world are generally processed and matched up by marketmakers. It is their job to create a market. If the market has been in a bull-move and you place a buy order into a rising market, you may receive whatappears to be a good price from the floor of the exchange. Why are you receiving a good price? Havethese hard-nosed professionals decided that they like you and have decided to be generous giving awaysome of their profits to you? Or have they now decided to start switching positions, taking a bearish ornegative view of the market, because their books have started to show large sell orders to dispose of? Theirperceived value of the market or stock may be lower than yours because they expect prices to fall or at bestgo sideways. Such action, repeated many times across the floor, will tend to keep the spread of the daynarrow, by limiting the upper end of the price spread, because they are not only giving you what appears tobe a good price, but also every other buyer.
If, on the other hand, the market-maker has a bullish view, because he does not have large sell orders on hisbooks, he will mark-up the price on your buy order, giving you what appears to be a poor price. This,repeated, makes the spread wider as the price is constantly marked up during the day.So by simple observation of the spread of the bar, we can read the sentiment of the market-makers; theopinion of those who can see both sides of the market.Frequently, you will find that there are days where the market gaps up on weakness. This gapping up is fardifferent from a wide spread up, where the market-makers are marking the prices up against buying. Thegapping up is done rapidly, usually very early in the day's trading, and will certainly have emotionalimpact. This price action is usually designed to try to suck you into a potentially weak market and into apoor trade, catching stop-losses on the short side, and generally panicking traders to do the wrong thing.You will find that weak gap-ups are always into regions of new highs, when news is good and the bullmarket looks as though it will last forever.
You can observe similar types of gapping-up action in strong markets too, but in this second case you willhave an old (sideways) trading area to the left. Traders who have become trapped within the channel(sometimes referred to as a ‘trading range’), either buying at the top and hoping for a rise, or buying at thebottom and not seeing any significant upwards price action, will become demoralised at the lack of profit.These locked-in traders want only one thing – to get out of the market at a similar price to the one they firststarted with. Professional traders that are still bullish know this. To encourage these old locked-in traders
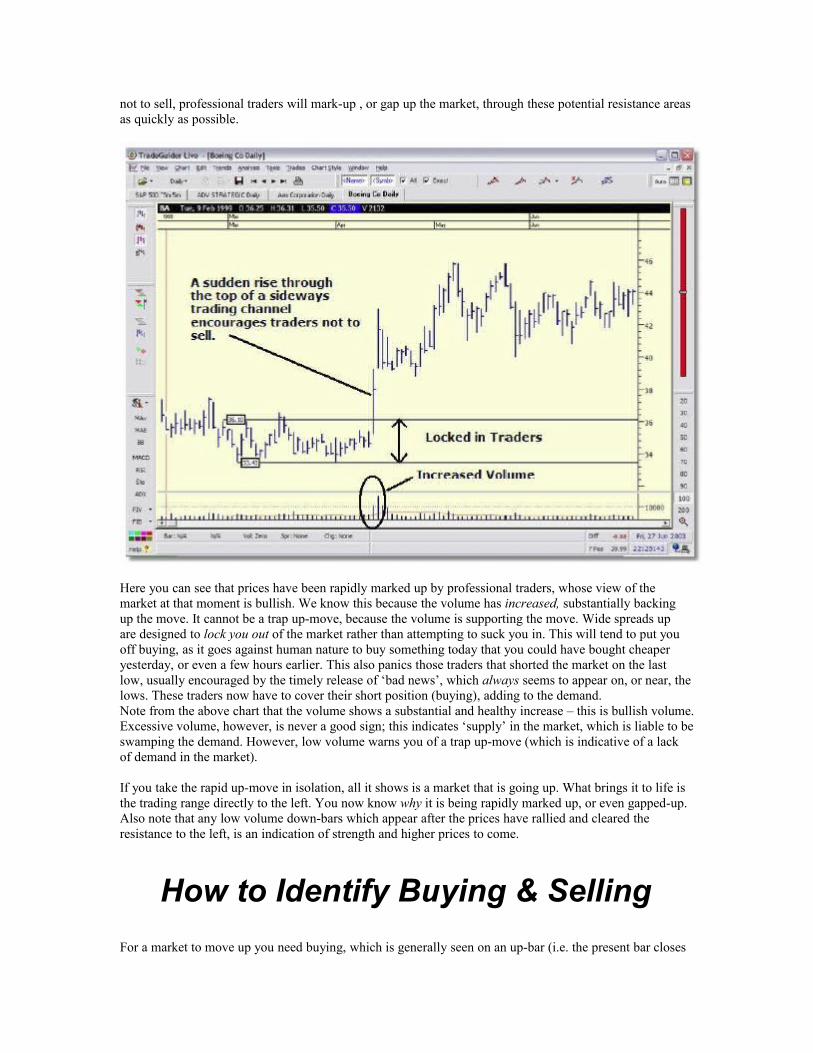
not to sell, professional traders will mark-up , or gap up the market, through these potential resistance areasas quickly as possible.
Here you can see that prices have been rapidly marked up by professional traders, whose view of themarket at that moment is bullish. We know this because the volume has increased, substantially backingup the move. It cannot be a trap up-move, because the volume is supporting the move. Wide spreads upare designed to lock you out of the market rather than attempting to suck you in. This will tend to put youoff buying, as it goes against human nature to buy something today that you could have bought cheaperyesterday, or even a few hours earlier. This also panics those traders that shorted the market on the lastlow, usually encouraged by the timely release of ‘bad news’, which always seems to appear on, or near, thelows. These traders now have to cover their short position (buying), adding to the demand.Note from the above chart that the volume shows a substantial and healthy increase – this is bullish volume.Excessive volume, however, is never a good sign; this indicates ‘supply’ in the market, which is liable to beswamping the demand. However, low volume warns you of a trap up-move (which is indicative of a lackof demand in the market).
If you take the rapid up-move in isolation, all it shows is a market that is going up. What brings it to life isthe trading range directly to the left. You now know why it is being rapidly marked up, or even gapped-up.Also note that any low volume down-bars which appear after the prices have rallied and cleared theresistance to the left, is an indication of strength and higher prices to come.
How to Identify Buying & SellingFor a market to move up you need buying, which is generally seen on an up-bar (i.e. the present bar closes
higher than the previous bar). The amount of volume attached to the up-bar should be increasing involume. However, this increase in volume should not be excessive, as this is indicative of supply in thebackground that is swamping the demand.If you observe that the volume is low as the market moves up, you know this has to be a false picture. Thislow volume is caused by the professional money refusing to participate in the up-move, usually becausethey know the market is weak. The market may be moving up, but it does not have the participation of thetraders that matter. Unless the ‘smart money’ is interested in the move, it is certainly not going to rise veryfar.During a bear market, you will frequently see temporary up-moves on low volume. The reason for the upmoveis of no concern to us, but we see a market that is bearish going up on low volume. This can onlyhappen because the professional money is not interested in higher prices and is not participating, hence thelow volume. The professionals are bearish and have no intention of buying into a weak market just becauseit happens to be going up. If this action is seen with a trading range to the left, at the same price level, thisbecomes a very strong indication of lower prices to follow.The opposite is also true for down-moves. So, for a legitimate down-move you would need to witnessevidence of selling, which would reveal itself as increased volume on down-bars (i.e. the present bar closeslower than the previous bar). If you see an increase in volume that is excessive, then you should be wary,as this may indicate that demand is in the background.If you begin to notice the volume drying up on down-bars, this is evidence that the amount of sellingpressure is reducing. The market may continue to fall, but be aware that it could quickly turn and risemomentarily, due to the lack of supply. A decreasing amount of volume on any down-bar indicates thatthere is no professional interest to the downside.
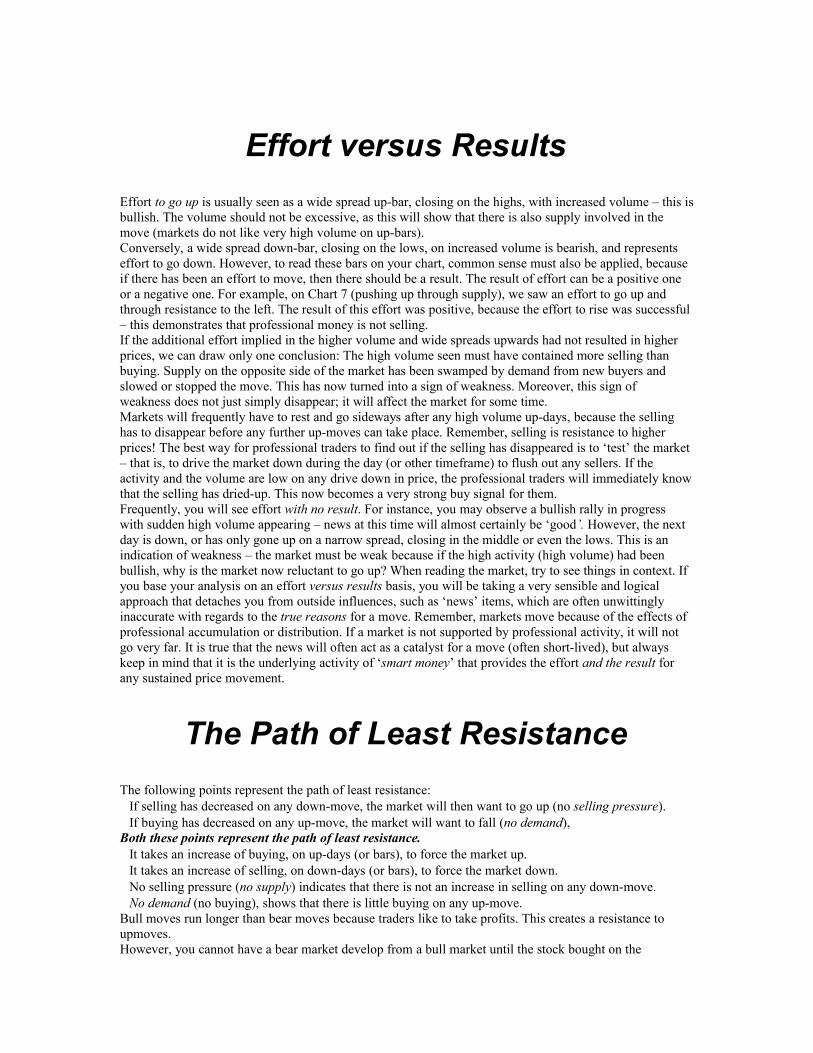
How to Identify Lack of Demand‘Lack of demand’ is one of the most common indications you will see and it is pretty easy to pick out.Basically, you will be watching out for a low volume up-bar, on a narrow spread, such as the one identifiedby TradeGuider in the chart below.

If, over the next few bars or more, the price closes down, on declining volume, with narrow spreads, thenthis indicates that there is no selling pressure. In this case, we have observed some temporary weakness,which has now been overcome – the up-move may now continue.
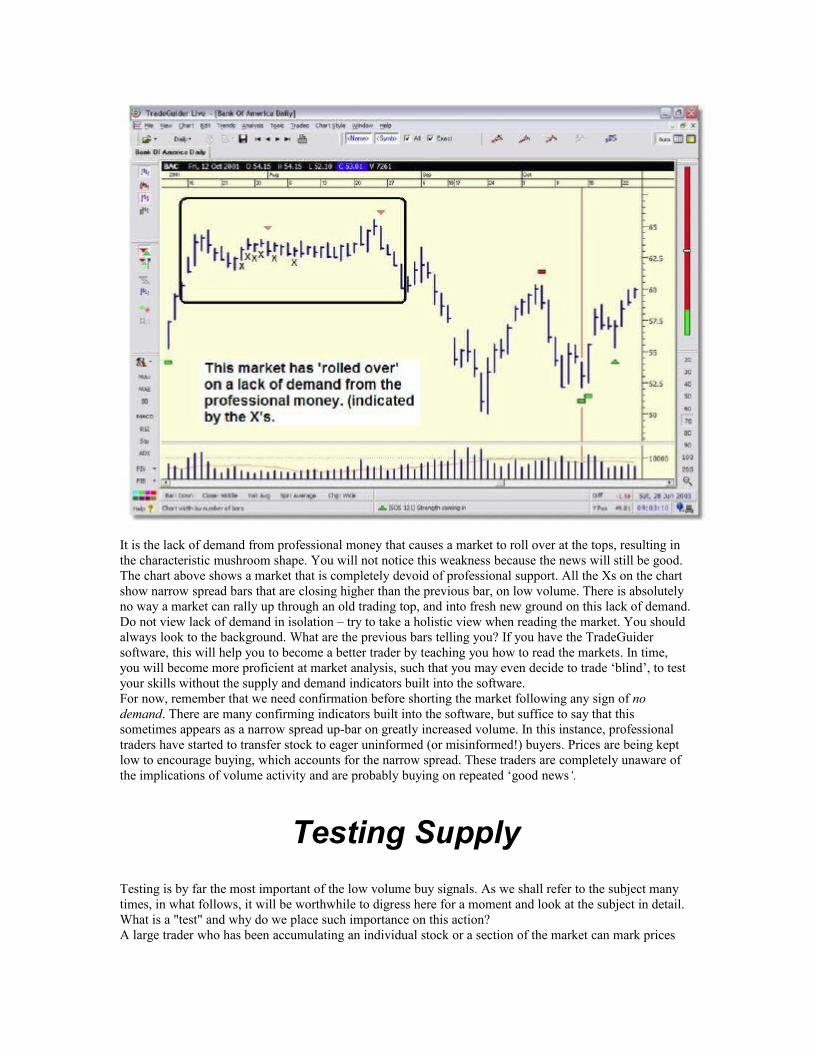
It is the lack of demand from professional money that causes a market to roll over at the tops, resulting inthe characteristic mushroom shape. You will not notice this weakness because the news will still be good.The chart above shows a market that is completely devoid of professional support. All the Xs on the chartshow narrow spread bars that are closing higher than the previous bar, on low volume. There is absolutelyno way a market can rally up through an old trading top, and into fresh new ground on this lack of demand.Do not view lack of demand in isolation – try to take a holistic view when reading the market. You shouldalways look to the background. What are the previous bars telling you? If you have the TradeGuidersoftware, this will help you to become a better trader by teaching you how to read the markets. In time,you will become more proficient at market analysis, such that you may even decide to trade ‘blind’, to testyour skills without the supply and demand indicators built into the software.For now, remember that we need confirmation before shorting the market following any sign of nodemand. There are many confirming indicators built into the software, but suffice to say that thissometimes appears as a narrow spread up-bar on greatly increased volume. In this instance, professionaltraders have started to transfer stock to eager uninformed (or misinformed!) buyers. Prices are being keptlow to encourage buying, which accounts for the narrow spread. These traders are completely unaware ofthe implications of volume activity and are probably buying on repeated ‘good news‘.
Testing SupplyTesting is by far the most important of the low volume buy signals. As we shall refer to the subject manytimes, in what follows, it will be worthwhile to digress here for a moment and look at the subject in detail.What is a "test" and why do we place such importance on this action?A large trader who has been accumulating an individual stock or a section of the market can mark prices
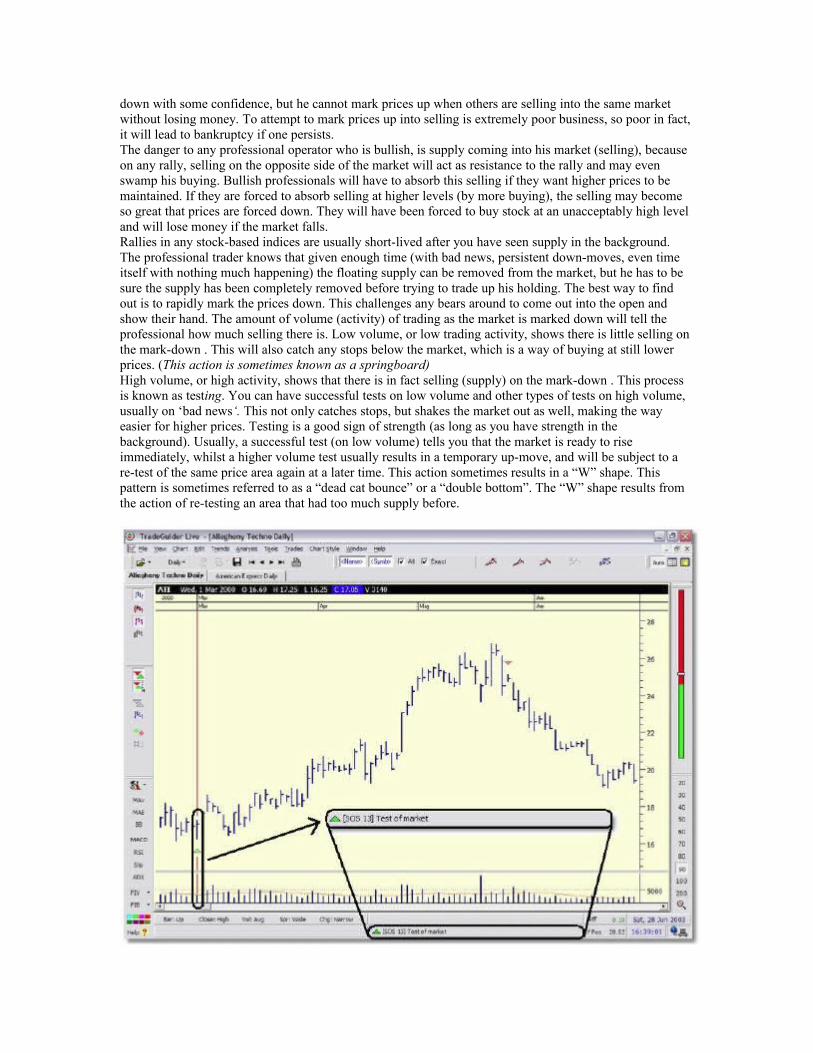
down with some confidence, but he cannot mark prices up when others are selling into the same marketwithout losing money. To attempt to mark prices up into selling is extremely poor business, so poor in fact,it will lead to bankruptcy if one persists.The danger to any professional operator who is bullish, is supply coming into his market (selling), becauseon any rally, selling on the opposite side of the market will act as resistance to the rally and may evenswamp his buying. Bullish professionals will have to absorb this selling if they want higher prices to bemaintained. If they are forced to absorb selling at higher levels (by more buying), the selling may becomeso great that prices are forced down. They will have been forced to buy stock at an unacceptably high leveland will lose money if the market falls.Rallies in any stock-based indices are usually short-lived after you have seen supply in the background.The professional trader knows that given enough time (with bad news, persistent down-moves, even timeitself with nothing much happening) the floating supply can be removed from the market, but he has to besure the supply has been completely removed before trying to trade up his holding. The best way to findout is to rapidly mark the prices down. This challenges any bears around to come out into the open andshow their hand. The amount of volume (activity) of trading as the market is marked down will tell theprofessional how much selling there is. Low volume, or low trading activity, shows there is little selling onthe mark-down . This will also catch any stops below the market, which is a way of buying at still lowerprices. (This action is sometimes known as a springboard)High volume, or high activity, shows that there is in fact selling (supply) on the mark-down . This processis known as testing. You can have successful tests on low volume and other types of tests on high volume,usually on ‘bad news‘. This not only catches stops, but shakes the market out as well, making the wayeasier for higher prices. Testing is a good sign of strength (as long as you have strength in thebackground). Usually, a successful test (on low volume) tells you that the market is ready to riseimmediately, whilst a higher volume test usually results in a temporary up-move, and will be subject to are-test of the same price area again at a later time. This action sometimes results in a “W” shape. Thispattern is sometimes referred to as a “dead cat bounce” or a “double bottom”. The “W” shape results fromthe action of re-testing an area that had too much supply before.
Above is a chart that shows a valid test.Any down-move dipping into an area of previous selling (previous high volume level), which then regainsto close on, or near the high, on lower volume, is a loud and clear indication to expect higher pricesimmediately. This is a successful test. Lower volume shows that the amount of trading that took place onthe mark-down was reduced, that now there is little selling, when previously there had been selling. Atthis point, it is now important to see how the market-makers and specialists respond to the apparentstrength seen in the testing.If you are in a bearish or weak market, you may see at times, what appears to be a test. However, if themarket does not respond to what is normally an indication of strength, then this shows further weakness.The specialist or market-maker is never going to fight the market. If, in his view, the market is still weakon these days, he will withdraw from trading. The market will then be reluctant to go up, even if it looks asif it should go up, because there was little or no selling on the ‘test’ day.Any testing that does not respond immediately with higher prices, or certainly during the next day or so,can be considered an indication of weakness. If it were a true sign of strength, the specialists or marketmakerswould have stepped in and would be buying the market – the result of this professional supportwould be the beginnings of an upward trending market.
Pushing Up Through SupplyLet us return to look more closely at what happens when professional money pushes up through a potentialarea of supply. Old trading ranges form resistance areas, because it is a known supply level. Humanbehaviour will never change and the actions of the herd are well documented. Of the traders that had beenbuying into the market within the old trading area, many are still in there and have been locked-in by adown-move – the chart below illustrates this. The main concern for these locked-in traders is to sell andrecover as much as they can, hopefully without losses. As such, they represent potential supply (resistance) to the market.

The market-makers know exactly where these resistance areas are. If they are bullish, and higher prices areanticipated, the market-maker will certainly want a rally. The problem now is how to avoid being forced tobuy stock from these locked-in traders at what, to them, may appear to be high prices.
Any supply area can be compared to the frequent and hated toll gates placed across roads in olden days.Your progress was constantly impeded by having to stop and pay your toll fee if you wanted to go further.In the stock market, higher prices are frequently blocked by a variety of traders who already hold poortrading positions and want to sell. If the specialists or market-makers are expecting higher prices they willhave to pay their toll by absorbing any selling from these traders, but they will try and avoid or limit thistoll fee by all means.So how do the market-makers cope with this problem?A rapid, wide spread, or gapping, up through an old area of supply as quickly as possible, is an old andtrusted method. To the informed trader, we now have a clear sign of strength. The stock specialist does notwant to have to buy stock at high prices. He has already bought his main holding at lower levels.Therefore, the locked-in traders must be encouraged not to sell. As the market approaches the area atwhich the locked-in traders could sell out without a loss, the price rockets, gapping up, or shooting up on awide spread. This phenomenon can be seen on the previous chart.The locked-in traders who have been concerned over potential losses will now suddenly be showing aprofit and will be tempted not to sell as the stress of a potential loss now turns to elation. As these tradersallowed themselves to be trapped in the first place, it is liable to happen to them again at even higher prices.Gapping up and through resistance on wide spreads is a tried and tested manoeuvre by market-makers andspecialists to limit the amount of stock having to be bought to keep the rally going – a way of avoiding thetoll gates. The example on the above chart is on a daily timeframe, but these principles will appear on anychart because this is the way professional traders behave.If you observe high volume accompanying wide spreads up, this shows that the professional money wasprepared to absorb any selling from those locked-in traders who decided to sell – this is known asabsorption volume. In this situation, the market-makers anticipate higher prices and are bullish. They
know that a breakout above an old trading area will create a new wave of buying. In addition, those traderswho have shorted the market will now be forced to cover their poor positions by buying as well.Furthermore, traders that are looking for breakouts will buy. Finally, all those traders not in the marketmay feel they are missing out and will be encouraged to start buying. This all adds to the professionalbullish positions. If you see any testing or down-bars on low volume after this event, it is a very strong buysignal.
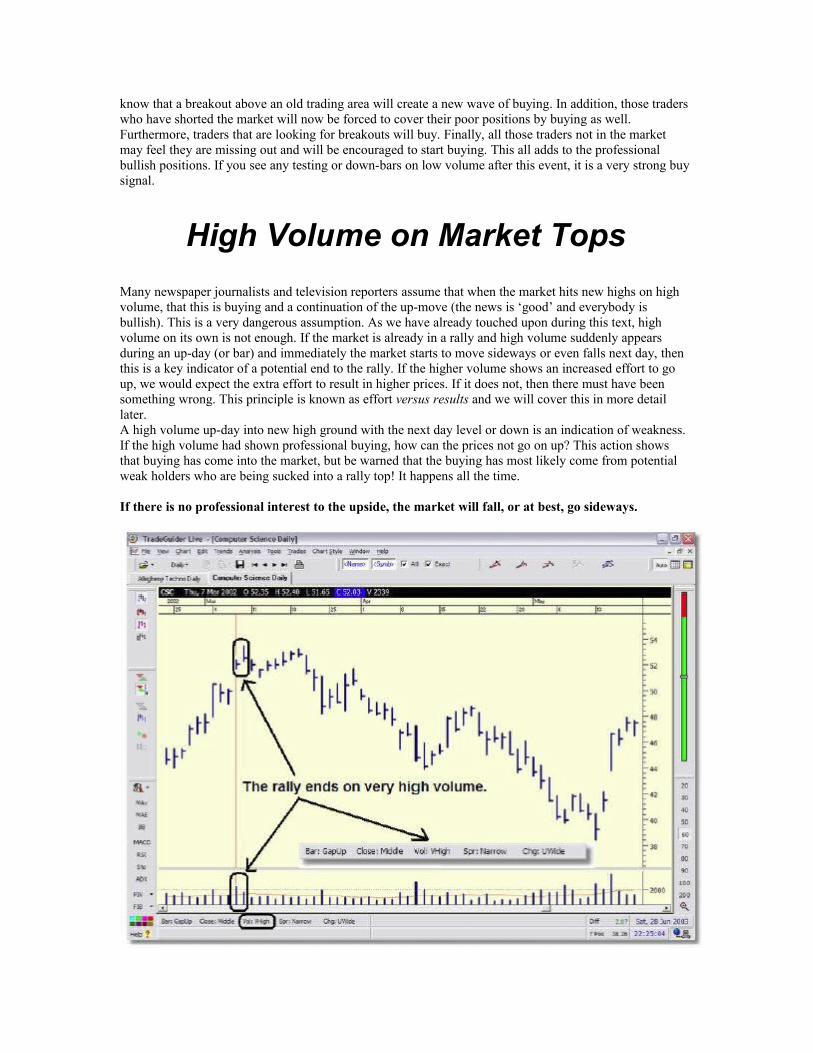
High Volume on Market TopsMany newspaper journalists and television reporters assume that when the market hits new highs on highvolume, that this is buying and a continuation of the up-move (the news is ‘good’ and everybody isbullish). This is a very dangerous assumption. As we have already touched upon during this text, highvolume on its own is not enough. If the market is already in a rally and high volume suddenly appearsduring an up-day (or bar) and immediately the market starts to move sideways or even falls next day, thenthis is a key indicator of a potential end to the rally. If the higher volume shows an increased effort to goup, we would expect the extra effort to result in higher prices. If it does not, then there must have beensomething wrong. This principle is known as effort versus results and we will cover this in more detaillater.A high volume up-day into new high ground with the next day level or down is an indication of weakness.If the high volume had shown professional buying, how can the prices not go on up? This action showsthat buying has come into the market, but be warned that the buying has most likely come from potentialweak holders who are being sucked into a rally top! It happens all the time.
If there is no professional interest to the upside, the market will fall, or at best, go sideways.
Effort versus ResultsEffort to go up is usually seen as a wide spread up-bar, closing on the highs, with increased volume – this isbullish. The volume should not be excessive, as this will show that there is also supply involved in themove (markets do not like very high volume on up-bars).Conversely, a wide spread down-bar, closing on the lows, on increased volume is bearish, and representseffort to go down. However, to read these bars on your chart, common sense must also be applied, becauseif there has been an effort to move, then there should be a result. The result of effort can be a positive oneor a negative one. For example, on Chart 7 (pushing up through supply), we saw an effort to go up andthrough resistance to the left. The result of this effort was positive, because the effort to rise was successful– this demonstrates that professional money is not selling.If the additional effort implied in the higher volume and wide spreads upwards had not resulted in higherprices, we can draw only one conclusion: The high volume seen must have contained more selling thanbuying. Supply on the opposite side of the market has been swamped by demand from new buyers andslowed or stopped the move. This has now turned into a sign of weakness. Moreover, this sign ofweakness does not just simply disappear; it will affect the market for some time.Markets will frequently have to rest and go sideways after any high volume up-days, because the sellinghas to disappear before any further up-moves can take place. Remember, selling is resistance to higherprices! The best way for professional traders to find out if the selling has disappeared is to ‘test’ the market– that is, to drive the market down during the day (or other timeframe) to flush out any sellers. If theactivity and the volume are low on any drive down in price, the professional traders will immediately knowthat the selling has dried-up. This now becomes a very strong buy signal for them.Frequently, you will see effort with no result. For instance, you may observe a bullish rally in progresswith sudden high volume appearing – news at this time will almost certainly be ‘good’. However, the nextday is down, or has only gone up on a narrow spread, closing in the middle or even the lows. This is anindication of weakness – the market must be weak because if the high activity (high volume) had beenbullish, why is the market now reluctant to go up? When reading the market, try to see things in context. Ifyou base your analysis on an effort versus results basis, you will be taking a very sensible and logicalapproach that detaches you from outside influences, such as ‘news’ items, which are often unwittinglyinaccurate with regards to the true reasons for a move. Remember, markets move because of the effects ofprofessional accumulation or distribution. If a market is not supported by professional activity, it will notgo very far. It is true that the news will often act as a catalyst for a move (often short-lived), but alwayskeep in mind that it is the underlying activity of ‘smart money’ that provides the effort and the result forany sustained price movement.
The Path of Least ResistanceThe following points represent the path of least resistance:� If selling has decreased on any down-move, the market will then want to go up (no selling pressure).� If buying has decreased on any up-move, the market will want to fall (no demand),Both these points represent the path of least resistance.� It takes an increase of buying, on up-days (or bars), to force the market up.� It takes an increase of selling, on down-days (or bars), to force the market down.� No selling pressure (no supply) indicates that there is not an increase in selling on any down-move.� No demand (no buying), shows that there is little buying on any up-move.Bull moves run longer than bear moves because traders like to take profits. This creates a resistance to upmoves.However, you cannot have a bear market develop from a bull market until the stock bought on the

lows has been sold (distributed). Resistance in a bull move represents selling. The professional does notlike to have to keep buying into resistance, even if he is bullish. He also wants to take the path of leastresistance. To create the path of least resistance he may have to gap-up, shake-out, test, and so on, or hemay do nothing at that moment, allowing the market to just drift.Bear markets run faster than bull markets because a bear market has no support from the major players.Most traders do not like losses and refuse to sell, hoping for a recovery. They may not sell until forced outon the lows. Refusing to sell and accepting small losses, the trader becomes locked-in and then becomes aweak holder, waiting to be shaken out on the lows.
Markets Can be Marked Up (or Down)You cannot help notice how major moves from one price level to another usually happen quickly. Thisrapid movement from one price level to another is not by chance – it is designed for you to lose money.You can be suddenly locked-into a poor trading position, or locked out of a potentially good trade by one ortwo days (or bars) of rapid price movement: The Index or stock usually then rests and starts to go sideways.If you have been locked-into a poor trade, you may regain hope, and so will not cover a potentiallydangerous position. The next sudden move against you does exactly the same thing, so the processcontinues. Conversely, if you are not in the market and have been hesitating or waiting to trade, sudden upmoveswill catch you unawares; you are then reluctant to buy into a market where, yesterday, you couldhave bought cheaper. Eventually a price is reached where you cannot stand the increases in prices anymore and you buy, usually at the top!Market-makers, specialists and other professional traders, are not controlling the market, but simply takingfull advantage of market conditions to improve their trading positions. However, they can and will, ifmarket conditions are right, mark the market up or down, if only temporarily, to catch stops and generallyput many traders on the wrong side of the market. The volume will usually tell you if this is going on, as itwill be low in any mark-up that is not genuine. Yes, they are marking the market either up or down, but ifthe volume is low, it is telling you that there is reduced trading. If there is no trading going on in onedirection, the path of least resistance is generally in the opposite direction!
Firstly, the volume is telling you how much trading activity there hasbeen. Secondly, the spread or price action is telling you the position the specialists are happy with on thisactivity (which is why the price spread is so important). All the buying and selling activity from around theworld has been averaged down into a 'view' taken by the specialists or market-makers – a view from thosetraders who have to create a market, can see both sides of the order book, and who trade their ownaccounts.However, you do need to recognise that professional traders can do a number of things to better theirtrading positions: Gapping up or gapping down, shake-outs, testing, and up-thrusts are all moneymakingmanoeuvres helping the market-makers to trade successfully, at your expense – it matters not to them, asthey do not even know you.
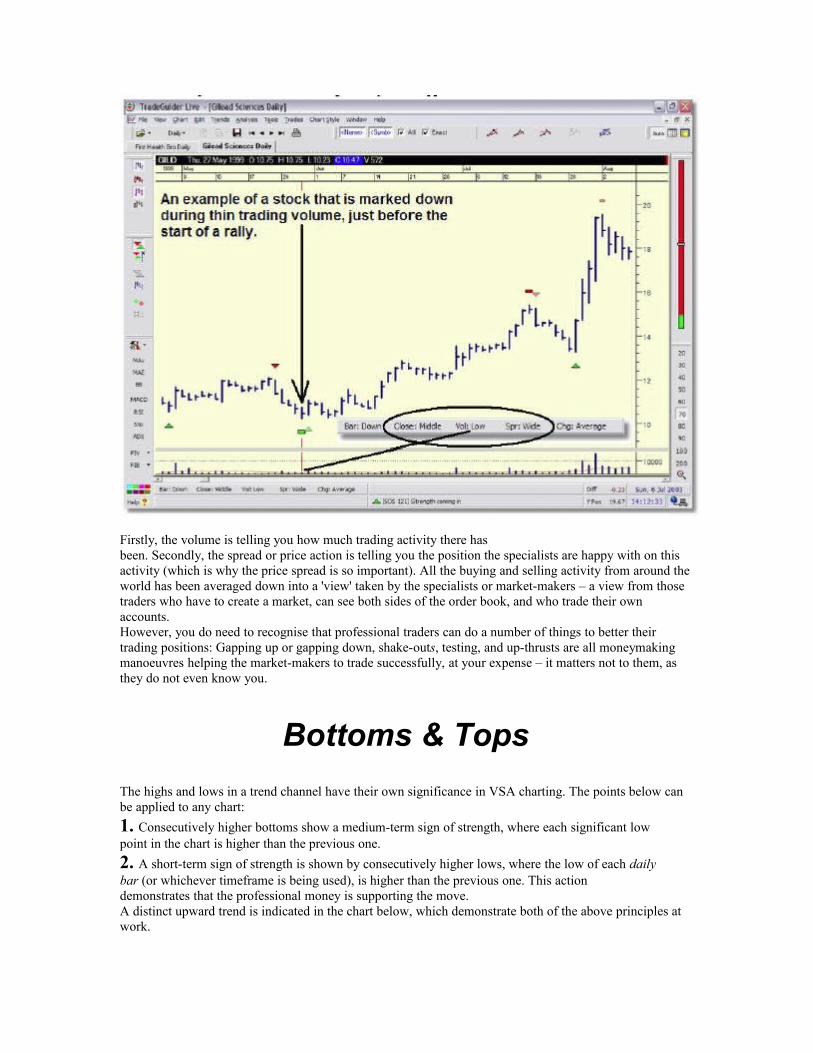
Bottoms & TopsThe highs and lows in a trend channel have their own significance in VSA charting. The points below canbe applied to any chart:1. Consecutively higher bottoms show a medium-term sign of strength, where each significant lowpoint in the chart is higher than the previous one.2. A short-term sign of strength is shown by consecutively higher lows, where the low of each dailybar (or whichever timeframe is being used), is higher than the previous one. This actiondemonstrates that the professional money is supporting the move.A distinct upward trend is indicated in the chart below, which demonstrate both of the above principles atwork.
Conversely,1. Consecutively lower tops show a medium-term sign of weakness, where each significant highpoint in the chart is lower than the previous one.2. A short-term sign of weakness is shown by consecutively lower highs, where the high of eachdaily bar (or whichever timeframe is being used), is lower than the previous one. This actiondemonstrates that the professional money is not supporting the move.

The first lower top in a bull move and the first higher bottom in a bear move may be the first indication youhave of a possible change of trend.
few tips:� Old trend lines from the past may be used with some success to locate areas of support andresistance, especially where they group together (trend cluster).� Compare two or more timeframes, looking for trending across a longer and shorter timeframe.� Do not interpret trend lines mechanically. By all means draw the trend lines mechanically, but donot interpret them in a strict fashion – they should be used as a gauge.� Trend lines represent potential resistance to a move in one direction or the other. Try to rememberthat it takes effort by the specialist or market-makers to penetrate resistance. The market alwayswants to take the path of least resistance. The existence of effort or the lack of effort as itapproaches these resistance areas will indicate whether the line is going to hold or not.
Using Trends to Determine Overbought & Oversold Levels
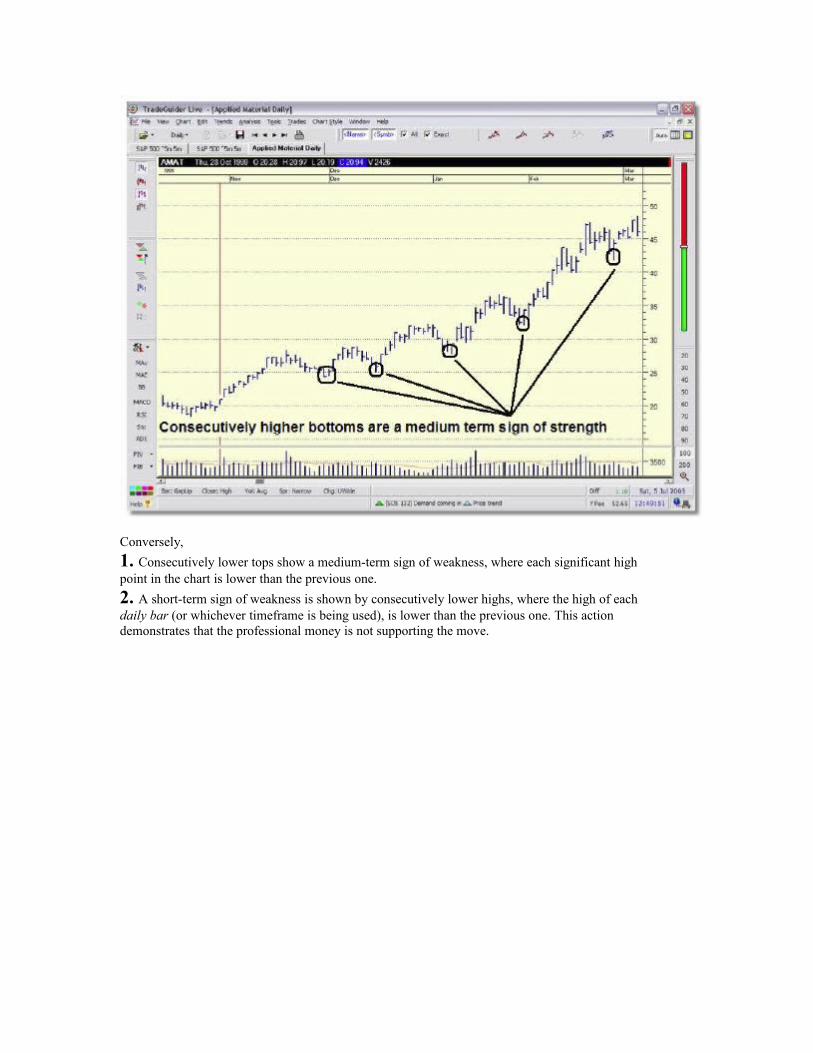
The area between the upper and lower trend lines is known as the trading range. When the market is goingsideways between the upper and lower trend lines, then the old Technical Analysis term "trading range" canbe said to be in effect. In VSA terms, the (sideways) market is trading within its range, and will continue todo so until applied (selling or buying) effort makes it break out.A trader who uses our VSA principles will analyse price action in the top and bottom quarters of the trading
range, because important observations take place in these areas, as the price heads for the supply or supportlines respectively.The area above the supply (higher) trend line is known as overbought and the area below the support(lower) trend line is referred to as oversold. You will find this a far more reliable indication than thetraditional methods.The middle of the range represents the mean of the data. Here there is no vulnerability to a move in anydirection and the price, in theory, can go anywhere. That is, in theory!
Remember, it takes accumulation or distribution on the highs or lows to create an imbalance of supply anddemand. Once this process has taken place the move is then weighted to go to the edges of the establishedtrend channel. At the edges of the trading range, if the trend is holding, there is a vulnerability to areversal. When in the overbought or oversold areas, the chances of a reversal increases, but here a strangephenomenon can occur.The trend boundary line seems to offer resistance in both directions. Having penetrated the resistance inone direction and passed through the line, there now seems to be resistance to passing back through theline, back into the old trading range.
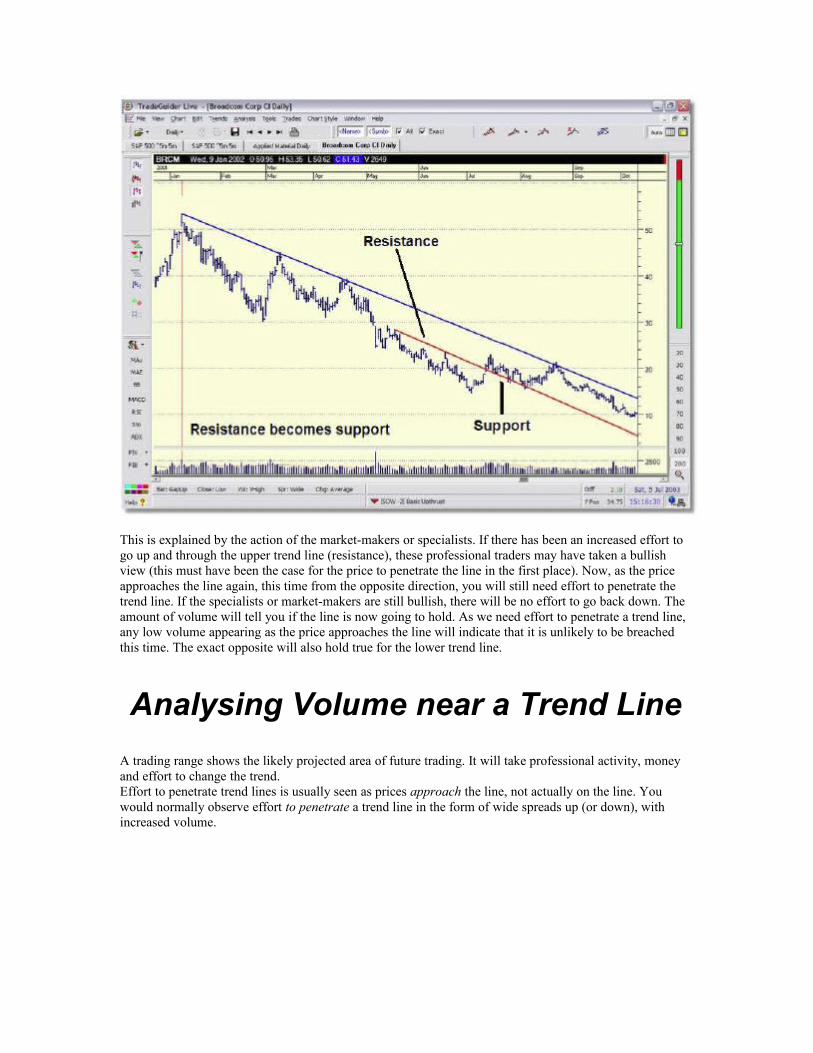
This is explained by the action of the market-makers or specialists. If there has been an increased effort togo up and through the upper trend line (resistance), these professional traders may have taken a bullishview (this must have been the case for the price to penetrate the line in the first place). Now, as the priceapproaches the line again, this time from the opposite direction, you will still need effort to penetrate thetrend line. If the specialists or market-makers are still bullish, there will be no effort to go back down. Theamount of volume will tell you if the line is now going to hold. As we need effort to penetrate a trend line,any low volume appearing as the price approaches the line will indicate that it is unlikely to be breachedthis time. The exact opposite will also hold true for the lower trend line.
Analysing Volume near a Trend LineA trading range shows the likely projected area of future trading. It will take professional activity, moneyand effort to change the trend.Effort to penetrate trend lines is usually seen as prices approach the line, not actually on the line. Youwould normally observe effort to penetrate a trend line in the form of wide spreads up (or down), withincreased volume.

Study old trend lines and observe when these lines were broken. Note the effort required. Gapping is oneway to overcome resistance. The professional money knows exactly where the resistance is. Gappingthrough these areas is always because of activity by the market-makers or specialists. This effort mustalways be cost effective. For example, they are unlikely to push up through resistance unless they arebullish. Any sudden activity will always have side benefits, by locking traders in or out of the market,encouraging traders not to sell, and panicking traders on the short side who then cover.
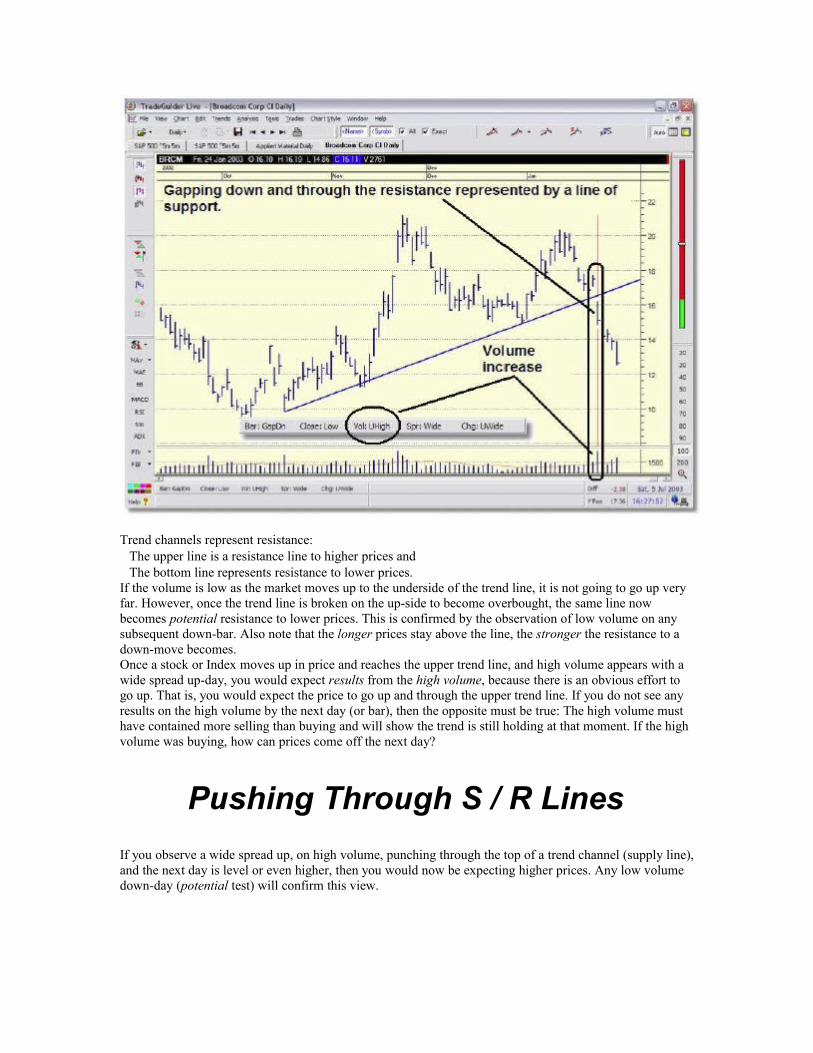
Trend channels represent resistance:� The upper line is a resistance line to higher prices and� The bottom line represents resistance to lower prices.If the volume is low as the market moves up to the underside of the trend line, it is not going to go up veryfar. However, once the trend line is broken on the up-side to become overbought, the same line nowbecomes potential resistance to lower prices. This is confirmed by the observation of low volume on anysubsequent down-bar. Also note that the longer prices stay above the line, the stronger the resistance to adown-move becomes.Once a stock or Index moves up in price and reaches the upper trend line, and high volume appears with awide spread up-day, you would expect results from the high volume, because there is an obvious effort togo up. That is, you would expect the price to go up and through the upper trend line. If you do not see anyresults on the high volume by the next day (or bar), then the opposite must be true: The high volume musthave contained more selling than buying and will show the trend is still holding at that moment. If the highvolume was buying, how can prices come off the next day?
Pushing Through S / R LinesIf you observe a wide spread up, on high volume, punching through the top of a trend channel (supply line), and the next day is level or even higher, then you would now be expecting higher prices. Any low volume down-day (potential test) will confirm this view.
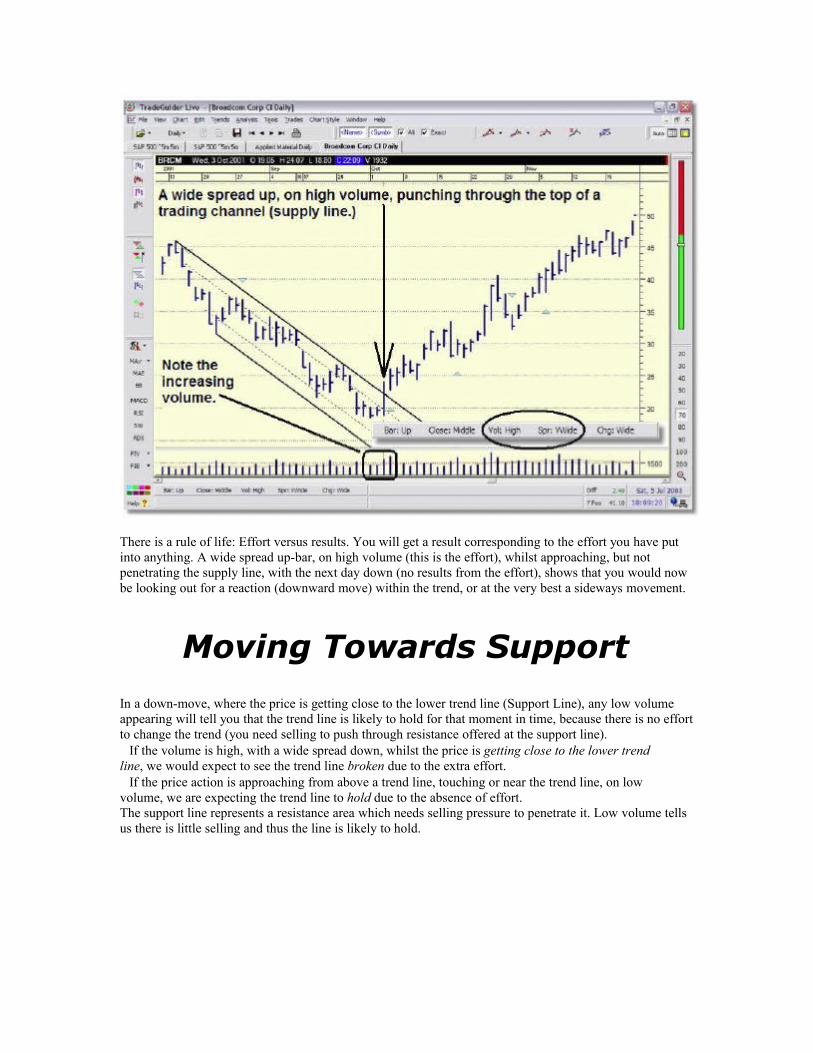
There is a rule of life: Effort versus results. You will get a result corresponding to the effort you have putinto anything. A wide spread up-bar, on high volume (this is the effort), whilst approaching, but notpenetrating the supply line, with the next day down (no results from the effort), shows that you would nowbe looking out for a reaction (downward move) within the trend, or at the very best a sideways movement.
Moving Towards Support
In a down-move, where the price is getting close to the lower trend line (Support Line), any low volumeappearing will tell you that the trend line is likely to hold for that moment in time, because there is no effortto change the trend (you need selling to push through resistance offered at the support line).� If the volume is high, with a wide spread down, whilst the price is getting close to the lower trendline, we would expect to see the trend line broken due to the extra effort.� If the price action is approaching from above a trend line, touching or near the trend line, on lowvolume, we are expecting the trend line to hold due to the absence of effort.The support line represents a resistance area which needs selling pressure to penetrate it. Low volume tellsus there is little selling and thus the line is likely to hold.
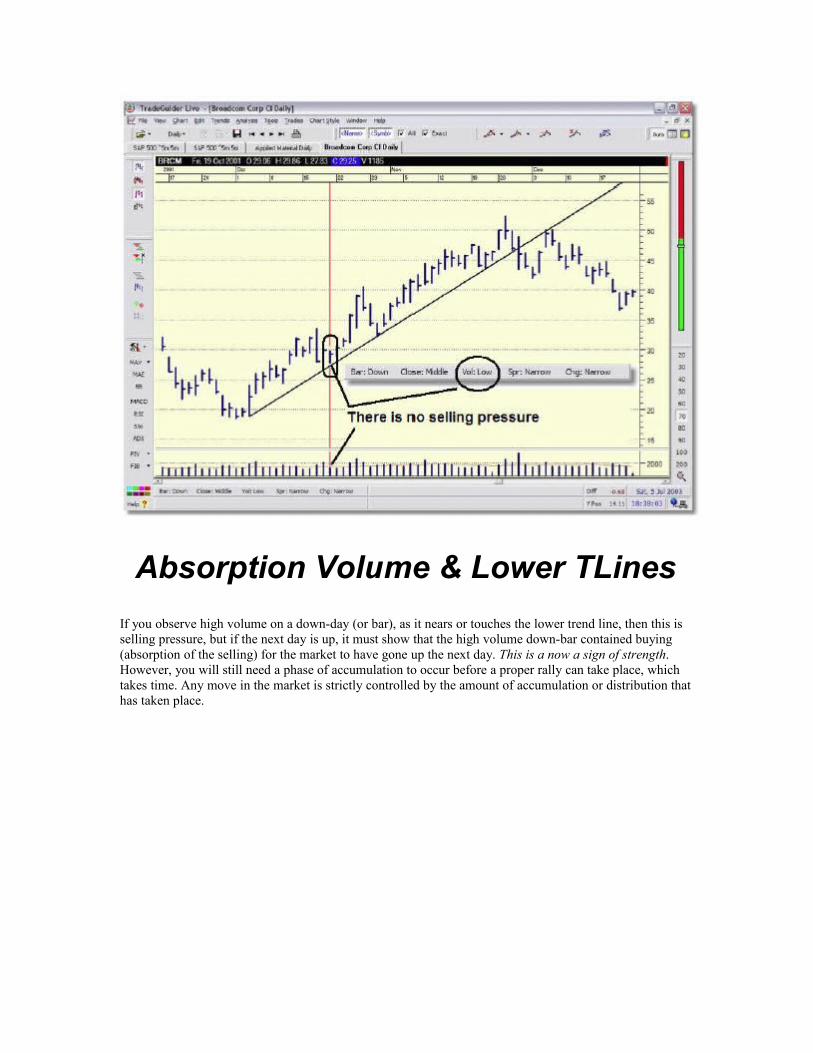
Absorption Volume & Lower TLinesIf you observe high volume on a down-day (or bar), as it nears or touches the lower trend line, then this isselling pressure, but if the next day is up, it must show that the high volume down-bar contained buying(absorption of the selling) for the market to have gone up the next day. This is a now a sign of strength.However, you will still need a phase of accumulation to occur before a proper rally can take place, whichtakes time. Any move in the market is strictly controlled by the amount of accumulation or distribution thathas taken place.
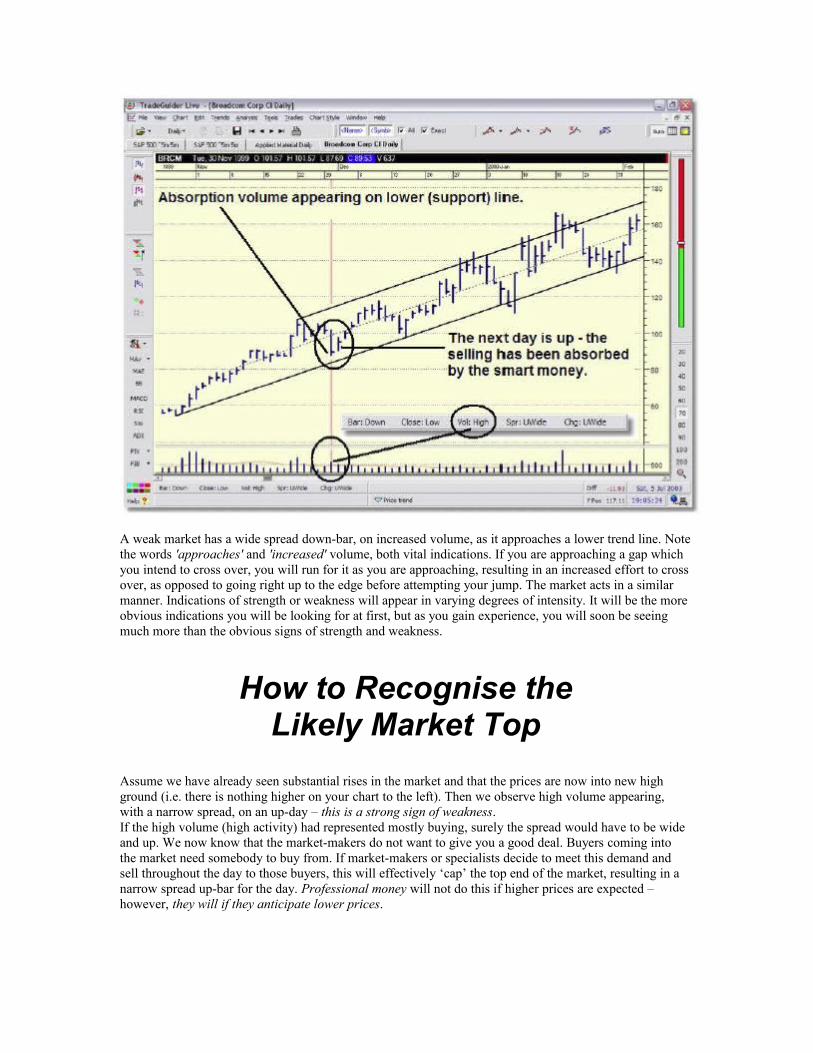
A weak market has a wide spread down-bar, on increased volume, as it approaches a lower trend line. Notethe words 'approaches' and 'increased' volume, both vital indications. If you are approaching a gap whichyou intend to cross over, you will run for it as you are approaching, resulting in an increased effort to crossover, as opposed to going right up to the edge before attempting your jump. The market acts in a similarmanner. Indications of strength or weakness will appear in varying degrees of intensity. It will be the moreobvious indications you will be looking for at first, but as you gain experience, you will soon be seeingmuch more than the obvious signs of strength and weakness.
How to Recognise theLikely Market Top
Assume we have already seen substantial rises in the market and that the prices are now into new highground (i.e. there is nothing higher on your chart to the left). Then we observe high volume appearing,with a narrow spread, on an up-day – this is a strong sign of weakness.If the high volume (high activity) had represented mostly buying, surely the spread would have to be wideand up. We now know that the market-makers do not want to give you a good deal. Buyers coming intothe market need somebody to buy from. If market-makers or specialists decide to meet this demand andsell throughout the day to those buyers, this will effectively ‘cap’ the top end of the market, resulting in anarrow spread up-bar for the day. Professional money will not do this if higher prices are expected –however, they will if they anticipate lower prices.
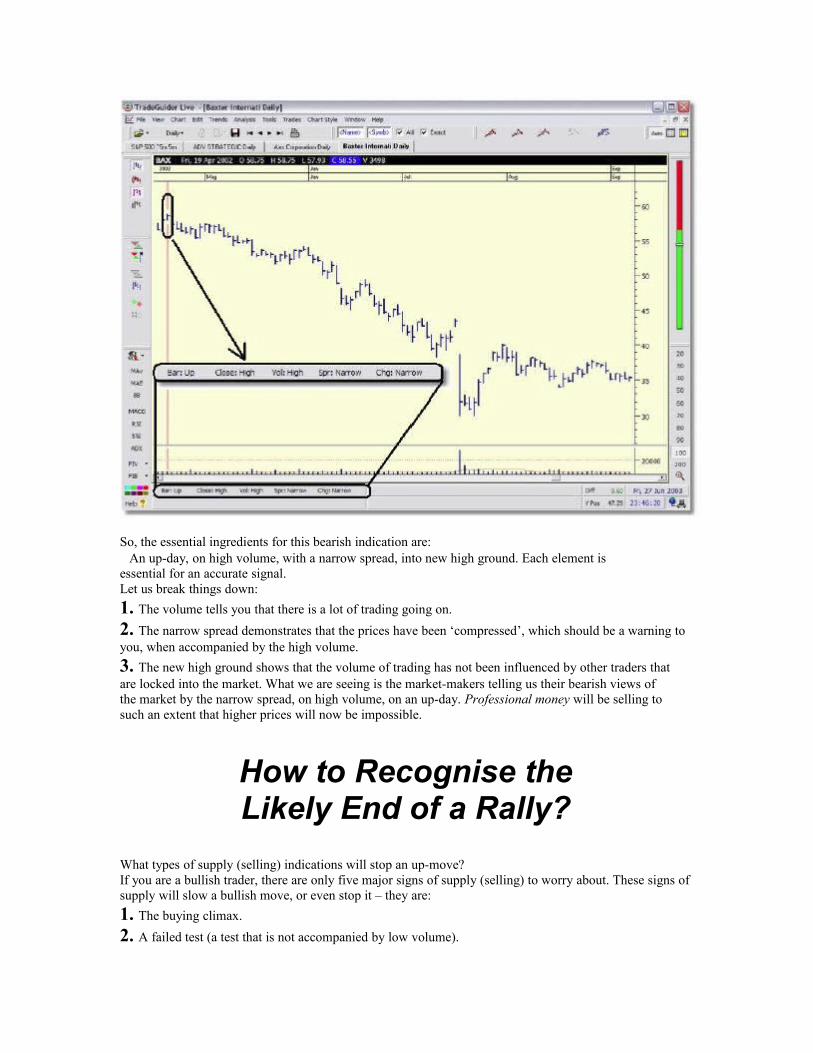
So, the essential ingredients for this bearish indication are:� An up-day, on high volume, with a narrow spread, into new high ground. Each element isessential for an accurate signal.Let us break things down:1. The volume tells you that there is a lot of trading going on.2. The narrow spread demonstrates that the prices have been ‘compressed’, which should be a warning toyou, when accompanied by the high volume.3. The new high ground shows that the volume of trading has not been influenced by other traders thatare locked into the market. What we are seeing is the market-makers telling us their bearish views ofthe market by the narrow spread, on high volume, on an up-day. Professional money will be selling tosuch an extent that higher prices will now be impossible.
How to Recognise theLikely End of a Rally?
What types of supply (selling) indications will stop an up-move?If you are a bullish trader, there are only five major signs of supply (selling) to worry about. These signs ofsupply will slow a bullish move, or even stop it – they are:1. The buying climax.2. A failed test (a test that is not accompanied by low volume).

3. Narrow spreads accompanied by high volume, on an up-day, into new high ground.4. The up-thrust.5. Sudden high volume on an up-day (bar), with the next day (bar) down, on a wide spread, closingbelow the low of the previous bar.It is not difficult to spot these signs.
The Buying ClimaxThe buying climax only comes along on rare occasions. It is hallmarked by a very wide spread up to closewell off the highs on ultra-high volume. This is after a substantial bull market has already taken place. Ifyou are in new high ground, this is a certain top. A test with low volume indicates higher prices; however,the same test with high volume indicates supply present. The market is unlikely to go up very far withsupply (selling) in the background.
Narrow Spreads & High VolumeThis is very simple to see. The public and others have rushed into the market, buying before they missfurther price rises. The professional money has taken the opportunity to sell to them. This action will bereflected on your chart as a narrow spread with high volume on an up-day. If the bar closes on the high,this is an even weaker signal. This type of action is seen after a rally of some sort. Buyers are drawn intothe market, usually on good news, which gives the professionals the opportunity to sell. Remember, youare not trying to beat the market, but join the professional money. You can sell with them, and youcertainly should not be buying.
Up-ThrustsUp-thrusts can be recognised as a wide spread up during the day (or during any timeframe), accompaniedby high volume, to then close on the low. Up-thrusts are usually seen after a rise in the market, where themarket has now become overbought and there is weakness in the background. Up-thrusts are frequentlyseen after a period of selling, just before a down-move. Note the day must close on or very near the lows;the volume can be either low (no demand) or high (supply overcoming the demand).Market-makers are quite capable of generating an up-thrust, which is a moneymaking manoeuvre. Thedynamics of an up-thrust are interesting and quite brutal – the rapid up-move brings in buyers and catchesstops. The traders who are already selling (shorting) the market, become alarmed and cover their positions.It is a common strategy to suddenly mark-up prices to catch the unwary. This action is seen after signs ofweakness and frequently indicates the start of a falling market. Once the market is known to have becomeweak, market-makers or specialists can mark the prices up quickly, perhaps on good news, to trap you.The higher price is maintained for as long as possible. The price then falls back, closing on the lows. Asthe early price is marked up, premature short traders are liable to panic and cover with buy orders.However, those traders looking for breakouts will buy, but their stop-loss orders are usually triggered as theprice plummets back down. All those traders who are not in the market may feel they are missing out andwill feel pressured to start buying. This action is also designed to entice large pension funds, fundmanagers, banks and so on into the market. You do not have to be a small trader to be forced into a poortrading position! Overall, these up-thrusts are very profitable for the market-makers or specialists. An upthrust is usually seen after a period of weakness and usually indicates lower prices.Remember that the market-makers are in the enviable position of being able to see both sides of the marketand have a far better view of the real situation than ordinary traders could possibly have. Surely, if themarket-makers were still bullish, they would be gunning for stops below the market rather than above it.
You now know that a weak market is usually marked-up just before a fall (up-thrust), which tends to occurat the top of the trading range (or an overbought region). As this is often the case, the up-thrust gives you a chance to short right on the turn.There are many different types of up-thrust. The example in the chart shows how an up-thrust, combined with extremely high volume, can stop a rally dead in its tracks.

What Stops a Down- Move & How Will I Recognise This?
High volume on a down-day/bar always means selling. However, if the day’s action has closed in themiddle or high, then market-makers and other professional money must have attempted to buy into theselling, or absorbed the selling (by buying), which then causes the market to stop going down. Marketmakerswill only buy into a selling down-day if the price levels have become attractive to them and thetrading syndicates have started to accumulate. The professionals are prepared to buy into the selling(absorption) because large buy orders have arrived, which they can see on the other side of the book. Wedo not have to be interested in the "whys" when we are letting the market action tell us what is happening,which is the reason why your news feed will become redundant and an unnecessary distraction when youhave mastered the techniques of reading the market properly.

Absorption volume typically marks the end of a downward trend. It is characterised by a very high volumebar that closes below the previous bar, on a wide spread. In normal circumstances, this would be construedas selling, but the defining difference is that the bar closes on the high. If the high volume had representedselling, how can the price action close on the high? There was a huge amount of buying (absorption) onthis bar. In this instance, the volume was extremely high and there was still a large amount of floatingsupply, which accounts for the market drifting sideways before testing the high volume area for furthersupply – the test shown by the rectangular signal after the absorption volume. The test serves a number ofpurposes – it’s designed to check for floating supply, mislead the market, and catch stops on the long side(i.e. to relieve traders of stock who are correctly buying into the move). At the point of the test, most of thesupply had been removed and the market was almost free to move upwards – it just required one last dipdown to remove the remaining latent supply.You will have difficulty seeing absorption volume at the time it is happening, because your logical thinkingwill be affected by the constant flow of bad news, and doom and gloom that will be circulating on the TV,radio, newspapers and journals, internet chat rooms, forums and bulletin boards, not to mention yourfriends and family. You will have to be a single-minded, contrarian thinker if you are to remain completelyuninfluenced by this tide of negativity – no-one said this was going to be easy!
How to Recognise a Market BottomOnce you have seen very high volume on a down-day (or bar) on your chart, this shows high activity in themarket. If a rally starts due to the market-makers buying (or absorbing) the selling from weak holders whoare being shaken-out on the lows, the market will frequently re-test this high volume absorption area,bringing the market back down into the reversal area (where the high volume was first seen) to make surethat all the selling has, in fact, disappeared. You will know immediately if all the serious selling has
disappeared because the volume will be low as it penetrates back into the old high volume price area. Youwould be wise to pay attention to this observation because it represents an excellent buy signal.In summary, to mark a market down challenges the bears to come out into the open. The low volume ofactivity shows that there is little selling left from the bearish side of the market. There is now an imbalancebetween supply and demand caused by the recent shake-out (at point (a)). If there is little or no supply leftin the market, this clearly shows that the trading syndicates and market-makers have been successful intheir attempt to absorb selling from the weak holders, and that prices are now set to rise.
Professional SupportThe following signs are indicative of professional support:� A downward trend will already be in progress, and a down-day (or bar) appears, which closes in themiddle (or on the high), accompanied by very high volume, whilst the next bar is up.If the bar closes in the middle (or high), we can surmise that demand is overcoming supply. Buying fromprofessional traders has entered the market and the activity on the previous day (or bar) has been high. Onthis activity the market has not fallen, so the high activity must have been mostly buying. Note that thevolume must not be excessively high, because excessive volume may swamp the market, which even theprofessional money cannot absorb.Remember, you are dealing with professional activity. Low volume is telling you that they are either:� not interested in buying on any up-move, or� they are not selling on any down-move.Have they seen something in the background you may have missed?Ask yourself, "Why are they not buying or selling on this up-move?" Answer: Because they are bearish orjust negative on the market.Alternatively, you may ask yourself, "Why are they not selling on this down-move?" Answer: Because theyare bullish!I must emphasise that it takes professional money to alter the trend of the market. Professional traders willnot fight the market. They will duck and weave like a boxer, always ready to take full advantage whereverpossible. To fight the market means you are:� buying on up-moves when there is supply coming onto the market and� selling on down-moves when there is no supply.Both of these tactics are very quick ways to go broke!
The Shake-OutA shake-out can be defined as is a sudden wide spread down, usually on bad news. It is engineered tocreate panic selling, thus helping the transfer of stock back to the professional traders. This is usually seenafter a bull move has been running for some time. You would expect higher prices after this event. A trueselling climax looks the same as this shake-out does; the big difference is that on a selling climax you willhave a Bear Market behind you.
Stopping VolumeAt some time during a bear move, or during a reaction, prices will start to resist further down-moves.These resistance areas are frequently seen on a down-day, on very high volume, closing on the highs.Buying must have entered the market for it to close on the highs. What else could the high volume show?� If the day closes on the lows, you now have to wait to see what happens on the next day.
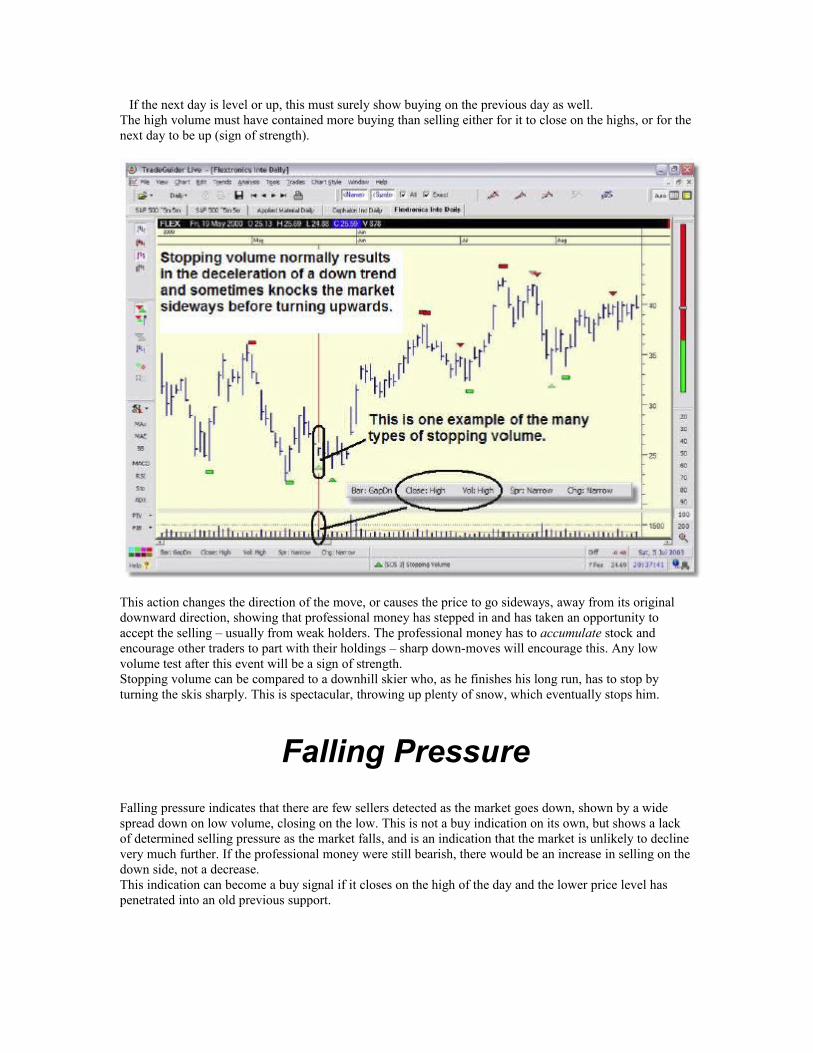
� If the next day is level or up, this must surely show buying on the previous day as well.The high volume must have contained more buying than selling either for it to close on the highs, or for thenext day to be up (sign of strength).
This action changes the direction of the move, or causes the price to go sideways, away from its originaldownward direction, showing that professional money has stepped in and has taken an opportunity toaccept the selling – usually from weak holders. The professional money has to accumulate stock andencourage other traders to part with their holdings – sharp down-moves will encourage this. Any lowvolume test after this event will be a sign of strength.Stopping volume can be compared to a downhill skier who, as he finishes his long run, has to stop byturning the skis sharply. This is spectacular, throwing up plenty of snow, which eventually stops him.
Falling PressureFalling pressure indicates that there are few sellers detected as the market goes down, shown by a widespread down on low volume, closing on the low. This is not a buy indication on its own, but shows a lackof determined selling pressure as the market falls, and is an indication that the market is unlikely to declinevery much further. If the professional money were still bearish, there would be an increase in selling on thedown side, not a decrease.This indication can become a buy signal if it closes on the high of the day and the lower price level haspenetrated into an old previous support.
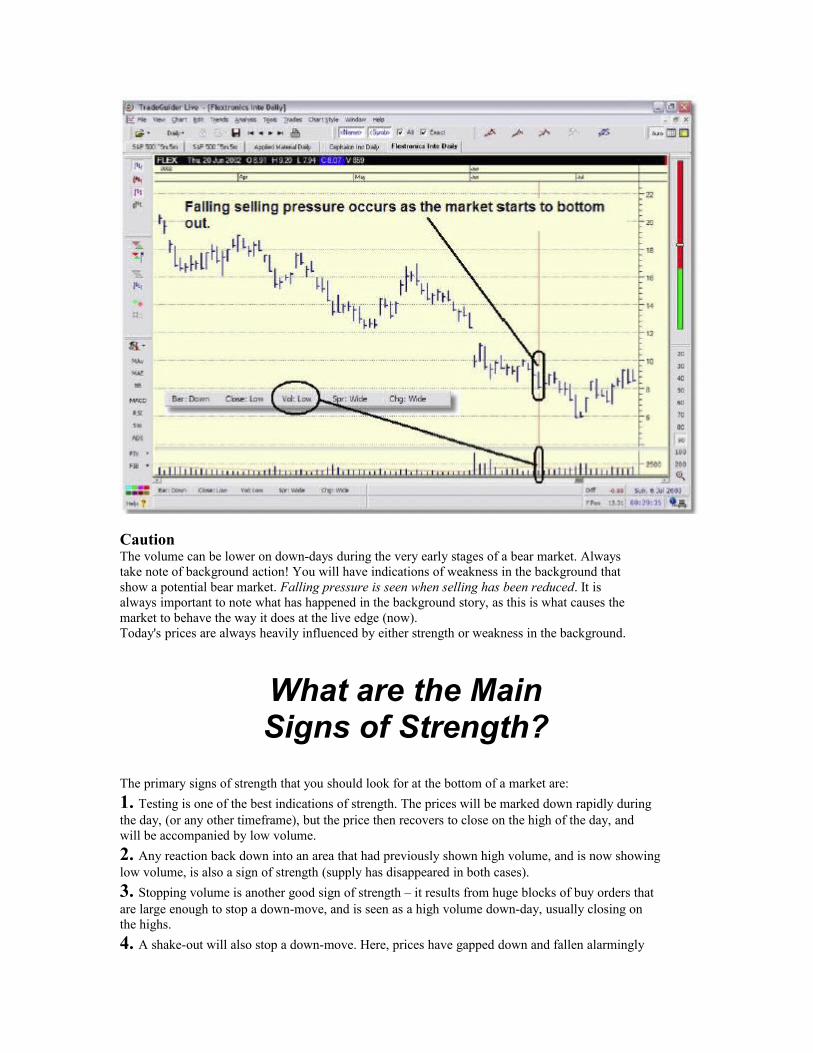
CautionThe volume can be lower on down-days during the very early stages of a bear market. Alwaystake note of background action! You will have indications of weakness in the background thatshow a potential bear market. Falling pressure is seen when selling has been reduced. It isalways important to note what has happened in the background story, as this is what causes themarket to behave the way it does at the live edge (now).Today's prices are always heavily influenced by either strength or weakness in the background.
What are the MainSigns of Strength?
The primary signs of strength that you should look for at the bottom of a market are:1. Testing is one of the best indications of strength. The prices will be marked down rapidly duringthe day, (or any other timeframe), but the price then recovers to close on the high of the day, andwill be accompanied by low volume.2. Any reaction back down into an area that had previously shown high volume, and is now showinglow volume, is also a sign of strength (supply has disappeared in both cases).3. Stopping volume is another good sign of strength – it results from huge blocks of buy orders thatare large enough to stop a down-move, and is seen as a high volume down-day, usually closing onthe highs.4. A shake-out will also stop a down-move. Here, prices have gapped down and fallen alarmingly
after a bearish move has already taken place. If the market gaps-up on the following day (or bar),you have all the signs of a shake-out, and a good sign of strength.
What are the MainSigns of Weakness?
The main signs of weakness are:1. A buying climax.2. An up-thrust.3. A no-demand day (or bar).4. A narrow spread, on an up-day (or bar), which is into new high ground, on very high volume.5. High volume present on an up-day (or bar), whilst the market falls on the next day (or bar), and fails to make higher prices, or the market may even fall.