understanding violence in southeast asia · pdf fileunderstanding violence in southeast asia...
TRANSCRIPT

Patrick Barron - Anders Engvall - Adrian MorelJULY 2016
UNDERSTANDING VIOLENCE IN SOUTHEAST ASIA
THE CONTRIBUTION OF VIOLENT INCIDENTS MONITORING SYSTEMS


Patrick Barron - Anders Engvall - Adrian MorelJULY 2016
UNDERSTANDING VIOLENCE IN SOUTHEAST ASIA
THE CONTRIBUTION OF VIOLENT INCIDENTS MONITORING SYSTEMS


This work is the result of collaboration between The Asia Foundation (www.asiafoundation.org), the International Development Research Center (www.idrc.ca) and the UK Department for International
Development (DFID), with funding from the World Bank Group.
Rights and Permissions
This work is available under the Creative Commons Attribution 3.0 IGO license (CC BY 3.0 IGO)

4
TABLE OF CONTENTS
1. INTRODUCTION 8
2.VIOLENT INCIDENTS MONITORING SYSTEMS IN INDONESIA, THE PHILIPPINES, AND THAILAND 10
2.1 National Violence Monitoring System (NVMS), Indonesia 10
2.2 Bangsamoro Conflict Monitoring System (BCMS), the Philippines 11
2.3 Deep South Incident Dataset (DSID), Thailand’s Deep South 11
2.4 Key elements of the three VIMSs 12
3. WHY DEVELOP VIOLENT INCIDENTS MONITORING SYSTEMS? 14
3.1 Violence in Southeast Asia 14
3.2 Existing cross-country datasets 16
3.3 Under-reporting of levels and impacts of violence 17
3.4 The importance of using local sources 23
3.5 The advantages of using a wide definition of violence 24
4. PATTERNS OF VIOLENCE IN SUBNATIONAL CONFLICT AREAS 26
4.1 The impacts of subnational violence in Indonesia, the Philippines, and Thailand 26
4.2 The characteristics of violence in SNC areas 29
4.3 The evolution of violence in post-conflict areas 33
4.4 The evolution of violence in SNC areas without transition 35
4.5 The concentration of violence within SNC areas 40
4.6 Gendered impacts of violence 48
5. DRIVERS OF VIOLENCE: FINDINGS FROM MULTIVARIATE ANALYSES 51
5.1 Correlates of violence: findings from the Philippines 52
5.2 Climate, global warming, and localized violence: findings from Indonesia 54
5.3 Fiscal programs and violence: findings from Thailand’s Deep South 57
6. CONCLUSIONS 60
REFERENCES 64
ENDNOTES 68
Table 2.1: Key elements of the three systems 13
Table 3.1: Subnational conflicts in Southeast Asia 15
Table 3.2: Violent incidents and deaths in Thailand’s Deep South, 2014: UCDP-GED vs. DSID (cause of difference) 20
Table 3.3: Violent incidents and deaths in Thailand’s Deep South, 2014: ACLED vs. DSID (cause of difference) 22
Table 4.1: Districts with the highest death rates (conflict period), Aceh 47
Table 4.2: Districts with the highest death rates (post-conflict period), Aceh 48
Table 5.1: Correlates of violent incidents in 2014, the Bangsamoro 52
Table 5.2: Temperature, rainfall, and violence, Indonesia 54
Table 5.3: Temperature, rainfall shocks, and price dynamics, Indonesia 55
Table 5.4: Estimation of impact from climate induced price change on violence, Indonesia 56
TABLES
5
Figure 3.1: Violent incidents and deaths in Aceh: UCDP-GED vs. NVMS (matched inclusion criteria) 18
Figure 3.2: Violent deaths in Aceh: UCDP-GED vs. NVMS (unfiltered) 19
Figure 3.3: Violent incidents and deaths in Indonesia (nine provinces): UCDP-GED vs. NVMS (matched inclusion criteria) 19
Figure 3.4: Violent deaths in Thailand’s Deep South: UCDP-GED vs. DSID (unfiltered) 21
Figure 3.5: Violent incidents and deaths in Thailand’s Deep South 2015: ACLED vs. DSID (matched inclusion criteria) 21
Figure 3.6: Violent incidents and deaths in the Bangsamoro: UCDP-GED vs. BCMS (matched inclusion criteria) 22
Figure 3.7: Violent deaths in Indonesia: UCDP-GED vs. NVMS 24
Figure 4.1: Periods of transition for Aceh, Papua, the Bangsamoro, and Thailand’s Deep South 27
Figure 4.2: Incidents and deaths by region 28
Figure 4.3: Violence intensity by SNC area 29
Figure 4.4: Types of violence (share of deaths) 30
Figure 4.5: Types of violence (share of incidents) 30
Figure 4.6: Share of violent incidents by weapons used 31
Figure 4.7: Share of violent deaths by weapons used 32
Figure 4.8: Violent deaths by weapons used and type (separatist/non-separatist), the Bangsamoro 32
Figure 4.9: Violent deaths by weapons used and type (separatist/non-separatist), Thailand’s Deep South 32
Figure 4.10: Violent deaths and incidents by type, Aceh 33
Figure 4.11: Share of deaths by type, Aceh 34
Figure 4.12: Violent deaths and incidents in post-conflict Aceh by type (excluding separatism and crime) 35
Figure 4.13: Deaths by type, Thailand’s Deep South 36
Figure 4.14: Deaths by form, Thailand’s Deep South 36
Figure 4.15: Share of soft and hard target deaths, Thailand’s Deep South 37
Figure 4.16: Violence and peace talks in Thailand’s Deep South 37
Figure 4.17: Number of incidents and deaths related to separatism, Papua 38
Figure 4.18: Forms of separatist violence (number of violent incidents), Papua 39
Figure 4.19: Share of deaths by violence type, Papua 40
Figure 4.20: Deaths and death rates by district (2014), Papua 41
Figure 4.21: Violent deaths in Puncak Jaya, Mikima, and Jayapura city, by violence type (2010-2014), Papua 41
Figure 4.22: Violence by district (2008-2015), Thailand’s Deep South 42
Figure 4.23: Share of violent incidents, 10 most-affected districts vs. 10 least-affected, Thailand’s Deep South 43
Figure 4.24: Violence intensity by province/city, the Bangsamoro 46
Figure 4.25: Types of violence as share of deaths (2011-2014), the Bangsamoro 46
Figure 4.26: Female share of violent deaths by year 49
Figure 4.27: Violent deaths by gender, Aceh 49
Figure 4.28: Violent deaths by gender, Papua 50
Figure 4.29: Deaths from separatist violence, by gender 50
Figure 5.1: Annual special budget and violent incidents, Thailand’s Deep South 59
Figure 5.2: Link between budget allocations and violent incidents, Thailand’s Deep South 59
Map 4.1: Clustering of violence based on administrative borders (2004-2012), Thailand’s Deep South 43
Map 4.2: Clustering of violence without imposing administrative borders (2004-2012), Thailand’s Deep South 44
Map 4.3: Village-level unemployment (2003), Thailand’s Deep South 44
Map 4.4: Village-level language use (2003), Thailand’s Deep South 45
Map 4.5: Village-level religion (2003), Thailand’s Deep South 45
FIGURES
MAPS

6
ACKNOWLEDGEMENTSThis paper was produced as part of the Cross Regional Violence Monitoring Knowledge Exchange (CRVME) project, implemented by The Asia Foundation. The CRVME aims to foster knowledge exchange among violence monitoring systems in Asia, and disseminate lessons learned in the region and beyond. The project is funded by the Korea Trust Fund for Economic and Peacebuilding Transitions, with co-support from Canada’s International Development Research Centre (IDRC). The UK Department for International Development (DFID) provided additional support through the Programme Partnership Arrangement.
The paper draws on data produced by the Philippines’ Bangsamoro Conflict Monitoring System, implemented by International Alert with funding from the World Bank, Thailand’s Deep South Watch, an independent project hosted by Prince of Songkla University in Pattani, and Indonesia’s National Violence Monitoring System, implemented by the Coordinating Ministry for Human Development and Culture until 2015. Data from the Philippines and Indonesia systems are publically available. Deep South Watch plans to make their data available to the public. Thanks to them for allowing us access.
Bryony Lau and Sasiwan Chingchit from The Asia Foundation provided inputs into the paper. Thanks to Srisompob Jitpiromsri who helped us interpret some of the Thailand findings. Ann Bishop provided editorial assistance and Landry Dunand designed the publication. Clionadh Raleigh (Armed Conflict Location and Event Data Project) reviewed the paper.
Section 5 of the paper draws on three papers commissioned by The Asia Foundation. These were authored by Austin Wright and Patrick Signoret (Indonesia paper), Jospeh Capuno (the Philippines), and Anders Engvall and Srisompob Jitpiromsri (Thailand).
The Asia Foundation organized a final seminar on June 1-2, 2016 in Bangkok, Thailand. The objectives of the seminar were to validate and disseminate the project’s outputs; highlight the utility of data from the violent incidents monitoring systems to a wider audience; and to establish a network of violence monitoring practitioners in the region and beyond. The event brought together a regional and global audience including development practitioners, policy-makers, academics and civil society for two days of presentations and discussions. A summary of the workshop’s discussions and recommendations is accessible online at the following address: http://www.asiafoundation.org/tag/violence-monitoring.

7
This paper is a product of staff from, and a consultant to, The Asia Foundation. It was financed by the Korea Trust Fund for Economic and Peacebuilding Transitions, along with co-financing from Canada’s International Development Research Centre and the UK Department for International Development. The findings, interpretations and conclusions expressed do not necessarily reflect the views of The Asia Foundation, IDRC, the World Bank Group, the Korea Trust Fund, or DFID.
The Asia Foundation and the World Bank Group do not guarantee the accuracy of the data included in this work. The boundaries, colors, denominations, and other information shown on any map in this work do not imply any judgement from The Asia Foundation or the funders on the legal status of any territory or the endorsement or acceptance of such boundaries.
DISCLAIMER

8
1. INTRODUCTION
Subnational conflict (SNC) and violence is the dark underbelly of a rising Asia. Between 1990 and 2010, the proportion of people living on under $1.25 a day fell from 56% to 12%;1 in 2013, East Asia grew by 7.1%, far outpacing any other region.2 The Asian Development Bank has dubbed the decades ahead the Asia century.3 Yet the rising Asia narrative masks an ugly truth. While hundreds of millions have seen their incomes and opportunities expand precipitously, in many countries accelerated growth has been conjoined with continuing subnational violence.
Georeferenced Events Dataset and the Armed Conflict Location and Event Data (ACLED) project, provide statistical information on subnational armed conflicts. However, because they include only a subset of violence occurring in SNC areas, and because they often use data sources far removed from the areas studied, they tend to under-report violence and its impacts. Other datasets, such as that used in the Geneva Declaration’s Burden of Armed Violence study, record death rates for each country in the region. Yet they do not break down what the drivers of violence are within countries, record other impacts beyond deaths, or how violence incidence and impacts vary within countries.
New micro-level data are needed to understand and effectively prevent and respond to violence. Three violent incidents monitoring systems (VIMSs) in Indonesia, the Philippines, and Thailand (each introduced in the next section), have responded to this challenge, and produce highly granular information on multiple forms of violence in the areas they study. These are: the Indonesian National Violence Monitoring System, which records information on violence across all of the country; the Bangsamoro Conflict Monitoring System, which records violence in the Bangsamoro, in the Philippines; and the Deep South Incident Database, which covers Thailand’s Deep South.
One prominent form is secessionist subnational conflicts (SNCs)—armed conflicts over control of a subnational territory within a sovereign state—which have affected half of the 12 countries in Southeast Asia in the last 20 years.4 SNCs in the region have killed at least 25,000 people since the turn of the century, a figure that likely significantly underestimates the true death toll.5 Other forms of subnational violence such as inter-communal riots and pogroms, conflict over control of land and natural resources, electoral violence, urban crime, and gender-based violence—are also pervasive. Such violence devastates lives, leading to human insecurity and stymying development.
It has been impossible to fully understand the wide array of subnational violence occurring in Southeast Asia because of data limitations; this has constrained the development of effective policies to prevent and manage violence. Better data is needed to monitor progress against the violence reduction targets set by the Sustainable Development Goals: SDG 16.1 seeks to “significantly reduce all forms of violence and related death rates everywhere”. National-level homicide statistics fail to reflect subnational variation in the intensity and nature of violence. Global cross-national databases, such as the UCDP/PRIO
9
This paper draws on data from the three systems and does the following:
First, it updates and fleshes out our understanding of violence in three Southeast Asian countries. The paper provides new, more comprehensive, evidence on the incidence and impacts of violence in Thailand, the Philippines, and Indonesia, each of which has experienced subnational conflicts along with other types of subnational violence. Drawing on the three systems’ data, the paper provides evidence on: where such violence is occurring; the forms and types it is taking; the impacts it has; and how it has evolved over time.
Second, the paper demonstrates the utility of a VIMS. It contrasts incident and fatality figures with those from other datasets, showing the extent to which the latter seriously under-report violence and its impacts. It also shows how datasets that record a wide range of kinds of violence allow for a deeper understanding of how violence manifests and changes over time. It demonstrates how collecting information on a wide range of variables for each incident can generate evidence that allows for more effective policy responses. And it shows how data from different VIMSs can be compared to provide deeper insights.
Third, the paper provides preliminary evidence on the drivers of violence in regions within the three countries, drawing on new analytic work. Working with highly disaggregated data in a country allows for much cleaner and more comprehensive assessments of the factors that may lead to violence than is possible with cross-national datasets. The paper thus highlights how developing single-country violent incidents monitoring systems, which generate comparable data, can push forward the frontier of conflict and violence research in Southeast Asia, and beyond.
The paper proceeds as follows:
• Section 2 introduces the three violent incidents monitoring systems (VIMSs), whose data are used in the paper;
• Section 3 makes the case for VIMSs, comparing the data they produce with those from cross-country datasets;
• Section 4 outlines data from the three systems, showing how they can be used to provide a deeper understanding of violence than was previously possible;
• Section 5 explores the drivers of different forms of violence, drawing on new econometric analyses;
• Section 6 draws conclusions.

10
2. VIOLENT INCIDENTS MONITORING SYSTEMS IN INDONESIA, THE PHILIPPINES, AND THAILAND
Now widely regarded as a model of successful democratic transition, Indonesia was on the brink of disaster 15 years ago. In the wake of a devas-tating financial crisis and the end of President Suharto’s 32 years of authoritarian rule, violence flared up across the archipelago. Large-scale communal violence in Kalimantan, Sulawesi, and Maluku, and civil war in Aceh and East Timor, claimed an estimated 20,000 lives between 1998 and 2003. However, by 2005, Indonesia had managed to bring an end to the troubles of the transition period. This was achieved via fast-paced reform and peace agreements. Indonesia is now widely acknowledged by the international community as a model of stability.7 Nevertheless, the rapid pace of reforms has also created room for new forms of social conflict to emerge, such as conflicts over land and natural resources. An increase in religious intolerance and a resurgence of the homegrown terrorist threat have also been a concern.
Two Indonesian regions receive particular attention in this paper (see Section 4). The first is Aceh province. Aceh is one of the best examples in Asia of a long-running violent conflict transforming into a stable, enduring peace. From 1976 to 2005, civil war between the
This paper draws on data from three violent incidents monitoring systems (VIMSs): the Bangsamoro Conflict Monitoring System (BCMS) in the Philippines; the Deep South Incident Dataset (DSID) in Thailand; and the National Violence Monitoring System (NVMS) in Indonesia.6
2.1 NATIONAL VIOLENCE MONITORING SYSTEM (NVMS), INDONESIA
secessionist Free Aceh Movement (GAM) and the Indonesian government resulted in at least 15,000 deaths and severe economic and social impacts.8 Following the December 2004 tsunami that devastated Aceh’s shores, killing over 167,000, a peace agreement was signed. Unlike previous peace accords, the Helsinki Memorandum of Understanding has endured. The former rebel group has moved into a governing role and few predict that large-scale violence will emerge in the near future.
The second region is Papua. It is currently the most underdeveloped and violent region of Indonesia. The two provinces of Papua and West Papua, generally referred to collectively as Papua, are the most resource-rich areas of Indonesia, yet on the Human Development Index, they rank the worst and third worst of Indonesia’s 34 provinces. Papua province is by far the most violent in the country, with a homicide rate five times the national average. This is partly, but not entirely, attributable to the presence of a low-intensity separatist insurgency, involving the Free Papua Movement (OPM).
The National Violence Monitoring System (NVMS) is a continuation and expansion of several violence monitoring projects designed

11
and implemented by the World Bank in Indonesia from 2002 to the present. Started in 2012, the NVMS was executed by the World Bank on behalf of the Coordinating Ministry for People’s Welfare. The NVMS database collects information on the incidence and impacts of social conflict, with a view to informing relevant government social development programming. The NVMS’s geographic scope has expanded over time, achieving nationwide coverage (34 provinces) in 2014. The project has involved a partnership with The Habibie Center, an Indonesian think tank, to produce analyses based on the data.
2.2 BANGSAMORO CONFLICT MONITORING SYSTEM (BCMS), THE PHILIPPINES Central and Western Mindanao, the two Mus-lim-majority areas of the Southern Philippines,9 have suffered from a violent conflict that has pitted successive separatist insurgencies against the state, and claimed more than 150,000 lives over the past four decades.10 A degree of self-rule was first granted to some predominantly Muslim areas in 1989, with the creation of the Autono-mous Region in Muslim Mindanao (ARMM). In 1996, a peace agreement was signed between the government and the Moro National Liberation Front (MNLF).11
While the 1996 agreement largely ended conflict between the Philippine government and the MNLF,12 several splinters broke away such as the Abu Sayyaf Group (operating primarily in the is-land provinces of Basilan and Sulu) and the Moro Islamic Liberation Front (MILF), based in Central Mindanao.13 Vertical conflict has therefore persist-ed. For example, large-scale violence between the MILF and the Philippine military in 2000, 2003, and 2008-2009 displaced hundreds of thousands. These clashes occurred despite a ceasefire signed in 1997, which has otherwise helped to keep the conflict low in intensity. The 1996 agreement with the MNLF also failed to improve governance in ARMM, and large portions of Central and West-ern Mindanao remain beyond the control of the Philippine state. Forms of horizontal conflict—such as clan conflict, known as rido, killings of po-litical rivals, and criminally motivated violence—have proliferated and are crucial to understanding
2. VIOLENT INCIDENTS MONITORING SYSTEMS IN INDONESIA, THE PHILIPPINES, AND THAILAND
overall violence dynamics in these areas of the Southern Philippines.
Prospects for peace improved in 2010 with the election of President Benigno Aquino III, who reinvigorated the protracted negotiations with the MILF on new autonomy arrangements. The talks led to the signing of the Framework Agreement on the Bangsamoro (FAB) in October 2012 and the Comprehensive Agreement on the Bangsam-oro (CAB) in March 2014.14 The agreements call for the abolition of ARMM and the creation of a new autonomous region named the Bangsamoro, with provisions on power and wealth sharing. President Aquino, however, was unable to set up the Bangsamoro before his term ended in 2016, and Mindanao’s transition to peace remains incomplete.
The Bangsamoro Conflict Monitoring System (BCMS) was established by the World Bank in 2010, and further developed by International Alert, to gather data on the incidence and impacts of conflict in ARMM and surrounding provinces. International Alert implements the project, in partnership with three Mindanao-based universi-ties. The BCMS data used in this paper cover the period 2011-2014.
2.3 DEEP SOUTH INCIDENT DATASET (DSID), THAILAND’S DEEP SOUTH The conflict between insurgents from the Ma-lay-Muslim minority against the central state in Thailand’s Deep South is one of the longest-run-ning subnational conflicts in Asia.15 Violent unrest has ebbed and flowed over several periods since 1902. The current insurgency in the three provinc-es of Pattani, Narathiwat, and Yala, as well as parts of neighboring Songkla, gained momentum from the late 1990s, with the scale and intensity of inci-dents increasing dramatically from 2004 onwards. An estimated 5,000 people were killed between 2004 and 2014.
The conflict in Thailand’s Deep South is primarily a separatist insurgency against the Thai state.16 The main separatist movement, the BRN (Barisan Revolusi Nasional or the National Revolutionary Front), is led by a coalition, primarily based in Malaysia, with militant cells spread out across

12
the three southernmost provinces. It is an identi-ty-based movement, with a support base among the Malay-Muslim population in the region.17 A history of injustice and neglect under successive Thai governments provides fertile ground for recruitment.
A first attempt at peace talks with insurgent groups in 2013 failed. While the National Council for Peace and Order (NCOP), the military regime in power since the May 2014 coup, has been involved in continuing talks with insurgent-af-filiated groups, it has also ruled out any form of ‘self-rule’ for the southern provinces. During the second round of peace dialogue, the separatist
The three systems vary in their geographic scope, time periods covered, data sources, and criteria for incidents to be included (Table 2.1). However, there are commonalities:
• Each uses local data sources, helping to ensure accuracy, and that smaller-scale incidents of violence are captured;
• Each records information on a wide range of variables for each incident;
• Each records information at a highly disag-gregated level, allowing for highly granular analysis; and
• Each records a wide range of forms of violence, allowing for identification of how violence evolves over time, and how different forms are interrelated.
2.4 KEY ELEMENTS OF THE THREE VIMSs
side has been represented by MARA Patani, an umbrella body that includes several smaller orga-nizations, in addition to the BRN. In contrast to the other subnational conflict areas in the region, Thailand’s Deep South has seen little interna-tional attention and very low levels of aid.
The Deep South Incident Dataset (DSID) project began in 2004. It is hosted by Prince of Songkla University in Pattani, but is run independently, with its own sources of funding. Deep South Watch manages the DSID, which records insur-gency-related incidents. Since 2014, the scope of monitoring has been expanded to include any violent incident reported by the project’s sources.
As discussed in the next section, these defining elements offer significant advantages when it comes to understanding subnational violence. Commonalities across the datasets also mean that data can be compared across the three VIMSs, as demonstrated in Section 4.

13
Table
2.1:
Key e
lemen
ts of
the th
ree s
ystem
s
BCMS
DSID
NVMS
Objec
tive
“To
syst
emat
ical
ly m
onito
r and
ana
lyze
vi
olen
t con
flict
with
in th
e Ba
ngsa
mor
o an
d ad
join
ing
area
s to
info
rm p
olic
y, de
velo
pmen
t and
pea
cebu
ildin
g ap
proa
ches
and
str
ateg
y” [S
ourc
e: B
CM
S pr
ojec
t doc
umen
tatio
n, In
tern
atio
nal
Ale
rt]
a) T
o ra
ise
publ
ic a
war
enes
s of
the
confl
ict
in T
haila
nd’s
Dee
p So
uth;
and
, b) t
o im
prov
e ac
adem
ic re
sear
ch o
n th
e co
nflic
t, w
ith a
vie
w to
influ
enci
ng p
olic
y re
spon
se
and
supp
ortin
g pe
ace
talk
s [S
ourc
e:
inte
rvie
w w
ith th
e D
SW te
am, T
he A
sia
Foun
datio
n]
“To
stre
ngth
en th
e ca
paci
ty o
f Ind
ones
ia’s
inst
itutio
ns to
det
ect a
nd re
spon
d to
so
cial
con
flict
thro
ugh
data
and
ana
lysi
s”
[Sou
rce:
pro
ject
doc
umen
tatio
n, W
orld
Ba
nk]
Stud
y are
a5
ARM
M p
rovi
nces
of M
agui
ndan
ao (i
ncl.
Cot
abat
o C
ity),
Lana
o Su
r, Ba
sila
n (in
cl.
Isab
ela
City
), Su
lu, a
nd T
awi-T
awi18
5 so
uthe
rn p
rovi
nces
of P
atta
ni, Y
ala,
N
arat
hiw
at, S
ongk
la, a
nd S
atun
The
NM
VS’
s ge
ogra
phic
cov
erag
e ex
pand
ed o
ver t
ime
from
an
initi
al s
ampl
e of
9 p
rovi
nces
to fu
ll na
tionw
ide
cove
rage
(3
4 pr
ovin
ces)
in 2
014
Time p
eriod
cove
red b
y the
datas
et20
11-p
rese
nt20
04-p
rese
nt19
98-M
arch
201
5
Crite
ria fo
r inc
ident
inclus
ion
Inci
dent
s of
vio
lent
con
flict
, defi
ned
as
“inc
iden
ts w
here
two
or m
ore
part
ies
use
viol
ence
to s
ettle
mis
unde
rsta
ndin
gs a
nd
grie
vanc
es, a
nd/o
r def
end
and
expa
nd
thei
r ind
ivid
ual o
r col
lect
ive
inte
rest
s (e
.g.
soci
al, e
cono
mic
, pol
itica
l res
ourc
es a
nd
pow
er e
tc.)”
Any
con
flict
inci
dent
, defi
ned
as “a
co
nflic
t bet
wee
n in
divi
dual
s or
gro
ups
with
con
cret
e eff
ects
suc
h as
dea
th, i
njur
y, de
stru
ctio
n of
pro
pert
y or
the
inte
nt to
ca
use
such
effe
cts.”
DSI
D a
lso
mon
itors
a ra
nge
of n
on-v
iole
nt
even
ts re
late
d to
the
insu
rgen
cy in
the
Dee
p So
uth,
suc
h as
pro
test
s or
flag
-ra
isin
g in
cide
nts
Any
vio
lent
inci
dent
fitti
ng th
e fo
llow
ing
defin
ition
: “ac
tion
perp
etra
ted
cons
ciou
sly
and
inte
ntio
nally
by
eith
er a
n in
divi
dual
or
a gr
oup
that
cau
ses
or m
ay c
ause
phy
sica
l da
mag
e to
per
sons
or p
rope
rty”
Act
ions
rest
rictin
g th
e ph
ysic
al fr
eedo
m o
f in
divi
dual
s or
gro
ups,
such
as
abdu
ctio
ns,
are
cons
ider
ed v
iole
nt e
ven
if no
har
m is
do
ne to
vic
tims
Data
sour
ces
Regi
onal
and
pro
vinc
ial p
olic
e in
cide
nt
repo
rts
15 s
elec
ted
natio
nal a
nd re
gion
al p
rint
med
ia s
ourc
es
Mili
tary
repo
rts
Polic
e re
port
sN
ews
cent
erPr
ovin
cial
gov
ernm
ent c
all c
ente
r
115
subn
atio
nal n
ewsp
aper
s an
d 2
natio
nal
pape
rsA
cade
mic
pap
ers
and
NG
O re
port
s
Total
# en
tries
in th
e data
set
5,97
9 (2
011-
2014
)17
,738
(200
4-20
15)
237,8
85 (1
998-
Mar
ch 2
015)
Webs
iteht
tp://
bcm
s-ph
ilipp
ines
.info
w
ww
.dee
psou
thw
atch
.org
The
data
set,
and
met
hodo
logi
cal
docu
men
tatio
n, a
re a
cces
sibl
e vi
a th
e W
orld
Ban
k’s
Mic
roda
ta L
ibra
ry:
http
://m
icro
data
.wor
ldba
nk.o
rg. I
n th
e se
arch
fiel
d, u
se th
e ke
ywor
ds “n
atio
nal
viol
ence
mon
itorin
g”

14
3. WHY DEVELOP VIOLENT INCIDENTS MONITORING SYSTEMS?
Subnational violence, of multiple forms, is perva-sive across Southeast Asia. Many countries in the region have seen large-scale, destructive armed conflicts. Because these have usually taken place on the peripheries of relatively stable states, they have received relatively little attention. Other forms of violence of varying scales also occur across the region.
Subnational conflicts
Table 3.1 lists the subnational conflicts that have occurred in Southeast Asia in the past two decades. Each has involved a minority ethnic group, concentrated along international borders in peripheral areas of states seeking greater autonomy or independence. Six countries (half of those in the region) have experienced such violent conflicts in the past two decades. With the exceptions of Myanmar and Timor, such conflicts have directly affected small shares of the national population: the population of Aceh, for example, accounts for less than 2% of Indonesia’s head-count, and the share of the national population is less than 3% for Thailand’s Deep South, and around 5% of the Philippines for the Bangsamoro.19
Some of these conflicts have ended (for example, in Aceh and Bougainville) and in others signif-icant steps towards peace have been made (the Bangsamoro and many of the subnational con-flicts in Myanmar). Yet many continue. Indeed, subnational conflicts in Southeast Asia appear to be particularly enduring. Globally, subnational conflicts have had an average duration of 16.8 years; in Southeast Asia, they have lasted an aver-age of 33.3 years.20 Furthermore, Southeast Asian subnational conflicts are prone to relapse after peaceful settlements have been found. Aceh, for example, has seen an enduring cycle of insurgen-cies arising, ending due to the cooptation of rebel leaders, only for violence to remerge 30 or so years later.21
Other forms of violence
Beyond separatist struggles, other forms of con-flict and violence are present across Southeast Asia. Reliable systematic data on such forms is missing or patchy. Yet a cursory look reveals that vi-olence is prevalent and, in some cases, is on the rise.
Inter-communal clashes and riots occur in a number of countries. In Indonesia, five provinces saw significant communal violence around the turn of the current century. 24 In Central Sulawesi
Violence, of multiple forms, is present across Southeast Asia. Because existing global violence datasets focus on extended organized violence or political violence, they provide a useful but partial picture of violence dynamics in Southeast Asia. Local violent incidents monitoring systems (VIMSs) cast a broader data collection net, and their ability to tap subnational source materials in local languages allow them to capture violence more comprehensively. This section compares data from the three VIMSs with that from prominent global datasets to demonstrate the value of VIMSs for developing more effective policy responses.
3.1 VIOLENCE IN SOUTHEAST ASIA

15
and Maluku, the cleavage was primarily a religious one; in North Maluku, ethnic violence evolved into inter-confessional battles. Violence in each place started with small-scale clashes between community groups, but then escalated into larger armed confrontations. Extended communal violence also broke out in Indonesian Borneo. For around three weeks in late 1996, ethnic Dayaks in West Kalimantan attacked the migrant Madurese community; a second round of violence two years later set ethnic Malays against the Madurese. In February 2001, Dayaks in Central Kalimantan attacked the Madurese over the course of a few weeks, resulting in 90% of the Madurese population fleeing the province. In total, an estimated 8,701 people died from these conflicts. While these large-scale conflicts have ended, clashes between different ethnic and religious groups continue to occur frequently.
Table 3.1: Subnational conflicts in Southeast Asia22
Conflict area Ethnic group Progress towards peace23 Duration (years)
Myanmar
Kachin state Kachins Little 55
Karen (Kayin) state Karens Moderate 68
Karenni (Kayah) state Karenni Moderate 68
Mon state Mons Moderate 68
Rakhine state Arakan Moderate 68
Shan state Shans Little/moderate 64
Chin state Zomis (Chin) Moderate 28
Indonesia/Timor
Aceh Acehnese High 52
East Timor (until 1999) Timorese High 24
Papua Papuans Little 55
Papua New Guinea
Bougainville Bougainvilleans High 7
Philippines
Central Mindanao, Sulu archipelago (the Bangsamoro) Moros Moderate 47
Thailand
Deep South Malay-Muslims Little 114
Communal violence involving Buddhists and Muslims in Myanmar has become a major domestic and international concern in the last few years. In 2012, the age-old Buddhist discrimination against Muslims turned into violent riots across Rakhine state where one-third of the population are Muslim ethnic Rohingya. Three waves of violent clashes in June, August, and October of 2012 left 114 people dead and over 110,000 people displaced,25 most of whom were Rohingya. With the rise of the Buddhist chauvinist movement, 969, anti-Muslim riots occurred in other parts of the country, too. In 2013, a state of emergency and curfews were announced in six states/regions where there were 21 violent attacks on Muslims.26 An estimated 103 people were killed, with 78 injured, and almost 16,000 people displaced. In 2014, more communal violence occurred. Persecution of Muslims, and ongoing religious tensions in

16
Rakhine, forced tens of thousands of Rohingya to flee the country in 2015, raising concern in the region and beyond.
Local conflicts over land are also common and have the potential to escalate and mesh with other conflicts. Confiscation and expropriation of land for economic development projects have led to tension and violent conflicts across Southeast Asia. In Cambodia, land conflicts have affected more than half a million people in the last 14 years.27 Protests over land grabs and environmen-tal impacts from public and private projects have often occurred in Thailand, too, leading at times to clashes between local protesters and private inves-tors, 28 and sometimes with the police force.29 In the Philippines, local land conflicts have fed into major armed clashes, with the police, military, and the Moro Islamic Liberation Front all getting involved.
Electoral and other forms of political violence have been common as well in some countries. In countries such as Thailand and Cambodia, demon-strations at times escalate into violent clashes and brutal crackdowns by government. In Thailand, Cambodia, and Indonesia, during as well as outside of election periods, local politicians, canvassers, and election officers are threatened and even murdered. In November 2009, in the Southern Philippines, with the complicity of state security forces, 57 people were killed when the ruling politician of Maguindan-ao province sought to prevent his political rival from registering his candidacy for provincial governor.30
Gender-based violence is common across Southeast Asia, with physical violence against female partners viewed acceptable in many families. In Timor-Les-te, nearly 40% of women over the age of 15 have experienced violence from their husband or intimate partner.31 Of all married women in Thailand, 38% have been physically abused by their husband.32 In some areas, such as Palaung in Myanmar, as many as 90% of women suffer from domestic violence.33
Criminal homicide rates in Southeast Asia are higher than in any other region of Asia.34 Urban areas are particularly affected. The United Nations Office on Drugs and Crime (UNODC) reports, for example, that deaths per capita in Dili, the capital of Timor-Leste, are three times higher than the national rate.35
3.2 EXISTING CROSS-COUNTRY DATASETS
Two prominent global violence datasets contain information on violence that can be geographi-cally disaggregated:36 the UCDP/PRIO Georefer-enced Events Dataset (hereafter, the UCDP-GED) and the Armed Conflict Location and Event Data Project (ACLED). These datasets are the most commonly used by policymakers. A key difference between these systems and the VIMSs in Indo-nesia, Thailand, and the Philippines, is that the latter are designed to capture all events involving physical violence, while the global systems are more selective.
The UCDP-GED contains information on three categories of armed conflict: (i) state-based con-flict, defined as either armed conflicts between two governments or a government and a rebel group; (ii) non-state conflict, defined as armed conflict between two organized actors who are not a state; and (iii) one-sided violence, where an organized actor (a government or non-state group) kills unarmed civilians.37 It is built upon the UCDP/PRIO Armed Conflict Dataset, where the unit of analysis is the conflict year – that is, each entry in the database records the number of fatalities for a given conflict in a given year. The UCDP-GED further breaks down these units to provide information on each ‘event’ – a particular incident in a particular locality – thus allowing for analysis of subnational variation over time and space.38 The dataset contains 103,665 events. It covers Asia, Africa, and the Middle East (exclud-ing Syria) from 1989 to 2014, and the entirety of the Americas and Europe from 2005 to 2014.39
The Armed Conflict Location and Event Data Project (ACLED) monitors political violence, with a focus on civil and communal conflicts, violence against civilians, remote violence, rioting, and protesting.40 Each event is coded for a date and lo-cation. In total, 60 countries in Africa and Asia are covered, with Asia data currently available since the beginning of 2015.41 As of October 2015, the global dataset contained around 100,000 events. Currently, Cambodia, Lao PDR, Myanmar, Thai-land, and Vietnam are included from Southeast Asia.

17
Other datasets record a wider range of violence than do the UCDP-GED or ACLED. The Geneva Declaration Secretariat Global Burden of Armed Violence dataset draws on a wide range of sources from criminal justice and public health systems, alongside secondary data from regional groups (e.g. Organization of American States and Eu-rostat) and global bodies (e.g. the UNODC and the World Health Organization, WHO), as well as local violence observatories.42 However, data is only disaggregated into four violence ‘types’: direct conflict deaths, intentional homicides, un-intentional homicides, and legal interventions.43 Furthermore, data are usually only disaggregated at the country level. While the database draws on some violent events datasets, it does not contain systematic information on each incident. This undermines the utility of the data as a means for designing policies and programs at the country and subnational levels.
3.3 UNDER-REPORTING OF LEVELS AND IMPACTS OF VIOLENCE This section provides a comparative analysis of the data captured by global datasets and VIMSs. First, it compares data from the UCDP-GED and Indonesia’s National Violence Monitoring System (NVMS) for Aceh and other provinces in Indone-sia. Second, it compares UCDP-GED and ACLED data with the Deep South Incident Dataset (DSID) for Thailand’s Deep South. Finally, it compares data from the UCDP-GED and the Bangsamoro Conflict Monitoring System (BCMS) in the Phil-ippines.
As discussed above, these datasets have different purposes, and the range of events they monitor is not the same: UCDP-GED and ACLED focus, respectively, on extended organized violence and political violence, while VIMSs seek to capture all events involving physical violence. However, even after the dataset comparisons are adjusted to focus only on the categories of violence that are relevant to UCDP-GED or ACLED, and to account for other differences in design and methodology, our analysis finds that VIMSs consistently capture a significantly higher count of events
and fatalities. This points to a key comparative strength of the VIMSs: their capacity to integrate subnational sources in local language, whereas global systems rely mainly on international or national-level source materials (such as English language national newspapers).
In each comparison, we also discuss absolute differences in the total numbers of events and fatalities reported by the systems for each geographic area. These naturally show a much wider data gap between global datasets, which are more selective in the types of events they record, and VIMSs, which seek to capture all violence. While the UCDP-GED and ACLED’s choice to focus on specific subsets of violence is entirely legitimate, this analysis illustrates the share of the overall violence that is left out by global datasets. It demonstrates the value of more inclusive monitoring for policy-makers interested in acquiring a comprehensive picture of violence dynamics in the country or region where they operate.
Aceh: comparing the UCDP-GED and NVMS
Indonesia provides the most solid basis for a comparison of the UCDP-GED data with VIMSs, as the UCDP-GED and the NVMS both cover an extended period of time running from 1998 to 2015.44 We focus first on the province of Aceh, which saw extensive violence from a separatist conflict that pitted the Free Aceh Movement (GAM) against the state until the signing of a peace accord in 2005.
Comparing data on armed conflict. After filter-ing the NVMS data to only count events match-ing the UCDP-GED inclusion criteria, we find that NVMS still reports a much higher number of incidents and fatalities. UCDP-GED picks up only 30% of incidents and 46% of deaths recorded in the NVMS for Aceh over the entire time period (Figure 3.1).

18
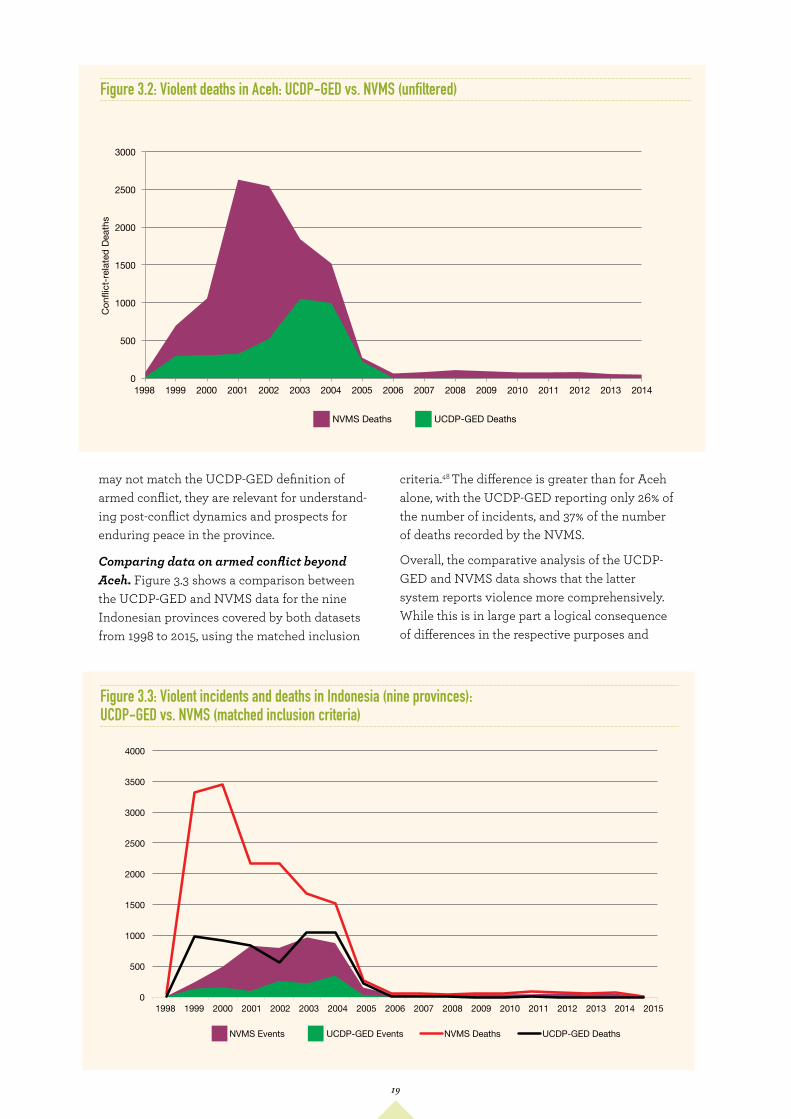
Comparing all violence data. If we compare UCDP-GED data for Aceh with the unfiltered NVMS dataset, the gap widens (Figure 3.2). For the 1998-2005 conflict period, the UCDP-GED records 4,006 conflict deaths in Aceh, compared to the 10,640 in the NVMS dataset.
As explained above, this is because the two data-sets apply different lenses to observe violence: UCDP-GED only reports on deadly occurrences of organized armed conflict, deliberately leaving aside other violence types. However, Figure 3.2 shows that this selective approach affects our understanding of the trajectory of violence in war-time Aceh. For example, the UCDP-GED over-looks the initial upsurge in violence in the prov-ince. In 1998, the UCDP-GED records only nine deaths—12% of the total captured by the NVMS. In 2003-2005, the Aceh war received more world-wide attention after peace talks started (and then collapsed) in 2003, and after the Indian Ocean tsunami of late 2004. For those two years, a larger share of deaths is captured by the UCDP-GED. Yet, in the post-conflict period from 2006, deaths in Aceh almost disappear from the UCDP-GED, with only five recorded (in 2008). In contrast, the NVMS records 678 deaths in Aceh between 2006 and 2014. While these unreported deadly events
In order to match the two datasets, we took into account all of the key criteria used by the UCDP-GED to define what constitutes an eligi-ble armed conflict event, and applied the same conditions to the NVMS dataset. UCDP-GED only reports incidents between the government and a rebel group, one-sided violence by the gov-ernment or a rebel group against civilians, and conflict between two organized, non-state groups. Other forms of non-organized violence are not included.45 The dataset also requires events to result in at least one death, and involve the use of weapons (any kind of weapon, including sharp and blunt weapons). Therefore, we excluded from the NVMS all incidents that did not result in a death, where no weapon was used, and where perpetrators did not belong to state or non-state organized armed groups.46
In some years, the UCDP-GED under-reporting is considerable. In 2001, for example, the UCDP-GED records 321 deaths compared to 1,803 using the filtered NVMS data. Filtering the NVMS data reduces the number of deaths record-ed in the post-conflict years from 678 to 102.47
However, this still vastly exceeds the five deaths recorded by the UCDP-GED.
0
500
1000
1500
2000
2500
1998 1999 2000 2001 2002 2003 2004 2005 2006 2007 2008 2009 2010 2011 2012 2013 2014
NVMS Events UCDP-GED Events NVMS Deaths UCDP-GED Deaths
Figure 3.1: Violent incidents and deaths in Aceh: UCDP-GED vs. NVMS (matched inclusion criteria)
19
may not match the UCDP-GED definition of armed conflict, they are relevant for understand-ing post-conflict dynamics and prospects for enduring peace in the province.
Comparing data on armed conflict beyond Aceh. Figure 3.3 shows a comparison between the UCDP-GED and NVMS data for the nine Indonesian provinces covered by both datasets from 1998 to 2015, using the matched inclusion
criteria.48 The difference is greater than for Aceh alone, with the UCDP-GED reporting only 26% of the number of incidents, and 37% of the number of deaths recorded by the NVMS.
Overall, the comparative analysis of the UCDP-GED and NVMS data shows that the latter system reports violence more comprehensively. While this is in large part a logical consequence of differences in the respective purposes and
0
500
1000
1500
2000
2500
3000
1998 1999 2000 2001 2002 2003 2004 2005 2006 2007 2008 2009 2010 2011 2012 2013 2014
Conf
lict-r
elat
ed D
eath
s
NVMS Deaths UCDP-GED Deaths
0
500
1000
1500
2000
2500
3000
3500
4000
1998 1999 2000 2001 2002 2003 2004 2005 2006 2007 2008 2009 2010 2011 2012 2013 2014 2015
NVMS Events UCDP-GED Events NVMS Deaths UCDP-GED Deaths
Figure 3.2: Violent deaths in Aceh: UCDP-GED vs. NVMS (unfiltered)
Figure 3.3: Violent incidents and deaths in Indonesia (nine provinces): UCDP-GED vs. NVMS (matched inclusion criteria)

20
designs of these systems, these factors do not explain the entire discrepancy. Once the comparison is adjusted to apply the same inclusion criteria to both systems, NVMS still reports a significantly larger share of the violence. This is likely attributable to the information sources they use. The UCDP-GED relies mainly on global newswire reporting. In contrast, NVMS uses over a hundred local newspapers operating at the province or district level across Indonesia.
Thailand’s Deep South: comparing UCDP-GED with DSID
Violence and its impacts in Thailand’s Deep South are also under-reported in the UCDP-GED dataset when compared to the DSID.
Comparing data on armed conflict. Once again, we excluded from the comparison all DSID events that did not match the UCDP-GED definition of an armed conflict event. To do this, we proceeded incident by incident, with the assistance of the DSID team. We were only able to do this for a single year, 2014. The analysis found that the DSID reported 2.7 times as many deaths as UCDP-GED (270 instead of 100).
Table 3.2 breaks down the sources of discrepancy between the two datasets. Before filtering, DSID reported 1,092 incidents (compared to UCDP’s 71), and nearly 3.5 times as many deaths. Differences in inclusion criteria explain the largest share of the discrepancy. Almost 80% of the 1,021 DSID incidents not reported by the UCDP-GED were non-fatal incidents; 170 more led to at least
one death but did not match other UCDP-GED criteria. Once these events eliminated from the comparison, the remaining difference is a fair indication of the two system’s respective performance at capturing the same range of violent incidents. DSID still captures almost twice as many events, and nearly three times as many deaths. Once again, it is fair to assume that this difference is attributable to DSID’s access to local data sources. These include military reports from ISOC-Region IV and police reports. Other data sources include a government call center in Yala, and news publications in both Thai and English
Comparing all violence data. Figure 3.4 shows differences in absolute numbers of events and deaths reported by UCDP-GED and DSID from 2008 to 2014, not applying the matched inclusion criteria. UCDP-GED typically records only about half as many deaths as the DSID. In 2014, this plunged to 29%: whereas UCDP-GED records 100 deaths (slightly more than ACLED), DSID records 345. The gap in the number of events recorded is even greater; in 2012, for example, UCDP-GED records 139 incidents, compared to 1,850 in DSID.
Thailand’s Deep South: comparing ACLED with DSID
Of the three countries that are the focus of this paper, ACLED data are only available for Thai-land, and currently only for 2015. A comparison between the ACLED and DSID data for that year shows that the latter dataset outperforms the former in capturing political violence.49
Table 3.2: Violent incidents and deaths in Thailand’s Deep South, 2014: UCDP-GED vs. DSID (cause of difference)
YEAR INDICATOR DSID UCDP-GEDDATA
DISCREPANCY
ATTRIBUTABLE TO DEATH > 0
CRITERIA
ATTRIBUTABLE TO EVENT INCLUSION
CRITERIA
ATTRIBUTABLE TO SOURCES
2014 Incidents 1,092 71 1,021 800 170 512014 Deaths 345 100 245 - 75 170

21
Comparing data on political violence. ACLED monitors “political violence”—defined as “the use of force by a group with a political purpose or motivation”.50 “Social” or interpersonal violence is not included.51 In contrast, since 2014, the DSID includes all types of violence except domestic vio-lence.52 Similar to the UCDP-GED/DSID compari-son, we matched 2015 ACLED and DSID data, inci-dent-by-incident, with a view to filter out any DSID event that did not match ACLED criteria. Once adjusted for this and other methodological differenc-es,53 the comparison shows that DSID captures more than twice as many incidents. The gap in fatalities is narrower, with ACLED capturing 74% of the violent deaths recorded by DSID (Figure 3.5).
0
100
200
300
400
500
600Vi
olen
t Dea
ths
DSID Deaths UCDP-GED Deaths
2008 2009 2010 2011 2012 2013 2014
Figure 3.5: Violent incidents and deaths in Thailand’s Deep South 2015: ACLED vs. DSID (matched inclusion criteria)
Figure 3.4: Violent deaths in Thailand’s Deep South: UCDP-GED vs. DSID (unfiltered)
0
75
150
225
300
Incidents Deaths
DSID ACLED
The fact that ACLED is comparatively better at capturing fatalities than incidents is further evidence that the data discrepancy is likely attributable to sources. The international and national news sources which ACLED relies on for information on the Deep South are more likely to report larger incidents leading to deaths. Conversely, they tend to neglect non-lethal incidents. On the other hand, DSID’s use of local military and police reports, Thai-language media reports, and other information sources, pro-vides a better coverage of local incidents, including the type of political violence that ACLED monitors.

22
Figure 3.6: Violent incidents and deaths in the Bangsamoro: UCDP-GED vs. BCMS (matched inclusion criteria)
0
100
200
300
400
500
600
700
2011 2012 2013 2014
BCMS Events
UCDP-GED Events
UCDP-GED Deaths
BCMS Deaths
Table 3.3: Violent incidents and deaths in Thailand’s Deep South, 2014: ACLED vs. DSID (cause of difference)
Comparing all violence data. When comparing ACLED data with the unfiltered DSID dataset, ACLED only includes 16% of all events reported by the DSID, and 27% of deaths.
Table 3.3 summarizes key sources of differences between the two datasets. The largest share of the overall discrepancy results from differences in selection criteria and counting methods for same-day events. It is fair to assume that DSID’s access to local sources explains the major part of the remaining difference.
The Bangsamoro: comparing the UCDP-GED and BCMS
Finally, we compare UCDP-GED and BCMS data for the Bangsamoro area in the Philippines during the four years for which BCMS data is available (2011-2014).
Comparing data on armed conflict. After filtering the BCMS dataset to replicate UCDP-GED event inclusion criteria,54 the BCMS reports three times as many events, and 2.5 as many deaths (1,765 deaths instead of 704). In 2011, the BCMS reports 3.5 as many deaths (526 instead of 148).
Comparing all violence data. Comparing all deaths reported by both systems before adjusting for differences in selection criteria, the UCDP-GED only records between 15% (2011) and 22% (2014) of all deaths.
Indicator DSID ACLED Data discrepancyAttributable to different
inclusion criteria
Attributable to counting methods for same-day
events
Attributable to sources
Incidents 938 150 788 590 60 138Deaths 314 85 229 203 8 18

23
The differences in the incidents and deaths reported in the global datasets and the three VIMS cannot be explained only by the different criteria used for the inclusion of violent incidents. Even when VIMSs’ data are filtered, they consistently record far higher levels of violence than do the global datasets.
A key reason for under-reporting in ACLED and the UCDP-GED is the data sources they use. Both the UCDP-GED and ACLED use data sources far removed from the places they are monitoring. The former uses three sets of sources: (i) global newswire reports; (ii) global monitoring of local news by the British Broadcasting Corporation (BBC); and (iii) secondary sources such as local media, non-government organization (NGO), and international non-government organization (INGO) reports, books, etc. In practice, 60% of events are based on global newswire reporting.55 Very few events are based on local reporting.56 In Thailand, ACLED uses national English language newspapers but no other domestic sources.57
Local news sources
Such sources tend not to report incidents of violence that do not result in multiple deaths. International news sources tend only to report incidents that are of interest to the global public, which excludes vast amounts of violence that occurs. Likewise, even national sources tend not to report incidents that do not have national political significance.
This issue is evident if we look at a number of efforts to ascertain the incidence of violence in Indonesia, using data sources at different levels. The United Nations Support Facility for Indonesian Recovery (UNSFIR) compiled an initial database of violence in 2002, using two national-level news sources. However, this effort missed a vast amount of the group violence that occurred. In 1990, 1991, 1992, and 1994, for example, the data sources picked up no incidents of violence, anywhere in the archipelago.58 This led the researchers to start again with a new database (UNSFIR-2) that used provincial news sources.59
Furthermore, even provincial level sources significantly under-report the incidence of violence. One study compared death tolls from UNSFIR-2 with those from a violence dataset using sub-provincial papers for twelve districts in two Indonesian provinces for 2001-2003. Employing the same definition used by UNSFIR, it found three times more deaths from collective violence.60
Similar evidence can be found from a recent pilot conducted in Nepal. As part of the preparatory work for the design of a Nepal VIMS, The Asia Foundation gathered a number of different data sources on violence. These sources included a sample of seven major national newspapers (English and Nepali language), along with a selection of district level papers in four districts. The assessment also included an NGO database on human rights violations and abuses (the INSEC dataset), and incident reports published on the police website. It found that local papers added significant value. In the four pilot districts, 79% of incidents captured across all data sources were reported in local newspapers, while only 25% were reported by national papers. One incident out of two in the four districts was reported only by local newspapers, and did not appear in any other source.
Using security force data
The VIMSs for the Philippines and Thailand rely, in large part, on reports from the security forces. Gaining access to such data requires the cultiva-tion of close relationships on the ground. ACLED and the UCDP-GED, as global systems with little footprint in the countries for which they collect data, are not able to build such relationships. As such, this important data source is not available to them. In contrast, the Philippine and Thai VIMSs are run by local groups who operate on the ground. This allows them to access these import-ant data sources.
3.4 THE IMPORTANCE OF USING LOCAL SOURCES

24
The focus of global datasets on specific subsets of violence is entirely legitimate, and a function of their broad geographic coverage. VIMSs can afford to monitor a broader range of incidents because of their narrower focus on a single country or subnational region. However, the advantages of using a wider definition of violence, for researchers and policy-makers, must also be given consideration. First, it allows users to ascertain the true human security impacts of violence in a given locale; second, it fits better with recent conceptions of how violence in civil war contexts occurs; and, third, it allows for a better understanding of how violence evolves over time—something particularly important in post-conflict contexts.
First, using a narrower definition of violence does not allow for an assessment of the true human security impacts of violence. Studies have shown that most deaths from violence do not occur in conflict zones. According to the Geneva Declaration Secretariat, of the 508,000 deaths from armed violence that occurred, on average, across the world each year between 2007
and 2012, 438,000 (86%) occurred outside of war zones.61 Much of this violence is missed by the global violent events datasets.
The UCDP-GED, for example, records 221,035 fatalities from 2007 to 2012, or on average, 36,839 per year. This figure is substantially lower than the Geneva Declaration Secretariat dataset. Forms of violence that do not meet the inclusion criteria for the global violent events datasets are of vital importance for policy makers. This becomes apparent if we compare the UCDP-GED data for Indonesia as a whole, with that recorded by the Indonesia NVMS. As Figure 3.7 shows, focusing only on a limited set of ‘armed conflict’ incidents produces a very partial picture of violence in Indonesia.
Beyond the civil war in Aceh, 1998-2003 saw a number of large-scale, inter-communal conflicts in other provinces, as discussed briefly above. The Uppsala Conflict Data Program has a separate dataset on non-state conflict, covering communal conflict, where none of the parties is the government of a state. For Indonesia, this dataset reports seven communal conflicts between
NVMS Deaths UCDP-GED Deaths
0
500
1,000
1,500
2,000
2,500
3,000
3,500
4,000
4,500
5,000
1998 1999 2000 2001 2002 2003 2004 2005 2006 2007 2008 2009 2010 2011 2012 2013 201 4
Viol
ent
Deat
hs
Figure 3.7: Violent deaths in Indonesia: UCDP-GED vs. NVMS
3.5 THE ADVANTAGES OF USING A WIDE DEFINITION OF VIOLENCE

25
1998 and 2003, leading to 2,101 fatalities.62 This is substantial under-reporting when compared to the 10,910 deaths in riots and group clashes recorded for the same period in the NVMS.
Since 2005, most violence in Indonesia has been more episodic and localized. The UCDP-GED, however, records almost none of this. Since 2006, the UCDP-GED includes only 20 deaths across Indonesia. However, for the same period, the NVMS captures 18,904 deaths. Between 2012 and 2014, the UCDP records no fatalities, while the NVMS records 6,972. Such violence clearly has large cumulative human security impacts. But these are not apparent if the UCDP-GED data are used.
Second, scholars have shown that the conceptual distinction between collective and private violence is erroneous in many sites of civil war, given that armed conflicts transform violence into a “joint process [involving] the collective actors’ quest for power and the local actors’ quest for advantage.”63
What may appear to be local violence (crime, interpersonal clashes over land) is often linked in complicated ways to the broader conflict. Understanding the true impacts of civil wars thus requires also considering violent events that appear to be local in nature. The focus on collective violence, at the expense of smaller-scale incidents of inter-personal violence, likely leads to an underreporting of violent deaths from civil wars.
Third, and finally, the narrow sets of events captured through using a limited definition means that we cannot assess the relationships between different types of violence and larger violent conflicts. A key question—for researchers and policy-makers alike—is how and why small-scale incidents of violence escalate into larger conflagrations. If the former are not included in datasets, it is impossible to answer this. We also know that following even successful peace settlements, violence tends to morph in form, rather than disappear.64 ‘Post-conflict’ violence may take the forms of revenge killings,65 sexual violence,66 violent gang battles,67 or violent crimes.68 Datasets must include such incidents if we are to understand how violence is evolving. The three VIMSs covered in this paper allow for such analyses.
In conclusion, this section has demonstrated the value of VIMSs, in particular for producing a more comprehensive picture of violence dynamics in the countries or regions they cover. Because they collect information on a wider range of violent incidents, and use local sources, VIMSs monitor local violence more systematically than global datasets. This does not mean they are better instruments. But they offer greater precision and analytical versatility within the confines of their study area, as illustrated in the following section.
26
4. PATTERNS OF VIOLENCE IN SUBNATIONAL CONFLICT AREAS
Since the end of the Indochina wars in the 1970s, subnational conflicts (SNCs), where groups take up arms to seek secession or greater autonomy, have been the major form of armed conflict in Southeast Asia. These conflicts, usually found in peripheral regions, far from the capital cities and centers of economic growth, have affected six countries in the region.
The three VIMSs datasets discussed in this paper, allow us to explore in more depth than was previously possible, the nature of violence in half of the affected Southeast Asian countries. This section uses VIMSs data to explore—at the macro and micro levels—patterns, and the human impacts of violence in four SNC areas: Aceh and Papua69 in Indonesia; the Bangsamoro in the Philippines; and Thailand’s Deep South.
The analysis focuses on five dimensions:
• How the impacts and intensity of violence vary across the four SNC areas, and over time within them;
• The ways in which violence manifests within each SNC area;
• How violence evolves over time, both in areas moving towards peaceful consolidation, and areas where armed violence is ongoing;
• The spatial concentration of violence within SNC areas; and
• The differential impacts of violence in SNC areas on men and women.
4.1 THE IMPACTS OF SUBNATIONAL VIOLENCE IN INDONESIA, THE PHILIPPINES, AND THAILAND
Violence and stages of transition
Subnational conflicts vary in their impacts and intensity. They also go through phases where violence intensifies or decreases. Each subnational conflict area can be classified along a continuum of transition from escalated violence to consolidated peace.70
At one end of the spectrum are areas where there is no political transition. In such places, no credible process is underway to facilitate peacemaking and end violence. In fragile transition areas, a process of political transition is unfolding (often embodied in early peace talks) but levels of confidence in it are low. As peace talks take hold, often resulting in an accord, areas move to accelerated transition, with confidence improving and more political space emerging for conflict actors to make concessions. Where peace processes are successful, or sometimes after military victories, areas move to a stage of consolidation.
Figure 4.1 shows where the four SNCs sit within this transition model at various stages. Across the four cases studied, each of the phases is covered.71

27
These stages of transition are reflected in part in how violence incidents and impacts have evolved within each SNC area (Figure 4.2). As can be seen, the peak wartime years in Aceh, a period of no transition, saw the highest number of fatalities of any of the four SNC areas.72 Yet the impacts of violence can be lower even where no transition is in place. Papua, for example, has seen little if any progress towards resolving the conflict. However, it has not seen the same level of organized, lethal violence. Rather, there has been an escalation in the number of incidents over time, but with little corresponding increase in fatalities, and with many incidents related to other types of violence beyond separatism.
Movements along the conflict-to-peace transition can bring reductions in violence, but this is not always the case. In Aceh, the Helsinki peace process—which began in early 2015 with an accord signed in August of that year—was very successful in bringing down both violent incidents and (especially) deaths. In the Bangsamoro, on the other hand, deaths from violence have remained alarmingly high, despite progress in peace talks. In part, this is because violence in the Bangsamoro relates both to separatist insurgency but also to other horizontal tensions such as inter-clan fighting, and there has been less progress in resolving these issues.
In Thailand’s Deep South, both deaths and incidents have remained high, with the latter
high both during periods when peace talks have been ongoing (fragile political transition) and when they have not (no transition). This case illustrates that it may only be at later stages of transition when increased confidence translates into different tactics on the ground from those who were involved in the conflict before. The continuing high levels of violence in the Bangsamoro, for example, show that even entering the accelerated transition phase is not always enough.73
The intensity of violence
Measures of conflict intensity allow us to analyze the severity of violence in relation to population size. In terms of deaths, the peak years of the Aceh conflict saw the highest intensity of any of the four SNCs (Figure 4.3). In 2001, intensity peaked at 67 deaths per 100,000 people. By way of comparison, the average violent death rate in Afghanistan during the period 2007-2012 was 33.5 per 100,000 people.75 Since 2005, after the Helsin-ki peace agreement, deaths in Aceh have plunged.
None of the other three SNC areas has seen the same intensity as wartime Aceh. But deaths in Thailand and the Bagsamoro remain very high, hovering around the rate of 30 deaths per 100,000 people in recent years.76 From 2008 to 2013, Thailand’s Deep South was the highest intensity SNC region in terms of deaths, with the Bang-samoro overtaking it in 2014. Deaths per person have been much lower in Papua, although they
Figure 4.1: Periods of transition for Aceh, Papua, the Bangsamoro, and Thailand’s Deep South
NO POLITICAL TRANSITION• Aceh (1976-2002; 2003-2005)• Thailand’s Deep South (2004-2013; 2014)• Papua (1969-)• Bangsamoro (1960s-1976; 1997-2010)
FRAGILE POLITICAL TRANSITION• Aceh (2002-2003)• Thailand’s Deep South (2013; 2015-)• Bangsamoro (1976-1996; 2011-2014)
ACCELERATED TRANSITION• Bangsamoro (2014-)• Aceh (2005)
CONSOLIDATION
• Aceh (2006-)

28
are significantly higher than in Aceh since the peace accord there. Indeed, the provincial death rate in Papua is the highest in Indonesia, with five violent deaths per 100,000 people, per year, compared to a national average of just over one in 2014. One Indonesian violent death out of 20 happened in Papua province in 2014, despite the province accounting for just 1.2% of Indonesia’s population.
Other measures of intensity present a different picture. In terms of incidents per person, Thai-land’s Deep South has consistently been the most intense SNC, with incident rates in recent years far eclipsing those of even wartime Aceh (or, indeed, the Bangsamoro). Many incidents in Thailand are not deadly but result in injuries and increase the climate of fear. While fatalities per person are relatively low in Papua, incident inten-sity has been at a similar level to Aceh during its conflict period.
The data show the different characteristics of the four SNCs areas. In wartime Aceh, each vio-lent incident was particularly deadly, while the post-conflict period has been relatively peaceful, in terms of both incidents and deaths. In the Phil-ippines, incidents are also likely to be deadly, but are less frequent. In Papua and (to a lesser extent) Thailand’s Deep South, frequent incidents affect people, but are less likely to result in deaths.
Violence in the four regions has also varied in intensity over the years, and violence intensity, in terms of death rates and incident frequency, sometimes follows different trajectories. The increased intensity of violence in Aceh in 1998 to 2001 saw deaths per 100,000 persons increasing 33 times, far outpacing the 10-times increase in the number of incidents per person. Over the four-year period, each violent incident became more lethal.
The short time period for the data in the Bang-samoro does not allow for any longer-term analy-sis of violence trends. The four years covered by the BCMS dataset indicate that there has been a u-shaped development, with an initial decline in intensity, both measured by incidents and deaths, followed by a reversal to the initial high level in both of the indicators.
The data on Thailand cover the period since 2008, which has been marked by a stable level of fatali-ties until a decline in 2014. Data for the initial four years of the current phase of the conflict77 are not included in Figure 4.3; this period saw an initial rapid surge in violence and fatalities in 2004-2005, followed by stabilization at a level of 20-30 deaths per 100,000 persons.
Figure 4.2: Incidents and deaths by region74
Num
ber o
f Vio
lent
Inci
dent
s pe
r Yea
r
Pers
ons
Kille
d in
Vio
lent
Inci
dent
s pe
r Yea
r
3000
2500
2000
1500
1000
500
0
3000
2500
2000
1500
1000
500
01999 2000 2001 2002 2003 2004 2005 2006 2007 2008 2009 2010 2011 2012 2013 2014
Aceh Incidents Papua Incidents
Papua Deaths Bangsamoro Deaths
Bangsamoro Incidents Thailand’s Deep South Incidents
Thailand’s Deep South Deaths Aceh Deaths

29
4.2 THE CHARACTERISTICS OF VIOLENCE IN SNC AREAS
Subnational conflicts can be distinguished from other types of civil war by the level of symmetry between belligerent parties as well as the tactics they employ.78 Wars over control of the central state tend to be between two parties with similar levels of strength who, largely, use conventional warfare tactics. This results in face-to-face armed clashes over control of territory. In contrast, subnational conflicts tend to be asymmetric and non-conventional. Armed insurgent groups are typically weaker than the state, in terms of manpower and the technology of the weapons they possess. Typically, an armed insurgent group will employ guerilla tactics such as staging raids or other types of attacks on their stronger state adversary. As one consequence, the forms of violence used during SNCs will often be differ-ent from those used during more conventional national civil wars.
During all civil wars, but especially SNCs, violence relates to the master narrative of the conflict in complex ways. In all cases, the state no longer has a complete monopoly over violence. This creates conditions where insurgent groups can use violent tactics to advance their agenda. However, it can also mean that other forms of
Num
ber o
f Inc
iden
ts p
er 1
00,0
00 P
erso
ns
Num
ber o
f Dea
ths
per 1
00,0
00 P
erso
ns
120
100
80
60
40
20
0
10
20
30
40
50
60
70
019991998 2000 2001 2002 2003 2004 2005 2006 2007 2008 2009 2010 2011 2012 2013 2014
Aceh Incidents Papua Incidents
Papua Deaths Bangsamoro Deaths
Bangsamoro Incidents Thailand’s Deep South Incidents
Thailand’s Deep South Deaths Aceh Deaths
Figure 4.3: Violence intensity by SNC area
violence, often with different parochial goals, become prominent in the absence of the rule of law. In other words, SNC areas may experience not only types of violence related to the ostensible goals of the insurgent group (independence or more autonomy) and the state (wiping out insurgent activity to preserve sovereignty) but also other types of violence (e.g. related to crime, over natural resources, and so on).79 Violence during SNCs may be linked to the state-minority conflict, to competition among elites, or to communal conflicts.80
Data from the three VIMSs allow us to under-stand, to a greater extent than most previous datasets, the forms and types of violence that are occurring in SNC areas. Analyzing these, within and across conflict areas, can tell us much about the nature of SNC violence.
Types of violence in SNC areas
Figures 4.4 and 4.5 show the breakdown in deaths and incidents by violence type in subnational con-flict areas.81 (The Aceh data displayed here only cover the period until the end of 2005, before the consoli-dated peace phase began).82

30
Two points become immediately clear. First, the make-up of violence in Papua is very different than that in the other three SNC areas. Despite being host to an armed insurgent movement, the share of fatalities that are a result of separatist violence is low (on average 17% of all violent deaths). There is substantial fluctuation between years, with some seeing few deaths from separat-ist violence (one person killed per year in 2007-2008), and periods of more intense violence (such as 2013-2014, with 30 and 35 deaths each year). A far larger share of deaths comes from violence related to crimes such as drug trafficking, and other forms of illicit economy. Domestic violence kills around half as many people as does separat-ist violence in Papua. For domestic violence, the annual figures are more stable at 10-20 killed each year, with a peak at 32 in 2010. The data make a clear point: strategies to reduce violence in Papua must focus on more than just separatist tensions.
Second, while separatist violence accounts for the most deaths and incidents in wartime Aceh, Thai-land’s Deep South, and the Bangsamoro, other forms of violence also occur and lead to deaths.83 In the Bangsamoro, a large share of violent deaths, and an even larger share of incidents, relate to identity-based conflict and popular justice (when community members take justice into their own hands in response to crime or moral offenses). Identity-based violence includes clan conflicts, or rido, which are common in the Bangsamoro; indeed, one survey revealed that clan conflicts are more pertinent in the daily lives of people than the secessionist conflict.84 Actual-ly, only just over 20% of violent incidents in the Bangsamoro are separatist in nature (although separatism accounts for a larger share of deaths). This reflects the fact that the Bangsamoro has been the site both of an escalated SNC, but also of relatively high intensity horizontal contestation, and thus has some similarities to Papua. In all three SNC areas, criminal violence accounts for a major share of both incidents and deaths.
Figure 4.4: Types of violence (share of deaths)
Figure 4.5: Types of violence (share of incidents)
100%
90%
80%
70%
60%
50%
40%
30%
20%
10%
0%Aceh Papua Bangsamoro Thailand’s
Deep South
Domestic Violence
Identity-based Conflict
Popular Justice/ViolenceDuring Law Enforcement
Violent Crime, Drugs and Illicit Economy
Electoral
Resource Conflict
Governance Conflict
Separatist Conflict
Papua BangsamoroAceh
100%
90%
80%
70%
60%
50%
40%
30%
20%
10%
0%
Domestic Violence
Identity-based Conflict
Popular Justice/ViolenceDuring Law Enforcement
Violent Crime, Drugs and Illicit Economy
Electoral
Resource Conflict
Governance Conflict
Separatist Conflict
Thailand’s Deep South

31
Violent tactics
The inadequacy of explanations of violence in SNC areas which focus solely on conventional wartime tactics is confirmed by looking more closely at the weapons used in violent incidents.
Figure 4.6, which presents violent incidents by the weapons used, shows that there is a clear difference between the three areas which have seen escalated subnational conflict (Aceh, Thailand’s Deep South, and the Bangsamoro) and Papua, which has seen a more diverse range of types of violence. (Again, Aceh data presented here is only until the end of 2005).85
In all three escalated subnational conflict areas, the largest share of incidents comes from shootings. The profile of wartime incidents in Aceh and in the Bangsamoro is fairly similar, but bombings account for a far larger share of incidents in Thailand’s Deep South. The widespread use of bombs by insurgents in the Deep South is largely a reaction to Thai military suppression of militant cells. The insurgents primarily used shootings and assassinations in the early phase of the conflict. Since 2008, the state has employed large-scale counter insurgency operations, with many militants arrested or killed. The insurgents reacted by shifting tactics, increasingly using bombs as this allows for easier escape for the perpetrators, and less risk of being caught or shot by the authorities.86
Wartime Aceh saw the highest number of incidents involving guns. This is interesting given that rates of gun ownership are far lower than in Indonesia, the Philippines, or Thailand. Ownership in Thailand is 16 guns per 100 persons, three times as prevalent as in the Philippines (at 4.7 per 100) and 30 times more common than in Indonesia (0.5 per 100).87 Clearly, during escalated subnational conflicts, national policies on gun ownership do not affect, in a major way, the likelihood of guns being used. In Aceh, guns were smuggled in
100%
90%
80%
70%
60%
50%
40%
30%
20%
10%
0%
Other Violence Bombing Shooting
Aceh Papua Bangsamoro Thailand’s Deep South
Figure 4.6: Share of violent incidents by weapons used
through the Malay peninsula, fueling violence. In wartime Aceh, 75% of deaths came from shootings. Elsewhere in Indonesia, over the 1998-2005 period, the figure is 27.5%.88
In contrast, shootings account for a larger share of violent deaths in Thailand’s Deep South than in Aceh or the Bangsamoro (Figure 4.7). In other words, bombs are a frequently used violent tactic in Thailand but each bombing is less likely to result in fatalities, or results in few fatalities, than in either the Bangsamoro or Aceh. This is an effect of the wide variety of explosive devices used in Thailand’s Deep South. While there are some cases of larger bombs, often placed in trucks or cars, many devices are smaller and used for non-lethal purposes. One example, is the widespread use of bombs mounted on electricity poles by attackers seeking to disrupt electrical supply to urban centers. While causing disruption and material damage, these types of bombs rarely have any human impact.

32
Also notable in all three SNC areas, is the relatively large share of violent incidents and (especially) deaths that do not involve the use of guns or bombs.
If we look to see what tactics are used in sep-aratist and non-separatist violence, interest-ing conclusions emerge. In Aceh, separatist violence accounts for 45% of the deaths that did not come from guns or bombings. At the same time, some other types of violence used guns. Of all deaths from guns in Aceh during 1998-2005, 12% came from crime rather than from separatist incidents.
In the Bangsamoro, a large majority of the deaths from shootings, and around half of the deaths from bombs, actually came from non-separatist violence (Figure 4.8). More than 70% of the deaths that did not stem from bombs or guns were due to separatism.
In Thailand’s Deep South, deaths from bombs are almost entirely related to separat-ist violence, but shootings and other deaths are split fairly evenly between separatist and non-separatist violence (Figure 4.9).
The findings show two things. First, other unconventional tactics are often used during separatist wars. Second, other types of vio-lence that occur in subnational conflict areas also involve the use of guns.
Aceh Papua Bangsamoro
100%
90%
80%
70%
60%
50%
40%
30%
20%
10%
0%
Other Violence Bombing Shooting
Thailand’s Deep South
Figure 4.7: Share of violent deaths by weapons used
Shootings Bombing Other
100%
90%
80%
70%
60%
50%
40%
30%
20%
10%
0%
Non-Separatist Separatist
Other
100%
90%
80%
70%
60%
50%
40%
30%
20%
10%
0%
Non-Separatist Separatist
Shootings Bombing
Figure 4.8: Violent deaths by weapons used and type (separatist/non-separatist), the Bangsamoro
Figure 4.9: Violent deaths by weapons used and type (separatist/non-separatist), Thailand’s Deep South
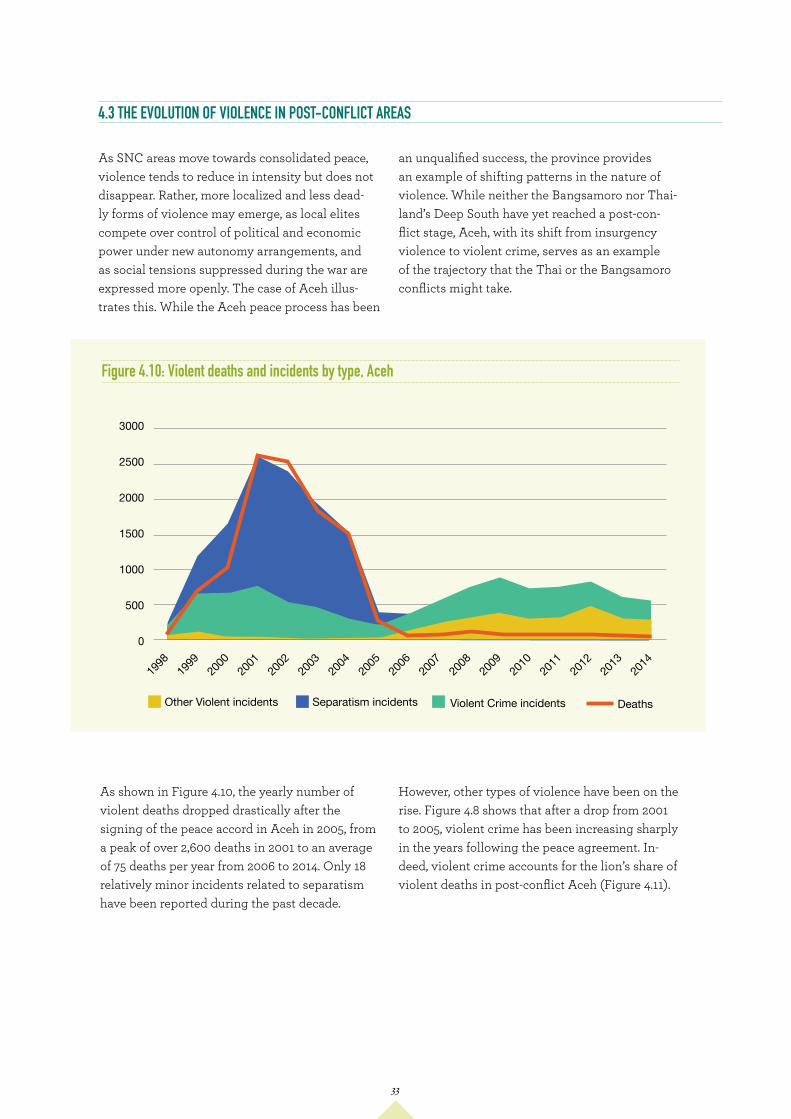
33
4.3 THE EVOLUTION OF VIOLENCE IN POST-CONFLICT AREAS
As SNC areas move towards consolidated peace, violence tends to reduce in intensity but does not disappear. Rather, more localized and less dead-ly forms of violence may emerge, as local elites compete over control of political and economic power under new autonomy arrangements, and as social tensions suppressed during the war are expressed more openly. The case of Aceh illus-trates this. While the Aceh peace process has been
3000
2500
2000
1500
1000
500
0
1998
1999
2000
2001
2002
2003
2004
2005
2006
2007
2008
2009
2010
2011
2012
2013
2014
Other Violent incidents Violent Crime incidentsSeparatism incidents Deaths
As shown in Figure 4.10, the yearly number of violent deaths dropped drastically after the signing of the peace accord in Aceh in 2005, from a peak of over 2,600 deaths in 2001 to an average of 75 deaths per year from 2006 to 2014. Only 18 relatively minor incidents related to separatism have been reported during the past decade.
Figure 4.10: Violent deaths and incidents by type, Aceh
an unqualified success, the province provides an example of shifting patterns in the nature of violence. While neither the Bangsamoro nor Thai-land’s Deep South have yet reached a post-con-flict stage, Aceh, with its shift from insurgency violence to violent crime, serves as an example of the trajectory that the Thai or the Bangsamoro conflicts might take.
However, other types of violence have been on the rise. Figure 4.8 shows that after a drop from 2001 to 2005, violent crime has been increasing sharply in the years following the peace agreement. In-deed, violent crime accounts for the lion’s share of violent deaths in post-conflict Aceh (Figure 4.11).

34
According to police and observers, this increase in criminal violence is partly attributable to the availability of leftover automatic weapons from the conflict (the NVMS data show that 13% of deadly violent crime incidents since 2005 have involved the use of guns), and the disappointment of former rebel combatants at economic opportu-nities in the peace period.89 While several com-pensation and reintegration programs were rolled out by the Indonesian government and interna-tional agencies immediately after the MoU, their reach in the field was uneven.90 Evidence emerged of the involvement of former rebels in criminal activities as diverse as illegal logging, extortion, the drug trade, armed robberies, and kidnappings for ransom.91
The VIMS data thus allows us to see both how violence has changed in levels and impacts, but also in types and forms. The case of Aceh shows that even as peace is consolidated in areas affect-ed by an SNC, violence can continue and evolve in form. This picture, however, is not clear from the Uppsala data. The UCDP-GED records only two incidents leading to five deaths, both of which occurred in 2008.
Besides crime, other forms of violence have been on the rise (Figure 4.12). Incidents of popular jus-tice have increased in frequency since the peace agreement, and have remained high. Political violence peaked around the 2009 and 2012 elec-tions. The 2009 legislative elections were the first in which Partai Aceh, the political party formed by GAM, the former insurgent group, fielded candidates for provincial and district parliaments (the party won by landslide). The 2012 election, for provincial governor and district heads, was marked by deep divisions between two factions of the former rebel movement. Both elections were characterized by widespread intimidation in the field, and violent incidents such as the bombing or arson of party offices, and assaults—sometimes deadly—on party cadres and candidates.92
100%
90%
80%
70%
60%
50%
40%
30%
20%
10%
0%
1998
1999
2000
2001
2002
2003
2004
2005
2006
2007
2008
2009
2010
2011
2012
2013
2014
Domestic Violence
Identity-based Conflict
Popular Justice/Violence during law-enforcement
Violent Crime, Drugs and Illicit Economy
Electoral Conflict
Resource Conflict
Governance Conflict
Separatist Conflict
Figure 4.11: Share of deaths by type, Aceh

35
4.4 THE EVOLUTION OF VIOLENCE IN SNC AREAS WITHOUT TRANSITION
Figure 4.12: Violent deaths and incidents in post-conflict Aceh by type (excluding separatism and crime)
600
500
400
300
200
100
0
2005 2006 2007 2008 2009 2010 2011 2012 2013 2014
Others Resources Governance
Popular justice
All violent deaths
Identity
Domestic violence
Elections
Law enforcement
The nature of violence can also change even where there is not a successful peace settlement that brings to an end organized separatist vio-lence. Protracted conflicts without a successful resolution also go through important changes. This is exemplified by the evolution of the Thai-land’s Deep South conflict and violence in Papua.
Thailand’s Deep South
Figure 4.13 shows how types of violence have changed over time in the Deep South. As can be seen, initially almost all violence stemmed from the sepa-ratist conflict. However, in more recent years, violence related to criminal activities accounts for an increas-ing share of deaths.92 This dynamic has not been fully noted by most outside observers who still view the Thai conflict as driven almost entirely by separat-ism. Recognizing that the conflict has gone through a transformation, where the shift in violence types reflects the increasing complexity of the conflict, is important for devising appropriate policies.
Turning to form in Thailand’s Deep South, shootings have accounted for the greatest share of deaths since 2008, and indeed since the outbreak of violence in 2004.94 While shootings are still by far the most common form of violence, there has been an increase in the share of other forms of violence, as the deaths from shootings have declined (Figure 4.14).

36
Changing tactics is also reflected in the changing nature of victims over time. Targets of violence may be hard (individuals who have been armed by the state or taken up arms against the state) or soft (non-combatants). Throughout the Deep South conflict period more soft targets have been killed than hard targets. This confirms again that SNC violence does not only take the form of classic government-rebel conflict fought between armed organizations (here classified as hard tar-gets), but also that civilians are often targeted by the violence. During periods of increased conflict
intensity (such as 2011 to 2013, when both overall death rates and incident frequency were rela-tively high), the share of non-combatant killings declined, while more armed actors were killed. When overall intensity decreased after 2013, non-armed civilians were more likely to be targeted than armed actors (Figure 4.15). This points to a pattern of civilians suffering comparatively more in periods of relatively lower intensity insurgency and counter-insurgency operations, when armed groups tend to avoid direct confrontation.
Violent Crime, Drugs and Illicit Economy
Electoral Conflict
Resource Conflict
Separatist Conflict
100%
90%
80%
70%
60%
50%
40%
30%
20%
10%
0%2008 2009 2010 2011 2012 2013 2014 2015
Figure 4.13: Deaths by type, Thailand’s Deep South
Shooting Bombing
Law Enforcement Violence
Arson
Robbery/Theft
Clash
450400350300250200150100500
2008 2009 2010 2011 2012 2013 2014 2015
Figure 4.14: Deaths by form, Thailand’s Deep South

37
Figure 4.15: Shares of soft and hard target deaths, Thailand’s Deep South
100%
90%
80%
70%
60%
50%
40%
30%
20%
10%
0%
2008 2009 2010 2011 2012 2013 2014 2015
Dead soft targets
Dead hard targets
First Peace Dialogue Second Peace Dialogue
Average dead soft targets Average dead hard targets
Dead hard targetsDead soft targets
Jan-
10
Apr-1
0
Jul-1
0
Oct
-10
Jan-
11
Apr-1
1
Jul-1
1
Oct
-11
Jan-
12
Apr-1
2
Jul-1
2
Oct
-12
Jan-
13
Apr-1
3
Jul-1
3
Oct
-13
Jan-
14
Apr-1
4
Jul-1
4
Oct
-14
Jan-
15
Apr-1
5
Jul-1
5
Oct
-15
50
45
40
35
30
25
20
15
10
5
0
One driver of change in intensity and the charac-ter of violence has been the on-and-off political process to resolve the southern conflict. The Deep South has ebbed and flowed between being in a phase of no transition and one of fragile transition. The two periods of peace talks have brought about changes in violence dynamics on the ground (Figure 4.16).
The first round of talks facilitated by Malaysia was initiated by the elected Yingluck Shinawa-tra government in early 2013. A key demand
from the Thai government was that insurgent groups stop attacks against civilian and economic targets. This was indeed followed by a marked decrease in the number of civilian casualties in the following year, but a simultaneous increase in the number of combatant targets.95 Upon the collapse of the first series of talks, as the BRN withdrew from the talks and the government was destabi-lized by large scale protests in Bangkok, levels of civilian and combatant casualties quickly reverted to their earlier means.
Figure 4.16: Violence and peace talks in Thailand’s Deep South

38
After the military takeover in May 2014, a second series of peace talks was initiated in October of the same year. While the future of this process is highly uncertain, the impact of the political pro-cess seems clear. There was a substantial decline in overall fatalities after October 2014. This time around, the talks were more inclusive, and set off a process toward consolidation among separatist groups.96 The decline in violent deaths may have been brought about by the combined effect of the talks, insurgent consolidation, and the simulta-neous increase in government-supported militia groups, working in coordination with the regular armed forces.97
Papua
Papua, the other Indonesian region covered in this paper, provides another example of violence evolving in the absence of any political transition towards peace.
Violence in contemporary Papua has always involved separatist violence. However, the level of violence related to the separatist conflict has ebbed and flowed considerably over time (Fig-ure 4.17). From 1998 to 2004, the yearly average number of violent deaths related to the insurgen-cy was 29, with a peak of 61 fatalities in the year 2000. Deaths dropped drastically during a four-year period from 2005 to 2008 (below four per year on average). They increased again steadily from 2009 to reach levels comparable to the pre-2005 period (25 yearly deaths, on average, from 2009 to 2014).
70
60
50
40
30
20
10
01998 1999 2000 2001 2002 2003 2004 2005 2006 2007 2008 2009 2010 2011 2012 2013 2014
Separatist incidents Deaths
Figure 4.17: Number of incidents and deaths related to separatism, Papua
This variation is partly explained by developments in the Indonesian government’s approach to addressing political, social, and economic issues in Papua. The year 2004 marked the beginning of the implementation of Special Autonomy (OT-SUS) arrangements, which became law in 2001. Local political representation was improved and considerable fiscal resources transferred to the region to bolster development. The creation of multiple new administrative districts allowed for the cooptation of local elites through elected
positions, bureaucratic jobs, and decentralized resources.98 In large part, this might explain why separatist activity appeared to lose momentum for a few years after 2004.
However, as OTSUS failed to lead to durable im-provements in the living conditions of Papuans, with the exception of the elite, calls for indepen-dence, and violence as a way to achieve it, once again found appeal. A slight drop in deadly sepa-ratist violence in 2012 might be related to short-

39
lived efforts by President Yudhoyono’s adminis-tration to address OTSUS implementation issues by creating a dedicated government agency for Papua (UP4B).
Figure 4.18, however, points to differences in the nature of separatist violence before and after 2005. Pre-2005, violence involved a relatively lower number of incidents leading to higher fa-talities. When violence resumed from 2008 on, it was characterized by higher numbers of incidents
but comparatively fewer fatalities. This indicates a shift from armed confrontation between Indone-sian security forces and insurgent groups such as the Free Papua Movement (OPM), towards more sporadic forms of violence.
Indeed, the data show that assaults involving in-dividuals or small groups, rather than altercations between large groups (group clashes), became the dominant form of separatist violence from 2009 on (Figure 4.19).
Demonstration/riot Group clash Terror Assault Others
60
50
40
30
20
10
01998 1999 2000 2001 2002 2003 2004 2005 2006 2007 2008 2009 2010 2011 2012 2013 2014
Figure 4.18: Forms of separatist violence (number of violent incidents), Papua
Finally, despite the fact that absolute numbers of separatist incidents increased after 2008, and absolute numbers of related deaths have again reached pre-2005 levels, this type of violence decreased as a share of all violence over time. In 1998 and 2000, separatist violence led to around half of the violent deaths in Papua. In 2014, it rep-resented only 20% of fatalities (Figure 4.19).
Two factors might explain this trend. First, the quality of the local press coverage (the main data source used by the NVMS) has improved over the past decade. This could have led to better repre-
sentation of other forms of conflict and violence in the media. Second, exploitation of the region’s considerable natural resources (forests, natural gas, and minerals) has continued at a rapid pace over the past decade, facilitated by special autono-my, and investments in infrastructure. This has been accompanied by a steady flow of migrant workers and traders coming from other parts of Indonesia—a major grievance for ethnic Papuans. As a result, the share of violence related to compe-tition over land and jobs, identity, crime, and other issues has increased.

40
Subnational conflicts are typically referred to by the provinces or regions where they occur. Yet closer examination of patterns of violence within each SNC area shows that there is vast variation in levels of violence. This is true for areas where there has been little progress towards peace, where transitions are ongoing, and those in the post-conflict phase.
No transition: Papua
As discussed above, Papua is currently by far the most violent region in Indonesia. Provincial aggregates, however, hide considerable variation in the level and nature of violence across districts. The high regional death rate is driven by a limited number of particularly violent districts, the most violent of which are all located in Papua province (Figure 4.20).
Mimika district, where the world’s largest copper mine is located (the Freeport concession), contributed 37% of all violent deaths in the
province in 2014 (56 violent deaths out of 151). Mimika’s death rate that same year was 29.2, on par with Colombia.99 The second most violent district is the municipality of Jayapura, the provincial capital, with 26 violent deaths in 2014, and a homicide rate of 10. Puncak Jaya, one of the strongholds of the separatist insurgency, comes third with 10 homicides in 2014 and a homicide rate of 9.3.
The types of violence occurring in each place varies (Figure 4.21). In Mimika, crime, tribal wars, land disputes, and labor issues101 accounted for 83% of all violent deaths from 2010-2014. In the capital, crime alone accounted for 55% of deaths for the same time period; 16.5% of deaths were related to pro-independence protests and activ-ism, while domestic violence contributed 13%. In Puncak Jaya, separatist violence is the main driver of fatalities (48 deaths, or 88% of all violent deaths from 2010-2014).
Figure 4.19: Share of deaths by violence type, Papua
100%
90%
80%
70%
60%
50%
40%
30%
20%
10%
0%
2000
1999
1998
2001
2002
2003
2004
2005
2006
2007
2008
2009
2010
2011
2012
2013
2014
Domestic Violence
Identity-based Conflict
Popular Justice/Violence during law-enforcement
Violent Crime, Drugs and IllicitEconomy
Electoral Conflict
Resource Conflict
Governance Conflict
Separatist Conflict
4.5 THE CONCENTRATION OF VIOLENCE WITHIN SNC AREAS

41
Dogiyai, Kab.
Mappi, Kab.
Asmat, Kab.
Nabire, Kab.
Jayapura, Kab.
Biak Numfor, Kab.
Jayawijaya, Kab.
Paniai, Kab.
Puncak, Kab.
Waropen, Kab.
Yapen Waropen, Kab.
Keerom, Kab.
Lanny Jaya, Kab.
Puncak Jaya, Kab.
Jayapura, Kab.
Mimika, Kab.
Death rate 2014
Violent deaths 2014
Figure 4.20: Deaths and death rates by district (2014), Papua100
Others Resources Governance Politics/elections
CrimeLaw enforcementPopular justice
Separatist
Identity
Domestic violence
PUNCAK JAYA
MIMIKA
KOTA JAYAPURA
0 20 40 60 80 100 120 140 160
Figure 4.21: Violent deaths in Puncak Jaya, Mimika, and Jayapura city, by violence type (2010-2014), Papua

42
No transition: Thailand’s Deep South
Violence in Thailand’s Deep South has historically been concentrated in the central part of the region, in northern Yala province, part of Pattani, and northern Narathiwat province. At the beginning of the surge in insurgent attacks in 2004, violence primarily affected remote rural areas. Subsequent years saw a progressive transition towards urban centers, putting the two largest urban districts in the region—Mueang Yala and Mueang Pattani—at the top of the list as the most violent areas from 2008 to 2015 (Figure 4.22). Nonetheless, some of the rural upland districts such as Ra-ngae in Narathiwat province, where the latest wave of insurgency originated, remain heavily affected. Ra-ngae ranks first for the number of violent deaths per district over the same time period, and third for the number of violent incidents. Figure 4.22 shows that the geographical concentration of violence in the Deep South remains consistent across indicators (violent incidents, deaths, and injuries).
However, a year-by-year analysis of the spread of violence shows that the past decade has seen a slow but steady trend toward a more even distribution of impacts across districts (Figure 4.23). From 2008 to 2010, 10 districts out of 38 bore the brunt of the violence, with over half of
1200
1000
800
600
400
200
0
1200
1000
800
600
400
200
0
Num
ber o
f Inc
iden
ts
Num
ber o
f Per
sons
Inju
red/
Dead
Mue
ang
Yala
Mue
ang
Patta
niRa
-nga
eRu
eso
Sai B
uri
Yara
ngRa
man
Bann
ang
Sata
Khok
Pho
Mue
ang
Bach
oN
ong
Chi
kC
ho-A
i Ron
gYa
haSu
-Nga
i Kol
okYa
ring
May
oTa
k Ba
iKr
ong
Pina
ngC
hana
ePa
nare
Kaph
oSi
Sak
hon
Thun
g Ya
ng D
aeng
Su-n
gai P
adi
Hat
Yai
Yi N
goTh
an T
oSa
ba Y
oiM
ae L
anSu
khiri
nW
aeng
Rano
tM
ai K
aen
Beto
ngKa
bang
Cha
naSa
dao
Thep
ha
Incidents Deaths Injuries
Figure 4.22: Violence by district (2008-2015), Thailand’s Deep South
all violent incidents. For the same three years, the 10 least-affected districts in the region barely suffered any violence at all. From 2011 on, the share of violent incidents borne by the 10 most-affected districts decreased from over 60% to less than 50%, while the share of the least-affected 10 districts steadily increased to over 10%.
This trend toward the diffusion of violence may be driven by several factors. First, it could be a result of the police and military concentrating their resources in heavily-affected areas, thus leading insurgents to move to previously less-affected districts. Second, it might reflect a deliberate strategy by insurgent groups to extend their reach in new areas. A third potential explanation is that economic conditions in the heavily-affected districts has improved with development investments. With economic growth and job creation, the support base for insurgent groups may have been undermined, leading them to shift their attention to more disadvantaged areas.102
Finally, the shift in geographical patterns of violence in the Deep South might also be related to the increasing share of crime and drug trade-related incidents, and the corresponding decreasing share of separatist incidents.

43
70%
60%
50%
40%
30%
20%
10%
0%2008 2009 2010 2011 2012 2013 2014 2015
10 most violent districts share 10 least violent districts share
Figure 4.23: Share of violent incidents, 10 most-affected districts vs. 10 least-affected, Thailand’s Deep South
Map 4.1: Clustering of violence based on administrative borders (2004-2012), Thailand’s Deep South

44
Map 4.1 gives another illustration of the clustering of violence, this time disaggregated at the village level. The map shows how heavily-affected villages tend to be located in the core or central part of the conflict-affected provinces, as discussed above. Areas on the border with Malaysia to the south and west, areas bordering other Thai provinces in the northwest, and villages along the shoreline in the east and north are all seeing lower levels of violence when compared with the interior areas.
Map 4.2 employs formal cluster analysis103 to identify areas with higher levels of violence compared to others. The resulting clusters broadly correspond to the 10 most violent districts identified in Figure 4.22. This shows a clear consistency in the geographic patterns of violence in the Deep South. Violence has been concentrated in the central part of the region, in districts that include urban centers, as well as in the rural strongholds of the insurgency.
Map 4.2: Clustering of violence without imposing administrative borders (2004-2012), Thailand’s Deep South
Map 4.3: Village-level unemployment (2003), Thailand’s Deep South
Having identified the geo-graphical clusters where violence is concentrated, it is possible to overlay this data with other indicators to iden-tify factors correlated with violence. Geographical vari-ation in measures of pre-con-flict socio-economic welfare, such as unemployment rates (Map 4.3), does not seem to be correlated with variation in violence levels. While the three southernmost prov-inces are all among the very poorest in the country, there is no evidence that variation in poverty across the south is correlated with levels of localized violence.104
Proxies for concentration of the Malay-Muslim popula-tion, such as language use and religion, offer a better match (Maps 4.4 and 4.5). This provides further evi-dence for analyses that have argued that the insurgency in the Deep South is driven by identity-based, rather than economic grievances.105

45
Ongoing transition: the Bangsamoro
There is also considerable violence within the Bangsamoro, both in intensity and in the types of violence that are occurring. Certain types of violence, notably separatist violence, represent a higher share of deaths in some areas than in others. This reveals the differ-ent combinations of vertical and horizontal forms of conflict present in Mindanao.
The area with the least violence is Tawi-Tawi province (Figure 4.24), which is the most remote of the island provinces in Mindan-ao. Tawi-Tawi, in fact is closer to Sabah in Eastern Malaysia than it is to the rest of the Southern Philippines. While Tawi-Tawi has historically been the most peaceful Mus-lim-majority area, it nonetheless is intimately bound up with the violence observed in neighboring provinces, and indeed coun-tries. In the period covered by the BCMS, for example, a rag tag army sailed from Tawi-Ta-wi and invaded Sabah, leading to a weeks-long standoff with the Malaysian military which claimed 72 lives.106
The area with the most intense violence is Basilan, an island province where multiple non-state armed groups are active (including the MILF). The security situation deteriorat-ed significantly in the late 1990s and early 2000s, before improving in the mid-2000s, and then again taking a turn for the worse. While the BCMS data are limited to the 2011-2014 period, violence is still more intense compared to other areas. Violence intensity in Isabela City, the provincial capital, is shown separately in Figure 4.24, and is rel-atively low, suggesting that there is consid-erable variation across the province. Further disaggregation to the municipal level would likely show that the island’s southeast quad-rant, where most fighters associated with non-state armed groups are based, bears a disproportionate burden of violence relative to population. In absolute terms, however, for this period the number of deaths in Basilan (743) is not that much more than in neigh-boring Sulu (615).
Map 4.4: Village-level language use (2003), Thailand’s Deep South
Map 4.5: Village-level religion (2003), Thailand’s Deep South

46
In terms of types of violence as a share of deaths by province, the geographical variation is even clearer. Here again, Tawi-Tawi appears an outlier, with no separatist violence at all. Maguindanao (where the majority of MILF forces are based), Basilan, and Sulu have similar profiles, with sepa-ratist violence contributing the majority of deaths.
Figure 4.25 is most interesting for what it reveals about violence dynamics in Lanao del Sur, which borders Maguindanao province, and similarly has a sizeable MILF presence. From 2011 to 2014, separatist violence represented a small share of deaths. This is likely because there were no clash-es between the MILF and the Philippine military in the province while the peace negotiations were ongoing with the Aquino government. Other actors, ideologically motivated by separatism and active in this period, were not present in Lanao del Sur. For example, the Bangsamoro Islamic Freedom Fighters, an MILF splinter group that rejects the peace process, likely makes up a large share of the incidents in Maguindanao that are cod-ed as separatist.107 The identity-based violence (111 incidents in total) in Lanao del Sur is largely related to rido or inter-clan conflict.108 While this particular form of horizontal violence has often interacted with the separatist conflict in Central Mindanao, the BCMS data from Lanao del Sur suggest it may not decline in proportion with decreasing levels of separatist conflict. Instead, a future Bangsamoro government will likely face continued high levels of identity-based horizontal conflict, which will require targeted policies to address specific conflict triggers in different provinces.
Figure 4.24: Violence intensity by province/city, the Bangsamoro
Maguin
danao
Basilan
Cotabato
City
Averag
eSulu
Lana
o del
Sur
Tawi-T
awi
Isabela
City
2011 2012 2013 2014100
9080
70
60
50
4030
20
10
0
Deat
hs p
er 1
00,0
00
100%
90%
80%
70%
60%
50%
40%
30%
20%
10%
0%
Maguin
danao
Basilan Sulu
Lana
o del
Sur
Cotabato
City
Tawi-T
awi
Isabela
City
Identity-based Conflict
Popular Justice/ViolenceDuring Law Enforcement
Violent Crime, Drugs and Illicit Economy
Resource
Governance
Separatist
Figure 4.25: Types of violence as share of deaths (2011-2014), the Bangsamoro109

47
Consolidation phase: Aceh
In Aceh, levels of violence have declined across the province since the signing of the Helsinki peace agreement in 2005. In many ways, violence levels have been ‘normalized’, moving closer to Indonesian averages. However, there is still distinct variation in the levels and impacts of violence within the prov-ince. Comparing district per capita death rates for the conflict and post-conflict periods, illustrates both the changing nature of violence in Aceh as well as the ways in which some remnants of war persist.
To what extent do the districts affected most by the war in Aceh exhibit the highest levels of post-conflict violence? Table 4.1 presents data on per capita death rates for the 10 districts most affected in the war. (Aceh has 23 districts). The data show that there is vast variation in the extent to which highly-affected districts continue to see fatal violence. On the one hand, five of the districts that were most affected by war are in the top 10 districts most affected by post-conflict violence (shaded bright green).110 On the other, relative death rates compared with other districts have plunged in five of the districts most affected in the war (shaded light green). The share of violent deaths in Aceh that occurred in Aceh Jaya during the conflict years was 4%; however, since the end of 2015, the district has accounted for just 1% of deaths. The relative share in Aceh Selatan has simi-larly plunged: from 8.5% to 2.4%.
Table 4.1: Districts with the highest death rates (conflict period), Aceh
DistrictConflict period (1998-2005) Post-conflict period (2006-2014)
Deaths per 100,000/year
RankDeaths per 100,000/
year Rank
Aceh Jaya 70.0 1 1.3 17
Aceh Timur 60.3 2 2.7 4
Aceh Selatan 53.9 3 0.8 21
Bireuen 50.9 4 2.3 5
Aceh Utara 48.8 5 1.6 8
Bener Meriah 36.5 6 1.4 13
Aceh Besar 34.2 7 2.9 3
Lhokseumawe 33.0 8 1.8 6
Nagan Raya 32.3 9 1.4 12
Aceh Barat Daya 31.5 10 1.4 14
What explains these differences? One clue is that the five districts that continue to display (relative-ly) high levels of violent deaths all lie on Aceh’s east coast. The other five districts, which are now less violent, compared to most other districts in Aceh, are on Aceh’s west coast (Aceh Jaya, Aceh Selatan, Nagan Raya, and Aceh Barat Daya) or in the central highlands (Bener Meriah).
Other research, comparing Aceh Timur and Aceh Selatan, has sought to explain why there has been such a divergence between east and west coast districts.111 That research showed that there were a number of reasons why we might have expect-ed post-conflict violence to be higher in Aceh Selatan. The number of GAM combatants, per capita, was higher in Aceh Selatan than in Aceh Timur.112 Also, violence in the eight months before the peace agreement was particularly high in Aceh Selatan. And, as some have argued, ex-com-batants in Aceh Selatan were more likely to have joined GAM for economic rather than ideological reasons than was the case in Aceh Timur.113 Despite these risk factors, violence in Aceh Se-latan, alongside neighboring districts like Aceh Jaya, has plunged in the post-conflict period.
One possible reason for less violence in Aceh Selatan was that the GAM structure was less frag-mented than on the east coast. This allowed more money from reintegration and reconstruction

48
assistance, as well as new business opportunities, to flow to lower-level former GAM combatants. As a result, lower-level combatants did not have to use violence to seek resources. In addition, the research argues that there are greater norms of brotherhood and solidarity on the west coast. Most GAM combatants were recruited at the same time, meaning that differences in status between fighters were less than on the east coast. There are also stronger kinship networks, which often cross old conflict cleavages.
While some districts that were highly affected by violence during the war have been particularly successful at bringing down violence, other districts that saw less wartime violence have become relatively more violent (in Table 4.2, the
relevant districts are shaded blue). In particular, Aceh Tenggara has seen only a slight drop in per capita deaths since the wartime period, and is now the district second-most-affected by violence, while during the conflict period, it ranked 20th. The share of province-wide violent deaths in Aceh Tenggara has increased 14 times from the conflict to the post-conflict period.114
It is beyond the scope of the paper to examine why such places have become relatively more violent, compared to their neighbors. However, it could suggest the return to normal, pre-war pat-terns of violence in Aceh, with local-level issues driving violence rather than the large narratives that were constructed and used for mobilization during the war.
Table 4.2: Districts with the highest death rates (post-conflict period), Aceh
District
Post-conflict period (2006-2014) Conflict period (1998-2005)
Deaths per 100,000/year Rank Deaths per
100,000/year Rank
Gayo Lues 3.3 1 7.2 19
Aceh Tenggara 3.0 2 3.4 20
Aceh Besar 2.9 3 34.2 7
Aceh Timur 2.7 4 60.3 2
Bireuen 2.3 5 50.9 4
Lhokseumawe 1.8 6 33.0 8
Banda Aceh 1.8 7 7.6 18
Aceh Utara 1.6 8 48.8 5
Pidie 1.6 9 24.7 13
Aceh Tamiang 1.5 10 12.8 14
4.6 GENDERED IMPACTS OF VIOLENCE
The three VIMS datasets all disaggregate victims of violence by gender. This allows us to assess the extent to which violence in different places affects men and women differentially, how this is chang-ing over time, and how it differs for different types of violence.
Figure 4.26 presents gender-disaggregated statistics on violent fatalities for each of the four
SNC areas.115 The first clear finding is that violent incidents are far more likely to kill men than women. Women are impacted by violence in other ways: for example, they may experience rape or economic and personal hardship if they lose a male figure in their household to violence. But when it comes to fatalities, in all four areas, men are far more likely to die from violence than is the case for women.

49
A second finding is that the overall trend in the four subnational conflict areas has been towards women accounting for a greater proportion of deaths over time. This is most marked in Aceh where, since 1998, the proportion of deaths suffered by women has increased from 9% to 35%.
Third, the main reason for the increase in the proportion of deaths that are suffered by women in Aceh is the transition from war to consolidated peace. During the period of intense conflict, more than 90% of those killed in Aceh were men. However, the 2015 peace agreement changed the dominant patterns of violence in the province, with organized armed conflict between insurgents and the state almost disappearing, and new types
of violence emerging (see Figure 4.11 above).This is clear if we disaggregate the proportion of fatalities suffered by men and by women for each type of violence. During the wartime period, most of the deaths in Aceh were the result of separatist violence. However, after the peace accord, other forms of violence—crime, popular justice, and domestic violence—began to predominate. As can be seen in Figure 4.27, women account for a larger share of deaths from crime and domestic violence than is the case for separatist violence. Indeed, much of the increase in the relative proportion of women who are killed violently in Aceh is a result of the increasing prominence of domestic violence in the make-up of violence in the province.
Figure 4.26: Female share of violent deaths by year116
40%
35%
30%
25%
20%
15%
10%
5%
0%
1998
1999
2000
2001
2002
2003
2004
2005
2006
2007
2008
2009
2010
2011
2012
2013
2014
2015
Aceh Papua Bangsamoro Thailand's Deep South
Separa
tist C
onflic
t
Violen
t Crim
e,
Drugs/I
llicit E
cono
my
Domes
tic Viol
ence
100%
90%
80%
70%
60%
50%
40%
30%
20%
10%
0%
Male
Female
Govern
ance
Conflic
t
Popula
r Jus
tice/
Law-en
force
ment
Resou
rce Con
flict
Elector
al Con
flict
Figure 4.27: Violent deaths by gender, Aceh

50
Aceh Papua Bangsamoro Thailand's Deep South
100%
80%
60%
40%
20%
0%
Female
Male
The prominence of domestic violence in Papua, which accounts for over 10% of all deaths in the province, also explains why a relatively large share of those killed in Papua are women. Women are much more likely to be killed by domestic violence than are men (Figure 4.28).
Finally, comparative analysis of the four SNC areas shows that there is large variation in the extent to which separatist violence targets women (Figure 4.29). In Aceh, Papua, and Mindanao, less than 5% of those killed during separatist violence were women. In contrast, 14% of those killed from this
Figure 4.28: Violent deaths by gender, Papua
Separa
tist C
onflic
t
Identity
-based
Conflic
t
Violen
t Crim
e, Drug
s/Illic
it Eco
nomy
Domes
tic Viol
ence
Govern
ance
Conflic
t
Popula
r Jus
tice/L
aw-en
force
ment
Resou
rce Con
flict
Elector
al Con
flict
100%
90%
80%
70%
60%
50%
40%
30%
20%
10%
0%
Male
Female
type of violence in Thailand’s Deep South were women; 80% of all female victims of violence died from separatist violence, a proportion that is higher than for men.
One reason for women’s high fatality rates from separatist violence in the Deep South is the wide-spread use of bombs. Many women who are killed are not directly targeted. Rather they are caught up in the indiscriminate violence caused by explo-sions, often in public places such as markets.
Figure 4.29: Deaths from separatist violence, by gender

51
Violent Incidents Monitoring System (VIMS) data are particularly well suited for multivariate analysis. This is because VIMSs allow for anal-ysis at low levels of geographic disaggregation and the generation of multiple and accurately measured outcome variables.
The first wave of econometric work on the causes of conflict and violence focused on national-level factors associated with cross-country variation in violence.117 However, these studies suffered from measurement errors. If violence is only present in some parts of the country and not in others, it does not make sense to explain this variation using national factors which are constant across areas with different levels of violence. As a result, increasingly econometric studies have focused on explaining variation in violence within states, using variables disaggregated at the subnational level. The UCDP-GED and ACLED databases both allow for this, as do the VIMSs.
The added value of the VIMSs is that they allow for the generation of multiple different outcome variables. It is well established that different causal variables drive different types and forms of violence. The factors associated with ethnic riots, for example, will be different from those associated with separatist insurgency.118 Using datasets for econometric analysis that combine all forms of violence as one phenomenological type may result in misleading findings.
Conversely, datasets that contain only one form of violence (e.g. civil war violence) prevent comparison of the factors that drive different forms of violence.119 Both ACLED and the UCDP-GED include a relatively limited number of types of violence and hence suffer from this problem.120 In contrast, a VIMS allows for the generation of a large number of different violence variables: e.g. land-related violence; criminal violence; separatist violence; violence involving groups; electoral violence; violence using guns; and so on.
Furthermore, ACLED and the UCDP-GED miss much of the violence they seek to cover be-cause of the data sources they use. As Section 3 demonstrated, the picture they give of violence is at times misleading because they under-re-port violence. In contrast, the VIMSs, which use local sources, generate more accurate measures of violence.
This section shows how the three VIMSs for Thailand, the Philippines, and Indonesia can be used to analyze important research questions and key policy issues using econometric tech-niques. The text primarily draws on examples from three country background papers commis-sioned for this study. In each, VIMS data are integrated with highly disaggregated data on potential independent casual variables obtained from other sources such as national statistical agencies.121
5. DRIVERS OF VIOLENCE: FINDINGS FROM MULTIVARIATE
ANALYSES The drivers of violence are inherently complex. There are often a multitude of causal factors con-tributing to the outbreak of violence. One methodological approach to handle this complexity is multivariate econometric analysis. This makes it possible to simultaneously analyze the impact of more than one variable on the likelihood of violence occurring.

52
Methods
A basic form of multivariate analysis of violence is the estimation of correlates of violence— factors that are associated with higher or lower levels of violence. Drawing on the rich BCMS dataset, Joseph Capuno presents such an analysis for the Bangsamoro in the Philippines.122 In addition to the BCMS, the analysis draws on fiscal data from the Bureau of Local Government Finance, demo-graphic and geographic data from the Philippine Statistics Authority, and electoral information from the Commission on Elections. To identify the correlates of violence with the assembled dataset, two regression models were estimated—a
Independent variables All conflict Separatist
Est. Std error Est. Std errorIRA real per capita -0.000003 (0.000038) -0.000028 (0.000018)Social services spending, last year -0.000046 (0.00027) 0.000001 (0.00013)Population with elementary education only, percent 0.984 (0.613) 0.312) (0.260)Mayor re-elected in 2015 -0.160** (0.066) -0.036 (0.022)Mayor and vice mayor from same political clan 0.202* (0.108) -0.027 (0.041)Mayor and congressperson from same political clan 0.154 (0.104) 0.031 (0.043)Mayor and governor from same political clan -0.432** (0.160) -0.087 (0.060)Conflict incidence rate, last year 1.054*** (0.180) 0.210 (0.111)Neighboring area with crime conflict 0.345 (0.301) -0.040 (0.112)Neighboring area with political conflict 0.124 (0.266) 0.041 (0.076)Neighboring area with clan conflict 0.024 (0.228) -0.060 (0.152)Neighboring area with separatist conflict 0.152 (0.173) 0.015 (0.047)Neighboring area with election conflict -0.513* (0.293) 0.063 (0.138)Neighboring area with land conflict -0.106 (0.186) -0.060 (0.084)Neighboring area with trade conflict 0.625 (0.463) 0.240 (0.190)Neighboring area with other conflict -0.290 (0.555) -0.645*** (0.203)Interior municipality -0.217* (0.118) 0.004 (0.055)Island municipality -0.010 (0.621) -0.534*** (0.189)City 0.322* (0.185) -0.066 (0.059)Maguindanao -0.547** (0.224) -0.060 (0.091)Lanao del Sur -0.480 (0.308) -0.015 (0.097)Basilan 0.235 (0.276) -0.058 (0.115)Constant -0.324 (0.692) 0.460** (0.199)N 59 59R-squared 0.921 0.600F-statistic 47.98 11.22Prob>F 0.00 0.00Note: Figures in parentheses are robust standard errors. ***p<0.01, **p<0.05, *p<0.10
Table 5.1: Correlates of violent incidents in 2014, the Bangsamoro
panel model and another single-year, cross-sec-tion version. The unit of analysis was local gov-ernment units—the 59 municipalities and cities covered by the BCMS.123
The cross-section model was estimated using the standard ordinary least square method, extended with geographic fixed effect variables to control for variation between different localities through-out the Bangsamoro. While the full paper reports findings for eight types of incidents, our discus-sion here will focus on the identified correlates for overall levels of violence, and for separatist violence.
5.1 CORRELATES OF VIOLENCE: FINDINGS FROM THE PHILIPPINES

53
Findings
Table 5.1 shows the estimates for the factors influencing incidence rates for (a) all incidents of violence; and (b) incidents of separatist violence. Looking at the findings, it is worthwhile to note that several estimated coefficients are significant, and that the R-squared values are fairly high, indicating that the econometric model explains a large part of the variation in violence.
A number of results stand out.
First, previous violence in an area appears to increase the likelihood of more violence across all forms of violence, grouped together, but not for separatist violence—a finding that is statistically significant.
The analysis also shows that it is important who controls local government and whether that person belongs to a political clan. The incidence rate of all violent incidents is lower in areas where the incumbent mayor and governor belong to the same political clan. At the same time, it is higher in areas where the incumbent mayor and vice-mayor are related by blood or marriage. Possibly, clan members who occupy different levels of local government are better positioned to manage or control violence and conflicts than if they were drawing powers and resources from the same local government. The incidence rate of all violence is lower in places where the incumbent mayor was re-elected in the 2013 ARMM elections. Possibly, this indicates better performance among those who were given a new mandate. In contrast, the person in power in local government does not have the same effect on the level of separatist violence, suggesting that this type of violence is affected by other factors.
While the person in power matters, there is no support for the hypothesis that local government spending, or the provision of social services and education, has any effect on all violence or separatist violence. The paper finds no evidence that fiscal allocations to local authorities (internal revenue allotments, IRA) per capita, social services spending, or the percentage of population with elementary education affects the incidence violence.
The econometric tests also find evidence of negative spillover effects. Specifically, as more and more of the surrounding areas experience election-related violence, the local incidence rate of all violence declines. Another special pattern relates to interior municipalities—those without access to the sea—
which tend to have lower incidence rates of all types of violence. In contrast, cities have higher rates. This may be because of greater ease of mobility in these areas, because of greater economic competition and use of force for pecuniary purposes, or because cities and well-off areas are better places for organized groups to effectively show off their strength.124 Island municipalities and mainland municipalities do not appear to have divergent incidence rates. Municipalities in Maguindanao tend to have lower incidence rates of violence than Tawi-Tawi or Sulu. This indicates that the pocket of peace in Tawi-Tawi, which has lower levels of violence than other parts of the Bangsamoro, is driven by fundamental factors that can be measured and assessed.
Turning to the narrower category of separatist violence, some interesting differences come out. First, the model explains less of the variation between areas in rates of insurgent violence than is the case for all violence, as evident from the lower R-squared value. Only two independent variables come out as significant: the prevalence of overall violence in neighboring areas and being located on an island. Both of these variables has a negative coefficient and are associated with lower levels of separatist violence. This is evidence of negative spillover effects for separatist violence. As more and more of the surrounding areas encounter other types of violence, the incidence rate of separatist conflicts in the locality, decreases. The regression analysis also identifies a difference between island and mainland areas. Relative to municipalities with coastal boundaries, interior municipalities tend to have lower incidence
Usefulness of the VIMS
Capuno’s analysis is tentative. It identifies correla-tions rather than causal factors. The analysis goes some way towards explaining patterns of violence but other work—probably qualitative in nature—would be needed to establish exactly why some factors are related with increases or decreases in violence.
However, the analysis also shows the extent to which econometric analysis can lead to interest-ing findings that merit further exploration. It also shows how it is important to disaggregate types of violence for different factors that seem to be associated with different types.

54
5.2 CLIMATE, GLOBAL WARMING, AND LOCALIZED VIOLENCE: FINDINGS FROM INDONESIA Methods
The relationship between climate shocks and human conflict and violence is the subject of sub-stantial scholarly and policy attention. Numerous studies have found that increases in temperature and volatility in rainfall raise the risk of sub-national violence, from spontaneous criminal violence to the onset of civil war.125 Unantici-pated changes in rainfall—including floods and droughts—similarly increase the risk of violence. These patterns are commonly attributed to two mechanisms: direct, physiological responses and indirect, economic disruption. However, most work does not directly test this. Further, there is little work on how different forms of violence react to changes in in the same setting. Austin Wright and Patrick Signoret evaluate the relationship between climate and violence and disentangle the role of physiological versus economic mech-anisms in the context of Indonesia.126 To do this they rely on NVMS matched with high-resolution climatic, consumer price, and agricultural data. They also use downscaled simulations of climatic conditions in Indonesia over the next century, produced by the Intergovernmental Panel on Cli-mate Change (IPCC), to estimate future violence risks associated with climate change.
To assess the overall impact on violence from climate shocks, defined as an increase or fall in temperature or rainfall of more than one standard deviation, an ordinary least square regression model is estimated.127 The sub-district, of which there are 6,543 in Indonesia, is the unit of analysis.
Findings: links between climate and violence
Table 5.2 presents results showing consistent evidence of a link between temperature shocks and violence. Signs of the estimated coefficients indicate the direction of the impact of a temperature or rain shock on violence.
The six month lags of temperature shocks reveal some important insights. Here, the level of violence is compared with the climate conditions six months prior, allowing for a half year period between the weather shock and a subsequent change in the level of violence. (These results are reported in Table 5.2 as models with a six-month lag). Positive temperature shocks (where temperature gets substantially hotter than normal) increase the frequency of interpersonal violence at least 20% more than comparable negative shocks (where temperature gets colder) reduce similar acts of violence. One implication is that we can expect a general increase in violence as average temperatures increase.
Non-economic violent crime Economic violent crime Separatist violence
Est. Std error Est. Std error Est. Std errorPositive temperature shock 0.0781 (0.0724) 0.0137 (0.0349) -0.0349*** (0.00726)Negative temperature shock -0.104** (0.0529) 0.0109 (0.0254) 0.000869 (0.00964)Positive temp. shock, 6 month lag 0.0707* (0.0403) 0.0363* (0.0204) -0.0142*** (0.00346)Negative temp. shock, 6 month lag -0.0575** (0.0278) -0.0237** (0.00946) 0.0126*** (0.00437)
Positive rain shock 0.0966 (0.0591) -0.0366 (0.0245) -0.0287*** (0.0101)Negative rain shock -0.218** (0.0894) 0.0198 (0.0354) -0.0307*** (0.0108)Positive rain shock, 6 month lag 0.0685*** (0.0252) -0.0110 (0.00926) 0.0100*** (0.00337)Negative rain shock, 6 month lag -0.110** (0.0535) 0.00728 (0.0222) -0.0284*** (0.00527)N 675524 675524 675524R-squared 0.0944 0.0145 0.0599Note: Figures in parentheses are robust clustered errors. ***p<0.01, **p<0.05, *p<0.10
Table 5.2: Temperature, rainfall, and violence, Indonesia

55
The results further confirm that, over comparable periods, the climatic factors driving interpersonal violence are distinct from those influencing sepa-ratist violence.
For non-economic violent crime, a negative tem-perature shock leads to a decrease in violent inci-dents. There is no statistically significant increase associated with higher temperatures.
For separatist violence, the picture is the opposite. Warm weather shocks are associated with lower violence in both the short and long term. Cold weather shocks increase incidents of separatist vi-olence in the long run. In the short term, positive and negative rainfall shocks appear to disrupt in-surgent violence. During periods with higher than usual rainfall, mobility of combat units may be limited. Insurgents are also less likely to operate during dry, arid periods of the year.
Increased rainfall does not have any significant impact on overall violence in the short-term, but increases violence in the long term. Separatist violence is negatively affected by any variation in rainfall, whether it is an increase or decrease.
These findings highlight three main points. First, the immediate, within-month effect of tempera-ture shocks on non-economic violence is substan-tial only to the extent that low temperatures lead to lower levels of violence. The impact from high temperatures comes at a later stage as we find an
increased risk of violence six months after. The impact of temperature shocks on criminal activity also comes with a lag as the level of economic violent crime increases some time after abnormal-ly high temperatures. Second, separatist violence is less frequent as temperatures increase, which is inconsistent with previous findings. Third, the ef-fects of rainfall on overall violence is statistically significant but the direction of the impact varies considerably across each form of violence and measure of precipitation, leaving a mixed picture of the impact of sudden changes in rainfall.
Findings: mechanisms
To disentangle the mechanisms by which climate impacts violence, and to estimate the role of physiological versus economic mechanisms in Indonesia, Wright and Signoret analyzed the price effect on key agricultural staples from climate shocks. The purpose was to identify the share of changes to the level of violence that can be attributed to economic factors, assuming that the remaining changes are due to physiological reasons. The impact from weather shocks on agricultural prices has an important effect on the economic status of a large share of the Indonesian population, as more than one-third of the labor force is directly employed in agriculture.128 Food prices also have a substantial impact on the welfare of those employed in other sectors or outside of the labor market.
All Consumers Producers, in season
Est. Std error Est. Std error Est. Std errorPrice Index, lag 0.964*** (0.0078) 0.951*** (0.0098) 0.974*** (0.00446)
Positive temperature increase 0.169 (0.107) 0.226* (0.133) 0.0436 (0.125)Negative temperature increase 0.356*** (0.0937) 0.441*** (0.113) 0.554*** (0.141)Positive temp. increase, 6 month lag 0.0546** (0.0233) 0.0268 (0.0397) 0.0584* (0.0304)Negative temp. increase, 6 month lag -0.0646** (0.0241) -0.0877*** (.0.0283) -0.0376 (0.0307)
Positive rain increase 0.169 (0.121) 0.228* (0.119) 0.487** (0.223)Negative rain increase 0.252* (0.132) 0.287* (0.152) 0.0152 (0.155)Positive rain increase, 6 month lag 0.0129 (0.0235) 0.0266 (0.039) -0.0843* (0.0491)Negative rain increase, 6 month lag 0.00180 (0.0456) -0.0709 (0.0475) 0.0201 (0.0436)N 616406 243551 224673R-squared 0.998 0.999 0.998Note: Figures in parentheses are robust clustered errors. ***p<0.01, **p<0.05, *p<0.10
Table 5.3: Temperature, rainfall shocks, and price dynamics, Indonesia

56
Non-economic violent crime Economic violent crime Separatist violence
Est. Std error Est. Std error Est. Std errorPrice Index -0.0121*** (0.00164) 0.00142** (0.000599) -0.00926*** (0.000414)Positive temperature shock 0.151** (0.0714) 0.0167 (0.0282) -0.0370*** (0.00608)Negative temperature shock -0.200*** (0.0652) -0.00903 (0.0262) 0.0177 (0.0144)Positive temp. shock, 6 month lag 0.114*** (0.0225) 0.0342*** (0.0342) -0.00793*** (0.00221)Negative temp. shock, 6 month lag -0.0568*** (0.0191) -0.0128* (0.00732) 0.0229*** (0.00304)
Positive rain shock 0.0656 (0.0713) -0.0425 (0.0259) -0.0249** (0.0109)Negative rain shock -0.305*** (0.0752) -0.00412 (0.0301) -0.0360*** (0.0122)Positive rain shock, 6 month lag 0.103*** (0.0217) -0.00264 (0.00813) 0.0157*** (0.00337)Negative rain shock, 6 month lag -0.135*** (0.0299) 0.00239 (0.0117) -0.0296*** (0.00436)N 616406 616406 616406Cragg-Donald F 922949 922949 922949Hansen J 74.11 93.89 373.50Note: Figures in parentheses are robust clustered errors. ***p<0.01, **p<0.05, *p<0.10
The analysis identifies a clear impact of weather shocks on agricultural prices. Variation in rice- and soybean-producing sub-district climate con-ditions explain substantive movement in regional consumer prices. Weather shocks in areas that do not produce agricultural goods for local markets do not have an impact of the same magnitude.
The findings show how climate variability in producing areas leads to changes in regional consumer prices. When studying the impact on prices six months after the temperature shock (see values for six month lags in Table 5.3), the effect is clear.
When comparing the regression results for all sub-districts and for the ones with net agricultural producers, Table 5.3 shows similar values. This indicates that climatic conditions in agricultural sub-districts drive overall developments in con-sumer prices for agricultural goods.
The projected impact of climate change on climatic variability and, by extension, violence are substantial (Table 5.4). Climate simulations show that temperatures across sub-districts will increase by roughly one degree Celsius
across all months, with maximum temperatures significantly exceeding current conditions.129 The analysis projects an increase in violent crime by a minimum of 4%, equivalent to more than 2,000 additional assaults per year. A high estimate puts the increase at 4,000 assaults per year. Within-year rainfall variation will increase significantly over the next 80 years. These changes will exacerbate the impact of dry and wet seasons on staple commodity production, especially food stuffs, increasing violence.
Usefulness of the VIMS
The findings speak to vital questions about how policy-makers might mitigate the impacts of cli-mate shocks as well as anticipated climate change dynamics. Understanding how climatic factors directly increase the risk of criminal and com-munal violence helps illuminate how local actors respond during heat waves, as well as drought, and food scarcity conditions.
Climate induced economic instability, measured through changes in local consumer prices, increases the frequency of most forms of violence. Economic interventions could be used to mitigate
Table 5.4: Estimation of impact from climate induced price change on violence, Indonesia

57
unstable prices, including investments in market integration to avoid sudden changes to prices for agricultural commodities that are due to local variations in weather.
The VIMS data were vital in allowing for this analysis. The fine-grained measures of different types of violence, including smaller-scale crimi-nal violence, allowed the authors to tease out the differing ways in which climate change affects violence. The ability to disaggregate violence levels to the local level allowed for the comparison of very small geographic units.
5.3 FISCAL PROGRAMS AND VIOLENCE: FINDINGS FROM THAILAND’S DEEP SOUTH
Methods
Substantial fiscal spending programs have been a key component of the Thai Government’s efforts to end the conflict in its southernmost provinces. This policy has been combined with suppression of militants using military and police force. Only in February 2013, after more than nine years of conflict, was an open political process initiated as a first round of peace dialogue meetings was held. Even with the emergence of a political dialogue between the government and separatist groups, the special budget program targeting the conflict-affected provinces remains a key policy for ending the conflict.
Despite the importance of the special budget in the government’s strategy, little analysis has been undertaken of the program’s impact. The lack of studies is somewhat surprising given the large funds spent. Since 2004, a total of Thai baht (THB) 322 billion ($9.2 billion) has been allocated, or about THB 190,000 ($5,400) per person living in the conflict-affected region. This is more than one dollar per day, per person for the 12 years of conflict, and this spending is in addition to standard government spending allocated to all Thai provinces.
Anders Engvall and Srisompob Jitpiromsri used time-series econometrics to investigate the link between the southern Thai economy and violent outcomes. To estimate how Thailand’s Deep South conflict is affected by economic conditions, and the impact of fiscal stimulus on the level of violence, an econometric model of the Deep South economy was estimated. Other economic factors were controlled for to isolate the effect of government spending. As the Deep South is primarily a rural economy, with substantial reliance on natural rubber, the impact of sometimes-volatile price changes to this key commodity is included in the time-series model.
One advantage of using time series methods in this context is that it becomes feasible to address the potential direction of causality. Variations in economic conditions might impact the level of violence, but there might also be a feedback loop by which violence impacts the economy. So identifying the direction of causality will be an important aspect of the analysis.
Findings
Figure 5.1 reports budget allocations by year130 and ministry, together with information on the number of violent incidents. It shows that the size of the special budget and its allocation by ministry varied substantially between 2004 and 2016. A major increase in the budget occurred between 2007 and 2009, with funds nearly doubling. A substantial share of the increase was allocated to the Ministry of Defense which took on responsibility for many development programs in the conflict-affected region. In 2010, the budget was slashed, almost returning to the level before the expansion; since then, it has seen a step-by-step increase, with the 2016 budget of THB 30 billion, being the largest since the outbreak of violence. Recent increases in budget allocations have largely gone to the Ministry of Interior and Internal Security Operations Command (ISOC), under the Prime Minister’s Office (Central Budget), plus spending on special projects primarily implemented by the military.

58
Figure 5.1 shows a clear inverse relationship between the level of violence, measured as the number of violent incidents by calendar year, and the size of the budget.131
While not aspiring to be a comprehensive evaluation of the fiscal effectiveness or economic impact of the special budget for the Deep South provinces, the analysis indicates that fiscal years with an increase in spending are associated with lower levels of violence.
The correlation between fiscal spending and violence could be due to the improved local economic conditions resulting from increased inflows of government funds. A substantial share of the government programs is used to provide employment to locals. While the productivity of these jobs can be questioned, the programs do ensure stable incomes and keep young males busy. This group could otherwise be targeted for recruitment into the separatist movements. There are additional mechanisms, too, by which increased spending potentially improves local economic conditions and lowers support for the insurgency movement, including increased productivity from improvements to infrastructure and investments in public education.
As further analyzed by Engvall and Jitpiromsri, using time-series econometrics and controlling for other potential factors influencing the level of violence in the Deep South, the relationship is robust.132
Figure 5.2 presents further evidence of the link between budget allocations and the level of violent incidents, showing that there is a strong, negative correlation between budget size and lagged levels of violence. The size of the special budget for the Deep South provinces explains a full 46.8% of the annual variation in violence.
Usefulness of the VIMS
The sheer size of the annual special budget means that it has a clear impact on the local economy in the Deep South provinces. The size of the budget allocation determines the number and size of investments in infrastructure, government employment, and provincial growth rates. While the full impact of the budget allocation on economic outcomes needs further study, this analysis of the time variation in violence following shifts in the size of the budget gives suggestive indications that fiscal spending has a role in conflict management, and that improved economic conditions are associated with lower numbers of violent incidents. The VIMS data were useful in carrying out this analysis.

59
35,000
30,000
25,000
20,000
15,000
10,0000 500 1,000 1,500 2,000 2,500
Violent Incidents 1-Year Lag
Sout
hern
Fis
cal A
lloca
tion
(MTH
B)
R2 = 0.46816
35,000
30,000
25,000
20,000
15,000
10,000
5,000
0
2004
2005
2006
2007
2008
2009
2010
2011
2012
2013
2014
2015
2016
Annu
al S
peci
al S
outh
ern
Budg
et (M
THB)
Num
ber of Violent Incidents
2,500
2,000
1,500
1,000
500
0
Other
Justice
Finance
Social Dev./Human Security
State OwnedEnterprises
Public Health
Transport
Agriculture
Education
Defence
Interior
Central Budget
Violent Incidents
Figure 5.1: Annual special budget and violent incidents, Thailand’s Deep South
Figure 5.2: Link between budget allocations and violent incidents, Thailand’s Deep South

60
6. CONCLUSIONS
Preventing, managing, and responding to violence requires solid data. Having accurate information on where violence is occurring, what is causing it, the forms it takes, who is involved in it, and its impacts, is key to reducing violence.
This paper has made a number of points, which are worth restating here.
First, the cross-country datasets, while providing a very important service for those who want to compare countries, under-report the levels and impacts of violence in Southeast Asia. When only including types of violence that are recorded in ACLED or UCDP-GED, the three VIMSs record 2 to 3 times as many incidents, and up to 2.7 times as many fatalities as UCDP-GED (the difference in reported deaths is much lower for ACLED). The subnational conflicts in Aceh, the Bangsamoro, and Thailand’s Deep South are, or have been, much more intense than was previously thought. Using local sources is vital if we want to more accurately capture the levels and impacts of violence in Southeast Asian countries.
Second, the paper has shown that recording a range of types and forms of violence beyond large-scale, organized, political violent conflict can be useful when trying to understand why violence is occurring. Using the Indonesia, Philippines, and Thailand VIMS datasets, we have shown that patterns of violence are complex within subnational conflict areas. Much of the violence that occurs does not link directly to the master narrative that drives the subnational conflict. We find strong evidence to support the increasing emphasis in the academic literature that conventional ways of understanding subnational conflict are inadequate. Lowering levels of violence in subnational conflict areas does not only require dealing with separatist violence but also requires
Unfortunately, existing multi-country datasets are limited in the extent to which they can provide this information for policymakers and practitioners working on, and in, specific countries. While the cross-country violence datasets provide useful data for making comparisons between countries or subnational regions, the sources they use, which are far removed from the locations where violence actually occurs, mean that they do not capture all of the violence they seek to track. In focusing largely on larger-scale, escalated forms of violence, these datasets leave out many other types of violence which, cumulatively, can have extremely large human impacts. And focusing on a more limited subset of violent incidents means they are not fully able to show how different types of violent contention inter-link, and how violence can evolve over time.
This paper has showcased three new country-specific Violent Incidents Monitoring Systems (or VIMS) which seek to fill these gaps. The systems all use local data sources, which improves data accuracy and ensures that smaller-scale incidents are captured. They all record information at a highly disaggregated geographic level, and record a large number of variables for each incident. They also all capture a wide range of types and forms of violence, allowing for highly granular analyses. As this paper has shown, the VIMSs can be used both for analyzing violence within countries and for comparing violence across different countries.

61
addressing other horizontal tensions between groups, along with crime. The Bangsamoro and Papua cases, in particular, show that much of the violence that occurs does not relate to vertical state-periphery tensions. Within each case, we find considerable variation in the types and forms of violence that are occurring between different areas.
Third, the paper has demonstrated that collecting a wide range of types of violence allows for an understanding of how violence evolves as areas move up and down the spectrum of conflict-to-peace transition. In Aceh, we saw that deaths plunged and separatist violence almost disappeared after a 2005 peace accord. However, other forms of violence increased. It is plausible that if, and when, Thailand’s Deep South or the Bangsamoro moves towards more consolidated peace that they will follow a similar trajectory. Understanding and tracking this requires violence datasets that include a wide range of forms of violence.
Fourth, we have shown how having gender-disaggregated victim statistics can allow for a more nuanced understanding of how violence impacts the local population. While men are more likely to be victims of all kinds of violence except domestic violence, the extent to which women are killed varies from place to place, and by type of violence. Often this relates to the tactics employed by belligerents. In Thailand’s Deep South, for example, the use of bombs by insurgents means women are more likely to be victims of separatist violence than is the case elsewhere. The findings can lead to practical actions. If groups in Thailand’s Deep South want to lower risks to women, one strategy in addition to supporting safe spaces would be to work to ensure that bombing is not a tactic used by insurgent groups.
The descriptive data outlined in Section 4 allowed for a more detailed understanding of patterns and
trends of violence in the subnational conflict areas. Using the VIMS datasets for multi-variate analyses can help establish what is driving violence. The VIMSs offer a number of advantages over cross-country datasets in this respect.
First, the under-reporting of even escalated forms of violence in ACLED and UCDP-GED mean that analyses of the correlates and causes of violence using either of the datasets may lead to erroneous findings. If the outcome variable (levels of violence or deaths from violence) is not measured accurately, then conclusions generated from econometric analysis run the risk of being inaccurate, too.
Second, including a wide range of types and forms of violence within the VIMS datasets allows for more nuanced findings. There is consensus that different forms of violence may have different drivers. This is one reason why the cross-country datasets include a more limited set of political violent incidents. Yet showing how different causal factors shape different types of violence in different ways requires datasets that include a wide range of violence types. Two of the three analyses presented (on Indonesia and the Philippines) provide empirical evidence of how different factors interact differently with different kinds of violence. The VIMSs all allow for the generation of multiple different outcome variables. The data can thus be easily used to generate comparative analyses of the causes of different types of violence.
The three analyses summarized in Section 5 focus on the impacts of different things on violence: climate shocks (Indonesia), fiscal expenditures (Thailand), along with a wider range of factors in the Philippines. Each analysis is preliminary and a work in progress. But they show that there is much promise in using VIMS datasets to try to get a better understanding of why violence of different types occurs.

62
In conclusion, VIMSs do not aim to replace the cross-country datasets. While in some respects, VIMSs have advantages over the global databases, they also have inherent limitations: each focuses on just one country (or an area within a country). The paper has shown that there are possibilities for cross-country analysis. But, unless VIMSs are established around the world, more extensive cross-country comparisons will not be possible. And even if they are, there is a need to ensure that protocols on the methodologies to be used, codes to employ, etc., are developed to ensure that data can be compared.
As such, there is a need for a dialogue between those running the cross-country datasets and those running VIMSs. Ideally, VIMS data can feed into the global datasets; and, in parallel, these datasets (the codes they use, the types of violence they include) can be modified to allow for some of the deeper analyses along the lines of what has been undertaken in this paper. Developing more VIMSs in more countries, while working on a global protocol for VIMSs, could help extend the possibilities for comparative work—important work that lies ahead. With support from the World Bank, IDRC and DFID, the Asia Foundation has supported the establishment of a network of practitioners across Southeast Asia. A priority should be to expand this network to those in other Asian countries who are interested in setting up similar systems, but also to others involved in violence monitoring in other regions, such as Africa or South America. Finally, greater coordination between donors would be helpful in supporting this agenda. As highlighted by SDG 16, violence data is a global public good on par with poverty data or Human Development Indicators. A global financing mechanism to fund the collection of violence data and the establishment of common protocols for data collection, would be an important step forward.

63

64
REFERENCES
Asian Development Bank (2011). Asia 2050: Realizing the Asian Century. Manila: Asian Development Bank. http://www.adb.org/sites/default/files/publication/28608/asia2050-executive-summary.pdf
Anderson, Bobby (2015). Papua’s Insecurity: State Failure in the Indonesian Periphery. Policy Studies no. 73. Honolulu: East-West Center.
Andreas, Peter (2004). “Criminalized Legacies of War: The Clandestine Political Economy of the Western Balkans.” Problems of Post-Communism 51(3): 3–9.
Askew, Marc (2007). Conspiracy, Politics and a Disorderly Border: the Trouble to Comprehend Insurgency in Thailand’s Deep South. Policy Studies no. 29. Washington, DC: East-West Center.
Aspinall, Edward (2009). Islam and Nation: Separatist Rebellion in Aceh, Indonesia. Stanford, CA.: Stanford University Press.
Barron, Patrick (2009). “Peace without Reintegration: Lessons for DDR Theory and Practice from Aceh,” in Small Arms Survey (eds.) Small Arms Survey 2009: Shadows of War. Cambridge: Cambridge University Press, pp. 248-283.
Barron, Patrick (2014). “Barriers to the Consolidation of Peace: The Political Economy of Post-Conflict Violence in Indonesia.” Dissertation. University of Oxford.
Barron, Patrick, Sana Jaffrey, and Ashutosh Varshney (forthcoming). “When Large Conflicts Subside: The Ebbs and Flows of Violence in Post-Suharto Indonesia.” Journal of East Asia Studies.
Barron, Patrick and Joanne Sharpe (2005). “Counting Conflicts: Using Newspaper Reports to Understand Violence in Indonesia.” Indonesian Social Development Papers no. 7. Jakarta: World Bank.
Beeck, Christine (2007). “Re-paving the road to peace: Analysis of the implementation of the DD&R in Aceh province, Indonesia.” BICC Brief no. 35. Bonn: Bonne International Center for Conversation (BICC).
Bertrand, Jacques (2004). Nationalism and Ethnic Conflict in Indonesia. Cambridge: Cambridge University Press.
Boyle, Michael J. (2012). “Revenge and reprisal in Kosovo”, in Asti Suhrke and Mats Berdal (eds.) The Peace in Between: Post-war Violence and Peacebuilding. London: Routledge, pp. 95-116.
Burma News International (2013). Deciphering Myanmar’s Peace Process: A Reference guide 2013. Chiang Mai: Wanida Press. http://www.burmalibrary.org/docs14/Deciphering-Myanmar-Peace-Process-ocr-tu-red.pdf.
Capuno, Joseph (2016). “An econometric analysis of the incidence of conflicts in Southern Philippines.” Background paper for this paper.
Cederman, Lars-Erik and Kristian Skrede Gleditsch (2009). “Introduction to Special Issue on ‘Disaggregating Civil Wars’.” Journal of Conflict Resolution 53 (4): 487-495.
Collier, Paul, Anke Hoeffler, and Mans Soderbom (2008). “Post-Conflict Risks.” Journal of Peace Research 45(4): 461-478.
Cook, Malcolm and Kit Collier (2006). “Mindanao: A Gamble Worth Taking.” Lowy Institute Paper no. 17. Sydney: Lowy Institute.
Croicu, Mihai and Ralph Sundberg (2015). “UCDP GED Codebook version 4.0.” Department of Peace and Conflict Research, Uppsala University. http://www.pcr.uu.se/research/ucdp/datasets/ucdp_ged/
Engvall, Anders and Magnus Andersson (2014). “The Dynamics of Conflict in Southern Thailand.” Asian

65
Economic Papers 13(3): 169–189.
Engvall, Anders and Srisompob Jitpiromsri. (2016). “The Impact of Fiscal Spending on the Southern Thai Conflict.” Background paper for this paper.
Geneva Declaration Secretariat (2015). Global Burden of Armed Violence 2015: Every Body Accounts. Geneva: Geneva Declaration Secretariat.
Good, Byron J., Mary-Jo M. D. Good, Jesse J. H. Grayman, and Matthew Lakoma (2007). Psychosocial Needs Assessment of Communities in 14 Conflict-Affected Districts in Aceh. Jakarta: International Organisation for Migration.
Hsiang, Solomon and Marshall Burke (2014). “Climate, conflict, and social stability: what does the evidence say?” Climate Change 123(1): 39-55.
Hsiang, Solomon, Marshall Burke and Edward Miguel (2013). “Quantifying the influence of climate on human conflict.” Science 341:6151.
International Alert (2014). Rebellion, Political Violence and Shadow Crimes in the Bangsamoro: The Bangsamoro Conflict Monitoring System (BCMS), 2011–2013. Manila: International Alert.
Institute for Policy Analysis of Conflict (2015). “The Current Status of the Papuan Pro-Independence Movement.” Jakarta: Institute for Policy Analysis of Conflict.
International Crisis Group (ICG) (2004). “Southern Philippines Backgrounder: Terrorism and the Peace Process.” Asia Report no. 80.
International Crisis Group (ICG) (2006). “Aceh’s Local Elections: The Role of the Free Aceh Movement (GAM).” Asia Briefing no. 57. Jakarta/Brussels: ICG.
International Crisis Group (ICG) (2007). “Indonesia: How GAM Won in Aceh.” Asia Briefing no. 61. Jakarta/Brussels: ICG.
International Crisis Group (ICG) (2008a). “Indonesia: Pre-Election Anxieties in Aceh.” Asia Briefing no. 81. Jakarta/Brussels: ICG.
International Crisis Group (ICG) (2008b). “The Philippines: Counter-insurgency vs. Counter-terrorism in Mindanao.” Asia Report no. 152. Jakarta/Brussels: ICG
International Crisis Group (ICG) (2009a). “Indonesia: Deep Distrust in Aceh as Elections Approach.” Asia Briefing no. 90. Jakarta/Brussels: ICG.
International Crisis Group (ICG) (2009b). “The Philippines: After the Maguindanao Massacre.” Asia Briefing no. 98. Jakarta/Brussels: ICG.
International Crisis Group (ICG) (2011). “Hope and Hard Reality in Papua.” Asia Briefing no. 126. Jakarta/Brussels: ICG.
International Crisis Group (ICG) (2012). “Dynamics of Violence in Papua.” Asia Report no. 232. Jakarta/Brussels: ICG.
Isaac, Jeffrey C. (2012). “New Approaches to the Study of Violence.” Perspectives on Politics 10(2): 235-241.
Jitpiromsri, Srisompob and Duncan McCargo (2010). “The Southern Thai Conflict Six Years On: Insurgency, Not Just Crime.” Contemporary Southeast Asia 32(2): 156-183.
Kalyvas, Stathis N. (2003). “The Ontology of ‘Political Violence’: Action and Identity in Civil Wars.” Perspectives on Politics 1(03): 475-94.
Kalyvas, Stathis N. (2004). “Warfare in civil wars,” in Jan Angstrom and Isabelle Duyvesteyn (eds.) Rethinking the Nature of War. Abingdon: Routledge, pp. 88-108.
Kalyvas, Stathis N. (2006). The Logic of Violence in Civil War. Cambridge: Cambridge University Press.
Klinken, Gerry van (2007). Communal Violence and Democratization in Indonesia. London: Routledge.
Liow, Joseph Chinyong and Don Pathan (2010). Confronting ghosts: Thailand’s shapeless southern insurgency. Lowy Institute Paper no. 30. Sydney: Lowy Institute for Public Policy.

66
McCargo, Duncan (2008). Tearing apart the land: Islam and legitimacy in southern Thailand. Ithica, NY and London: Cornell University Press.
McCargo, Duncan (2011). Mapping national anxieties: Thailand’s southern conflict. Copenhagen: NIAS Press.
McCoy, Alfred (ed.) (2009). An Anarchy of Families: State and Family in the Philippines. Madison: University of Wisconsin Press.
McKenna, Thomas (2008). Muslim Rulers and Rebels: Everyday Politics and Armed Separatism in the Southern Philippines. Berkeley: University of California Press.
Multistakeholder Review (MSR) (2010). Multistakeholder Review of Post-Conflict Programming in Aceh. Jakarta and Aceh: MSR.
National Statistics Directorate Timor-Leste (2010). Timor-Leste Demographic and Health Survey 2009-10 (Dili: Timor-Leste Ministry of Finance, 2010), 228, http://microdata.worldbank.org/index.php/catalog/1500.
Nordstrom, Carolyn (2004). Shadows of War: Violence, Power, and International Profiteering in the Twenty-First Century. London: University of California Press.
Parks, Thomas, Nat Colletta, and Ben Oppenheim (2013). The Contested Corners of Asia: Subnational Conflict and International Development Assistance. Bangkok and San Francisco: The Asia Foundation.
Palaung Women’s Organization (2011). “Voices for Change: Domestic Violence and Gender Discrimination in the Palaung Area”, November 25, 2011.
Philippine Statistical Authority (2010). Census of Population and Housing. Manila: PSA.
Pierskalla, Jan, and Audrey Sacks (2016). “Unpacking the Effect of Decentralization on Local Conflict: Lessons from Indonesia”. Working paper.
Poling, Gregory, Phoebe DePadua, and Jennifer Frentasia (2013). “The Royal Army of Sulu invades Malaysia.” Center for Strategic and International Studies. https://csis.org/publication/royal-army-sulu-invades-malaysia
Radio Free Asia (2014). “Half a Million Cambodians Affected by Land Grabs: Rights Group.” http://www.rfa.org/english/news/cambodia/land-04012014170055.html
Raleigh, Clionadh and Caitriona Dowd (2016). “Armed Conflict Location and Event Data Project (ACLED) Codebook 2016.” http://www.acleddata.com/wp-content/uploads/2016/01/ACLED_Codebook_2016.pdf
Raleigh, Clionadh, Andrew Linke, Håvard Hegre, and Joakim Karlsen (2010). “Introducing ACLED-Armed Conflict Location and Event Data.” Journal of Peace Research 47(5): 651-660.
Reid, Anthony (2008). “The Aceh Conflict: A long-term view for long-term solutions.” Annex to Multistakeholder Review (MSR) (2010). Multistakeholder Review of Post-Conflict Programming in Aceh. Jakarta and Aceh: MSR. Available at: <https://www.conflictanddevelopment.org/index.php?option=com_content&view=article&id=492%253AAnnexes+of+MSR+report&catid=1&lang=en> (accessed 17 October 2012).
Rodgers, Dennis (2003). “Dying for It: Gangs, Violence, and Social Change in Urban Nicaragua, 1997-2002.” LSE-DESTIN Development Research Center Crisis States Programme Working Paper no. 35. London: DRC.
Rodgers, Dennis (2006). “The State as a Gang: Conceptualizing the Governmentality of Violence in Contemporary Nicaragua.” Critique of Anthropology 26(3): 315-330.
Samset, Ingrid (2012). “Sexual violence: the case of eastern Congo”, in Asti Suhrke and Mats Berdal (eds.) The Peace in Between: Post-war Violence and Peacebuilding. London: Routledge, pp. 229-247.
Schulze, Kirsten E. (2004). The Free Aceh Movement (GAM): Anatomy of a Separatist Organization. Policy Studies no. 2. Washington, D.C.: East-West Center.
Schiavo-Campo, Salvatore and Mary Judd (2005). “The Mindanao Conflict in the Philippines: Roots, Costs and Potential Peace Dividend.” Social Development Papers, Conflict Prevention and Reconstruction. Washington, DC: World Bank. http://siteresources.worldbank.org/INTCPR/214578-1111996036679/20482477/WP24_Web.pdf.
Sidel, John (2006). Riots, Pogroms, Jihad: Religious Violence in Indonesia. Ithica, NY: Cornell University Press.

67
Small Arms Survey (2007). Small Arms Survey 2007: Guns and the City, Cambridge: Cambridge University Press and Karp, A. 2007. “Completing the Count: Civilian firearms”.
Suhrke, Astri and Mats Berdal (eds.) (2012). The Peace in Between: Post-War Violence In Between: Post-war Violence and Peacebuilding. Abingdon: Routledge.
Sundberg, Ralph, Kristine Eck, and Joakim Kreutz (2012). “Introducing the UCDP non-state conflict dataset.” Journal of Peace Research 50(4): 523-532.
Sundberg, Ralph and Erik Melander (2013). “Introducing the UCDP Georeferenced Event Dataset”. Journal of Peace Research 50(4): 523-532.
Tadjoeddin, Mohammad Zulfan (2002). “Anatomy of Social Violence in the Context of Transition: The Case of Indonesia.” Working Paper 02/01. Jakarta: UN Support Facility for Indonesian Recovery.
Torres III, Wilfredo Magno (ed.) (2014). Rido: Clan Feuding and Conflict Management in Mindanao. Manila: Ateneo de Manila University Press.
The Asia Foundation, World Bank, International Development Research Center, The Habibie Center, and Deep South Watch (2016). VIMS: Violent Incidents Monitoring Systems, A Toolkit. Bangkok: The Asia Foundation.
United Nations Development Program (UNDP) (2014). Advancing Human Development Through the ASEAN Community: Thailand Human Development Report. Bangkok: UNDP.
United Nations Office on Drugs and Crime (UNODC) (2014). Global Study on Homicide 2013: Trends, Contexts, Data. Vienna: UNODC. http://www.unodc.org/gsh/
Varshney, Ashutosh (2002). Ethnic Conflict and Civic Life: Hindus and Muslims in India. New Haven: Yale University Press.
Varshney, Ashutosh, Mohammad Zulfan Tadjoeddin, and Rizal Panggabean (2010). “Patterns of Collective Violence in Indonesia,” in Ashutosh Varshney (ed.) Collective Violence in Indonesia. Boulder, CO.: Lynne Rienner, pp. 19-50.
Vitug, Marites Danguilan and Glenda M. Gloria (2000). Under the Crescent Moon: Rebellion in Mindanao Manila: Institute for Popular Democracy.
Wright, Austin and Patrick Signoret (2016). “Climate Shocks, Price Dynamics, and Violence: Evidence from Indonesia.” Background paper for this paper.

68
ENDNOTES1. In this paper, all dollars are US dollars.
2. Data from the World Bank. http://povertydata.worldbank.org/poverty/region/EAP
3. Asian Development Bank (2011).
4. Subnational conflicts have occurred in Myanmar, Indonesia, Papua New Guinea, the Philippines, Thailand, and Timor-Leste (when it was part of Indonesia). They have been absent in Cambodia, the Lao People’s Democratic Republic (Lao PDR), Vietnam, Malaysia, Singapore, and Brunei. Data from Parks, Colletta, and Oppenheim (2013).
5. Croicu and Sundberg (2015). See the discussion below on why the UCDP-GED dataset likely under-reports fatalities in SNC areas.
6. More information on the systems is provided in a related methodological toolkit, VIMS: Violent Incidents Monitoring Systems, A Toolkit, by The Asia Foundation et al. (2016). These short descriptions of the three VIMSs have been adapted from the toolkit.
7. For example, see the World Bank’s Country Parnership Framework for the Republic of Indonesia 2015.
8. For background, see Aspinall (2009).
9. Throughout the paper, we refer to these areas as the Bangsamoro.
10. A World Bank study estimated the economic cost of the conflict from 1970-2001 to be as high as $2-3 billion (Schiavo-Campo and Judd 2005).
11. For the period up to the 1996 peace agreement, see Vitug and Gloria (2000).
12. MNLF troops were also integrated into the security forces: 5,750 into the Armed Forces of the Philippines and 1,500 into the police.
13. On the rise of the MILF in the 1970s and 1980s, see McKenna (1998). Regarding the late 1990s and early 2000s in Central and Western Mindanao, see ICG (2004, 2008b) and Cook and Collier (2006).
14. The Framework Agreement on the Bangsamoro, signed in Manila, 15 October 2012. http://www.opapp.gov.ph/resources/framework-agreement-bangsamoro and the Comprehensive Agreement on the Bangsamoro, signed in Manila, 27 March 2014, http://www.opapp.gov.ph/milf/news/comprehensive-agreement-bangsamoro
15. For useful background on Thailand’s Deep South conflict, see Askew (2007), Liow and Pathan (2009), and McCargo (2011).
16. Jitpriromsri and McCargo (2010).
17. McCargo (2009).
18. Data collection has recently started in selected towns in two more provinces: North Cotabato and Lanao del Norte. However, data are not yet available for these places.
19. Data from Parks, Colletta, and Oppenheim (2013, p. 17) and raw data from the Philippine Statistical Authority (2010).
20. Parks, Colletta, and Oppenheim (2013, p. 18).
21. Reid (2008).
22. Adapted and updated from Parks, Colletta, and Oppenheim (2013). This paper explains the methodology (p. 152, footnote 31; pp. 15-16). In short, according to the authors, conflicts need to have appeared in two of three datasets (the UCDP, the Heidelberg Conflict Barometer, and the Minorities at Risk project) to be deemed active in a given year.
23. High levels of progress are in places where a peace settlement has been reached, implemented in large part, and large-scale violence has not recurred. Moderate levels of progress are places where a peace settlement, or elements of it, has been reached, but implementation has not yet occurred, and there is a high risk of violence recurring. Low levels of progress are places where a peace settlement has not been reached and high levels of violence continue.

69
24. Data is from the Indonesian NVMS, summarized in Barron (2014). Klinken (2007), Bertrand (2004), and Sidel (2006) provide more analysis.
25. Burma News International (2013).
26. Ibid.
27. Radio Free Asia (2014).
28. One recent case was a clash in Phuket between Rawai beach villagers and 100 men hired by investors. http://www.phuketgazette.net/phuket-news/Dozens-injured-violent-clash-Phuket-sea-gypsy/62990#ad-image-0
29. For example, the clash between police and local protesters related to the Thailand-Malaysia gas pipeline case, in Jana district, Thailand. http://www.ethicsinaction.asia/archive/2011-ethics-in-action/vol.-5-no.-1-february-2011/sorrows-of-jana-residents-the-seizure-of-wakaf
30. ICG (2009b). On political family rivalry in the Philippines, see McCoy (2009).
31. National Statistics Directorate Timor-Leste (2010).
32. Based on an interview with a member of the National Human Rights Commission (Thailand). Reported in “Statistics of Domestic Violence from 2007-2013,” Isranews, 26 December 2013, http://www.isranews.org/isranews-short-news/item/26186
33. Palaung Women’s Organization (2011).
34. UNODC (2014).
35. Ibid.
36. Other global datasets exist, but they focus solely on terrorist incidents. For a summary of existing datasets see http://www.acleddata.com/wp-content/uploads/2015/10/Conflict-Datasets-Typology-Overview-Regional1.pdf
37. Croicu and Sundberg (2015).
38. Sundberg and Melander (2013).
39. Croicu and Sundberg (2015).
40. http://www.acleddata.com/wp-content/uploads/2016/01/ACLED_Codebook_2016.pdf
41. ACLED materials note that Asia data have been collected from 2010 on, but those data do not appear to be publically available. Raleigh, Linke, Hegre, and Karlson (2010).
42. See the methodological annex to the last Secretariat report, available at http://www.genevadeclaration.org/fileadmin/docs/GBAV3/GBAV3-Methodological-Annexe.pdf The 2015 report includes information from the Indonesian National Violence Monitoring System.
43. This is also true for other global homicide datasets. The UNODC study (2014) only disaggregates deaths by three forms—interpersonal, socio-political, and criminal—meaning that the underlying drivers of violence cannot be analyzed. Information is on overall patterns of violence rather than on specific incidents. https://www.unodc.org/gsh/
44. Neither Indonesia nor the Philippines are currently included in ACLED. So comparisons between the NVMS and BCMS with ACLED cannot be made.
45. Excluded events include: “phenomena such as ‘rioting’ or demonstrations that turn violent (since these instances often fail to show a high enough level of organization), as well as clashes between police/army and individuals and/or groups that are armed but not particularly organized” (Sundberg and Melander 2013, p. 525). More information on the definition used is given in Sundberg, Eck, and Kreutz (2012).
46. We used the ‘actor’ variable in the NVMS to determine whether actors were organized or not. We included militia, political parties, religious groups, mass organizations, military, police, military police, security forces, separatists, and students. We did not include civilians as an actor as these are usually, although not always, unorganized. Note that other more or less conservative filters were used to match the NVMS data with UCDP-GED criteria: for example, by using violence forms instead of actor types, or a combination of both, to isolate ‘organized violence’. In all cases, the filtered NVMS data still counted considerably higher numbers of incidents and deaths over the period 1998-2014 (between two and five times as many incidents, and between 1.4 and three times as many deaths).
47. This is because the nature of violence in Aceh has changed since the end of the civil war, with most incidents showing relatively little organization. See Section 4.

70
48. These provinces are Aceh, West Kalimantan, Central Kalimantan, Maluku, North Maluku, East Nusa Tenggara, Papua, West Papua, and Central Sulawesi.
49. ACLED only started covering Thailand recently, and the quality of their coverage is likely to improve in the future. Our findings cannot be generalized to the work done by ACLED in other countries and regions it has covered for a longer period of time. It is also important to note that ACLED has made very commendable efforts to increasingly incorporate local sources across the board.
50. Violent events include the following: battles between two armed groups; riots—defined as violent demonstrations; violence by armed groups against civilians; and remote violence—for example, bombings and improvised electronic device (IED) attacks. In some instances, non-violent events, such as protests, are included. Raleigh and Dowd (2016).
51. Communication with Clionadh Raleigh, Washington D.C, March 2016.
52. The DSID initially focused only on insurgency-related incidents but, since 2014, it has expanded to include other forms of violence except domestic violence.
53. The DSID count was also adjusted to account for differences in the way each system aggregates same-day events. ACLED often counts as a single incident similar events happening on the same day, while DSID counts them as separate events. Finally, we eliminated events where insufficient information was provided on the identity or motives of perpetrators to establish whether the event could be categorized as political violence as per ACLED’s definition. In 46 cases, events that were eliminated from the DSID data because they did not match ACLED criteria, were in fact reported by ACLED: these events were discarded from both datasets. A complete methodological note on the steps the authors went through to compare the two datasets is available at http://www.asiafoundation.org/tag/violence-monitoring. The ACLED dataset is publicly available and the DSID will become accessible online in the second half of 2016. The data comparison exercize as presented in this section revealed that there is opportunity for implementers of VIMSs and global datasets to further fine-tune violent incidence inclusion criteria and parameters in order to enhance cross-dataset compatibility and comparability.
54. The BCMS was filtered to include only incidents that resulted in at least one fatality and involved at least one “organized” actor (such as by the MILF, MNLF, Bangsamoro Islamic Freedom Fighters (BIFF), New People’s Army (NPA), Abu Sayyaf Group, police, army, private militias, etc.). The UCDP-GED was filtered to include only events that occurred in the BCMS coverage area: the five provinces of Maguindanao, Lanao Sur, Basilan, Sulu, and Tawi-Tawi, plus the cities of Cotabato and Isabela.
55. UCDP/PRIO Georeferenced Events Dataset Codebook, Version 3.0.
56. The UCDP’s data on Thailand in 2014 were based on: Associated Press (6 incidents), BBC (14 incidents), Reuters (5 incidents), Bangkok Post (43 incidents), and The Nation (3 incidents). All are English-language sources; the first three are global newswires, and the other two are Bangkok-based, English-language, national papers. No local media or NGO reports were used.
57. ACLED’s data on Thailand in 2015 were based on only three news sources: Bangkok Post (125 incidents), The Nation (22 incidents), and Khaosod English (3 incidents). All are English-language publications based in Bangkok—the first two are print newspapers and the third is an online publication. Compared to Thai language papers, many of which have a network of reporters in all provinces of the country, English-language publications carry less provincial news, as well as less news on the Deep South conflict.
58. Tadjoeddin (2002).
59. See Varshney, Tadjoeddin, and Panggabean (2010).
60. Barron and Sharpe (2005).
61. Geneva Declaration Secretariat (2015).
62. Sundberg, Eck, and Kreutz (2012).
63. Kalyvas (2003, p. 486). Barron, Jaffrey, and Varshney (forthcoming) provide a further discussion in the context of the Indonesian National Violence Monitoring System.
64. Suhrke and Berdal (2012); Nordstrom (2004); and Barron (2014).
65. Boyle (2012).
66. Samset (2012).
67. Rodgers (2013, 2016).
68. Andreas (2004).

71
69. In the context of this paper, “Papua” refers to the entire region of western Papua, comprising the two Indonesian provinces of Papua and West Papua. “Papua province” refers to the province.
70. This discussion, and Figure 4.1, is adapted from Parks, Colletta, and Oppenheim (2013). Note that consolidated peace does not mean the complete absence of violence—something which is apparent from looking at the case of Aceh, which is explored throughout this section.
71. Note that the three countries studied here are all of middle income status. It may be that patterns of violence are different in SNC areas in low income countries such as Myanmar. Thanks to Pamornrat Tansanguanwong for this point.
72. Importantly, BCMS data for the Bangsamoro is not available for years before 2011 so we do not have information on levels of violence for that period.
73. Although, as explored below, much of the violence in recent years does not directly relate to the separatist conflict.
74. At this time (mid 2016), Thai data were only available for the years since 2008. Data for earlier years is currently being cleaned. Once these data are available, probably around August 2016, it will be possible to analyze the rapid escalation after the outbreak of large-scale violence in 2004.
75. Libya: 50.3; Syria: 36.3; Iraq: 37.7. (Geneva Declaration 2015). Geneva Declaration data include all deaths, not just those related to conflict.
76. Furthermore, as discussed in Section 4, some areas within the Bangsamoro and Thailand have seen exceptionally high death rates.
77. The DSID will be extended to also cover the 2004-2007 period, with a new version of the dataset to be released in the second half of 2016.
78. See Kalyvas (2004).
79. Kalyvas (2006). Because of this, he argues that civil wars and civil war violence need to be decoupled. He notes that “the game of record [i.e. the master narrative of the conflict] is not the game on the ground [i.e. the types of violence, and the motivations that drive it, that actually occur]” (p. 5).
80. Parks, Colletta, and Oppenheim (2013).
81. The three VIMS all collect detailed information on the types of violence, allowing analysts to both assess how violent conflict is manifested in each area as well as study differences over time and space. The coding for the types of violence in Indonesia, Thailand, and the Philippines differ, but there are sufficient similarities between the systems to create standardized categories for the types of violence, as displayed below. The categories cover the main types of violence found in the three systems: separatist conflict between organized insurgency groups and the government; governance conflict, primarily of a local nature; resource conflict, often over land or intrusive extractive industries such as mines; electoral violence; violence related to elections or competition for political positions; violent crime, drug trafficking, kidnapping for ransom, and other illicit economic activities; popular justice, whereby civilians attack suspected criminals, grouped together with violence perpetrated by law enforcement organizations; identity-based conflict involving ethnic or religious groups; and domestic violence within the family or in other close relationships.
82. In Aceh between 1998 and 2014,94% of all violent deaths occurred before the end of 2005 (10,525 out of 11,204 deaths).
83. BCMS data related to violence types must be used with caution. Of the incidents recorded by the BCMS during the period 2011-2014, 40.1% were categorized as “undetermined”, which means they could not be assigned a specific violence type. Data on causes are missing for 38% of deaths in the dataset. This is partly a consequence of the BCMS’s reliance on Philippine National Police reports as its main data source. Police reports tend to contain precise factual information on violent incidents, but do not capture the types of issues that triggered them.
84. Torres III (2014).
85. The classification into guns, bombs, and other types of violence is based on the Manifest variable from the BCMS. The Weapons variable has not been used as it does not have standardized coding.
86. Interview with Srisompob Jitpiromsri, 13 May 2016.
87. Small Arms Survey (2007).
88. Other areas affected by large-scale communal violence also saw high rates of fatalities from guns, but the proportion of deaths from shootings was still lower than in Aceh. In Maluku province, which saw escalated violence from 2000-2002, half of the deaths in this time period were from shootings.

72
89. ICG (2007).
90. Barron (2009), Beeck (2007).
91. This is tracked in the Aceh Conflict Monitoring Updates and Aceh Peace Monitoring Updates, put out by the World Bank in the early years of the peace process. See, for example, http://documents.worldbank.org/curated/en/2007/07/8522632/aceh-conflict-monitoring-update-june-july-2007. Barron (2014) also provides a discussion and data.
92. See ICG (2006, 2008a, and 2009a) on election-related violence.
93. The year 2016 has seen a reversal, with an increase in separatist violence.
94. Data are only shown since 2008. Data for earlier years are still being cleaned.
95. This shift in the nature of violence could not have been identified if the DSID dataset did not allow for the disaggregation of fatalities by actor type. This highlights the importance of capturing a broad range of information when monitoring violence. Soon to be released data for early 2016 show that there has been a recent rise in violence.
96. An umbrella group, MARA Patani, was formed to act as a common negotiating body for insurgent groups with the Thai government. The legitimacy of the group, and the extent to which different insurgent movements buy into it, is contested.
97. Increases in government spending in the south may also have played a role. See Section 5.3 below.
98. On violence dynamics and development issues in Papua, the Indonesian state’s response, and issues with the implementation of special autonomy arrangements, see: ICG (2011, 2012); Institute for Policy Analysis of Conflict (2015); and Anderson (2015).
99. UNODC (2014).
100. Not all districts are presented on the chart.
101. Tribal conflict is a subset of the identity violence type presented in Figure 4.20. Land and labor-related disputes are subsets of the resources violence type. For the sake of clarity and simplicity, only main violence types recorded by the NVMS dataset are presented in the chart.
102. See Section 5.3.
103. See Engvall and Andersson (2014).
104. See UNDP (2014) for poverty comparisons, and Engvall and Andersson (2014) for an analysis of poverty and violence in the south.
105. Parks, Colletta, and Oppenheim (2013).
106. Poling, DePadua, and Frentasia (2013).
107. International Alert (2014).
108. Ibid.
109. Note: excludes deaths with undetermined type.
110. The share of all deaths in the province reduced from the conflict to post-conflict periods in Aceh Timur (14% down to 11%), Bireuen (14% to 11%), and Aceh Utara (19% to 11%). It stayed the same in Lhokseumawe (4%). It increased in Aceh Besar (8% to 12%).
111. Barron (2014).
112. MSR (2009).
113. The rise of violence in Aceh Selatan in 2002 and 2003 coincided with GAM’s attempts to expand its influence from its east coast strongholds to other areas of the province. This involved hiring thugs and other opportunists with a taste for violence, with the result that GAM was more coercive and ill-disciplined in areas such as Aceh Selatan where it did not have an historical presence (Schulze 2004, p. 17; Good et al. 2007, p. 16).
114. Since the end of 2015, 7% of deaths in Aceh have occurred in Aceh Tenggara, despite the district being home to just 4% of the population.
115. In the NVMS, all violent deaths have been assigned gender information and 99.8% of the deaths in DSID have information on the gender of the victim. For BCMS, only 42.7% of deaths include gender data. This is due to legal limitations on the collection of this information in the Philippines. The analysis presented here provides basic information. More in-depth research on gendered impacts using the data from VIMSs should be done.
116. Note that the VIMS in Bangsamoro and Southern Thailand do not collect data on domestic violence. As such, it is likely that the share of deaths from violence in those areas is higher than shown in the graph.

73
117. For example, Collier, Hoeffler, and Soderbom (2008) analyze why some countries revert to civil war after periods of peace, identifying factors such as national elections and national levels of economic development.
118. See, for example, Varshney (2002).
119. For this reason, Isaac (2012), and other contributors to a special edition of the journal, Perspectives on Politics, call for the inclusion of a wide range of forms of violence within the same research studies.
120. See the discussion in Section 3.
121. It should be noted that econometric work with VIMS data is in its infancy and the analyses presented here are a work in progress. Other examples of academic research using VIMS data include Jan Pierskalla and Audrey Sacks (2016).
122. Capuno (2016).
123. In 2015, the average municipality/city in the dataset had a population of just above 61,000, and an area of almost 600 km2.
124. Thanks to Assad Baunto for these observations.
125. Hsiang, Burke, and Miguel (2013) and Hsiang and Burke (2014) provide reviews.
126. Wright and Signoret (2016).
127. For details on the econometric model, see Wright and Signoret (2016).
128. The latest 2014 figures from the World Bank’s World Development Indicators.
129. Based on downscaled simulations of climatic conditions in Indonesia over the next century, produced by the Intergovernmental Panel on Climate Change (IPCC).
130. The Thai fiscal year runs from 1 October-30 September.
131. Comparing the incidents during calendar years with the spending during the fiscal year implies a three-month lag, as the fiscal year starts in October.
132. For technical details see the full background paper. Engvall and Jitpiromsri (2016).


The Asia Foundation is a nonprofit international development organization committed to improving lives across a dynamic and developing Asia. Informed by six decades of experience and deep local expertise, our programs address critical issues affecting Asia in the 21st century—governance and law, economic development, women’s empowerment, environment, and regional cooperation.
Better data is needed to improve our understanding of and response to conflict and violence, both in Asia and beyond. It will also be needed to monitor progress against the violence reduction targets set by the Sustainable Development Goals. The Foundation is supporting the development of locally owned and operated violence monitoring systems in Asia. Understanding Violence in Southeast Asia: The Contribution of Violent Incidents Monitoring Systems highlights how these systems can push forward the frontier of violence research. A companion piece – Violent Incidents Monitoring Systems: A Methods Toolkit – provides methodological guidance to establish this type of system.
UNDERSTANDING VIOLENCE IN SOUTHEAST ASIA
THE CONTRIBUTION OF VIOLENT INCIDENTS MONITORING SYSTEMS