understanding the twist-bend nematic phase: the
TRANSCRIPT

This journal is©The Royal Society of Chemistry 2016 Soft Matter, 2016, 12, 6827--6840 | 6827
Cite this: SoftMatter, 2016,
12, 6827
Understanding the twist-bend nematic phase: thecharacterisation of 1-(4-cyanobiphenyl-40-yloxy)-6-(4-cyanobiphenyl-40-yl)hexane (CB6OCB) andcomparison with CB7CB†
Daniel A. Paterson,a Min Gao,b Young-Ki Kim,b Afsoon Jamali,b Kirsten L. Finley,c
Beatriz Robles-Hernandez,c Sergio Diez-Berart,c Josep Salud,c
M. Rosario de la Fuente,d Bakir A. Timimi,e Herbert Zimmermann,f Cristina Greco,g
Alberta Ferrarini,g John M. D. Storey,a David O. Lopez,c Oleg D. Lavrentovich,b
Geoffrey R. Luckhurste and Corrie T. Imrie*a
The synthesis and characterisation of the nonsymmetric liquid crystal dimer, 1-(4-cyanobiphenyl-40-yloxy)-6-
(4-cyanobiphenyl-40-yl)hexane (CB6OCB) is reported. An enantiotropic nematic (N)–twist-bend nematic (NTB)
phase transition is observed at 109 1C and a nematic–isotropic phase transition at 153 1C. The NTB phase
assignment has been confirmed using polarised light microscopy, freeze fracture transmission electron
microscopy (FFTEM), 2H-NMR spectroscopy, and X-ray diffraction. The effective molecular length in both
the NTB and N phases indicates a locally intercalated arrangement of the molecules, and the helicoidal
pitch length in the NTB phase is estimated to be 8.9 nm. The surface anchoring properties of CB6OCB
on a number of aligning layers is reported. A Landau model is applied to describe high-resolution heat
capacity measurements in the vicinity of the NTB–N phase transition. Both the theory and heat capacity
measurements agree with a very weak first-order phase transition. A complementary extended molecular
field theory was found to be in suggestive accord with the 2H-NMR studies of CB6OCB-d2, and those
already known for CB7CB-d4. These include the reduced transition temperature, TNTBN/TNI, the order
parameter of the mesogenic arms in the N phase close to the NTB–N transition, and the order parameter
with respect to the helix axis which is related to the conical angle for the NTB phase.
1. Introduction
The nematic phase, N, is the simplest but technologically mostimportant liquid crystal phase. The rod-like molecules in theN phase are anisotropically distributed but on average tend topoint in the same direction known as the director. If theconstituent molecules are chiral then the chiral nematic phase,N*, is observed. At the molecular level, the N and N* phases are
indistinguishable but in the N* phase, the director traces out ahelix with an axis perpendicular to the director. A third nematicis represented by so-called blue phases, in which the twistpropagates along two axes. A fourth nematic phase, the biaxialnematic phase, NB, has been discovered in lyotropic systemsbut has yet to be observed unequivocally in a low molar massthermotropic liquid crystal.1
The recent discovery of a fifth nematic phase, the twist-bendnematic phase, NTB, has understandably caused considerableexcitement. This was predicted by Meyer,2 and by Dozov3 whoproposed that certain mesogenic molecules might have atendency to pack into bent structures. Pure uniform bend inspace is impossible, thus the spontaneous bend must beaccompanied by other deformations of the local director, eithertwist or splay, giving rise to the so-called twist-bend nematic, orsplay-bend nematic, respectively. In the NTB phase the directorexhibits periodic twist and bend deformations forming a conicalhelix with doubly degenerate domains having opposite handedness.The director is tilted with respect to the helical axis, and hence, itmay be considered as the generalised case of the conventional
a Department of Chemistry, School of Natural and Computing Sciences,
University of Aberdeen, Meston Building, Aberdeen, AB24 3UE, UK.
E-mail: [email protected] Liquid Crystal Institute and Chemical Physics Interdisciplinary Program,
Kent State University, Kent, OH 44242, USAc Department of Physics, Polytechnic University of Catalonia, Barcelona, Spaind Department of Applied Physics II, University of the Basque Country,
E-48080 Bilbao, Spaine Chemistry, University of Southampton, Highfield, Southampton, SO17 1BJ, UKf Max-Planck-Institut fur Medizinische Forschung, D-69120 Heidelberg, Germanyg Dipartimento di Scienze Chimiche, Universita di Padova, via Marzolo 1,
35121 Padova, Italy
† Electronic supplementary information (ESI) available. See DOI: 10.1039/c6sm00537c
Received 1st March 2016,Accepted 11th July 2016
DOI: 10.1039/c6sm00537c
www.rsc.org/softmatter
Soft Matter
PAPER
Ope
n A
cces
s A
rtic
le. P
ublis
hed
on 1
1 Ju
ly 2
016.
Dow
nloa
ded
on 1
1/23
/202
1 1:
33:3
4 PM
. T
his
artic
le is
lice
nsed
und
er a
Cre
ativ
e C
omm
ons
Attr
ibut
ion
3.0
Unp
orte
d L
icen
ce.
View Article OnlineView Journal | View Issue

6828 | Soft Matter, 2016, 12, 6827--6840 This journal is©The Royal Society of Chemistry 2016
N* phase in which the director is orthogonal with respect to thehelical axis, see Fig. 1. The NTB phase is a particularly fascinatingand unique phase for a number of reasons, not least because it isspontaneously chiral although composed of effectively achiralmolecules. This qualification requires some explanation since aconstituent molecule being flexible exists in a range of conformers.These occur in pairs which are related by a mirror plane and haveequal probabilities; consequently the conformationally averagedstructure is achiral.4
The NTB phase was first identified for 1,7-bis-4-(40-cyano-biphenyl) heptane, CB7CB,5 and the assignment confirmed usingfreeze fracture transmission electron microscopy (FFTEM).6,7 CB7CBis an example of a liquid crystal dimer comprising moleculescontaining two mesogenic units linked by a flexible spacer.8,9
The para axes of the two cyanobiphenyl mesogenic units in anodd-membered dimer are inclined with respect to each otherwhen the spacer is in the all-trans conformation, and this bentmolecular shape which exists for most other conformers isthought to be a prerequisite for the formation of the NTB phase.
Only a limited number of other liquid crystal dimers havebeen reported to show the NTB phase.10–19 Additional examplesof twist-bend nematogens include two liquid crystal trimers,20,21
and a rigid bent-core liquid crystal.22 Given this small setof known twist-bend nematogens, we have yet to developand understand the empirical relationships linking molecularstructure to the formation of the NTB phase. Even at this earlystage, however, it does appear clear that a bent molecular shape,most often achieved by using methylene linkages between thespacer and mesogenic units, is a prerequisite for the observationof the NTB phase,23 and this view is supported by predictionsmade using a generalised Maier–Saupe theory modified to takeinto account the bent molecular architecture by assuming aV-shaped particle, and the twist-bend modulation of thedirector.24 This predicts that the NTB–N transition temperatureis particularly sensitive to the molecular bend angle, defined asthe angle between the mesogenic arms, and that the NTB phase isonly seen for a limited range of bend angles. The bent molecularshape yields not only the thermodynamically stable NTB phasebut also a standard nematic with anomalously small bendelastic constants.6,19,24 The latter feature leads to interesting
electro-optical effects in a nematic doped with chiral dopants,such as electrically controlled selective reflection of light.25 TheNTB phase is not necessarily preceded by a nematic phase, andan example of a NTB–I transition has recently been reported for apure dimer where the transition results from reducing the spacerlength to just three methylene groups.26 It has also been foundto be possible to induce a NTB–I transition for a dimer havingnine methylene groups by the addition of a chiral dopant.27
In an attempt to clarify the relationships between theformation of the NTB phase and molecular structure, and inparticular to the molecular curvature, here we describe thetransitional properties of a nonsymmetric liquid crystal dimer,1-(4-cyanobiphenyl-40-yloxy)-6-(4-cyanobiphenyl-40-yl)hexane, andrefer to this using the acronym CB6OCB. The nonsymmetry inthis molecule arises from the differing nature of the linksbetween the mesogenic units and flexible spacer. At one endof the spacer the link is an ether group while at the other it is amethylene unit. As we will see, CB6OCB exhibits the twist-bendnematic phase and this is characterised in detail using a rangeof techniques. In Section 3.1 we investigate the phase behaviourof CB6OCB using modulated DSC, polarised light microscopyand X-ray diffraction and this reveals an enantiotropic NTB–Nphase transition. The chirality of the NTB phase is confirmedusing NMR spectroscopy in Section 3.5. In Section 3.2, we studythe surface anchoring properties of CB6OCB on a number ofalignment layers. The NTB phase assignment is confirmed inSection 3.3 using FFTEM. In Section 3.4, we describe the NTB–Nphase transition of CB6OCB using a Landau approach andextract the thermodynamic properties. In Section 3.5 we measurethe chirality, a defining quantity of the NTB phase, and theorientational order of the N and NTB phases for CB6OCB-d2.The orientational order of CB6OCB is compared with thatof CB7CB which are surprisingly different given the smalldifference in chemical structure of the dimers. Finally, in Section3.6 a molecular field theory is described to better understand thephase behaviour of CB6OCB and how it relates to that of thestructurally similar CB7CB.
2. Experimental2.1. Synthesis
The syntheses of CB6OCB and CB6OCB-d2 are described indetail in the ESI.†
2.2. Modulated differential scanning calorimetry (MDSC)
Modulated differential scanning calorimetry (MDSC) measurementswere performed according to two main procedures in order to obtainheat capacity data. To study the overall thermal behaviour ofCB6OCB measurements were performed at heating and coolingrates of 1 K min�1, a temperature amplitude of 0.5 K and a periodof 60 s. To study the critical behaviour of the NTB–N and N–I phasetransitions, measurements were carried out very slowly using heating
Fig. 1 Schematic representations of (a) the nematic (N) phase, (b) thechiral nematic (N*) phase, and (c) the twist-bend nematic (NTB) phase.
Paper Soft Matter
Ope
n A
cces
s A
rtic
le. P
ublis
hed
on 1
1 Ju
ly 2
016.
Dow
nloa
ded
on 1
1/23
/202
1 1:
33:3
4 PM
. T
his
artic
le is
lice
nsed
und
er a
Cre
ativ
e C
omm
ons
Attr
ibut
ion
3.0
Unp
orte
d L
icen
ce.
View Article Online

This journal is©The Royal Society of Chemistry 2016 Soft Matter, 2016, 12, 6827--6840 | 6829
and cooling rates of 0.01 K min�1, a temperature amplitude of 0.07 Kand a period of 23 s.
2.3. X-ray diffraction
X-ray diffraction patterns were obtained at several temperaturesusing a Panalytical X’Pert Pro diffractometer (lCuKa = 1.54 Å) ina step scanning mode (2y range from 0.51 to 301). An OxfordCryosystem was used as a temperature controller for the samplewhich consisted of a glass capillary tube (0.5 mm diameter)filled with liquid crystal, spinning around the y-axis during theexperiment.
2.4. Optical studies
Flat glass cells were used to explore the optical textures andestablish the transitional behaviour of CB6OCB. The cell thick-ness, d, was set by glass spacers attached with UV-glue NOA 65(Norland Products, Inc.). All of the experiments were performedabove the crystallization temperature to avoid a possible memoryeffect.28 The temperature was controlled by a LTS350 hot stagewith a TMS94 controller (both Linkam Instruments) with 0.01 Kaccuracy. The typical rate of temperature change was between�0.10 K min�1 and �1.00 K min�1 to minimize the effects ofthermal expansion on textures.29–31
2.5. Freeze fracture transmission electron microscopy(FFTEM)
To prepare the replica for FFTEM studies, CB6OCB was heatedto the isotropic phase and cooled slowly to 368 K to obtain theNTB phase. The sample was then rapidly frozen in liquidnitrogen and fractured at 123 K in a BalTec BAF060 freezefracture apparatus. The fractured surface was replicated by thedeposition of Pt/C (4 nm in thickness) at 451, followed by thedeposition of a 20 nm carbon film. The replica was collected oncarbon coated TEM grids and observed using a FEI Tecnai F20TEM. Detailed experimental procedures can be found elsewhere.32
2.6. Deuterium NMR spectroscopy
The deuterium (2H) NMR spectra of CB6OCB-d2 were measuredusing a Varian Chemagnetics 400 MHz spectrometer operatingat 61.54 MHz with a magnetic field strength of 9.40 T. Thesample of the dimer was placed in a short NMR tube which wasplaced orthogonal to the field. A single pulse of 6 ms durationwas used with a 0.08 s delay between pulses. 4000 FIDs wereaccumulated into 4096 words of computer memory with a spectralwindow of 149.9 kHz. The temperature of the sample was controlledvia a Chemagnetics Temperature Controller to �0.2 K.
2.7. Molecular structure calculations
The geometric parameters and torsional potentials of CB6OCBand CB7CB were determined by quantum mechanical (QM)DFT calculations.33 This information was then used to generatemolecular conformations by Monte Carlo sampling. Fig. 2 showsthe molecular structure of the two compounds, as obtainedfrom geometry optimizations at the DFT/B3LYP/6-31G** levelof theory. These calculations provided values for bond lengthsand bond angles. The bond angle CarOC in the ether linkage is
equal to 1191, whereas the bond angle CarCC in the methylenelinkage is equal to 1131 (Car is the aromatic carbon).
The bonds that were allowed to rotate are shown by arrowsin Fig. 2; the corresponding dihedral angles are denoted by wi.The torsional potential for the biphenyl twist angle (w0 and w9)was deduced from the literature.34 It is characterized by fourequivalent minima located at B�351 and B�1451, and energybarriers of about 8 kJ mol�1 for planar and perpendiculararrangement of the rings. For all other dihedrals, torsionalpotentials were obtained by DFT calculations on representativemolecular fragments. Calculations were performed at theDFT/B3LYP/6-31G** level of theory, with the exception of thew6 dihedral of CB6OCB, for which the MP2/6-31G** level wasused. The torsional potential for the Car–Car–C–C dihedrals(w1 and w8 in CB7CB, w1 in CB6OCB) exhibits two equivalentminima at �901, corresponding to perpendicular arrangementof the phenyl ring with respect to the Car–C–C plane; barriers ofabout 4 kJ mol�1 are found for nearly planar configurations.Two equivalent minima were also found for the Car–Car–O–Cdihedral (w8 in CB6OCB), but these are located at 01 and 1801,corresponding to a coplanar arrangement of the phenyl ringand the Car–O–C plane; the minima are separated by energybarriers of B14 kJ mol�1 located at �901. These results are inagreement with those reported in the literature for ethyl- andethoxybenzene at the DFT/B3LYP/6-311G(2d,p) level of theory.35
The C–C–C–C dihedrals wi (i = 3–6 for CB7CB, i = 3–5 forCB6OCB) and the Car–C–C–C dihedrals (w2 and w7 in CB7CB, w2
in CB6OCB) exhibit minima for the trans (1801), gauche + (B+651)and gauche� (B�651) states with the trans state more stablethan the gauche states respectively by DVC–C–C–C
gt B 3.5 kJ mol�1
and DVCar–C–C–Cgt B 2 kJ mol�1. The Car–O–C–C dihedral
(w7 in CB6OCB) exhibits an absolute minimum for the transstate; relative minima are found at �801, which are higher inenergy than the trans one by about 6 kJ mol�1. Well-defined transand gauche minima were found also for the O–C–C–C dihedral(w6 in CB6OCB), with the gauche states (w6 B �621) more stablethan the trans state by DVO–C–C–C
gt B�3 kJ mol�1. This reversal ofthe gauche–trans stability order is in keeping with that reported inthe literature for 1,3-dimethoxypropane, where it was suggested
Fig. 2 Molecular structure of CB6OCB (top) and CB7CB (bottom) havingthe spacer in the all-trans conformation, as determined by geometryoptimization (DFT/B3LYP/6-31G**). The arrows indicate the dihedralangles (wi) that were allowed to rotate for the conformational sampling.
Soft Matter Paper
Ope
n A
cces
s A
rtic
le. P
ublis
hed
on 1
1 Ju
ly 2
016.
Dow
nloa
ded
on 1
1/23
/202
1 1:
33:3
4 PM
. T
his
artic
le is
lice
nsed
und
er a
Cre
ativ
e C
omm
ons
Attr
ibut
ion
3.0
Unp
orte
d L
icen
ce.
View Article Online
6830 | Soft Matter, 2016, 12, 6827--6840 This journal is©The Royal Society of Chemistry 2016
that this so-called gauche effect may result from favourableelectrostatic interactions between the oxygen atom and the CH2
group.36
In Monte Carlo (MC) conformational sampling, at each movea certain (random) number of dihedral angles was changed bya random rotation: the resulting conformation was acceptedor rejected on the basis of its torsional energy, according tothe Metropolis criterion.37 MC sampling of the full torsionalpotential was performed for all angles, with the exception of thebiphenyl twist angle, for which the RIS approximation wasadopted.38 Structures having pairs of atoms closer than a cut-off distance of 0.82s, where s is the sum of their van der Waalsradii, were discarded. In this way sterically hindered conforma-tions were rejected. van der Waals radii equal to 0.185 nm (C),0.15 nm (N and O), and 0.1 nm (H) were assumed.39
For each molecular conformation, calculation of the meanfield potential requires the definition of the molecular surface.This was generated using the library MSMS,40 with a probesphere radius of 0.3 nm and a density of vertices of 5 �2. Thesame van der Waals radii used for the cutoff distance wereassumed.
3. Results and discussion3.1. Phase behaviour of CB6OCB
Fig. 3 shows the dependence of the heat capacity on tempera-ture for a sample of CB6OCB which had previously been cooledfrom the isotropic phase measured with an underlying heating/cooling rate of 1 K min�1. On heating, three transitions areevident, a strong first order transition at 373 K, a weak first-order transition at 382 K and a first-order transition at 426 K.The enthalpy changes associated with these transitions will bediscussed in detail later. On cooling from the isotropic phase, acharacteristic nematic Schlieren texture develops containing
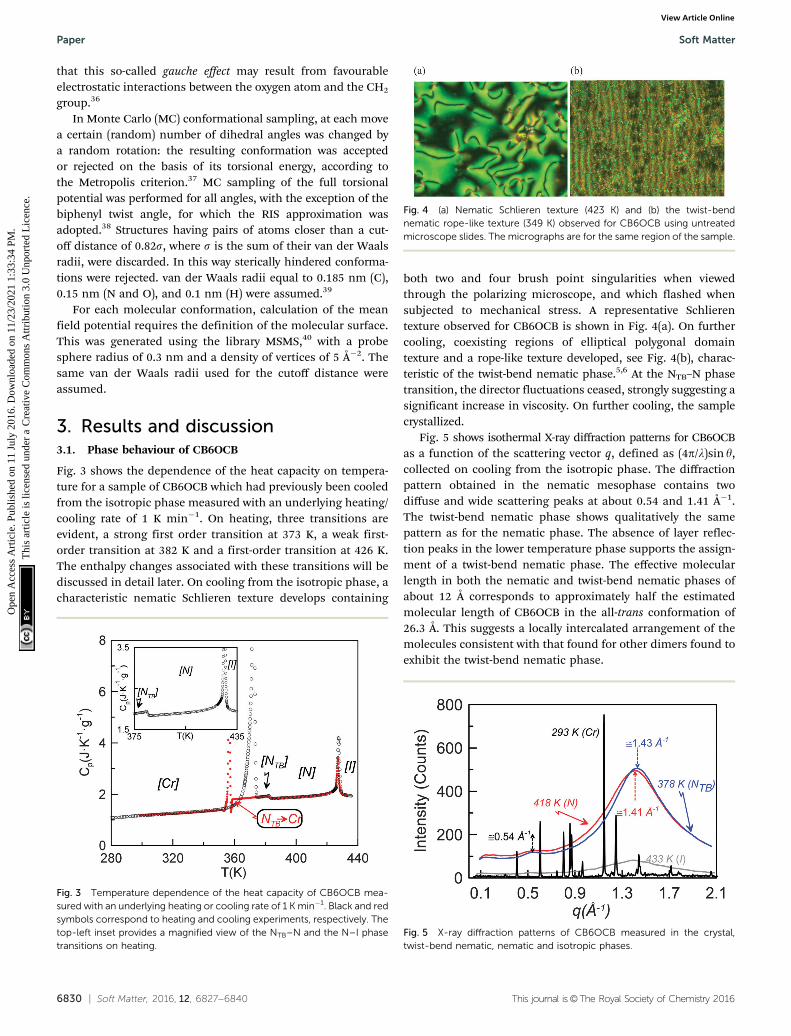
both two and four brush point singularities when viewedthrough the polarizing microscope, and which flashed whensubjected to mechanical stress. A representative Schlierentexture observed for CB6OCB is shown in Fig. 4(a). On furthercooling, coexisting regions of elliptical polygonal domaintexture and a rope-like texture developed, see Fig. 4(b), charac-teristic of the twist-bend nematic phase.5,6 At the NTB–N phasetransition, the director fluctuations ceased, strongly suggesting asignificant increase in viscosity. On further cooling, the samplecrystallized.
Fig. 5 shows isothermal X-ray diffraction patterns for CB6OCBas a function of the scattering vector q, defined as (4p/l)sin y,collected on cooling from the isotropic phase. The diffractionpattern obtained in the nematic mesophase contains twodiffuse and wide scattering peaks at about 0.54 and 1.41 Å�1.The twist-bend nematic phase shows qualitatively the samepattern as for the nematic phase. The absence of layer reflec-tion peaks in the lower temperature phase supports the assign-ment of a twist-bend nematic phase. The effective molecularlength in both the nematic and twist-bend nematic phases ofabout 12 Å corresponds to approximately half the estimatedmolecular length of CB6OCB in the all-trans conformation of26.3 Å. This suggests a locally intercalated arrangement of themolecules consistent with that found for other dimers found toexhibit the twist-bend nematic phase.
Fig. 3 Temperature dependence of the heat capacity of CB6OCB mea-sured with an underlying heating or cooling rate of 1 K min�1. Black and redsymbols correspond to heating and cooling experiments, respectively. Thetop-left inset provides a magnified view of the NTB–N and the N–I phasetransitions on heating.
Fig. 4 (a) Nematic Schlieren texture (423 K) and (b) the twist-bendnematic rope-like texture (349 K) observed for CB6OCB using untreatedmicroscope slides. The micrographs are for the same region of the sample.
Fig. 5 X-ray diffraction patterns of CB6OCB measured in the crystal,twist-bend nematic, nematic and isotropic phases.
Paper Soft Matter
Ope
n A
cces
s A
rtic
le. P
ublis
hed
on 1
1 Ju
ly 2
016.
Dow
nloa
ded
on 1
1/23
/202
1 1:
33:3
4 PM
. T
his
artic
le is
lice
nsed
und
er a
Cre
ativ
e C
omm
ons
Attr
ibut
ion
3.0
Unp
orte
d L
icen
ce.
View Article Online
This journal is©The Royal Society of Chemistry 2016 Soft Matter, 2016, 12, 6827--6840 | 6831
3.2. Optical properties of CB6OCB
To explore surface anchoring properties of the compound, weused three polyimides (PIs) and an obliquely deposited SiOx
layer as the aligning layers. To achieve a perpendicular (homeo-tropic) alignment of the director, n, in the N phase and thehelix axis in the NTB phase, two PI layers, SE7511 and SE1211(both Nissan Chemical Industries), have been tested; these PIsprovide a homeotropic anchoring for classic uniaxial nematogenssuch as E7 and 5CB. However, the uniaxial nematic phase ofCB6OCB exhibits only Schlieren textures between the plates coatedwith SE7511 and SE1211, see Fig. 6(a). The Schlieren texturesexhibit only point defects-boojums located at the bounding plates,associated with four extinction brushes each, see Fig. 6(a). Defectswith two extinction brushes representing disclinations with directorreorienting by �p when one circumnavigates the defect core, arenot observed. This feature suggests that SE7511 and SE1211 yieldtilted surface alignment of the director; such a boundary conditionis incompatible with the director reorientation by �p in the planeof the cell.41 As the temperature is lowered towards the NTB–Ntransition, the Schlieren textures become decorated with stripepatterns, see Fig. 6(b), usually associated with the temperaturedependence of the pitch in the NTB phase and undulationinstability of the pseudo-layered NTB structure.42
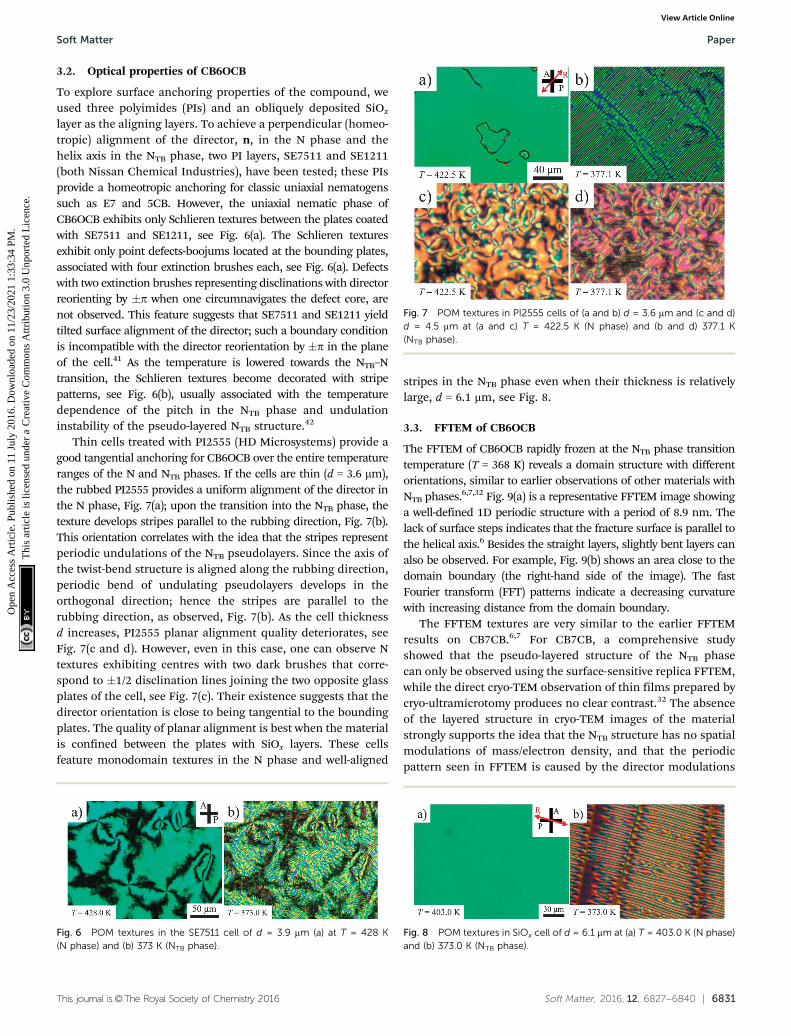
Thin cells treated with PI2555 (HD Microsystems) provide agood tangential anchoring for CB6OCB over the entire temperatureranges of the N and NTB phases. If the cells are thin (d = 3.6 mm),the rubbed PI2555 provides a uniform alignment of the director inthe N phase, Fig. 7(a); upon the transition into the NTB phase, thetexture develops stripes parallel to the rubbing direction, Fig. 7(b).This orientation correlates with the idea that the stripes representperiodic undulations of the NTB pseudolayers. Since the axis ofthe twist-bend structure is aligned along the rubbing direction,periodic bend of undulating pseudolayers develops in theorthogonal direction; hence the stripes are parallel to therubbing direction, as observed, Fig. 7(b). As the cell thicknessd increases, PI2555 planar alignment quality deteriorates, seeFig. 7(c and d). However, even in this case, one can observe Ntextures exhibiting centres with two dark brushes that corre-spond to �1/2 disclination lines joining the two opposite glassplates of the cell, see Fig. 7(c). Their existence suggests that thedirector orientation is close to being tangential to the boundingplates. The quality of planar alignment is best when the materialis confined between the plates with SiOx layers. These cellsfeature monodomain textures in the N phase and well-aligned
stripes in the NTB phase even when their thickness is relativelylarge, d = 6.1 mm, see Fig. 8.
3.3. FFTEM of CB6OCB
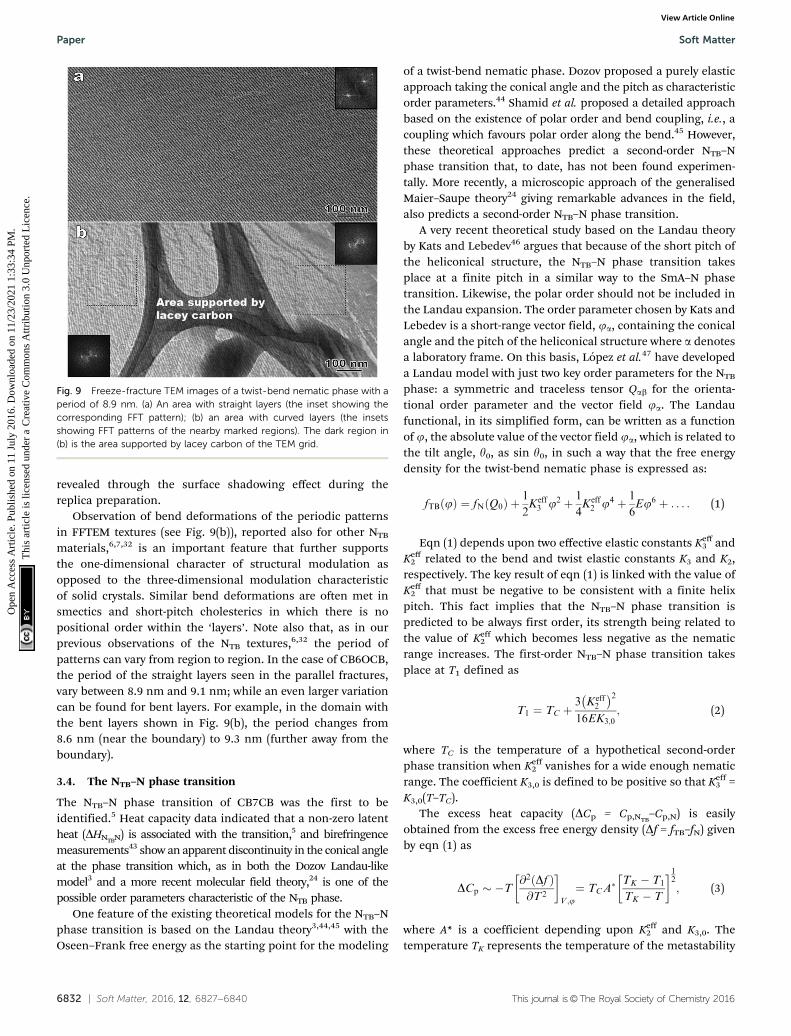
The FFTEM of CB6OCB rapidly frozen at the NTB phase transitiontemperature (T = 368 K) reveals a domain structure with differentorientations, similar to earlier observations of other materials withNTB phases.6,7,32 Fig. 9(a) is a representative FFTEM image showinga well-defined 1D periodic structure with a period of 8.9 nm. Thelack of surface steps indicates that the fracture surface is parallel tothe helical axis.6 Besides the straight layers, slightly bent layers canalso be observed. For example, Fig. 9(b) shows an area close to thedomain boundary (the right-hand side of the image). The fastFourier transform (FFT) patterns indicate a decreasing curvaturewith increasing distance from the domain boundary.
The FFTEM textures are very similar to the earlier FFTEMresults on CB7CB.6,7 For CB7CB, a comprehensive studyshowed that the pseudo-layered structure of the NTB phasecan only be observed using the surface-sensitive replica FFTEM,while the direct cryo-TEM observation of thin films prepared bycryo-ultramicrotomy produces no clear contrast.32 The absenceof the layered structure in cryo-TEM images of the materialstrongly supports the idea that the NTB structure has no spatialmodulations of mass/electron density, and that the periodicpattern seen in FFTEM is caused by the director modulations
Fig. 6 POM textures in the SE7511 cell of d = 3.9 mm (a) at T = 428 K(N phase) and (b) 373 K (NTB phase).
Fig. 7 POM textures in PI2555 cells of (a and b) d = 3.6 mm and (c and d)d = 4.5 mm at (a and c) T = 422.5 K (N phase) and (b and d) 377.1 K(NTB phase).
Fig. 8 POM textures in SiOx cell of d = 6.1 mm at (a) T = 403.0 K (N phase)and (b) 373.0 K (NTB phase).
Soft Matter Paper
Ope
n A
cces
s A
rtic
le. P
ublis
hed
on 1
1 Ju
ly 2
016.
Dow
nloa
ded
on 1
1/23
/202
1 1:
33:3
4 PM
. T
his
artic
le is
lice
nsed
und
er a
Cre
ativ
e C
omm
ons
Attr
ibut
ion
3.0
Unp
orte
d L
icen
ce.
View Article Online
6832 | Soft Matter, 2016, 12, 6827--6840 This journal is©The Royal Society of Chemistry 2016
revealed through the surface shadowing effect during thereplica preparation.
Observation of bend deformations of the periodic patternsin FFTEM textures (see Fig. 9(b)), reported also for other NTB
materials,6,7,32 is an important feature that further supportsthe one-dimensional character of structural modulation asopposed to the three-dimensional modulation characteristicof solid crystals. Similar bend deformations are often met insmectics and short-pitch cholesterics in which there is nopositional order within the ‘layers’. Note also that, as in ourprevious observations of the NTB textures,6,32 the period ofpatterns can vary from region to region. In the case of CB6OCB,the period of the straight layers seen in the parallel fractures,vary between 8.9 nm and 9.1 nm; while an even larger variationcan be found for bent layers. For example, in the domain withthe bent layers shown in Fig. 9(b), the period changes from8.6 nm (near the boundary) to 9.3 nm (further away from theboundary).
3.4. The NTB–N phase transition
The NTB–N phase transition of CB7CB was the first to beidentified.5 Heat capacity data indicated that a non-zero latentheat (DHNTBN) is associated with the transition,5 and birefringencemeasurements43 show an apparent discontinuity in the conical angleat the phase transition which, as in both the Dozov Landau-likemodel3 and a more recent molecular field theory,24 is one of thepossible order parameters characteristic of the NTB phase.
One feature of the existing theoretical models for the NTB–Nphase transition is based on the Landau theory3,44,45 with theOseen–Frank free energy as the starting point for the modeling
of a twist-bend nematic phase. Dozov proposed a purely elasticapproach taking the conical angle and the pitch as characteristicorder parameters.44 Shamid et al. proposed a detailed approachbased on the existence of polar order and bend coupling, i.e., acoupling which favours polar order along the bend.45 However,these theoretical approaches predict a second-order NTB–Nphase transition that, to date, has not been found experimen-tally. More recently, a microscopic approach of the generalisedMaier–Saupe theory24 giving remarkable advances in the field,also predicts a second-order NTB–N phase transition.
A very recent theoretical study based on the Landau theoryby Kats and Lebedev46 argues that because of the short pitch ofthe heliconical structure, the NTB–N phase transition takesplace at a finite pitch in a similar way to the SmA–N phasetransition. Likewise, the polar order should not be included inthe Landau expansion. The order parameter chosen by Kats andLebedev is a short-range vector field, ja, containing the conicalangle and the pitch of the heliconical structure where a denotesa laboratory frame. On this basis, Lopez et al.47 have developeda Landau model with just two key order parameters for the NTB
phase: a symmetric and traceless tensor Qab for the orienta-tional order parameter and the vector field ja. The Landaufunctional, in its simplified form, can be written as a functionof j, the absolute value of the vector field ja, which is related tothe tilt angle, y0, as sin y0, in such a way that the free energydensity for the twist-bend nematic phase is expressed as:
fTB jð Þ ¼ fN Q0ð Þ þ 1
2Keff
3 j2 þ 1
4Keff
2 j4 þ 1
6Ej6 þ . . . : (1)
Eqn (1) depends upon two effective elastic constants Keff3 and
Keff2 related to the bend and twist elastic constants K3 and K2,
respectively. The key result of eqn (1) is linked with the value ofKeff
2 that must be negative to be consistent with a finite helixpitch. This fact implies that the NTB–N phase transition ispredicted to be always first order, its strength being related tothe value of Keff
2 which becomes less negative as the nematicrange increases. The first-order NTB–N phase transition takesplace at T1 defined as
T1 ¼ TC þ3 Keff
2
� �216EK3;0
; (2)
where TC is the temperature of a hypothetical second-orderphase transition when Keff
2 vanishes for a wide enough nematicrange. The coefficient K3,0 is defined to be positive so that Keff
3 =K3,0(T–TC).
The excess heat capacity (DCp = Cp,NTB–Cp,N) is easily
obtained from the excess free energy density (Df = fTB–fN) givenby eqn (1) as
DCp � �T@2 Dfð Þ@T2
� �V ;j¼ TCA
� TK � T1
TK � T
� �12; (3)
where A* is a coefficient depending upon Keff2 and K3,0. The
temperature TK represents the temperature of the metastability
Fig. 9 Freeze-fracture TEM images of a twist-bend nematic phase with aperiod of 8.9 nm. (a) An area with straight layers (the inset showing thecorresponding FFT pattern); (b) an area with curved layers (the insetsshowing FFT patterns of the nearby marked regions). The dark region in(b) is the area supported by lacey carbon of the TEM grid.
Paper Soft Matter
Ope
n A
cces
s A
rtic
le. P
ublis
hed
on 1
1 Ju
ly 2
016.
Dow
nloa
ded
on 1
1/23
/202
1 1:
33:3
4 PM
. T
his
artic
le is
lice
nsed
und
er a
Cre
ativ
e C
omm
ons
Attr
ibut
ion
3.0
Unp
orte
d L
icen
ce.
View Article Online

This journal is©The Royal Society of Chemistry 2016 Soft Matter, 2016, 12, 6827--6840 | 6833
limit for the twist-bend nematic phase on heating and is relatedto both TC and T1 by means of the relationship
TK ¼4
3T1 �
1
3TC: (4)
The heat capacity of the nematic phase (Cp,N) is usually described,close to the NTB–N phase transition, by the linear function
Cp,N = B* + C*[T � T0], (5)
and so, the heat capacity of the twist-bend nematic phase(Cp,NTB
) is expressed from eqn (3) as
Cp;NTB¼ Cp;N þ TCA
� TK � T1
TK � T
� �12: (6)
The coefficients A*, B* and C* and the temperatures TK, TC andT1 of both eqn (5) and (6) are obtained as fitting parametersfrom the experimental results of high-resolution heat capacitydata in the vicinity of the NTB–N phase transition, but close tothe phase transition.
Fig. 10 shows the heat capacity data for a slow heating run(0.01 K min�1) around the NTB–N phase transition. We alsoshow heat capacity data for a slow cooling run but only in thenematic phase and when the NTB–N phase transition begins.The coexistence region, a signature of the first-order characterof the NTB–N phase transition, is delimited by the verticaldashed lines and is determined using f-phase shift data which,for simplicity, are not shown in the figure. Eqn (6) is used to fitonly heat capacity data on heating in the NTB phase up to thelower limit of the coexistence region and the result is shown inFig. 10 as the blue curve. Eqn (5) is used to fit the heat capacitydata recorded on cooling the N phase to the upper limit of thecoexistence region, shown in Fig. 10 as the red curve. A preliminary,quantitative result from our fittings is given by the temperature-discontinuity metric (T1–TC) which is 0.025 K, a value which iscertainly small showing that the NTB–N phase transition is veryweakly first-order in nature. The other fitting parameters will be usedlater to estimate the entropy change at the NTB–N phase transitionaccording to the proposed Landau model.
The latent heat associated with the NTB–N phase transition(DHNTBN) has been calculated using
DHTOT ¼ DHNTBN þðDCpdT (7)
for the data in Fig. 10. It should be stressed in eqn (7) that thesecond term of the right-hand side is the pretransitionalfluctuation contribution (DCp being the difference Cp–Cp,background
due to the change of orientational order intrinsic to this transi-tion) and DHTOT is the total integrated enthalpy change, usuallyprovided with a certain accuracy in standard DSC experiments.In strongly first-order phase transitions, the second term of theright-hand of eqn (7) can be neglected compared to the latentheat and so the total enthalpy change is identified with thelatent heat associated with the phase transition. However, inweakly first-order phase transitions, the latent heat should notbe identified with the total enthalpy change obtained in standardDSC measurements. In our case, the resulting latent heat (DHNTBN)
requires careful calibration with a standard similar to CB6OCB.Two liquid crystals, 4-octyloxy-40-cyanobiphenyl (8OCB) andCB9CB were used independently for latent heat calibrationpurposes. The values obtained were similar and the resultsare listed in Table 1 together with the entropy change DSNTBN
calculated as the ratio between the latent heat and the transitiontemperature T1. The Landau model embodied by eqn (1) providesthe entropy change at the NTB–N phase transition (DSNTBN) as
DSNTBN = 6A*[TK � T1]. (8)
Our fittings using eqn (5) and (6) lead to a value for (TK � T1)of 0.009 K with a coefficient A* of 3 � 10�3 J g�1 K�2. Thus,according to eqn (8), the entropy change at the NTB–N phasetransition (DSNTBN) would be 1.6 � 10�4 J g�1 K�1 or 0.009expressed as DSNTBN/R, a value very close to that listed inTable 1. Here, the nematic range is also listed, being the widestfor the twist-bend compounds investigated up to now for whichthe entropy data are available with the required accuracy.5,12 Itshould be stressed that the Landau model embodied by eqn (1)establishes that, the wider the nematic range, the weaker thefirst-order NTB–N phase transition is. Another interesting factprovided by the Landau model represented by eqn (1) is thatthe height of the heat capacity peak at the N–NTB phasetransition must decrease as the first-order transition becomesweaker, a fact that is clearly verified if we observe Fig. 10 andcompare this with other high resolution heat capacity measure-ments for other twist-bend nematogenic compounds.5,12,47
The inset in Fig. 10 shows the heat capacity data around theN–I phase transition measured at the same experimental con-ditions as the NTB–N phase transition. It is useful to note some
Fig. 10 Heat capacity data for a slow heating run (0.01 K min�1-blacksymbols) around the NTB–N phase transition. Also shown are heat capacitydata for a slow cooling run (red symbols) in the nematic phase and for theonset of the NTB–N phase transition. The coexistence region, is indicatedby the vertical dashed lines. The blue curve shows the fitting of the datausing eqn (6) to the lower limit of the coexistence region, and the redcurve shows the fitting of the cooling data using eqn (5). The top-left insetshows heat capacity data for a slow heating run for the same conditionsaround the N–I phase transition.
Soft Matter Paper
Ope
n A
cces
s A
rtic
le. P
ublis
hed
on 1
1 Ju
ly 2
016.
Dow
nloa
ded
on 1
1/23
/202
1 1:
33:3
4 PM
. T
his
artic
le is
lice
nsed
und
er a
Cre
ativ
e C
omm
ons
Attr
ibut
ion
3.0
Unp
orte
d L
icen
ce.
View Article Online

6834 | Soft Matter, 2016, 12, 6827--6840 This journal is©The Royal Society of Chemistry 2016
of the differences in the critical behaviour of both phasetransitions (NTB–N and N–I). Heat capacity data are fitted tothe following standard expressions48,49
Cp;I ¼ BC þDCT
T�� 1
� �þ AC;I
T
T�� 1
���������a
for T 4TNI ¼ T� þ DT�;
(9)
Cp;N ¼ BC þDCT
T��� 1
� �þ AC;N
T
T��� 1
���������a
for T oTNI ¼ T�� � DT��;
(10)
both eqn (9) and (10) are presumed to be valid in a region of nomore than �3 K around the nematic–isotropic transition tem-perature (TNI), but excluding all of the points in the coexistenceregion. The parameters to be fitted are the exponent a (identicalfor the N and I phases), both spinodal temperatures T** and T*,the BC and DC terms defining the heat capacity background andthe corresponding amplitudes AC,N and AC,I. The fitting curves ofboth eqn (9) and (10) are shown as red and grey curves in theinset of Fig. 10. The quantitative key result from our fittings isthe critical exponent, a, of 0.5, the ratio (DT**/DT*) of 0.6 is veryclose to 0.5 which corresponds to the tricritical hypothesis andthe ratio (AC,N/AC,I) of about 2 which is typical for a tricritical N–Iphase transition.50 The latent heat associated with the phasetransition is calculated using an expression similar to eqn (7)with the same calibration procedure over the heat capacity datashown in the inset of Fig. 10. The value is listed in Table 1.
3.5. Chirality and orientational order of the NTB phase
The NTB and N phases of the dimer CB6OCB were studied,using 2H NMR spectroscopy, as a function of temperaturefor the nematogen deuteriated in the first methylene group ofthe spacer attached directly to a cyanobiphenyl group. Theselection of 2H NMR spectra, given in Fig. 11, shows the singlequadrupolar doublet expected in the nematic phase for theequivalent prochiral deuterons on the first methylene group inthe spacer. In the NTB phase two quadrupolar doublets are nowobserved because the two prochiral deuterons have lost theirequivalence as a result of the chirality of the NTB phase. Thisprovides clear evidence for the chirality expected of the NTB
phase even though the molecules are, in effect, achiral. Onpassing from the N to the NTB phase the loss of equivalence ofthe prochiral deuterons is almost continuous in keeping withthe very weak nature of the first-order NTB–N transition. Thefinal spectrum shown in Fig. 11 was recorded at a temperaturedeeper in the NTB phase and shows a significant difference ofthe quadrupolar splittings for the two prochiral deuterons. Thisbehaviour in the difference of the two quadrupolar splittings,shown in Fig. 11, indicates the chirality of the phase but at a
quantitative level it is related to an off-diagonal element of aSaupe ordering matrix for the rigid segment of the moleculecontaining the deuterons and averaged over all the conforma-tions.51 To connect this to the growth in the helical pitch withincreasing temperature requires a molecular model such asthat developed by Greco et al.52
The quadrupolar splittings, Dn, are shown as a function ofthe shifted temperature, (TNI–T), in Fig. 12. Since the nematic–isotropic transition temperature is high, at 426 K, it was notpossible, unfortunately, to make deuterium NMR measure-ments at or near the transition to the isotropic phase. In thevicinity of the transition to the NTB phase it appears that thequadrupolar splitting in the N phase exhibits a plateau or evenpasses through a weak maximum. This is not as pronounced,however, as that shown by the KA(0.2) mixture of ether andmethylene-linked odd dimers which might be thought of asanalogous to a methylene-ether linked odd dimer.10 Here thenematic range is about 39 K slightly less than for CB6OCBwhich is about 45 K. The temperature dependence of the twoprochiral quadrupolar splittings, Dn�, for CB6OCB-d2 is alsoshown in Fig. 12, one of these, Dn+, increases slightly withdecreasing temperature while the other, Dn�, decreases morerapidly.
The quadrupolar splitting in the nematic phase is properlycompared with the mean, (Dn+ + Dn�)/2, of the two prochiralsplittings determined in the twist-bend nematic phase,51 seeFig. 12. This mean splitting, shown in the figure, is clearlyconsistent with the notion of the occurrence of a very smallmaximum in the quadrupolar splitting with decreasing tem-perature. The mean quadrupolar splitting in the twist-bendnematic phase of CB6OCB-d2 is seen to decrease with decreas-ing temperature which is in accord with an increase in theconical or tilt angle, y0; this is another characteristic order
Table 1 Thermodynamic data obtained for CB6OCB from the heat capacity experiments
TNTBN (K) DHNTBN (kJ mol�1) DSNTBN/R TNI (K) DHNI (kJ mol�1) DSNI/R TNI–TNTBN (K)
382.3 � 1.0 0.018 � 0.009 0.006 426.6 � 0.3 0.38 � 0.01 0.11 44.3 � 1.0
Fig. 11 The 2H NMR spectra of CB6OCB-d2 measured as a function oftemperature in the nematic and twist-bend nematic phases.
Paper Soft Matter
Ope
n A
cces
s A
rtic
le. P
ublis
hed
on 1
1 Ju
ly 2
016.
Dow
nloa
ded
on 1
1/23
/202
1 1:
33:3
4 PM
. T
his
artic
le is
lice
nsed
und
er a
Cre
ativ
e C
omm
ons
Attr
ibut
ion
3.0
Unp
orte
d L
icen
ce.
View Article Online

This journal is©The Royal Society of Chemistry 2016 Soft Matter, 2016, 12, 6827--6840 | 6835
parameter for the twist-bend nematic phase. The influence ofthis on the mean quadrupolar splitting clearly outweighs theincrease caused by the growth in the orientational order of thecyanobiphenyl group attached to the methylene group.53 As wehave seen the difference in the quadrupolar splittings in thetwist-bend nematic phase demonstrates the chirality of thephase. This, so-called, chiral splitting, (Dn+ � Dn�), increasescontinuously from about zero at the NTB–N transition withdecreasing temperature. The influence of the orientationalorder as well as the director tilt with respect to the helix axison this behaviour might also be explored as could the fit totheory.52,53
In view of the subtle difference in the structure of the twoodd liquid crystal dimers CB7CB and CB6OCB, having the samespacer lengths, where one methylene linking group is replacedwith an ether group it is of special interest to compare thequadrupolar splittings found for CB6OCB-d2 with those alreadymeasured for CB7CB-d4.5 As has been shown this apparentlysubtle chemical and hence geometric change has a significantinfluence on the N–I transitional properties of odd liquidcrystal dimers differing in the linkages, either methylene orether.54 It is also expected to influence the orientational order,as reflected by the quadrupolar splittings in both the nematicand twist-bend nematic phases. This comparison is made inFig. 13 where the splittings are shown as a function of theshifted temperature, (TNTBN–T); this choice of scale facilitatesthe comparison of the behaviour in the NTB phase of the twodimers at comparable temperatures.
We start, however, with the results in the nematic phase. It isapparent that for CB7CB-d4 the quadrupolar splitting increasesstrongly with decreasing temperature as the transition to theNTB phase approaches and the shifted temperature increases.In marked contrast the quadrupolar splitting for CB6OCB-d2 isessentially constant in the vicinity of this transition and evendecreases, though slightly, at more negative shifted temperatures.In addition to the slopes of the plots the absolute values of thequadrupolar splittings are significantly larger for CB6OCB-d2
than for CB7CB-d4 at the phase transition. These differences in
behaviour appear to be consistent with the smaller curvature ofthe molecule expected for the conformationally averaged structureof the dimer CB6OCB than for CB7CB. The difference between theabsolute splitting in the N phase and the mean quadrupolarsplitting in the NTB phase at the transition for CB6OCB-d2 is small,this is consistent with the weak first-order phase transition. Incontrast, for CB7CB-d4 the same difference is large and clearlyobservable in accord with the stronger first-order NTB–N transition.Again the different behaviour found for the two dimers is consis-tent with the difference in their mean curvatures. In addition, theLandau model developed for the NTB–N phase transition,47 which issimilar in some respects with other models devoted to the SmA–Nphase transition,48–50 suggests that the closer the reduced tempera-ture, TNTBN/TNI, is to unity the stronger the NTB–N transition shouldbe. This transitional behaviour is also exhibited by the entropychange DSNTBN/R which is 0.07 for CB7CB and significantly smallerat 0.006 for CB6OCB. This difference is in keeping with thedifference in the nematic range for the two dimers.55
The other significant difference between the two dimers isin the behaviour of the mean quadrupolar splittings in thetwist-bend nematic phase. Thus for CB6OCB-d2 the mean splittingdecreases with increasing shifted temperature indicating that theinfluence of the growth in the tilt angle outweighs that in theorientational order. However, for CB7CB-d4 the reverse appears tobe the case, thus the mean quadrupolar splitting grows slightlyafter the phase transition and then reaches an essential plateau.
The chiral splittings for the two dimers are seen to exhibitquite different behaviour at the NTB–N transition. For CB6OCB-d2 the chiral splitting seems to be small in keeping with theweak first-order phase transition. However, for CB7CB-d4 thetransition is much stronger and the chiral splitting now differssignificantly from zero. It appears that the off-diagonal elementin the conformationally averaged Saupe ordering matrix whichresults from the phase chirality is somewhat larger for CB7CB thanfor CB6OCB although a theory has yet to be developed thataccounts for this difference in behaviour. In spite of this significantdifference at the phase transition the chiral splittings at the same
Fig. 12 The quadrupolar splittings, Dn, for CB6OCB-d2 shown as a functionof the shifted temperature (TNI–T) in the nematic and twist-bend nematicphase. In the NTB phase the two splittings from the prochiral deuterons( , Dn+, and , Dn�) are also shown as the mean splitting (Dn+ + Dn�)/2 ( )and as the chiral splitting (Dn+ � Dn�) (K).
Fig. 13 A comparison between the temperature dependence of thequadrupolar splittings, Dn, for CB6OCB-d2 and CB7CB-d4 in the nematicand twist-bend nematic phases. The quadrupolar splittings in the NTB
phase are also shown as the mean ( ) for CB6OCB and ( ) for CB7CB.
Here they are plotted as a function of the shifted temperature (TNTBN–T).
The same shifted scale is employed in the N phase, ( ) for CB6OCB and( ) for CB7CB.
Soft Matter Paper
Ope
n A
cces
s A
rtic
le. P
ublis
hed
on 1
1 Ju
ly 2
016.
Dow
nloa
ded
on 1
1/23
/202
1 1:
33:3
4 PM
. T
his
artic
le is
lice
nsed
und
er a
Cre
ativ
e C
omm
ons
Attr
ibut
ion
3.0
Unp
orte
d L
icen
ce.
View Article Online

6836 | Soft Matter, 2016, 12, 6827--6840 This journal is©The Royal Society of Chemistry 2016
shifted temperatures some way from the transition are really quitesimilar. This result which is not unique56 is again puzzling andposes an interesting challenge to theory.
3.6. Molecular field theory
The experimental NMR and transitional results given in theprevious section for the non-symmetric dimer CB6OCB andtheir comparability to those for the symmetric dimer CB7CB,about which so much is known, provides a valuable opportunityto test the validity of theoretical predictions.3,24,47 This isparticularly appropriate given the clear similarity of the structuresof the two dimers differing, as they do, simply by the replacementof the ether by a methylene group. Indeed it is possible to explorethe effect of this change in the molecular structure and especiallythe curvature of the conformationally averaged form of this.57 It isexpected that the mean curvature for CB7CB will be larger than forCB6OCB. The results of particular importance are the transitiontemperatures, TNI and TNTBN, as well as the orientational orderparameters for both the N and the NTB phases. Using NMRspectroscopy the quadrupolar splittings are measured with respectto the magnetic field of the spectrometer; in the N phase thiscorresponds to the director, denoted by n, but in the NTB phase it isassociated with the helix axis, denoted by h.51
We start with a brief description of the molecular-basedtheory proposed by Greco et al.24 Here the constituent odd-dimer molecules, with the intrinsic flexibility of the centralspacer, are represented by a rigid V-shaped particle; this leadsto a dramatic but valuable simplification of the model. We needto define the angle between the two mesogenic arms of the Vnamely, w, together with their lengths which were taken tobe equal at L and the equivalent anisotropy of the arms, e.The three order parameters employed in the theory to definethe twist-bend nematic phase are the pitch, p, of the helix, theconical angle, y0, made by the director with the helix axis andthe second-rank orientational order parameter made by thearm of the molecular V with the director, hP2i. Of these orderparameters all but hP2i vanish in the nematic phase. We shouldnote that the order parameter with respect to the helix axis,hPh
2i, is related to the conical angle which also vanishes in theN phase, and becomes hP2i. If we wished we could take thearms of the V to be unequal and in addition use a truncatedV which is a more realistic description of the conformationallyaveraged shape of an odd dimer.57 However, this is somethingfor the future.
Calculations have been performed with w equal to 1301, 1351and 1401 24 and of these 1351 is found appropriate to representthe behaviour of CB7CB. For our other dimer CB6OCB the valueof w needs to be just 31 larger at 1381. Although there are no realmesogens with which these calculations can be compared it isof interest to make contact with the results of a Monte Carlosimulation for an ensemble of rigid V-shaped moleculesformed by two Gay–Berne particles with their elliptical shape.This was studied by Memmer58 who set the interarm angle at1401 and found that this model system formed a twist-bendnematic phase. Unfortunately, the system was not investigatedin great detail but it may be significant that the angle between
the Gay–Berne groups is equal to one of those used with themolecular field model.24
It is convenient to start with the orientational order para-meters hP2i and hPh
2i and these are shown as a function of thescaled temperature, T* = kBT/e, in Fig. 14; the temperaturesscaled in this way are directly comparable to the experimentaltemperatures. Also included are results for the polar orderparameter and although of interest we shall not refer to thisfurther. From the two plots in Fig. 14 we can clearly see the N–Itransition and that the NTB–N transition occurs when the orderparameter, hPh
2i, shown as a dashed line, branches away fromhP2i When the inter-arm angle, w, is 1381 the scaled transitiontemperature, TNI*, is about 0.292. What is striking is that adecrease in w by just 31 to 1351 reduces the scaled transitiontemperature, TNI*, to about 0.272. The ratio of the two scalednematic–isotropic transition temperatures is 1.074; this isdirectly comparable to that for the two dimers which forCB6OCB to CB7CB is 1.099. We now turn to the NTB–N transi-tion temperatures. For the interarm angle of 1381 the scaledvalue for TNTBN* is 0.254. On reducing the angle w to 1351 thetransition temperature TNTBN* increases slightly to 0.259. Theratio of these two scaled temperatures which is comparablewith experiment is 0.982. The experimental value for the ratioof CB6OCB to CB7CB is also close to unity at 1.016 but isslightly larger than predicted although we stress again that theparameters were not adjusted to fit experiment. Of course, at aqualitative level theory predicts that TNTBN* for CB6OCB shouldbe lower than that for CB7CB but the reverse is the casealthough slightly so. We should also note that the extremesensitivity of the predictions of the model to the interarm angleis strangely mimicked by a similar sensitivity for the prediction,also based on a V-shaped model, of the transition temperaturesof the biaxial nematic phase.59 We should also note that thetheory of Greco et al.24 predicts the NTB–N phase transition tobe second order whereas experimentally the NTB–N transitionfor CB7CB is clearly first order;5 that for CB6OCB is also firstorder but very weak. However, both experimental cases agreewith the most recent Landau theory in which the effectivecurvature of the molecule is also accounted for.47 The details
Fig. 14 The variational molecular-field predictions for V-shaped mole-cules with the interarm angle, w, equal to (a) 1351 and (b) 1381. The resultsfor the orientational order parameters are shown as a function of thescaled temperature, T*. The second-rank quantities are defined in the textand hPwm
1 i is the first-rank order parameter where w is the axis bisectingthe molecular V and Pwm
1 = w�m and m = h � n.
Paper Soft Matter
Ope
n A
cces
s A
rtic
le. P
ublis
hed
on 1
1 Ju
ly 2
016.
Dow
nloa
ded
on 1
1/23
/202
1 1:
33:3
4 PM
. T
his
artic
le is
lice
nsed
und
er a
Cre
ativ
e C
omm
ons
Attr
ibut
ion
3.0
Unp
orte
d L
icen
ce.
View Article Online
This journal is©The Royal Society of Chemistry 2016 Soft Matter, 2016, 12, 6827--6840 | 6837
as to how the molecular curvature enters the theory are notgiven here but may be found in the original paper.
The molecular field theory also predicts the orientational orderparameters of the mesogenic arms with respect to the director whichare shown as hP2i; these are related to the quadrupolar splittings.5,51
In the nematic phase we see that the order parameters are similarfor the two V-shaped molecules at the nematic–isotropic transition.However, as the transition to the twist-bend nematic is approachedthe order parameter in the N phase is significantly larger for themolecule with the inter-arm angle of 1381 than that with the smallervalue of 1351. For the model system this difference can be attributedto the longer nematic range for the larger value of w. Such results arein accord with experimental quadrupolar splittings for the dimersCB6OCB-d2 and CB7CB-d4 (see Fig. 13). Within the twist-bendnematic phase the experimental mean quadrupolar splitting isrelated to the order parameter defined with respect to the helix axis;this is denoted by hPh
2i and shown as the red dot-dashed lines inFig. 14. We can see that for the slightly smaller value of w there is asteep decrease in the order parameter followed by a gentler butsignificant increase with further decrease in the temperature. This isconsistent with the growth in the order being greater than thatresulting from further increase in the conical angle. In contrast forthe slightly larger inter-arm angle the order parameter decreases lessrapidly and then grows very slowly with decrease in temperature.This behaviour for the two model dimers is in reasonable, qualitativeagreement with that shown in Fig. 13 for CB7CB-d4 and CB6OCB-d2.For the latter dimer the mean quadrupolar splitting decreaseson entering the NTB phase and then continues to decrease butslightly less slowly. For the former, the results in Fig. 13 show adiscontinuous increase in the mean quadrupolar splittingfollowed by a small growth and a more or less constant value.This low temperature variation is in accord with theory but notthe increase in the mean splitting at the NTB–N transitionwhich predicts a decrease.
The results from the molecular field theory suggest thatsome qualitative understanding of the behaviour of liquidcrystal dimers in forming both nematic and twist-bend nematicphases might be obtained from their bent nature via the anglebetween their mesogenic arms. This might in some way avoidthe effect of the molecular complexity especially that originat-ing from the spacer. However the extreme sensitivity of thepredictions to the interarm angle shows that the estimation ofthe angle between the two mesogenic arms will need to be withgreat care. We now take an initial step in considering how thismight be achieved. Frequently the structure of liquid crystaldimers is shown for simplicity, as that when the spacer is in itsall-trans conformation which appears to be a convenient start-ing point. Such structures, obtained from quantum chemicalcalculations, are shown for CB7CB and CB6OCB in Fig. 15.These clearly resemble a V or perhaps a truncated V-shapewhich is especially appropriate for our task. The orientations ofthe mesogenic groups are indicated by the arrows which passthrough the carbons at the ends of the cyanobiphenyl groupsfor CB6OCB. These clearly show that the inter-arm angle forCB7CB is smaller than for CB6OCB as expected following theintroduction of the ether link in the spacer. Based on this
simple picture alone it might be thought that this difference inthe interarm angle and hence the molecular curvature wouldresult in a lower twist-bend nematic transition temperature,TNTBN, for CB7CB than for CB6OCB; this would be in keepingwith the predictions of the molecular field theory for V-shapedmolecules. However at a quantitative level the angles employedin the theory are significantly larger than those of the dimers intheir all-trans forms although the difference in these are farlarger than those used in the molecular field theory. We should,however, recall that although the all-trans conformation is theground state for CB7CB it is not for CB6OCB. Here bothexperiment and quantum chemical calculations reveal thatwith an ether group the ground state has a gauche link in thespacer. This conformation is also shown for CB6OCB in Fig. 15and it is apparent that its shape has a greater curvature or bendthan for the all-trans form. In fact the angle between thecyanobiphenyl groups, calculated from the vector productof the vectors associated with the two cyanobiphenyl groups,has decreased and is now 1031 in comparison to 1271 for theall-trans form. This illustrates quite clearly how misleading theuse of single conformers to gauge the curvature of such flexiblemolecules can be.
To overcome this particular challenge we need to be able touse all of the conformers in assessing the molecular curvatureor those structural factors and properties responsible for theformation of the twist-bend nematic. In addition rather thanusing discrete conformers as in the RIS model it is desirableand more realistic to use continuous potentials which link therigid groups forming the molecule such as the importantmethylene groups.51 The probability of a conformer in theisotropic phase can be determined from the torsional energieswhich are available from quantum chemical calculations. Foreach conformer the angle, y, between the para axes of thecyanobiphenyl groups may be determined irrespective of theconformation of the spacer linking them. This calculation is
Fig. 15 The shapes of the dimers (a) CB7CB and (b) CB6OCB in theirall-trans form and (c) CB6OCB in its ground state with a gauche link.
Soft Matter Paper
Ope
n A
cces
s A
rtic
le. P
ublis
hed
on 1
1 Ju
ly 2
016.
Dow
nloa
ded
on 1
1/23
/202
1 1:
33:3
4 PM
. T
his
artic
le is
lice
nsed
und
er a
Cre
ativ
e C
omm
ons
Attr
ibut
ion
3.0
Unp
orte
d L
icen
ce.
View Article Online

6838 | Soft Matter, 2016, 12, 6827--6840 This journal is©The Royal Society of Chemistry 2016
then repeated for many conformations which would be obtainedby Monte Carlo sampling of the coordinates defining the con-formers. We sample these simply by using the angle y given itsrelevance to the problem and have sorted a significant numberof the conformers simply according to the angle between themesogenic groups and assigned a probability p(y)sin y for each.The results of such calculations for the dimers CB7CB andCB6OCB in their isotropic phase are shown in Fig. 16(a) as afunction of y. For CB7CB there is a major peak essentiallysymmetric about its maximum. This peak corresponds to bentconformers with the most probable angle between the cyanobi-phenyl arms of about 1201 but with the y distribution extendingwidely from about 901 to 1401. In addition, there is a muchsmaller, less well-defined maximum at about 301 which corre-sponds to the so-called hairpins where the cyanobiphenyl groupstend to be parallel. What is remarkable is that the distributionfunction for CB6OCB has essentially the same form as forCB7CB. The essential differences are that the major peak iswider and the fraction of the hairpin conformers is somewhatsmaller. It is not clear why these differences could be responsiblefor the tendency of CB7CB to have a higher TNTBN than CB6OCB.
Given this we have sought an answer from the conforma-tional distribution function p(y)sin y for both dimers evaluatedin their nematic phases. These calculations differ significantly
from those in the isotropic phase because the orientationalorder influences the conformational probability since the inter-action with the director favours the more elongated confor-mers. In fact the probability now depends on the orientationalpartition functions of the conformers.60 Again the torsionalvariables are continuous and the conformations are generatedusing umbrella sampling.61 The predicted distribution func-tions in the nematic phases are shown in Fig. 16(b); in these theorientational order parameter for the mesogens was set at 0.35.What the distribution functions show is that there is now amore noticeable difference between these for CB7CB andCB6OCB. Thus the probabilities for CB6OCB have shifted tohigher values of the angle y corresponding to more elongatedconformers which would decrease the twist-bend nematic–nematic transition temperature. The shift for the CB7CB dimeris not so pronounced which ensures that TNTBN for this dimershould be greater than that of CB6OCB. The fact that thedifference in the conformational distribution functions isrelatively small whereas the difference in TNTBN is significant,may well be consistent with the small difference in the inter-arm angle used in the molecular field calculations. However weshould not ignore the fact that the changes in the probabilitiesare not restricted to a single value of the inter-arm angle. Indeedit seems likely that the value of the twist-bend nematic–nematictransition temperature does not rest on a single structuralcharacterisation of the liquid crystal dimer related to just onepart of the conformational distribution; more studies, bothexperimental and theoretical, are clearly required to confirmthis. In addition the use of the distribution function for the inter-arm angle may well need other single properties to evaluate thetransition temperatures and so obtain a guide to the design oftwist-bend nematogens.
4. Conclusions
CB6OCB shows a NTB–N transition at 382 K and an N–Itransition at 426 K. The NTB phase shows characteristic ellipticalpolygonal domain and rope-like textures when viewed throughthe polarising-light microscope. At the NTB–N transition there isa cessation of the optical flickering associated with directorfluctuations in a conventional nematic phase. X-ray diffractionstudies have confirmed the absence of layer reflection peaks inthe lower temperature nematic phase supporting the assignmentof NTB. The effective molecular length in both the N and NTB
phases corresponds to approximately half the estimated all-transmolecular length of CB6OCB indicating a locally intercalatedarrangement of the molecules. The NTB phase assignment isconfirmed using FFTEM, and the helicoidal pitch is estimated tobe 8.9 nm. We explored different alignment layers and identifiedapproaches that provide tilted and planar alignment of thedirector in the N phase and the heliconical axis in the NTB phase.
High-resolution calorimetric measurements allow us toobtain the heat-capacity data in the vicinity of the NTB–N phasetransition. From such data, the latent heat and, hence theentropy change at the phase transition is obtained and they
Fig. 16 The conformational probability distribution p(y)sin y as a functionof y for CB7CB and CB6OCB in (a) the isotropic phases and (b) the nematicphases with a mean orientational order parameter of about 0.35.
Paper Soft Matter
Ope
n A
cces
s A
rtic
le. P
ublis
hed
on 1
1 Ju
ly 2
016.
Dow
nloa
ded
on 1
1/23
/202
1 1:
33:3
4 PM
. T
his
artic
le is
lice
nsed
und
er a
Cre
ativ
e C
omm
ons
Attr
ibut
ion
3.0
Unp
orte
d L
icen
ce.
View Article Online
This journal is©The Royal Society of Chemistry 2016 Soft Matter, 2016, 12, 6827--6840 | 6839
have allowed us to characterize the phase transitions as weaklyfirst order but much closer to second order than for CB7CB5 orthe longer chain homologue CB9CB.56 The only publishedtheory that predicts a first-order NTB–N phase transition47 isconsistent with our heat capacity results for CB6OCB and alsofor those published for CB7CB and CB9CB. In particular, itis clearly observed how the nematic range or the reducedtemperature TNTBN/TNI is a key parameter in the first-ordercharacter of the transition in a way that the larger the reducedtemperature (or the narrower the nematic range), the strongerthe first-order character of the NTB–N phase transition is, in away analogous to the SmA–N transition. The chirality of the NTB
phase, one of its key properties, is clearly demonstrated by our2H NMR studies of CB6OCB-d2, thus contributing to theunambiguous identification of the phase. Another definingproperty of the nematic phases is their orientational orderwhich is related to the quadrupolar splittings available from theNMR experiments. For the N phase of CB6OCB-d2 the orderingincreases slowly especially as the NTB phase is approached. Incontrast, for the related dimer CB7CB-d4 the order increasesrapidly but as the NTB phase is reached its orientational order issignificantly smaller than that of CB6OCB-d2. More interestingly,in the NTB phase of CB6OCB-d2 the mean quadrupolar splittingdecreases with decreasing temperature showing the tilt of thedirector with respect to the helix axis. Again this contrasts withthat for CB7CB-d4 where the mean splitting increases at thetransition and then is essentially independent of temperature.Such results provide valuable and challenging opportunities totest theories for the twist-bend nematic phase. This has certainlyproved to be the case for the variational molecular field theory ofthe twist-bend nematogen but both the extreme sensitivity to theinterarm angle and the molecular complexity mean that thereare still questions to be answered.
Acknowledgements
The FFTEM data were obtained at the (Cryo) TEM facility at theLiquid Crystal Institute, Kent State University, supported by theOhio Research Scholars Program Research Cluster on Surfacesin Advanced Materials. ODL acknowledges the support of NSFDMR-1410378 grant. The authors are grateful for financialsupport from MINECO/FEDER MAT2015-66208-C3-2-P and fromthe Gobierno Vasco (GI/IT-449-10).
References
1 Biaxial Nematic Liquid Crystals: Theory, Simulation andExperiment, ed. G. R. Luckhurst and T. J. Sluckin, Wiley,Chichester, 2015.
2 R. B. Meyer, in Les Houches Summer School in TheoreticalPhysics, ed. R. G. Balian and G. Weil, Gordon and Breach,New York, 1976, pp. 273–373.
3 I. Dozov, Europhys. Lett., 2001, 56, 247–253.4 J. W. Emsley, M. Lelli, A. Lesage and G. R. Luckhurst, J. Phys.
Chem. B, 2013, 117, 6547–6557.
5 M. Cestari, S. Diez-Berart, D. A. Dunmur, A. Ferrarini, M. R.de la Fuente, D. J. B. Jackson, D. O. Lopez, G. R. Luckhurst,M. A. Perez-Jubindo, R. M. Richardson, J. Salud, B. A. Timimiand H. Zimmermann, Phys. Rev. E: Stat., Nonlinear, SoftMatter Phys., 2011, 84, 031704.
6 V. Borshch, Y. K. Kim, J. Xiang, M. Gao, A. Jakli, V. P. Panov, J. K.Vij, C. T. Imrie, M. G. Tamba, G. H. Mehl and O. D. Lavrentovich,Nat. Commun., 2013, 4, 2635.
7 D. Chen, J. H. Porada, J. B. Hooper, A. Klittnick, Y. Shen, M. R.Tuchband, E. Korblova, D. Bedrov, D. M. Walba, M. A. Glaser,J. E. Maclennan and N. A. Clark, Proc. Natl. Acad. Sci. U. S. A.,2013, 110, 15931–15936.
8 C. T. Imrie and P. A. Henderson, Chem. Soc. Rev., 2007, 36,2096–2124.
9 C. T. Imrie, P. A. Henderson and G.-Y. Yeap, Liq. Cryst.,2009, 36, 755–777.
10 K. Adlem, M. Copic, G. R. Luckhurst, A. Mertelj, O. Parri,R. M. Richardson, B. D. Snow, B. A. Timimi, R. P. Tuffin andD. Wilkes, Phys. Rev. E: Stat., Nonlinear, Soft Matter Phys.,2013, 88, 022503.
11 V. P. Panov, M. Nagaraj, J. K. Vij, Y. P. Panarin, A. Kohlmeier,M. G. Tamba, R. A. Lewis and G. H. Mehl, Phys. Rev. Lett.,2010, 105, 167801.
12 C. S. P. Tripathi, P. Losada-Perez, C. Glorieux, A. Kohlmeier,M.-G. Tamba, G. H. Mehl and J. Leys, Phys. Rev. E: Stat.,Nonlinear, Soft Matter Phys., 2011, 84, 041707.
13 R. J. Mandle, E. J. Davis, S. A. Lobato, C. C. A. Voll, S. J.Cowling and J. W. Goodby, Phys. Chem. Chem. Phys., 2014,16, 6907–6915.
14 R. J. Mandle, E. J. Davis, C. T. Archbold, S. J. Cowling andJ. W. Goodby, J. Mater. Chem. C, 2014, 2, 556–566.
15 P. A. Henderson and C. T. Imrie, Liq. Cryst., 2011, 38,1407–1414.
16 M. Sepelj, A. Lesac, U. Baumeister, S. Diele, H. L. Nguyenand D. W. Bruce, J. Mater. Chem., 2007, 17, 1154–1165.
17 R. J. Mandle, E. J. Davis, C. T. Archbold, C. C. A. Voll, J. L.Andrews, S. J. Cowling and J. W. Goodby, Chem. – Eur. J.,2015, 21, 8158–8167.
18 E. Gorecka, N. Vaupotic, A. Zep, D. Pociecha, J. Yoshioka,J. Yamamoto and H. Takezoe, Angew. Chem., Int. Ed., 2015,54, 10155–10159.
19 N. Sebastian, D. O. Lopez, B. Robles-Hernandez, M. R. de laFuente, J. Salud, M. A. Perez-Jubindo, D. A. Dunmur, G. R.Luckhurst and D. J. B. Jackson, Phys. Chem. Chem. Phys.,2014, 16, 21391–21406.
20 S. M. Jansze, A. Martinez-Felipe, J. M. D. Storey, A. T. M. Marcelisand C. T. Imrie, Angew. Chem., Int. Ed., 2015, 54, 643–646.
21 Y. Wang, G. Singh, D. M. Agra-Kooijman, M. Gao, H. K. Bisoyi,C. Xue, M. R. Fisch, S. Kumar and Q. Li, CrystEngComm, 2015,17, 2778–2782.
22 D. Chen, M. Nakata, R. Shao, M. R. Tuchband, M. Shuai,U. Baumeister, W. Weissflog, D. M. Walba, M. A. Glaser, J. E.Maclennan and N. A. Clark, Phys. Rev. E: Stat., Nonlinear, SoftMatter Phys., 2014, 89, 022506.
23 Z. Lu, P. A. Henderson, B. J. A. Paterson and C. T. Imrie, Liq.Cryst., 2014, 41, 471–483.
Soft Matter Paper
Ope
n A
cces
s A
rtic
le. P
ublis
hed
on 1
1 Ju
ly 2
016.
Dow
nloa
ded
on 1
1/23
/202
1 1:
33:3
4 PM
. T
his
artic
le is
lice
nsed
und
er a
Cre
ativ
e C
omm
ons
Attr
ibut
ion
3.0
Unp
orte
d L
icen
ce.
View Article Online

6840 | Soft Matter, 2016, 12, 6827--6840 This journal is©The Royal Society of Chemistry 2016
24 C. Greco, G. R. Luckhurst and A. Ferrarini, Soft Matter, 2014,10, 9318–9323.
25 J. Xiang, Y. Li, Q. Li, D. A. Paterson, J. M. D. Storey,C. T. Imrie and O. D. Lavrentovich, Adv. Mater., 2015, 27,3014–3018.
26 A. A. Dawood, M. C. Grossel, G. R. Luckhurst, R. M. Richardson,B. A. Timimi, N. J. Wells and Y. Z. Yousif, Liq. Cryst., 2016, 43,2–12.
27 C. T. Archbold, E. J. Davis, R. J. Mandle, S. J. Cowling andJ. W. Goodby, Soft Matter, 2015, 11, 7547–7557.
28 B. Senyuk, Y. K. Kim, L. Tortora, S. T. Shin, S. V. Shiyanovskiiand O. D. Lavrentovich, Mol. Cryst. Liq. Cryst., 2011, 540, 20–41.
29 Y. K. Kim, B. Senyuk and O. D. Lavrentovich, Nat. Commun.,2012, 3, 1133.
30 O. D. Lavrentovich, Y.-K. Kim and B. I. Senyuk, Proc. SPIE,OP211, 2012, 8475, 0G1-7.
31 Y.-K. Kim, M. Majumdar, B. I. Senyuk, L. Tortora, J. Seltmann,M. Lehmann, A. Jakli, J. T. Gleeson, O. D. Lavrentovich andS. Sprunt, Soft Matter, 2012, 8, 8880–8890.
32 M. Gao, Y.-K. Kim, C. Zhang, V. Borshch, S. Zhou, H.-S. Park,A. Jakli, O. D. Lavrentovich, M.-G. Tamba, A. Kohlmeier,G. H. Mehl, W. Weissflog, D. Studer, B. Zuber, H. Gnaegiand F. Lin, Microsc. Res. Tech., 2014, 77, 754–772.
33 M. J. Frisch, et al., Gaussian 09 (Revision B.01), GaussianInc., Wallingford CT, 2010.
34 M. P. Johansson and J. Olsen, J. Chem. Theory Comput.,2008, 4, 1460–1471.
35 G. Cinacchi and G. Prampolini, J. Phys. Chem. A, 2003, 107,5228–5232.
36 G. D. Smith, R. L. Jaffe and D. Y. Yoon, J. Phys. Chem., 1996,100, 13439–13446.
37 N. Metropolis, A. W. Rosenbluth, M. N. Rosenbluth, A. H. Tellerand E. Teller, J. Chem. Phys., 1953, 21, 1087–1092.
38 P. W. Flory, Statistical Mechanics of Chain Molecules, Wiley-Interscience, New York, 1969.
39 Handbook of Chemistry and Physics, ed. D. R. Lide, CRCPress, Boca Raton, 1996.
40 M. F. Sanner, A. J. Olson and J. C. Spehner, Biopolymers,1996, 38, 305–320.
41 M. Kleman and O. D. Lavrentovich, Soft Matter Physics: AnIntroduction, Springer-Verlag, NY, 2003.
42 P. K. Challa, V. Borshch, O. Parri, C. T. Imrie, S. N. Sprunt,J. T. Gleeson, O. D. Lavrentovich and A. Jakli, Phys. Rev. E:Stat., Nonlinear, Soft Matter Phys., 2014, 89, 060501.
43 C. Meyer, G. R. Luckhurst and I. Dozov, J. Mater. Chem. C,2015, 3, 318–328.
44 C. Meyer, G. R. Luckhurst and I. Dozov, Phys. Rev. Lett.,2013, 111, 067801.
45 S. M. Shamid, S. Dhakal and J. V. Selinger, Phys. Rev. E: Stat.,Nonlinear, Soft Matter Phys., 2013, 87, 052503.
46 E. I. Kats and V. V. Lebedev, JETP Lett., 2014, 100, 110–113.47 D. O. Lopez, B. Robles-Hernandez, J. Salud, M. R. de la
Fuente, N. Sebastian, S. Diez-Berart, X. Jaen, D. A. Dunmurand G. R. Luckhurst, Phys. Chem. Chem. Phys., 2016, 18,4394–4404.
48 N. Sebastian, M. R. de la Fuente, D. O. Lopez, M. A. Perez-Jubindo, J. Salud, S. Diez-Berart and M. B. Ros, J. Phys.Chem. B, 2011, 115, 9766–9775.
49 N. Sebastian, D. O. Lopez, S. Diez-Berart, M. R. de la Fuente,J. Salud, M. A. Perez-Jubindo and M. B. Ros, Materials, 2011,4, 1632–1647.
50 S. J. Rzoska, A. Drozd-Rzoska, P. K. Mukherjee, D. O. Lopezand J. C. Martinez-Garcia, J. Phys.: Condens. Matter, 2013,25, 245105.
51 L. Beguin, J. W. Emsley, M. Lelli, A. Lesage, G. R. Luckhurst,B. A. Timimi and H. Zimmermann, J. Phys. Chem. B, 2012,116, 7940–7951.
52 C. Greco, G. R. Luckhurst and A. Ferrarini, Phys. Chem.Chem. Phys., 2013, 15, 14961–14965.
53 J. P. Jokisaari, G. R. Luckhurst, B. A. Timimi, J. Zhu andH. Zimmermann, Liq. Cryst., 2015, 42, 708–721.
54 A. P. J. Emerson and G. R. Luckhurst, Liq. Cryst., 1991, 10,861–868.
55 C. T. Imrie and G. R. Luckhurst, in Handbook of Liquid Crystals,ed. J. W. Goodby, P. J. Collings, T. Kato, C. Tschierske,H. F. Gleeson and P. Raynes, Wiley-VCH Verlag GmbH & Co.KGaA, 2014, ch. 5, vol. 7.
56 B. Robles-Hernandez, N. Sebastian, M. R. de la Fuente,D. O. Lopez, S. Diez-Berart, J. Salud, M. B. Ros, D. A. Dunmur,G. R. Luckhurst and B. A. Timimi, Phys. Rev. E: Stat., Nonlinear,Soft Matter Phys., 2015, 92, 062505.
57 G. R. Luckhurst, Macromol. Symp., 1995, 96, 1–26.58 R. Memmer, Liq. Cryst., 2002, 29, 483–496.59 G. R. Luckhurst, Thin Solid Films, 2001, 393, 40–52.60 J. W. Emsley and G. R. Luckhurst, Mol. Phys., 1980, 41,
19–29.61 A. Ferrarini, G. R. Luckhurst and P. L. Nordio, Mol. Phys.,
1995, 85, 131–143.
Paper Soft Matter
Ope
n A
cces
s A
rtic
le. P
ublis
hed
on 1
1 Ju
ly 2
016.
Dow
nloa
ded
on 1
1/23
/202
1 1:
33:3
4 PM
. T
his
artic
le is
lice
nsed
und
er a
Cre
ativ
e C
omm
ons
Attr
ibut
ion
3.0
Unp
orte
d L
icen
ce.
View Article Online