understanding the spatial pattern of urban crime: a...
TRANSCRIPT

Understanding the spatial pattern of urban crime: a developing
country’s perspective
Faisal Umar*1
, James Cheshire†1
and Shane Johnson‡2
1UCL Department of Geography, Pearson Building,
Gower Street, London, WC1E 6BT 2UCL Department of Security and Crime Science,
35 Tavistock Square, London, WC1H 9EZ
January 9, 2015
Summary
Much of the published spatial analysis research of crime to date has been focused on Euro-American
cities. This paper attempts to provide an insight on how we can better understand the spatial pattern of
crime in a typical developing country’s setting. Data were obtained through extensive field mapping,
a block environmental inventory (BEI) and a crime victimization survey to generate a GIS-database of
the study area. Grid thematic maps (GTM) for different crime types were produced for visual analysis,
which suggests, as observed in many Euro-American studies, crime clusters geographically.
KEYWORDS: GIS, urban crime, hotspots maps, developing country,
1. Introduction
Researching the spatial pattern of urban crime is not a recent development (see Zorbaugh, 1929; Shaw
and Mckay, 1969; and Burgess and Bogue, 1964) and, for obvious reasons, remains the subject of
significant academic attention (Weisburd et al., 2009). Crime clusters spatially (see Shaw and McKay,
1969; Sampson and Groove, 1989; Johnson, 2010) as opportunities for crime are also not evenly
distributed across space. The bulk of research to date has pursued a theoretical perspective to better
conceptualise and understand crime events alongside the empirical research conducted to test the
validity of such theories. However, most research has concerned itself with urban crime in Euro-
American cities, largely due to the availability of data in these countries. As data are now gradually
becoming available, this paper presents an insight on how we can better understand patterns of crime
in the context of developing countries with a particular focus on Kaduna – Nigeria. Research in this
context – a typical African setting – is almost non-existent (Igbinovia, 1989; Arthur, 1994; and
Mushanga, 2004). To address this we start by asking how does urban crime cluster in a typical
developing country’s setting? The question is a basic one because it has never been asked of Kaduna
and few African cities have been subject to the intensive data collection exercise described here.
2. Background
Urban areas in countries like Nigeria often develop with little or no centralized planning and may
have features that are far less prevalent or even non-existent in typical Euro-American cities. These
characteristics, combined with extremely sparse spatially referenced crime and population datasets,
make for a challenging environment in which to undertake the kinds of research taken for granted in
more developed countries. The site of this study, Badarawa-Malali district, is an urban district within
Kaduna (see Figure 1), the capital city of Kaduna state which also serves as the regional capital of the
* [email protected], †

Northern Nigeria. The city is an important political, transportation and trade hub and houses a diverse
population in terms of socio-economic class and racial make-up. The physical setting of the city is
mixed – formal settlements with western style physical planning and informal settlements that usually
emerged with little or no centralize planning.
Figure 1: Kaduna Metropolis
Kaduna has an estimated population of 1.14million people and covers a total land area of about
250km2 making the population density to be around 4,560 Person/km
2 (Max-Lock Consultancy
Nigeria (MLCN), 2010).
2.1 Badarawa-Malali Urban District
Badarawa-Malala district (see Figure 2) has a population of 96,540 people (MLCN, 2010), which
represents 8.4% of the total population of Kaduna. The average household size in this district is 9.3
persons, which is almost the same as the city’s average (9.8 persons). As it could be observed from
Figure 2, significant parts of the district appear to be densely populated. These are informal
settlements, characterised by irregular plot layouts with narrow streets that are mostly unpaved. The
other parts of the district, formal settlements, are the low and medium density areas which streets are
wide and mostly paved with regular sized plots aligned and well-arranged on large street blocks.

MLCN (2010) suggests that, the traditional community identity varies between the high, medium and
low density areas. These variations in both social and physical settings provide for an interesting
study of the spatial distribution of urban crime.
Figure 2: Satellite image with boundaries of Badarawa-Malali. See Figure 1 for district in context.
3. Data and Method
This study obtained primary data using three methods.
(a) Mapping exercise – fieldwork conducted to map the study area using paper maps produced from
high-resolution satellite images. During this exercise, the boundaries of every property was marked on
the paper maps and a unique reference number (URN) was assigned to each identified property (see
Figure 3 for example). The data collected from the fieldwork were digitized using OpenLayers plugin
in QGIS 2.0, and all URNs were entered for every property. The URN allowed for the integration of
all datasets in a GIS environment at a later stage.
Figure 3: A sample of the paper Map (printed map is A3)

(b) Block Environmental Inventory (BEI) (see Perkins et al., 1990) used to obtain data on the
condition of the built environment.
(c) Household and crime victimization survey used to obtain data on crime incidents and a range of
other demographic variables. All fieldworks were conducted between March and June 2014.
3.1 Block Environmental Inventory (BEI)
Trained enumerators collected data on the physical attributes related to properties using a structured
BEI form prepared for this exercise (see Figure 4 for the BEI Form). First, the URN assigned to a
property from the mapping exercise was entered as the RefNo and all other items on the BEI form
were recorded accordingly. The records were entered into a spreadsheet and later joined to the spatial
data generated from the mapping exercise.
Figure 4: The Header of the BEI Form
(a)

(b)
Figure 5: Badarawa-Malali urban district (a) Land Use (b) Density of residential units– all datasets
used in producing these maps were collected from the BEI exercises.
3.2 Household and Crime Victimization Survey
A structured questionnaire interview was designed to collect data on (a) crime incidents, and (b)
demographic variables. Each questionnaire has respondent’s property URN which corresponds to the
one generated during the mapping exercise. This enables the geocoding of the survey data. A total of
2,027 households were interviewed, although, only 1,922 were included in this study. 105 responses
were rejected for either lacking or possessing a duplicated URN, or a person at the property declined
to respond to most questions. 44 questions were asked – eleven related to demography, such as,
ethnicity, household structure and employment status – ten related to collective efficacy – and others
related to crime victimisation. Respondents could report: residential burglary; residential stealing;
damage to property; theft of automobile; theft from automobile; and damage to automobile.
Table 1: Number of households reporting crime incidents
Type of Crime No. of households
Residential Burglary 327
Residential Stealing 664
Damage to Property 278
Theft from Automobile 200
Theft of Automobile 126
Damage to Automobile 290

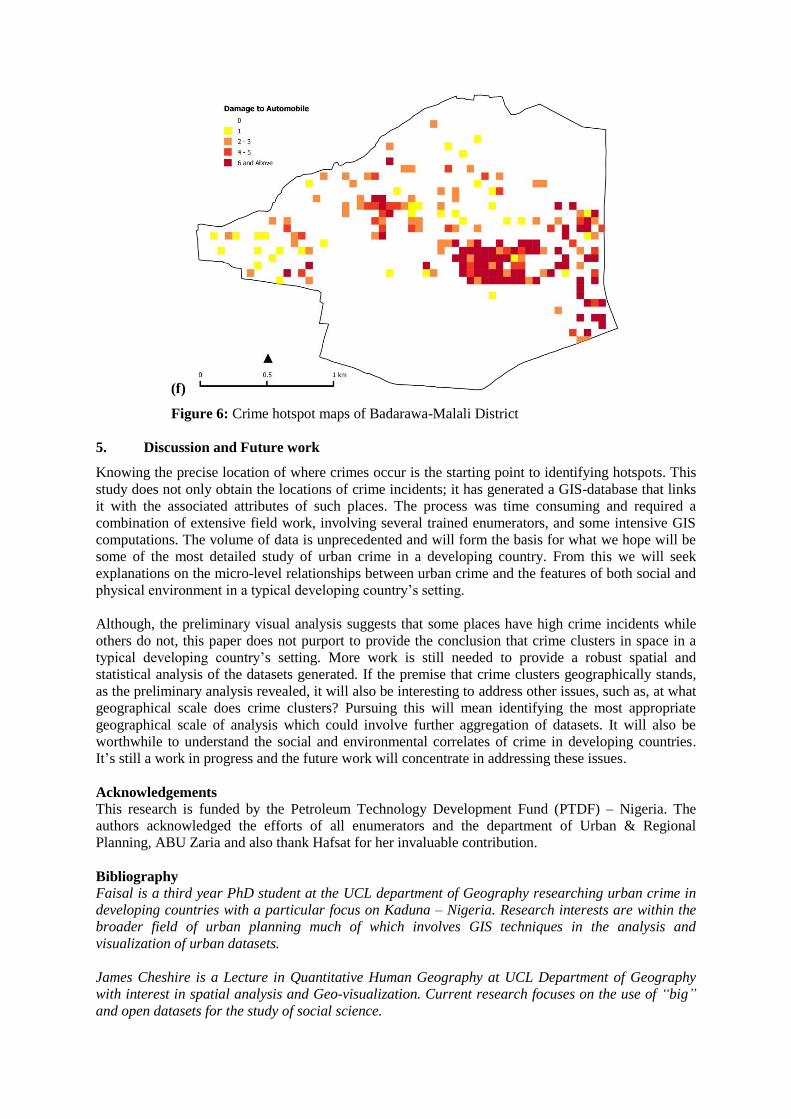
4. Analysis
Although there are arguably more precise approaches (see Chainey et al, 2008), for some obvious
reasons one of which is the lack of appropriate smaller geographical unit of analysis in the area under
study, Grid Thematic Mapping (GTM) technique was considered at this stage in creating crime
hotspot maps using a grid-cell size of 55m square. A count of reported incidents within every grid-cell
was taken for each of the six crime types and hotspot maps were produced. A visual analysis of these
maps (see Figure 6: a – f) suggests that, crime tends to concentrate in particular grid-cells but not in
others and different types of crime show different spatial patterns. This concurred with the general
existing knowledge about the spatial patterns of urban crime.
(a)
(b)

(c)
(d)
(e)
(f)
Figure 6: Crime hotspot maps of Badarawa-Malali District
5. Discussion and Future work
Knowing the precise location of where crimes occur is the starting point to identifying hotspots. This
study does not only obtain the locations of crime incidents; it has generated a GIS-database that links
it with the associated attributes of such places. The process was time consuming and required a
combination of extensive field work, involving several trained enumerators, and some intensive GIS
computations. The volume of data is unprecedented and will form the basis for what we hope will be
some of the most detailed study of urban crime in a developing country. From this we will seek
explanations on the micro-level relationships between urban crime and the features of both social and
physical environment in a typical developing country’s setting.
Although, the preliminary visual analysis suggests that some places have high crime incidents while
others do not, this paper does not purport to provide the conclusion that crime clusters in space in a
typical developing country’s setting. More work is still needed to provide a robust spatial and
statistical analysis of the datasets generated. If the premise that crime clusters geographically stands,
as the preliminary analysis revealed, it will also be interesting to address other issues, such as, at what
geographical scale does crime clusters? Pursuing this will mean identifying the most appropriate
geographical scale of analysis which could involve further aggregation of datasets. It will also be
worthwhile to understand the social and environmental correlates of crime in developing countries.
It’s still a work in progress and the future work will concentrate in addressing these issues.
Acknowledgements
This research is funded by the Petroleum Technology Development Fund (PTDF) – Nigeria. The
authors acknowledged the efforts of all enumerators and the department of Urban & Regional
Planning, ABU Zaria and also thank Hafsat for her invaluable contribution.
Bibliography
Faisal is a third year PhD student at the UCL department of Geography researching urban crime in
developing countries with a particular focus on Kaduna – Nigeria. Research interests are within the
broader field of urban planning much of which involves GIS techniques in the analysis and
visualization of urban datasets.
James Cheshire is a Lecture in Quantitative Human Geography at UCL Department of Geography
with interest in spatial analysis and Geo-visualization. Current research focuses on the use of “big”
and open datasets for the study of social science.

Shane Johnson is a Professor and Deputy Head of Department at the UCL Department for Security
and Crime Science. Area of particular research interest, among others, is on exploring how methods
from other disciplines can inform understanding of crime and security issues.
References
Arthur J A (1994). Criminology and crime justice research in Africa: problems and prospects.
International Review of Modern Sociology, 24(1), 75 – 94.
Burgess E W and Bogue D J (1964). The delinquency research of Clifford R. Shaw and Henry D.
McKay and associates. In E W Burgess and D J Bogue (Eds.). Contributions to urban sociology.
The University of Chicago Press, Chicago.
Chainey S P, Tompson L and Uhlig S (2008). The Utility of Hotspot Mapping for Predicting Spatial
Patterns of Crime. Security Journal, 21(1-2), 4-28.
Igbinovia P E (1989). Criminology in Africa. International Journal of Offender Therapy and
Comparative Criminology, 33(2), v-x.
Johnson, S D (2010). A brief history of the analysis of crime concentration. European Journal of
Applied Mathematics, 21(4-5), 349–370.
Max-Lock Consultancy Nigeria (2010). Kaduna Master Plan: Draft Final Report. Max-Lock
Centre, University of Westminster.
Mushanga T (2004). Criminology in Africa. Fountain Publishers, Kampala.
Perkins D D, Florin P, Rich R C, Wandersman A, and Chavis D M (1990). Participation and the
social and physical environment of residential blocks: Crime and community context. American
Journal of Community Psychology, 18(1), 83–115.
Sampson R J and Groves W B (1989). Community structure and crime: Testing social
disorganization theory. American Journal of Sociology, 94 (4), 774-802.
Shaw C R and McKay H D (1969). Juvenile delinquency and urban areas, (Rev. Ed.). The
University of Chicago Press, Chicago. (Original work published 1942).
Weisburd D, Bruinsman G J N and Bernasco W (2009). Units of Analysis in Geographic
Criminology: Historical Development, Critical Issues, and Open Questions. D Weisburd, G J N
Bruinsman and W Bernasco (Eds). Putting Crime in its Place. Springer Science.
Zorbaugh H W (1929). The gold coast and the slum: A sociological study of Chicago’s near north
side. The University of Chicago Press, Chicago.