understanding the role of parent engagement to … · 1 understanding the role of parent engagement...
TRANSCRIPT
The author(s) shown below used Federal funds provided by the U.S. Department of Justice and prepared the following final report: Document Title: Understanding the Role of Parent Engagement
to Enhance Mentoring Outcomes: Final Evaluation Report
Author(s): Lara Kaye, Carolyn Smith Document No.: 247571 Date Received: July 2014 Award Number: 2011-JU-FX-0021 This report has not been published by the U.S. Department of Justice. To provide better customer service, NCJRS has made this Federally-funded grant report available electronically.
Opinions or points of view expressed are those of the author(s) and do not necessarily reflect
the official position or policies of the U.S. Department of Justice.
Understanding the Role of Parent Engagement to
Enhance Mentoring Outcomes:
Final Evaluation Report
June 2014
by Lara Kaye and Carolyn Smith
with thoughtful feedback from Brad Watts and Rose Greene
This project was supported by Grant No. 2011-JU-FX-0021 awarded by the Office of Juvenile Justice and
Delinquency Prevention, Office of Justice Programs, U.S. Department of Justice. Points of view or
opinions in this document are those of the author and do not necessarily represent the official position
or polices of the U.S. Department of Justice.
This document is a research report submitted to the U.S. Department of Justice. This report has not been published by the Department. Opinions or points of view expressed are those of the author(s)
and do not necessarily reflect the official position or policies of the U.S. Department of Justice.
1
Understanding the Role of Parent Engagement to Enhance Mentoring Outcomes:
Final Evaluation Report
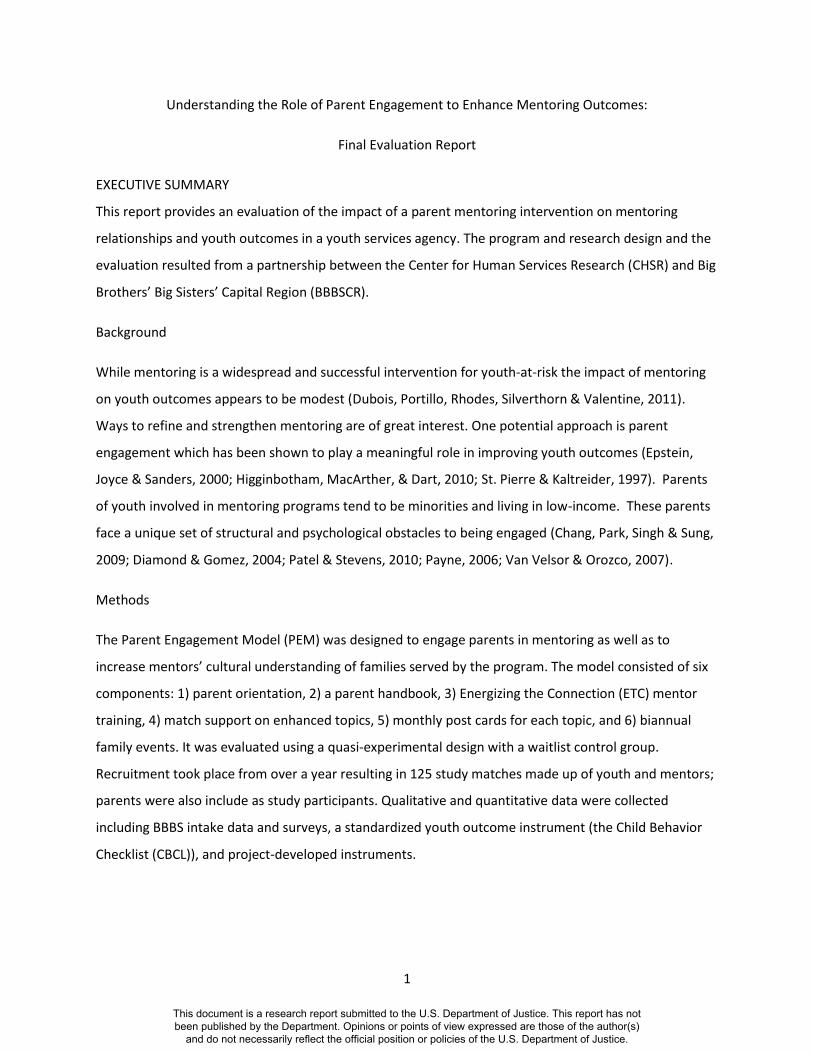
EXECUTIVE SUMMARY
This report provides an evaluation of the impact of a parent mentoring intervention on mentoring
relationships and youth outcomes in a youth services agency. The program and research design and the
evaluation resulted from a partnership between the Center for Human Services Research (CHSR) and Big
Brothers’ Big Sisters’ Capital Region (BBBSCR).
Background
While mentoring is a widespread and successful intervention for youth-at-risk the impact of mentoring
on youth outcomes appears to be modest (Dubois, Portillo, Rhodes, Silverthorn & Valentine, 2011).
Ways to refine and strengthen mentoring are of great interest. One potential approach is parent
engagement which has been shown to play a meaningful role in improving youth outcomes (Epstein,
Joyce & Sanders, 2000; Higginbotham, MacArther, & Dart, 2010; St. Pierre & Kaltreider, 1997). Parents
of youth involved in mentoring programs tend to be minorities and living in low-income. These parents
face a unique set of structural and psychological obstacles to being engaged (Chang, Park, Singh & Sung,
2009; Diamond & Gomez, 2004; Patel & Stevens, 2010; Payne, 2006; Van Velsor & Orozco, 2007).
Methods
The Parent Engagement Model (PEM) was designed to engage parents in mentoring as well as to
increase mentors’ cultural understanding of families served by the program. The model consisted of six
components: 1) parent orientation, 2) a parent handbook, 3) Energizing the Connection (ETC) mentor
training, 4) match support on enhanced topics, 5) monthly post cards for each topic, and 6) biannual
family events. It was evaluated using a quasi-experimental design with a waitlist control group.
Recruitment took place from over a year resulting in 125 study matches made up of youth and mentors;
parents were also include as study participants. Qualitative and quantitative data were collected
including BBBS intake data and surveys, a standardized youth outcome instrument (the Child Behavior
Checklist (CBCL)), and project-developed instruments.
This document is a research report submitted to the U.S. Department of Justice. This report has not been published by the Department. Opinions or points of view expressed are those of the author(s)
and do not necessarily reflect the official position or policies of the U.S. Department of Justice.
2
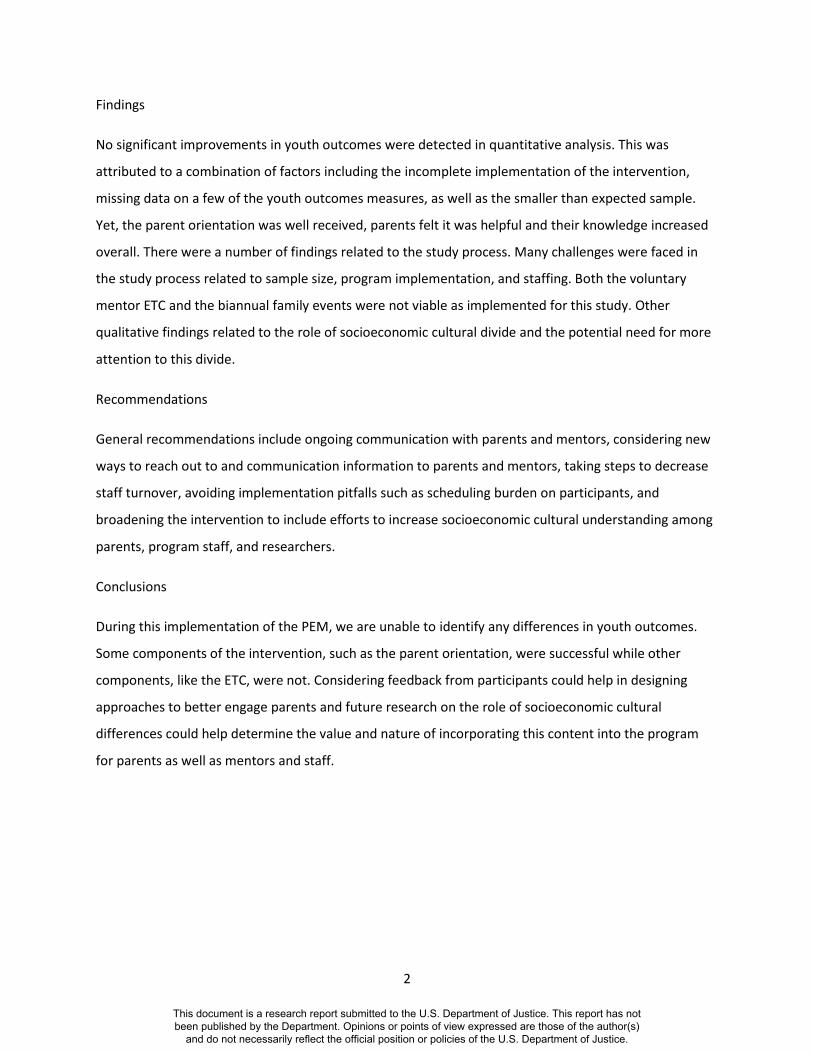
Findings
No significant improvements in youth outcomes were detected in quantitative analysis. This was
attributed to a combination of factors including the incomplete implementation of the intervention,
missing data on a few of the youth outcomes measures, as well as the smaller than expected sample.
Yet, the parent orientation was well received, parents felt it was helpful and their knowledge increased
overall. There were a number of findings related to the study process. Many challenges were faced in
the study process related to sample size, program implementation, and staffing. Both the voluntary
mentor ETC and the biannual family events were not viable as implemented for this study. Other
qualitative findings related to the role of socioeconomic cultural divide and the potential need for more
attention to this divide.
Recommendations
General recommendations include ongoing communication with parents and mentors, considering new
ways to reach out to and communication information to parents and mentors, taking steps to decrease
staff turnover, avoiding implementation pitfalls such as scheduling burden on participants, and
broadening the intervention to include efforts to increase socioeconomic cultural understanding among
parents, program staff, and researchers.
Conclusions
During this implementation of the PEM, we are unable to identify any differences in youth outcomes.
Some components of the intervention, such as the parent orientation, were successful while other
components, like the ETC, were not. Considering feedback from participants could help in designing
approaches to better engage parents and future research on the role of socioeconomic cultural
differences could help determine the value and nature of incorporating this content into the program
for parents as well as mentors and staff.
This document is a research report submitted to the U.S. Department of Justice. This report has not been published by the Department. Opinions or points of view expressed are those of the author(s)
and do not necessarily reflect the official position or policies of the U.S. Department of Justice.
3
INTRODUCTION
The prevalence of single parent households, children living in poverty and low graduation rates portends
a challenging future for youth in America. These risk factors increase the chance of involvement in
juvenile justice system and other negative outcomes for youth. One such example is the Capital Region
of New York State with 35% of children under the age of 18 living in single parent households (U.S.
Census Bureau, 2012 American Community Survey), one in every seven children living in poverty (U.S.
Census Bureau, 2012 American Community Survey) and a 52.3% graduation rate in one of the region’s
largest school districts, Albany City Schools (NYSED Information and Reporting Services, 2012).
Identifying meaningful ways to minimize these risks and ameliorate some of their impacts on youth is
crucial.
Mentoring, an established intervention for at-risk youth, has been linked to positive youth outcomes
(Dubois, Holloway, Valetine & Cooper, 2002; Jekielek, Moore & Hair, 2002; Keating, Tomishima, Foster &
Allesandri, 2002; Herrera et al, 2007; Rhodes, 2008). Mentoring approaches vary in structure and design.
Some programs focus on mentoring in the community while others are school-based. Many programs
are structured around adults mentoring children while others consist of peer-to-peer mentors. The
effects of mentoring are increased by the duration of the relationship and have been shown to have a
positive impact if matches are together for at least 12 months (Grossman & Rhodes, 2002). The quality
of the mentoring relationship and the frequency of contact can also play a role in improving benefits for
youth (Dubois, Neville, Parra & Pugh-Lilly, 2002; Para, Dubois, Neville, Pugh-Lilly & Povinelli, 2002). Yet,
the findings of the effects of mentoring are mixed -- a meta-analysis of 55 evaluations found that the
benefits are modest or small for the average youth (Dubois, Holloway et al., 2002). A subsequent meta-
analysis of 73 evaluations showed that while mentoring programs do improve outcomes across
behavioral, social, emotional and academic domains, these gains continue to be modest (Dubois,
Portillo, et al., 2011). Recommendations from the 2011 meta-analysis include the need for ongoing
refinement and strengthening of mentoring programs.
Parent engagement is seen as a critical element in many intervention programs to improve outcomes for
at-risk youth (Epstein et al., 2000; Higginbotham et al., 2010; St. Pierre & Kaltreider, 1997). Many studies
of parent engagement have been in the field of education and the outcomes tend to be related to
academics (Fan & Chen, 2001; Jeynes, 2005; Jeynes, 2007). Some studies extend beyond education, for
example parent engagement with child welfare services (Gerring, Kemp & Marcenko, 2008) and
mentoring (Higginbotham, MacArthur & Dart, 2010; Spencer, Basualdo-Delmonico, & Lewis, 2011).
This document is a research report submitted to the U.S. Department of Justice. This report has not been published by the Department. Opinions or points of view expressed are those of the author(s)
and do not necessarily reflect the official position or policies of the U.S. Department of Justice.
4
Literature discusses the role of race, ethnicity and socio-economic status on parent engagement (Chang
et al., 2009; Diamond & Gomez, 2004; Patel & Stevens, 2010; Payne, 2006; Van Velsor & Orozco, 2007)
indicating that minority low-income parents face a unique set of structural and psychological obstacles
to being engaged.
Big Brothers Big Sisters Capital Region (BBBSCR) is a local mentoring organization serving families
residing in four counties in the capital region of upstate New York. The program has been in existence
for over 20 years and is affiliated with the nation’s oldest, largest and most well-known youth mentoring
organization, Big Brothers Big Sisters of America. Surveys conducted in 2010 by BBBSCR of parents and
mentors provided feedback from parents indicating a need to be better informed about the program,
procedures, and policies of the organization. Feedback from mentors also indicated a need to improve
communication with parents. In addition, the program staff/administration perceived that many match
closures were related to parents’ unrealistic expectation of both the program and the mentor.
The parent engagement model (PEM) that is the focus of this evaluation was based on the need to
refine and strengthen programs to better understand mechanisms that contribute to meaningful
positive outcomes for youth. Development of the model was based on feedback from the local program,
parents, and mentors, as well as literature that suggests parent engagement plays a key role in youth
outcomes.
The model itself was developed in conjunction with the BBBSCR program staff and resulted in six
components: 1) parent orientation, 2) a parent handbook, 3) Energizing the Connection (ETC) mentor
training, 4) match support on enhanced topics, 5) monthly post cards for each topic, and 6) biannual
family events. The first two components, the group parent orientation and the handbook, dealt
specifically with orienting the parents to the program and communicating expectations. ETC was a
workshop for mentors that addressed potential challenges in the match, the role of poverty and
resources, as well as hidden perspectives on poverty. Enhanced match support calls addressed a time
relevant topic about the match such as reasons to call match support or ideas for outings during the
regularly monthly call with parents. In addition to the verbal communication of these topics, BBBS sent
to parents postcards with information related to each topic. Lastly, the biannual family event was a
special event where parents, mentors and matches were invited to spend some time getting to know
each other better, share a meal and do fun activities together.
This document is a research report submitted to the U.S. Department of Justice. This report has not been published by the Department. Opinions or points of view expressed are those of the author(s)
and do not necessarily reflect the official position or policies of the U.S. Department of Justice.
5
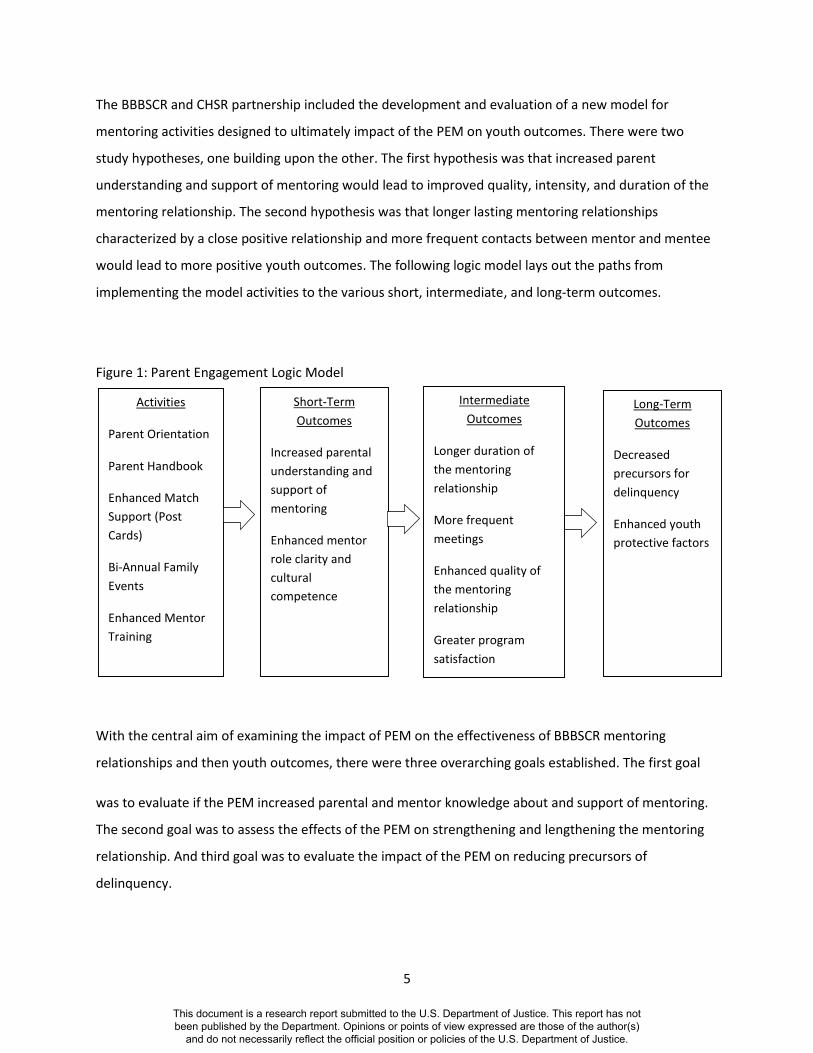
The BBBSCR and CHSR partnership included the development and evaluation of a new model for
mentoring activities designed to ultimately impact of the PEM on youth outcomes. There were two
study hypotheses, one building upon the other. The first hypothesis was that increased parent
understanding and support of mentoring would lead to improved quality, intensity, and duration of the
mentoring relationship. The second hypothesis was that longer lasting mentoring relationships
characterized by a close positive relationship and more frequent contacts between mentor and mentee
would lead to more positive youth outcomes. The following logic model lays out the paths from
implementing the model activities to the various short, intermediate, and long-term outcomes.
Figure 1: Parent Engagement Logic Model
With the central aim of examining the impact of PEM on the effectiveness of BBBSCR mentoring
relationships and then youth outcomes, there were three overarching goals established. The first goal
was to evaluate if the PEM increased parental and mentor knowledge about and support of mentoring.
The second goal was to assess the effects of the PEM on strengthening and lengthening the mentoring
relationship. And third goal was to evaluate the impact of the PEM on reducing precursors of
delinquency.
Short-Term
Outcomes
Increased parental
understanding and
support of
mentoring
Enhanced mentor
role clarity and
cultural
competence
Activities
Parent Orientation
Parent Handbook
Enhanced Match
Support (Post
Cards)
Bi-Annual Family
Events
Enhanced Mentor
Training
Long-Term
Outcomes
Decreased
precursors for
delinquency
Enhanced youth
protective factors
Intermediate
Outcomes
Longer duration of
the mentoring
relationship
More frequent
meetings
Enhanced quality of
the mentoring
relationship
Greater program
satisfaction
This document is a research report submitted to the U.S. Department of Justice. This report has not been published by the Department. Opinions or points of view expressed are those of the author(s)
and do not necessarily reflect the official position or policies of the U.S. Department of Justice.
6
METHODS
Design
The study design was developed considering programmatic feasibility and study rigor, resulting in a
quasi-experimental design with a naturally occurring treatment-as-usual (TAU) group and a group of
participants who received the enhanced mentoring intervention (PEM). There were several factors in
this decision including the anticipated rate of matching over the enrollment period to build the sample,
sufficient power to detect statistically significant differences, and the program’s existing waitlist of
families. These factors determined a desired sample size of 200. Matches were made up of mentors and
youth; newly enrolled youth and mentors were placed in the treatment or PEM group and all youth
from the wait list were placed in the TAU group. Additionally, a programmatic decision was made prior
to the start of the grant to offer the parent orientation to all new families interested in enrolling in the
BBBSCR program, precluding any new matches from being eligible for the TAU group.
We received approval from the University at Albany Institutional Review Board for the PEM study in late
November, 2011 and then began to recruit parents, mentors, and youth. Recruitment of individual
participants went as planned yet making matches to fill the sample took longer than expected. While
over time the rate of matching did increase, it never reached the projected rate of 25 matches per
month. The original optimistic projection was based on previous rates of matching and potential new
staffing for the project. Two ideas were implemented to increase the sample when the slower rate of
matching became clear: we extended the study enrollment time by four months and we extended the
study to include a related program, the site-based program. At the end of the recruitment period in
November, 2012 the final study sample included 125 matches, with 63 matches in the PEM group and
62 in the TAU group. The breakdown by program was 97 in the community-based program and 28 in the
site-based program.
Instruments
A number of instruments were used to collect both qualitative and quantitative data. The quantitative
instruments to gather potential outcome measures, including existing BBBS instruments, project
developed instruments, a standardized instrument to measure behavior problems and competencies
(the Child Behavior Check List (CBCL); Achenbach & Rescorla, 2001), and school data. BBBS intake forms
provided background characteristics for parents, mentors and youth. The Strength of Relationship
Survey (SoR), also a BBBS instrument, was used to capture the quality of the mentoring relationship;
This document is a research report submitted to the U.S. Department of Justice. This report has not been published by the Department. Opinions or points of view expressed are those of the author(s)
and do not necessarily reflect the official position or policies of the U.S. Department of Justice.
7
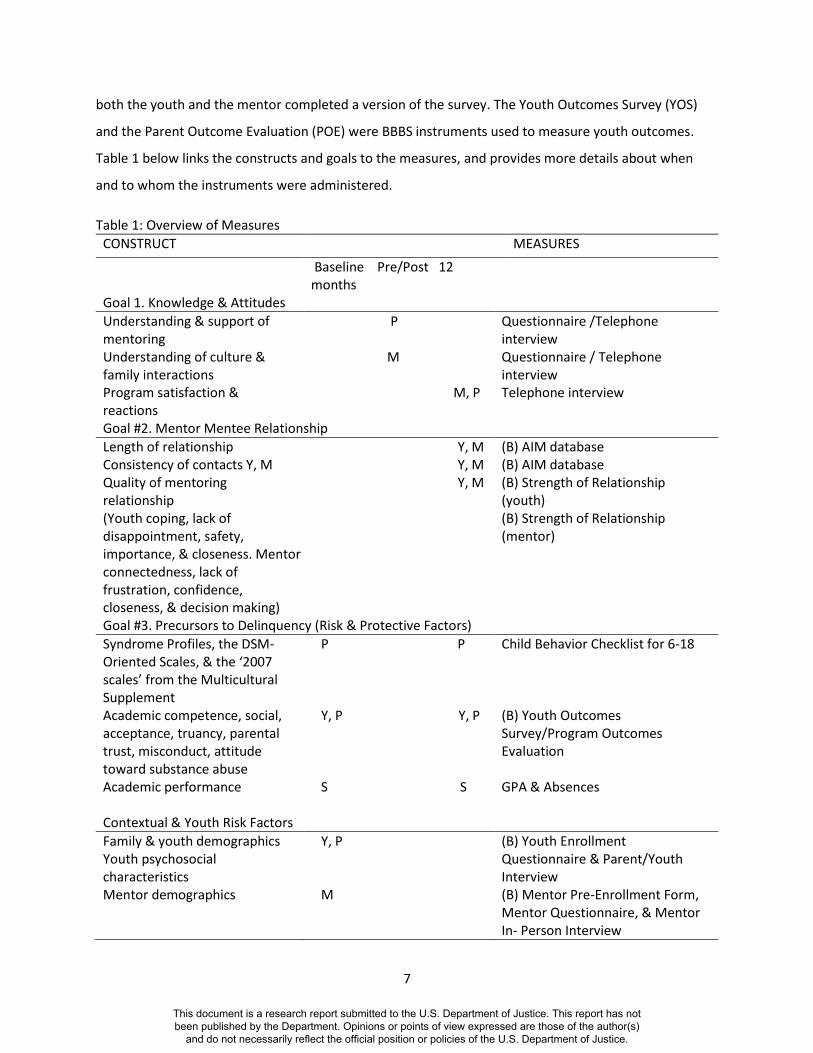
both the youth and the mentor completed a version of the survey. The Youth Outcomes Survey (YOS)
and the Parent Outcome Evaluation (POE) were BBBS instruments used to measure youth outcomes.
Table 1 below links the constructs and goals to the measures, and provides more details about when
and to whom the instruments were administered.
Table 1: Overview of Measures
CONSTRUCT MEASURES
Baseline Pre/Post 12 months
Goal 1. Knowledge & Attitudes
Understanding & support of mentoring
P Questionnaire /Telephone interview
Understanding of culture & family interactions
M Questionnaire / Telephone interview
Program satisfaction & reactions
M, P Telephone interview
Goal #2. Mentor Mentee Relationship
Length of relationship Y, M (B) AIM database Consistency of contacts Y, M Y, M (B) AIM database Quality of mentoring relationship (Youth coping, lack of disappointment, safety, importance, & closeness. Mentor connectedness, lack of frustration, confidence, closeness, & decision making)
Y, M (B) Strength of Relationship (youth) (B) Strength of Relationship (mentor)
Goal #3. Precursors to Delinquency (Risk & Protective Factors)
Syndrome Profiles, the DSM-Oriented Scales, & the ‘2007 scales’ from the Multicultural Supplement
P P Child Behavior Checklist for 6-18
Academic competence, social, acceptance, truancy, parental trust, misconduct, attitude toward substance abuse
Y, P Y, P (B) Youth Outcomes Survey/Program Outcomes Evaluation
Academic performance S S GPA & Absences
Contextual & Youth Risk Factors
Family & youth demographics Youth psychosocial characteristics
Y, P (B) Youth Enrollment Questionnaire & Parent/Youth Interview
Mentor demographics M (B) Mentor Pre-Enrollment Form, Mentor Questionnaire, & Mentor In- Person Interview
This document is a research report submitted to the U.S. Department of Justice. This report has not been published by the Department. Opinions or points of view expressed are those of the author(s)
and do not necessarily reflect the official position or policies of the U.S. Department of Justice.
8
B=BBBSCR Measures; P= Parent self-report; C=Youth self-report; M=Mentor self- ratings, S=School Reports
A set of pre- and post-test instruments made of mostly quantitative data were developed specifically for
the project by the research team and were used to measure changes in knowledge, perceptions, and
expectation before and after the parent orientation and the enhanced mentor training. Participants
were given the opportunity to ask questions and facilitators were trained to use the post-test results as
a chance to continue to educate; if a pattern of incorrect responses was noticed the trainer could review
and discuss the content with the entire group as a means of clarification.
Telephone interviews for mentors and parents collected were also developed to collect qualitative data
to better understand the mentoring relationship and experience, the impact of mentoring, and program
satisfaction. Telephone interviews took place at the 1 year follow-up point for each match. Two pieces
of school data were collected, attendance and grade point average; BBBSCR collected parent release
forms for school data for each youth in the study. Because we were interested in the impact of the
intervention, we collected data at the point closest to baseline and then a year later at the same point in
time. For example if the match was made in Sept, Oct or Nov of 2012 then the baseline data would be
the 1st quarter grades and attendance for 2012.
Sample
The final sample consisted of 125 matches and each match consisted of a unit of three individuals, a
youth, a mentor, and the youth’s primary parent or guardian. The sample size, smaller than projected, is
discussed in detail throughout the findings section. The characteristics of parents, mentors, and youth
were consistent with the expected characteristics as described by the program. Table 2 below provides a
snapshot of parent, mentor, and youth background characteristics. Most of the parents (parent or
guardian who completed the intake and enrollment paperwork) were female (95%), with a median of 36
years of age. The age range was from 23 to 81 years of age, with most parents being either between 26
and 35 years of age (45%) or between 36 and 55 years of age (45%). Most of the households were single
parent (68%) and fewer than half reported being employed (46%). Household income levels were
generally low, with over three-fourths earning below $30,000 annually. The majority of parents
identified as either Black or African American (46%) or White (40%).
This document is a research report submitted to the U.S. Department of Justice. This report has not been published by the Department. Opinions or points of view expressed are those of the author(s)
and do not necessarily reflect the official position or policies of the U.S. Department of Justice.
9
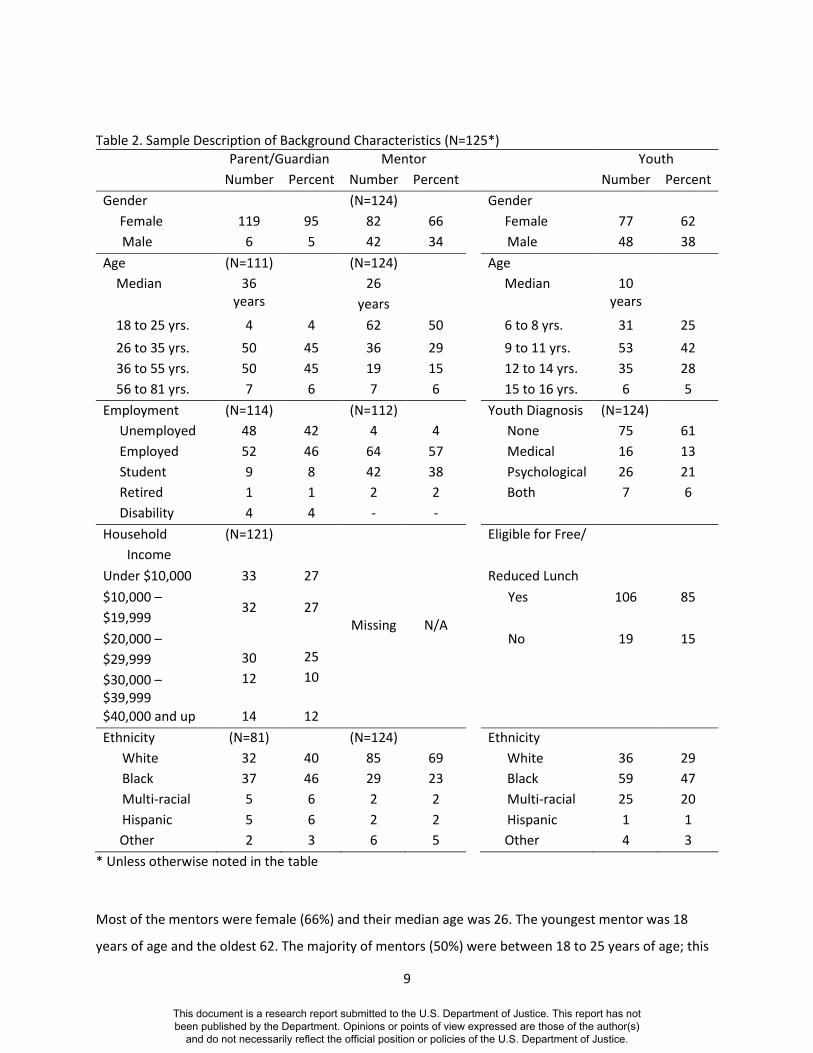
Table 2. Sample Description of Background Characteristics (N=125*)
Parent/Guardian Mentor Youth
Number Percent Number Percent Number Percent
Gender (N=124) Gender
Female 119 95 82 66 Female 77 62
Male 6 5 42 34 Male 48 38
Age (N=111) (N=124) Age
Median 36 years
26
years
Median 10 years
18 to 25 yrs. 4 4 62 50 6 to 8 yrs. 31 25
26 to 35 yrs. 50 45 36 29 9 to 11 yrs. 53 42
36 to 55 yrs. 50 45 19 15 12 to 14 yrs. 35 28
56 to 81 yrs. 7 6 7 6 15 to 16 yrs. 6 5
Employment (N=114) (N=112) Youth Diagnosis (N=124)
Unemployed 48 42 4 4 None 75 61
Employed 52 46 64 57 Medical 16 13
Student 9 8 42 38 Psychological 26 21
Retired
Disability
1
4
1
4
2
-
2
-
Both 7 6
Household
Income
(N=121)
Missing N/A
Eligible for Free/
Under $10,000 33 27 Reduced Lunch
$10,000 –
$19,999 32 27
Yes 106 85
$20,000 –
$29,999
$30,000 – $39,999
30
12
25
10
No 19 15
$40,000 and up 14 12
Ethnicity (N=81) (N=124) Ethnicity
White 32 40 85 69 White 36 29
Black 37 46 29 23 Black 59 47
Multi-racial 5 6 2 2 Multi-racial 25 20
Hispanic 5 6 2 2 Hispanic 1 1
Other 2 3 6 5 Other 4 3
* Unless otherwise noted in the table
Most of the mentors were female (66%) and their median age was 26. The youngest mentor was 18
years of age and the oldest 62. The majority of mentors (50%) were between 18 to 25 years of age; this
This document is a research report submitted to the U.S. Department of Justice. This report has not been published by the Department. Opinions or points of view expressed are those of the author(s)
and do not necessarily reflect the official position or policies of the U.S. Department of Justice.

10
was most likely a result of the inclusion of the site-based mentoring program which is comprised solely
of college-age mentors. Most mentors were either employed (57%) or students (38%). The majority of
mentors identified as White (69%), with 23% Black or African American. About a third of the mentors
had had some previous volunteer experience with youth and few (7%) had previous experience as a
BBBS volunteer.
The youth in the study were primarily female (62%), which was attributed to available mentors being
female and age/gender match requirements; many males are waiting for a match. Their median age was
10 with the youngest being 6 and the oldest being 15. The majority of youth (85%) were eligible for free
or reduced school lunch and about 40% had a clinical diagnosis either medical, psychological, or both.
Most of the youth were identified by their parent as being Black or African American (47%), followed by
White (29%), and multi-racial (20%).
Analysis
This section describes the steps taken to analyze the qualitative and quantitative data that was collected
as part of this study. The decision to include both types of data was based on an interest in
understanding the impact of the intervention through the lens of specific youth outcomes measured as
well as to gain insight and understanding into the parents’ and mentors’ experiences.
Qualitative data analysis of parent and mentor interview responses included many steps. First, all
responses were reviewed by either one of two raters and then thematic categories for each response
were developed. Categories were reviewed and checked by the other rater for confirmation.
Discrepancies were resolved. Additionally, advisory committee members reviewed selected responses
and provided feedback on thematic categories. An example of categories for the question regarding
parents’ experience with the program included ‘benefit to the parent,’ ‘benefit to the youth,’ ‘positive
match,’ ‘negative match,’ and ‘opportunities provided to youth,’ as well as categories representing
program-specific positive/negative views, and overall positive/negative/neutral views of the program.
Subsequently, each category was coded as ‘1’ or ‘0’ for each participant, indicating the fit of each
participant’s response with the category. Overall frequencies were calculated for each category to yield
the total number of participants who identified with each theme.
Quantitative analysis techniques were used to assess the impact of the PEM on youth and mentor
outcomes. Because the quasi-experimental naturally occurring waitlist design does not necessarily
eliminate bias in the same manner as a true random assignment design, we used propensity score
This document is a research report submitted to the U.S. Department of Justice. This report has not been published by the Department. Opinions or points of view expressed are those of the author(s)
and do not necessarily reflect the official position or policies of the U.S. Department of Justice.
11
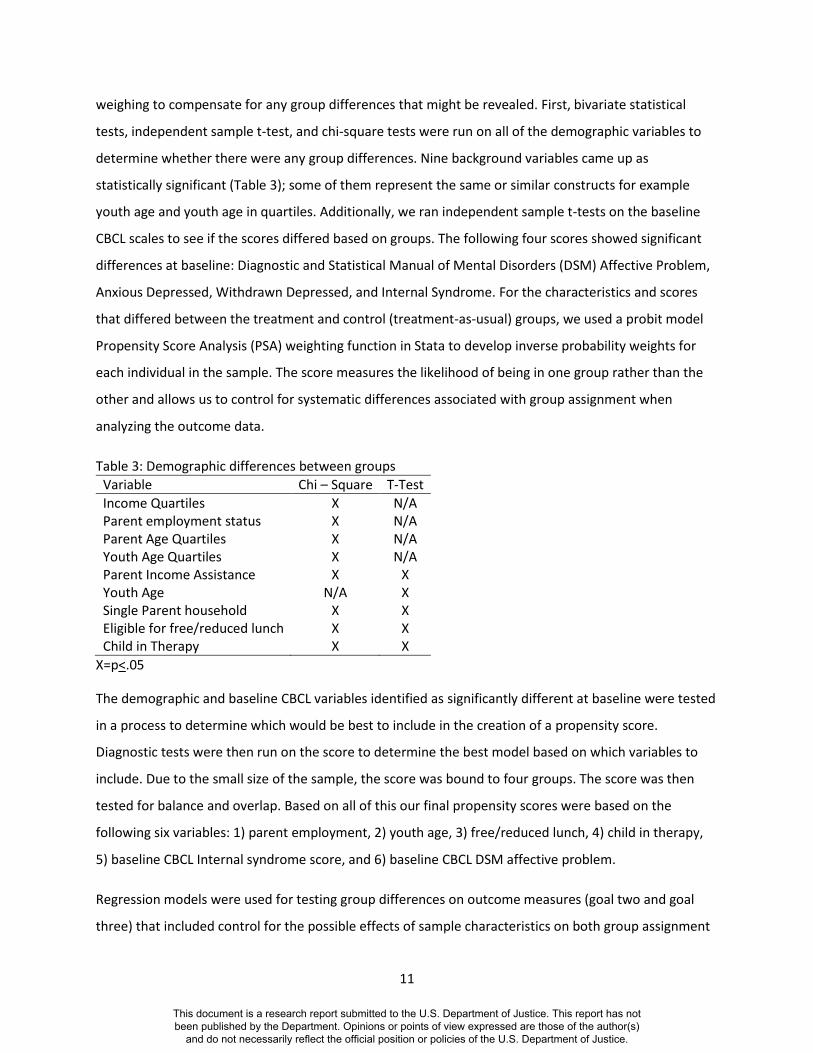
weighing to compensate for any group differences that might be revealed. First, bivariate statistical
tests, independent sample t-test, and chi-square tests were run on all of the demographic variables to
determine whether there were any group differences. Nine background variables came up as
statistically significant (Table 3); some of them represent the same or similar constructs for example
youth age and youth age in quartiles. Additionally, we ran independent sample t-tests on the baseline
CBCL scales to see if the scores differed based on groups. The following four scores showed significant
differences at baseline: Diagnostic and Statistical Manual of Mental Disorders (DSM) Affective Problem,
Anxious Depressed, Withdrawn Depressed, and Internal Syndrome. For the characteristics and scores
that differed between the treatment and control (treatment-as-usual) groups, we used a probit model
Propensity Score Analysis (PSA) weighting function in Stata to develop inverse probability weights for
each individual in the sample. The score measures the likelihood of being in one group rather than the
other and allows us to control for systematic differences associated with group assignment when
analyzing the outcome data.
Table 3: Demographic differences between groups
Variable Chi – Square T-Test
Income Quartiles X N/A Parent employment status X N/A Parent Age Quartiles X N/A Youth Age Quartiles X N/A Parent Income Assistance X X Youth Age N/A X Single Parent household X X Eligible for free/reduced lunch X X Child in Therapy X X
X=p<.05
The demographic and baseline CBCL variables identified as significantly different at baseline were tested
in a process to determine which would be best to include in the creation of a propensity score.
Diagnostic tests were then run on the score to determine the best model based on which variables to
include. Due to the small size of the sample, the score was bound to four groups. The score was then
tested for balance and overlap. Based on all of this our final propensity scores were based on the
following six variables: 1) parent employment, 2) youth age, 3) free/reduced lunch, 4) child in therapy,
5) baseline CBCL Internal syndrome score, and 6) baseline CBCL DSM affective problem.
Regression models were used for testing group differences on outcome measures (goal two and goal
three) that included control for the possible effects of sample characteristics on both group assignment
This document is a research report submitted to the U.S. Department of Justice. This report has not been published by the Department. Opinions or points of view expressed are those of the author(s)
and do not necessarily reflect the official position or policies of the U.S. Department of Justice.
12
and outcome, the regressions were double robust in that they were weighted by the propensity score
and that they included as independent variables the six previously identified variables used in the
calculation of the score. Additionally, because we were interested in potential treatment effects, the
regression models analyses also included the following six variables:
1. Half program dose, representing participants who received at least half of the basic program
dosage
2. Treatment errors, representing any TAU participants that received some part of the treatment
in error
3. Attendance at prior parent orientation, representing any parent participant that attended the
parent orientation prior to the start of the study and therefore the revisions to the parent
orientation
4. Received ETC or biannual family event, representing any parent, child or mentor who attended
the biannual family event or any mentor who attended the ETC training
5. Family effect, representing any families that had multiple children in the study
6. Program, representing whether the match was in the community based program or the site
based program
Inclusion of treatment effect variables allowed us to assess whether or not factors such as dosage or
individual program practices had an impact on participant outcomes that might be separate or in
addition to general program enrollment.
FINDINGS
In order to evaluate the impact of PEM on the effectiveness of BBBSCR mentoring relationships and then
youth outcomes, there were three overarching goals to be examined in the analysis. Evaluating whether
the PEM increased parental and mentor knowledge about and support of mentoring was the first goal.
Assess the effects of the PEM on strengthening the mentoring relationship was the second goal. And
evaluating the impact of the PEM on reducing precursors of delinquency was the third goal. The findings
related to each of these goals will be described below.
Goal One
The first goal was made up of three objectives: 1) increasing knowledge and changing attitudes in both
parents and mentors; 2) increasing mentor’s understanding of culture and family interactions and 3)
increasing program satisfaction in both parents and mentors.
This document is a research report submitted to the U.S. Department of Justice. This report has not been published by the Department. Opinions or points of view expressed are those of the author(s)
and do not necessarily reflect the official position or policies of the U.S. Department of Justice.
13
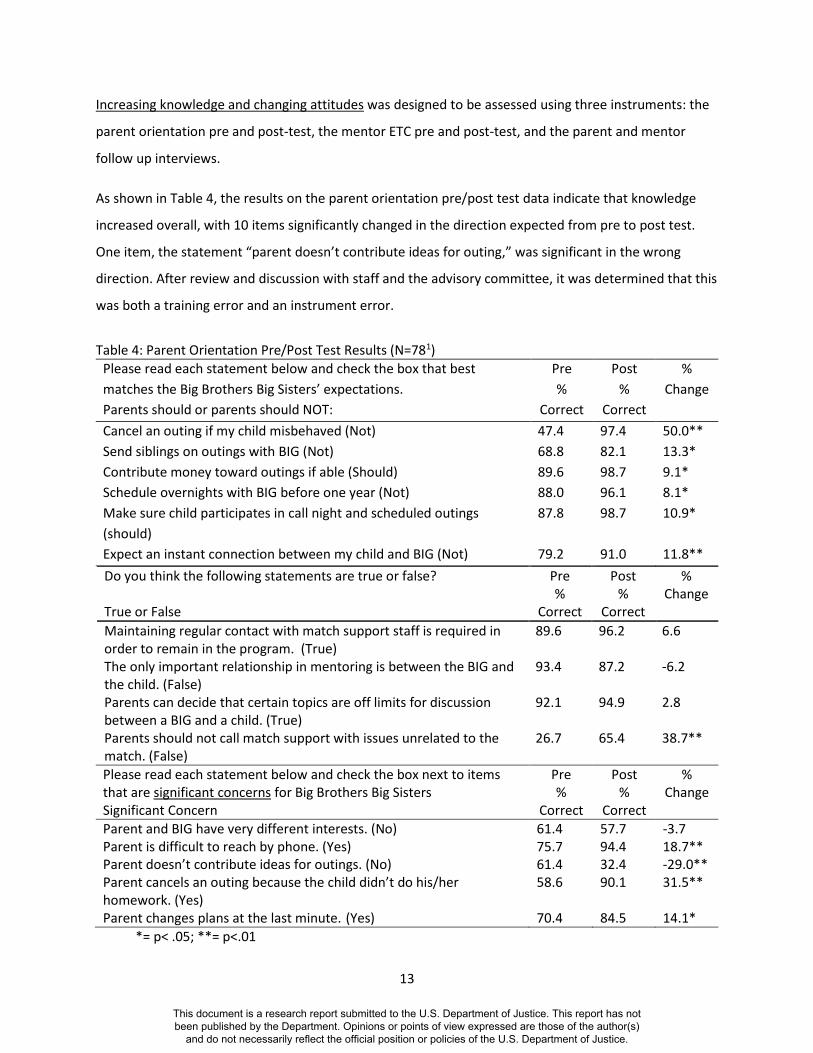
Increasing knowledge and changing attitudes was designed to be assessed using three instruments: the
parent orientation pre and post-test, the mentor ETC pre and post-test, and the parent and mentor
follow up interviews.
As shown in Table 4, the results on the parent orientation pre/post test data indicate that knowledge
increased overall, with 10 items significantly changed in the direction expected from pre to post test.
One item, the statement “parent doesn’t contribute ideas for outing,” was significant in the wrong
direction. After review and discussion with staff and the advisory committee, it was determined that this
was both a training error and an instrument error.
Table 4: Parent Orientation Pre/Post Test Results (N=781)
Please read each statement below and check the box that best
matches the Big Brothers Big Sisters’ expectations.
Parents should or parents should NOT:
Pre
%
Correct
Post
%
Correct
%
Change
Cancel an outing if my child misbehaved (Not) 47.4 97.4 50.0**
Send siblings on outings with BIG (Not) 68.8 82.1 13.3*
Contribute money toward outings if able (Should) 89.6 98.7 9.1*
Schedule overnights with BIG before one year (Not) 88.0 96.1 8.1*
Make sure child participates in call night and scheduled outings
(should)
87.8 98.7 10.9*
Expect an instant connection between my child and BIG (Not) 79.2 91.0 11.8**
Do you think the following statements are true or false? True or False
Pre %
Correct
Post %
Correct
% Change
Maintaining regular contact with match support staff is required in order to remain in the program. (True)
89.6 96.2 6.6
The only important relationship in mentoring is between the BIG and the child. (False)
93.4 87.2 -6.2
Parents can decide that certain topics are off limits for discussion between a BIG and a child. (True)
92.1 94.9 2.8
Parents should not call match support with issues unrelated to the match. (False)
26.7 65.4 38.7**
Please read each statement below and check the box next to items that are significant concerns for Big Brothers Big Sisters Significant Concern
Pre %
Correct
Post %
Correct
% Change
Parent and BIG have very different interests. (No) 61.4 57.7 -3.7 Parent is difficult to reach by phone. (Yes) 75.7 94.4 18.7** Parent doesn’t contribute ideas for outings. (No) 61.4 32.4 -29.0** Parent cancels an outing because the child didn’t do his/her homework. (Yes)
58.6 90.1 31.5**
Parent changes plans at the last minute. (Yes) 70.4 84.5 14.1*
*= p< .05; **= p<.01
This document is a research report submitted to the U.S. Department of Justice. This report has not been published by the Department. Opinions or points of view expressed are those of the author(s)
and do not necessarily reflect the official position or policies of the U.S. Department of Justice.

14
1 Percent Correct are based on non-missing, N ranging from 70-78 and Paired sample t-tests are based
on valid pairs, N ranging from 58-77
Due to significant limitations to the implementation of the Mentor ETC training, there were very few
mentors who attended and therefore even fewer who completed the pre/post-test. The reasons for this
are discussed in further detail in the discussion section. The sample size is too small to report any
findings (N= 8).
Findings from the parent and mentor follow-up telephone interviews are based on the whole sample;
group comparisons are not reported. This decision was made due to the small clusters in response
categories. Comparisons results were anecdotal and we were unable to draw any meaningful
conclusions from them.
In the follow-up interviews, parents discussed many ways in which mentoring made a difference for the
child, some of which seemed to impact the parents themselves or their relationship with their child. One
such example is changes in verbal and social skills including the child’s increased ability to talk to the
parent. Some parents (10) expressed that the experience was also beneficial to them, for example that
their child was happy and that it provided a break.
Mentor feedback related to increasing knowledge and changing of attitudes overlapped with their
understanding of culture and family interactions. It seemed that much of the knowledge gain mentioned
by mentors in the 1 year follow-up interview was specifically related to cultural differences and family
interactions. A few mentors (N=7) did indicate that the experience overall was educational, expressing
that it was “eye opening” to encounter the circumstances that children were coming from and the
challenge of helping families and youth living in disadvantaged households. Of the few mentors that did
attend the ETC trainings, they felt that it helped with connection and communication, increased
understanding, and provided an opportunity for mentors to meet each other and either vent or share
ideas. Parents also provided feedback related to culture, for example some parents indicated that what
they liked best about mentoring was that it was educational for the child, providing opportunities for
them to “see what else is out there.”
Regarding communication with parents, some mentors reported that staying in touch with parents was
easy, while others expressed that this was a real challenge. Some mentors indicated that improving
communications occurred over time, whether through figuring out the best method (e.g. texting), or by
recognizing that it took some time to get comfortable. Related to the preferred method for
This document is a research report submitted to the U.S. Department of Justice. This report has not been published by the Department. Opinions or points of view expressed are those of the author(s)
and do not necessarily reflect the official position or policies of the U.S. Department of Justice.

15
communicating, parents expressed that email was their top choice (N=35), followed by cell phone
(N=29) and then regular mail (N=17). Also a number of mentors (N=13) expressed that one of the things
they liked best about the program was related to their own growth and being exposed to new things, for
example learning about a new culture and different backgrounds.
Parents’ expressed mostly positive feedback related to program satisfaction. A majority (N=39)
mentioned that they were pleased over all, while 12 parents responded with overall neutral comments,
and only 3 parents provided overall negative feedback. Feedback about specific aspects the program
was more mixed, with 15 parents mentioning positive things such as staff being responsive and helpful,
and 7 parents mentioning specific negative things such as the need for better screening and the
program being unreliable.
When asked what about the program worked well, parents noted a good relationship between the child
and mentor (N=26), and the opportunities for children to increase activities and get out of the house
(N=21). Also of note was that the program offered their child someone to confide in (N=13). When asked
about what aspects of the program did not work well, most parents indicated nothing or stated that
they did not know (N=54). This was followed by more specific issues related to the mentor such as
scheduling problems and unreliability of the mentors’ (N=12), miscommunication (N=11), or the mentor
leaving (N=11). Few parents (N=7) indicated issues with the program overall.
The results of the parent interview indicated that almost all parents felt that parent orientation was
helpful, that the timing was just right, and most parents felt the handbook was useful. The postcards
were less well received, although about half the parents still indicated that they were helpful.
When mentors were asked during the mentor interview about their overall experience, they mentioned
positive things about the agency (N=12) such as getting the needed support, being organized, and
providing good training and advice. Conversely, eight mentors mentioned negative things about the
agency such as staff turnover, disorganization, and not being involved enough. Additionally, when asked
for suggestions to improve the program 10 mentors commented on staffing problems, such as poor
communication, as well as the quality of the staff. Most mentors felt the mentor orientation was
positive (N=66), describing it as informative, helpful, convenient, energetic, and an opportunity to meet
other mentors. The most helpful aspects of the orientation were reported to be information about
general rules and guidelines (N=32) such as expectations and policies and procedures, and knowing
This document is a research report submitted to the U.S. Department of Justice. This report has not been published by the Department. Opinions or points of view expressed are those of the author(s)
and do not necessarily reflect the official position or policies of the U.S. Department of Justice.

16
what to expect (N=23), such as potential scenarios and family dynamics. Only a few mentioned negative
things about the orientation (N=6).
Suggestions to improve the program from mentors primarily described changes related to events and
activities (N=16). Some mentors indicated that more activities were needed for younger kids, or kids of
all ages. Some mentors suggested a forum to post activities, and others felt more weekend events were
needed or better events in general. The parents’ most common suggestion to improve the program was
related to better screening for the mentor’s commitment and long term availability (N=10) such as
coming up with a contract to make sure that mentors know about the time commitment. Other
common suggestions were to shorten the wait to be matched time period and needing a larger mentor
pool (8), as well as a desire for better communication with the program (8) related to activities, benefits
to the child, and the process in general.
Goal Two
The second goal was to assess the effects of the parent engagement model on strengthening the
mentoring experience and involves assessing program impact on three components of the mentoring
experience: 1) the length of the mentoring relationship, 2) the consistency of the mentoring
relationship, and 3) quality of the mentoring relationship. Progress on the goal was assessed primarily
through quantitative analysis of a number of indicator variables using the regression technique
described earlier in the Methods section.
The first component of the goal, length of the relationship, was simply assessed by looking for
differences in the length of matches. Because data on matches was recorded in several different ways,
the analysis considered a number of related measurements including number of months or number of
days (with different recording maximums of 12 or 14 months), as well as a simple binary yes/no
indicator of whether or not the match remained open for at least a year. Ultimately, there were no
significant differences between TAU and PEM group participants (Table 5).
The consistency of contacts was measured by four outcome variables: 1) total number of outings up to
12 months; 2) number of outings per month; 3) total number of hours together; and 4) number of hours
per month. As shown in Table 5, no significant group differences were identified.
The quality of the mentoring relationship was assessed from both the youth perspective and the mentor
perspective. Each assessment tool (SoR) is made up of the five subscales (listed in Table 1 above).
This document is a research report submitted to the U.S. Department of Justice. This report has not been published by the Department. Opinions or points of view expressed are those of the author(s)
and do not necessarily reflect the official position or policies of the U.S. Department of Justice.
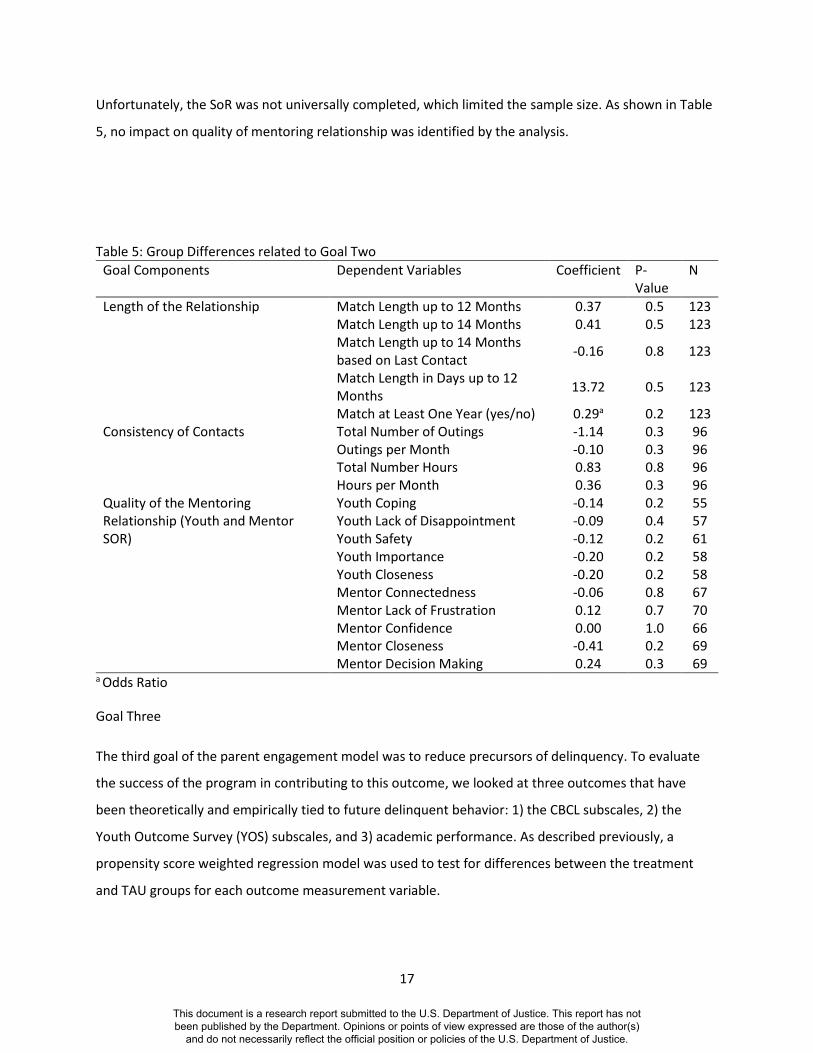
17
Unfortunately, the SoR was not universally completed, which limited the sample size. As shown in Table
5, no impact on quality of mentoring relationship was identified by the analysis.
Table 5: Group Differences related to Goal Two
Goal Components Dependent Variables Coefficient P-Value
N
Length of the Relationship Match Length up to 12 Months 0.37 0.5 123 Match Length up to 14 Months 0.41 0.5 123 Match Length up to 14 Months based on Last Contact
-0.16 0.8 123
Match Length in Days up to 12 Months
13.72 0.5 123
Match at Least One Year (yes/no) 0.29a 0.2 123 Consistency of Contacts Total Number of Outings -1.14 0.3 96
Outings per Month -0.10 0.3 96 Total Number Hours 0.83 0.8 96 Hours per Month 0.36 0.3 96
Quality of the Mentoring Relationship (Youth and Mentor SOR)
Youth Coping -0.14 0.2 55 Youth Lack of Disappointment -0.09 0.4 57 Youth Safety -0.12 0.2 61 Youth Importance -0.20 0.2 58 Youth Closeness -0.20 0.2 58 Mentor Connectedness -0.06 0.8 67 Mentor Lack of Frustration 0.12 0.7 70 Mentor Confidence 0.00 1.0 66 Mentor Closeness -0.41 0.2 69 Mentor Decision Making 0.24 0.3 69
a Odds Ratio
Goal Three
The third goal of the parent engagement model was to reduce precursors of delinquency. To evaluate
the success of the program in contributing to this outcome, we looked at three outcomes that have
been theoretically and empirically tied to future delinquent behavior: 1) the CBCL subscales, 2) the
Youth Outcome Survey (YOS) subscales, and 3) academic performance. As described previously, a
propensity score weighted regression model was used to test for differences between the treatment
and TAU groups for each outcome measurement variable.
This document is a research report submitted to the U.S. Department of Justice. This report has not been published by the Department. Opinions or points of view expressed are those of the author(s)
and do not necessarily reflect the official position or policies of the U.S. Department of Justice.

18
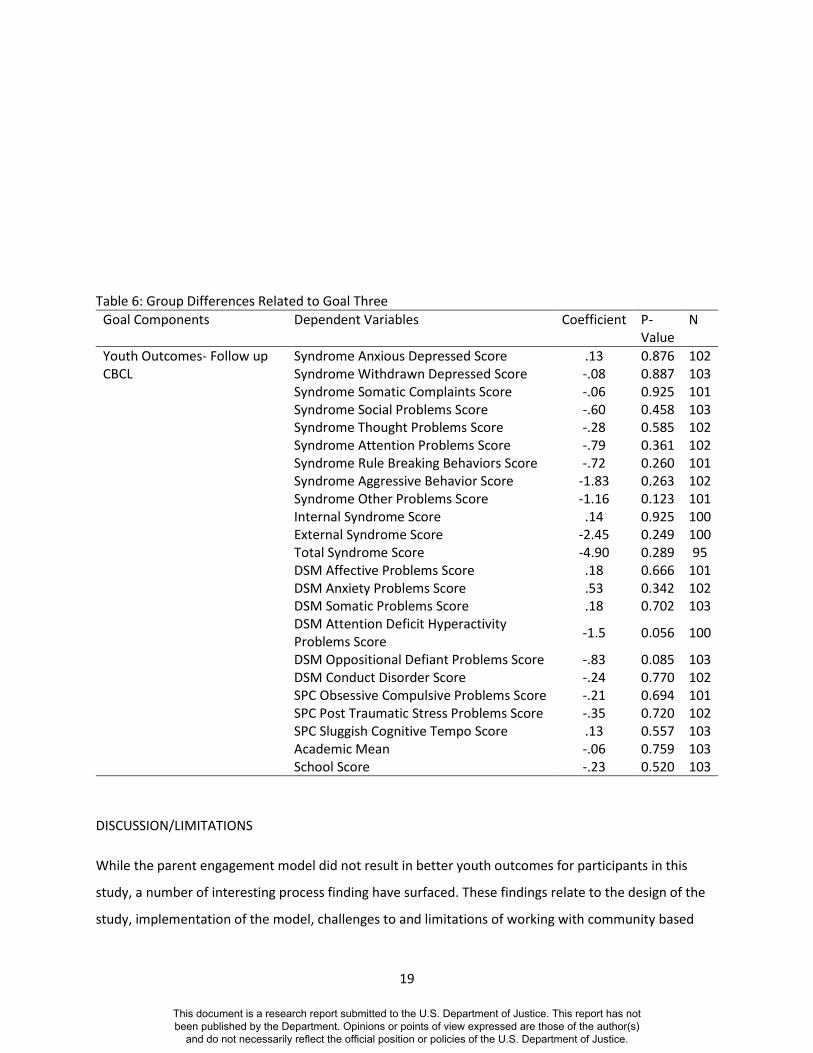
Three groups of scales from the CBCL subscales were used to assess child behavior: the Syndrome
Profiles, the DSM-Oriented Scales, and the ‘2007 scales’ from the Multicultural Supplement.
The Syndrome Profiles consist of nine constructs plus three combined scores, internal
syndrome, external syndrome, and total syndrome.
The DSM-Oriented Scales were comprised of six constructs
The 2007 scales from the Multicultural Supplement had three constructs.
Additionally, the CBCL includes a composite score for Academic Mean and for School Scores, which were
used as measures of academic performance.
As shown in Table 6, none of the measures were significantly different for the treatment group at a
standard 95 percent confidence level. The Attention Deficit and Hyperactivity Problem score and the
Oppositional Defiant Problem score do show trends to difference between groups in the expected
direction with the treatment or PEM group showing a slightly lower score at follow up than the TAU
group (Coefficient = -1.5, p = .056; Coefficient = -.83; p = .085 respectively).
The Youth Outcome Survey measures academic competence, social acceptance, educational expectation
and self-assessment of academic performance, truancy, misconduct and parental trust; however the
analysis was hampered by the relatively small number of completed surveys, ranging from 60 to 63
cases. The small sample is in itself a concern for the analysis but in addition the fact that a propensity
score developed using a larger sample is being used in the analysis really indicates the need for caution
in interpreting the results. The analysis did show significant differences between groups yet two of them
were in the wrong (unexpected) direction. As a result of the small sample size and the inability to control
for bias in both group assignment and instrument response, no impact on the mentoring relationship
could be identified.
The last part related to goal three was school reported academic performance, which we intended to
measure using grade point average and school attendance. Unfortunately, data could not be collected
for the entire group and the resulting sample size was even smaller than those mentioned above, with
ranges from 30 to 37 cases. As a result, no significant differences were found.
This document is a research report submitted to the U.S. Department of Justice. This report has not been published by the Department. Opinions or points of view expressed are those of the author(s)
and do not necessarily reflect the official position or policies of the U.S. Department of Justice.
19
Table 6: Group Differences Related to Goal Three
Goal Components Dependent Variables Coefficient P-Value
N
Youth Outcomes- Follow up CBCL
Syndrome Anxious Depressed Score .13 0.876 102 Syndrome Withdrawn Depressed Score -.08 0.887 103 Syndrome Somatic Complaints Score -.06 0.925 101 Syndrome Social Problems Score -.60 0.458 103 Syndrome Thought Problems Score -.28 0.585 102 Syndrome Attention Problems Score -.79 0.361 102 Syndrome Rule Breaking Behaviors Score -.72 0.260 101 Syndrome Aggressive Behavior Score -1.83 0.263 102 Syndrome Other Problems Score -1.16 0.123 101 Internal Syndrome Score .14 0.925 100 External Syndrome Score -2.45 0.249 100 Total Syndrome Score -4.90 0.289 95 DSM Affective Problems Score .18 0.666 101 DSM Anxiety Problems Score .53 0.342 102 DSM Somatic Problems Score .18 0.702 103 DSM Attention Deficit Hyperactivity Problems Score
-1.5 0.056 100
DSM Oppositional Defiant Problems Score -.83 0.085 103 DSM Conduct Disorder Score -.24 0.770 102 SPC Obsessive Compulsive Problems Score -.21 0.694 101 SPC Post Traumatic Stress Problems Score -.35 0.720 102 SPC Sluggish Cognitive Tempo Score .13 0.557 103 Academic Mean -.06 0.759 103 School Score -.23 0.520 103
DISCUSSION/LIMITATIONS
While the parent engagement model did not result in better youth outcomes for participants in this
study, a number of interesting process finding have surfaced. These findings relate to the design of the
study, implementation of the model, challenges to and limitations of working with community based
This document is a research report submitted to the U.S. Department of Justice. This report has not been published by the Department. Opinions or points of view expressed are those of the author(s)
and do not necessarily reflect the official position or policies of the U.S. Department of Justice.
20
organizations, as well as the construct of socioeconomic cultural differences and its impact on the entire
project.
The design of this study was intended to address both issues of research rigor and programmatic
feasibility. While communication between program and research staff was frequent and of a good
quality in the planning and implementation of the project, there was a lack of communication between
the time of the grant submission and the receipt of the award. During this period, BBBSCR moved ahead
with some aspects of implementation that the research team had intended to be involved with,
resulting in some families receiving part of the treatment prematurely. At first the decision was made to
exclude these families from the study, but as time went on and the reality of low enrollment emerged,
another decision was made to include these families and instead control for the difference by indicating
whether the parent had attended parent orientation prior to the study or not.
Although steps were taken to improve enrollment, the study sample was smaller than projected, which
limited our ability to draw meaningful conclusions from much of our data. This was particularly true for
the YOS and SoR instruments, which BBBSCR does not collect from closed matches. Prior to reaching the
one-year follow-up point nearly 40% of the matches were already closed.
The challenges faced with school data included unexpected hurdles to retrieving existing data from
schools and the fact that for many youth GPA scores did not exist. Mostly this was the result of a
number of elementary schools not giving GPA to students. Once the study was underway there were
policy changes in certain school districts regarding the release of school data, so that the release forms
collected by BBBSCR were not sufficient to allow us access to the data. A final challenge was that if a
youth was no longer enrolled at the reported school and the match had already closed, we did not know
what school the child attended. This was due to both the normal promotion from elementary to middle
school or from middle school to high school, as well as the fact that some youth in our study lead
transient lives and changed schools frequently.
There were a number of issues related to implementation. The logic model (see figure 1) from the grant
proposal lays out the components of the intervention, each activity, and the expected outcomes over
time. Out of the six components that were identified, only four were consistently implemented. Out of
the three components that required in-person attendance (parent orientation, mentor ETC, and
biannual family events) parent orientation was the only one that was mandatory for program
enrollment; the other two were voluntary. A finding from this process was that both the voluntary
This document is a research report submitted to the U.S. Department of Justice. This report has not been published by the Department. Opinions or points of view expressed are those of the author(s)
and do not necessarily reflect the official position or policies of the U.S. Department of Justice.
21
mentor ETC and the biannual family events were not viable as implemented for this study. Many
mentors expressed that time commitment was a challenge and that attending extra events (especially
without the child) was difficult. Planning these events presented a challenge as well. For example, the
first bi-annual social event was scheduled shortly after one of BBBSCR’s well attended annual events, its
back to school picnic. This happened again when the ETC was scheduled the day after the Valentines’
day party. There were also indications of challenges related to how the invitations were conveyed; a
number of treatment group parents reported never being invited to any events.
The issues described above, scheduling and invitations, also speak to some of the challenges in working
with community based organizations. A significant issue for implementing the program and the study
was staff turnover; during one six-month period the program director, a staff supervisor, and several
front-line staff left. Literature on high turnover in service organizations does indicate that it has a
negative impact on implementation as well as quality of services (Woltmann et al., 2008). Staff turnover
clearly had an impact on the success of the study by creating a need for repeat training of new staff as
well as a lack of consistency in communication between research staff and program staff, and between
program staff and participants. Additionally, turnover could have led to contamination of both the
treatment and the treatment-as-usual groups.
Comments related to staffing problems were present in both parent and mentor telephone interviews.
For example when asked about the experience as a parent in the program, one parent reported that
there were” a few changes in the people that called for match support calls. That part has been a
negative.“ One parent talked about never receiving calls from match support when that was the
expectation and a mentor expressed that the main problem was a lack of support, stating “I think they
had new hires in terms of match support. I didn't feel like I had someone that I could consistently go to
talk to about situations that came up.”
The impetus for this project hinged on the need to increase each parent’s understanding and knowledge
of mentoring as well as the related goal to increase each mentor’s understanding of culture and family
interactions in mentoring. One way to conceptualize these needs is within the context of the
socioeconomic cultural divide that exists between people living in middle class society and families living
in poverty. In this context the divide is less about the concrete differences such as household income
and race, and more about the outlook one has growing up in a particular cultural environment and how
that environment shapes and creates a distinct perspective.
This document is a research report submitted to the U.S. Department of Justice. This report has not been published by the Department. Opinions or points of view expressed are those of the author(s)
and do not necessarily reflect the official position or policies of the U.S. Department of Justice.
22
As was discussed in the introduction, minority low-income parents do face a different set of obstacles to
being engaged (Chang et al., 2009; Diamond & Gomez, 2004; Patel & Stevens, 2010; Payne, 2006; Van
Velsor & Orozco, 2007). To that end the parent orientation and mentoring ETC training were developed;
much of the content especially in the mentor training was based on theories and exercises from the
book, Bridges Out of Poverty which lays out the need for an accurate mental model of poverty, middle
class and wealth in order to shift existing perspectives (Payne, DeVol, & Smith, 2001). The ETC training
was designed for mentors and the assumption was that the program leadership, staff, and researchers
would not be included in this transformation process. Yet, there were some indications throughout the
study process that supported the potential value of including all roles. One such example was in the
facilitator training practice session for ETC, there were reported moments of enlightenment and a
seeming shift in perspective from the few attendees who were program staff. Post-test responses
indicated that the four ‘attendees’ strongly agreed or agreed that they learned new things and that the
training would help in improving relationships.
While themes of socioeconomic cultural differences were threaded through the design of the
intervention, the extent of cultural bias in the project design had not become apparent till the final stage
of the project. Because the focus of the project was parent engagement the balance of the intervention
was more heavily weighted towards parents than mentors with the intervention comprised of five
components aimed at parents and only one aimed at mentors, and none of the intervention was
specifically aimed at the staff. Yet engagement is a two way activity including the group being engaged,
in this case the parents, and the group reaching out or trying to engage, in this case both the mentors
and the program staff.
RECOMMENDATIONS
As a result of this study a number of recommendations can be made that may assist with the need for
ongoing refinement and strengthening of mentoring programs. General recommendations include
continuing and increasing communication with parents and mentors, as well as considering alternate
methods of outreach and communication, taking steps to increase staff consistency, and working to
develop a more systemic approach to increasing cross cultural understanding.
In general parents placed value on communication with program staff in general and more specifically
on sharing of information related to the program, activities, and the match. Continuing the parent
orientation is highly recommended, as the analysis showed that the orientation expanded parent
This document is a research report submitted to the U.S. Department of Justice. This report has not been published by the Department. Opinions or points of view expressed are those of the author(s)
and do not necessarily reflect the official position or policies of the U.S. Department of Justice.
23
knowledge. Continuing and improving ongoing communication with program staff is also highly
recommended, as the interviews suggest that the parents appreciate consistent outreach and the ability
to have a constant point of contact with the program.
Consider exploring alternate methods of outreach and communication in general and in particular for
program events. The postcards were not a success in the study, but there appears to still be a need for
more outreach and communication. Using technology may result in better communication; mentors
expressed that texting was a useful way of communicating with parents and noted that a forum to post
about activities and events would be of interest. Parents indicated that their preferred method of
contact was email, followed by cell phone, and then mail. Additionally, to reduce burden on participants
some program offerings could be reformatted to, for example, communicate certain information
electronically rather than in person.
In an effort to reduce staff turnover, programs might consider examining reasons why staff are leaving
and identifying staff characteristics associated with longer retention. It is important to consider what
steps could be taken to make the workplace more conducive to creating more consistency in program
staffing. Both mentors and parents expressed desire for a constant point of support and contact within
the BBBS organization.
In an effort to address and bridge the gap between the distinct perspectives of parents and youth, and
the rest of the program, consider the following options: 1) revising the current mandatory mentor
orientation to include more about the differences in perspective related to economic and cultural
differences; 2) revising the parent orientation to delve deeper into the role of different perspectives,
and 3) creating a program staff training on the differences in perspectives. A more comprehensive
approach should help all participants develop the skills to cross over that divide and gain a better
understanding of what the experiences are like on each side.
A related recommendation to address the socioeconomic cultural divide would be to increase staff and
volunteers from within minority populations, especially those who come from low socioeconomic
background. While it can be particularly challenging to do so, the emphasis on hiring leadership and
staff, as well as recruiting volunteers from a population that already understands the experience of
poverty and racial minority status and has been able to cross the bridge to the middle class should
increase the success of this type of engagement and education.
CONCLUSIONS
This document is a research report submitted to the U.S. Department of Justice. This report has not been published by the Department. Opinions or points of view expressed are those of the author(s)
and do not necessarily reflect the official position or policies of the U.S. Department of Justice.
24
While we were unable to show any differences in youth outcome based on the PEM in this study, we
found that parent orientation, a key mandatory component of the intervention, was well received and
increased knowledge. We also found that voluntary attendance at the ETC and the biannual family
events were not viable as implemented. Mentors’ time constraints and availability were a significant
challenge in the program, outside of the added ETC training. Lastly, future research on the role and
impact of training on socioeconomic cultural perspective differences could be extremely useful to
mentoring programs in determining the best ways to incorporate this content as well as to determine its
impact on mentoring relationships and hence youth outcomes.
REFERENCES
Achenbach, T.M., & Rescorla, L.A. (2001). Manual for the ASEBA School-Age Forms and Profiles.
Burlington, VT: University of Vermont, Research Center for Children, Youth, & Families.
Chang, M., Park, B., Singh, K., & Sung, Y. (2009). Parental involvement, parenting behaviors, and children's cognitive development in low-income and minority families. Journal of Research in Childhood Education, 23(3), 309-324. Diamond, J.B., & Gomez, K. (2004). African American parents' educational orientations: The importance of social class and parents' perceptions of schools. Education and Urban Society, 36(4), 383-427. DuBois, D.L., Holloway, B.E., Valentine, J.C. & Cooper, H. (2002). Effectiveness of mentoring programs for
youth: a meta-analytic review. American Journal of Community Psychology, 30(2).
Dubois, D.L., Portillo, N., Rhodes, J.E., Silverthorn, N., & Valentine, J.C. (2011). How effective are
mentoring programs for youth? A systematic assessment of the evidence. Psychological Science in the
Public Interest, 12(2), 57-91.
Dubois, D.L., Neville, H.A., Parra, G.R., Pugh-Lilly, A.O. (2002). Chapter 2: Testing a new model of
mentoring. In A critical view of youth mentoring (New Directions for Youth Development: Theory,
Research, and Practice, No 93, pp. 21-57). San Francisco: Jossey-Bass.
Epstein, Joyce L & Sanders, Mavis (2000). “Connecting Home, School, and Community: New Directions
for Social Research” in Halliman, Maureen J (ed.) Handbook of the Sociology of Education. New York, NY:
Klumer Academic/Penum Publishers.
Fan, X., & Chen, M. (2001). Parental involvement and students' academic achievement: A meta-analysis. Educational Psychology Review, 13(1), 1-22. Gerring, C.E., Kemp S.P., & Marcenko, M.O. (2008). The connections project: A relational approach to
engaging birth parents in visitations. Child Welfare, 87(6), 5-28.
This document is a research report submitted to the U.S. Department of Justice. This report has not been published by the Department. Opinions or points of view expressed are those of the author(s)
and do not necessarily reflect the official position or policies of the U.S. Department of Justice.
25
Grossman, J.B. & Rhodes, J.E. (2002). Predictors and effects of duration in youth mentoring
relationships. American Journal of Community Psychology, 30(2).
Herrera, C., Grossman, J.B., Kauh, T.J., Feldman, A.F., McMaken, J. with Jucovu, L. (2007). Making a
difference in schools: The Big Brothers Big Sisters school-based mentoring impact study. Philadelphia,
PA: Public/Private Ventures.
Higginbotham, B. J., MacArthur, S., & Dart, P. (2010). 4-H Mentoring: Youth and families with promise—
adult engagement and the development of strengths in youth. Journal of Prevention & Intervention in
the Community, 38(3), 229-243.
Jeynes, W.H. (2005). A meta-analysis of the relation of parental involvement to urban elementary school student achievement. Urban Education, 40(3), 237-269. Jeynes, W. H. (2007). The Relationship between parental involvement and urban secondary school student academic achievement: A meta-analysis. Urban Education, 42(1), 82-110. Jekielek, S. Moore, K.A. & Hair, E.C. (2002). Mentoring programs and youth development: A synthesis.
Washington, D.C.: Child Trends, Inc..
Keating, L.M., Tomishima, M.A., Foster, S. & Allesandri, M. (Winter 2002). The effects of a mentoring
program on at-risk youth. Adolescence, 37(148), 717-734.
New York State Education Department Information and Reporting Services: Graduation Rate Data- June
11, 2012. Public School District Total Cohort Graduation Rate and Enrollment Outcome Summary [data
table], Available from http://www.p12.nysed.gov/irs/pressRelease/20120611/home.html
Para, G.R., DuBois, D.L., Neville, H.A., Pugh-Lilly, A.O., & Povinelli, N (2002) Mentoring relationships for
youth: An investigation of a process-oriented model. Journal of Community Psychology, 30. 367-388.
Patel, N., & Stevens, S. (2010). Parent-teacher-student discrepancies in academic ability beliefs: Influences on parent involvement. School Community Journal, 20(2), 115-136. Payne, R. K. (2006). Working with parents. Building relationships for student success. Highlands, TX: Aha Process Inc. Payne, DeVol, & Smith, (2001). Bridges out of poverty: Strategies for professionals and communities. Highlands, TX: Aha Process Inc. Rhodes, J.E. (2008). Improving youth mentoring interventions through research-based practice.
American Journal of Community Psychology, 41, 35-42.
Spencer, R., Basualdo-Delmonico, A. & Lewis, T. (2011). Working to make it work: The role of parents in
the youth mentoring process. Journal of Community Psychology, 39(1), 51-59.
This document is a research report submitted to the U.S. Department of Justice. This report has not been published by the Department. Opinions or points of view expressed are those of the author(s)
and do not necessarily reflect the official position or policies of the U.S. Department of Justice.

26
St. Pierre, T.L., Mark, M.M., Kaltreider, D.L., & Aikin, K.J. (1997). Involving parents of high-risk youth in
drug prevention: A three year longitudinal study in Boys and Girls Clubs. Journal of Early Adolescence,
17, 21-50.
U.S. Census Bureau. (2012). American Community Survey: Albany-Schenectady-Troy Metro Area, NY.
Retrieved May 2014 from http://factfinder2.census.gov/
Van Velsor, P. & Orozco, G. (2007). Involving low-income parents in the school: Community centric strategies for school counselors. Professional School Counseling, 11(1), 17-24. Woltmann, E.M., Whitley, R., McHugo, G.J., Brunette, M., Torrey, W.C., Coots, L., Lynde, D., & Drake, R.E. (2008). The role of staff turnover in the implementation of evidence-based practices in mental health care, Psychiatric Services, 59(7). 732-737.
This document is a research report submitted to the U.S. Department of Justice. This report has not been published by the Department. Opinions or points of view expressed are those of the author(s)
and do not necessarily reflect the official position or policies of the U.S. Department of Justice.