understanding the role of forests in supporting ...wavespartnership.org/sites/waves/files/kc/tech...
TRANSCRIPT
i
UNDERSTANDING THE ROLE OF FORESTS IN SUPPORTING LIVELIHOODS AND CLIMATE RESILIENCECase Studies in the Philippines
White cover publication, pre-edited text subject to official editing
Forest Management Bureau - Department of Environment and Natural Resources
March, 2017

ii

Disclaimer: The findings, interpretations, and conclusions expressed in this report do not necessarily reflect the views of the Executive Directors of the World Bank or the governments they represent or the donors of PROFOR. The World Bank does not guarantee the accuracy of the data included in this work. The boundaries, colors, denominations, and other information shown on any map in this work do not imply any judgment on the part of the World Bank Group concerning the legal status of any territory or the endorsement or acceptance of such boundaries.
Responsible:
For. Ricardo L. CalderonDirectorForest Management Bureau – Department of Environment and Natural ResourcesDENR Main Compound, Visayas AvenueDiliman, Quezon City 1100 PhilippinesT: +63 2 927 4788E: [email protected]
Maurice Andres RawlinsNatural Resources Management SpecialistThe World Bank Washington D.C. USAT: +1 202 458 4867E: [email protected]
Authors: Maurice Andres Rawlins, Larlyn Faith Aggabao, Arnan Araza, Margaret Calderon, Jerbelle Elomina, Gordon Bernard Ignacio, and Eugene Soyosa.
Reviewers:Ma. Larissa Lelu Pessimo-Gata (University of the Philippines), Gem Castillo (University of the Philippines), Canesio Predo (University of the Philippines), Nathaniel Bantayan (University of the Philippines), Victor Ella (University of the Philippines), Lars Hein (University of Wageningen), Sofia Elisabet Ahlroth (World Bank), Diji Chandrasekharan Behr (World Bank), Juan Pablo Castaneda Sanchez (World Bank), Stefanie Sieber (World Bank), and Ulf Narloch (former World Bank).
Layout/Design: Ambient Media
Date of Publication: March 2017Manila, Philippines
Suggested citation: Rawlins et al., 2017. Understanding the Role of Forests in Supporting Livelihoods and Climate Resilience: Case Studies in the Philippines. World Bank: Manila, Philippines.
iii
Table of Contents
iv
Foreword v
Acknowledgements vi
List of Figures vii
List of Tables viii
Acronyms and Abbreviation ix
Executive Summary 1
Introduction 5
Background of the study 5
Objectives and Added Value of the Study 9
Key Messages 9
Definition of Terms 10
Structure of the Report 13
About the Analytical Study 15
Conduct of the analytical study 15
Modeling ecosystem services 18
Valuing forest ecosystem services 19
Analyzing forest use 20
Developing scenarios 21
Study Sites 22
Forests and Climate Resilience 27
Summary of Key Findings 27
Resilient Watersheds and Ecosystem Services 28
Water Yield and Flow Regulation During Dry Season 29
Forest Ecosystem Services Use and Values 43
Summary of Key Findings 43
Forest Resource Use at Study Sites 44
Scenarios and trade-off analyses: Inputs for landscape and forest use planning 63
The Way Forward 69
Recommendations 69
The Way Forward 70
References 73
Glossary of Terms 77
Annexes 79

Foreword
Among the major challenges that the Philippines confronts are climate change and persistent poverty, particularly for those who are dependent on natural resources, most specifically the forests for subsistence and livelihood. The irony is that for communities whose natural capital like the forests are abundant, the poverty incidence is significantly higher than the reported national average. The Government of the Philippines’ (GoP) recognizes the need to address these challenges which is the main reason for the continuous investment of government funds in providing livelihood opportunities to upland or forest communities, with the main purpose to rehabilitate the country’s degraded forest ecosystem, thus increasing their resilience to climate change impacts.
The Department of Environment and Natural Resources (DENR)’s National Greening Program (NGP), and the Risk Resiliency Program (RRP) are two ongoing flagship programs of the GoP that, inter alia, are expected to significantly increase the country’s share of forests and increase the health and resilience of existing forested areas. These programs are being undertaken in response to extensive deforestation and forest degradation over the last century due to unsustainable forest management practices including illegal logging, forest fire and other human disturbances. The ecosystem services that healthy forests provide can serve broad sustainability and shared prosperity goals in the Philippines by supporting the incomes and livelihoods of the poor, while at the same time enhancing the climate resilience of the wider Philippine population.
It is in this context that the analytical work to understand how forests can help enhance climate resilience and support livelihoods in the Philippines was undertaken. This report provides the evidence of the importance of forest ecosystem services for resilience and for supporting livelihoods of upland communities. The report emphasizes the importance of forests in regulating water flows in the dry season, and avoiding flooding in the wet season, with data and analysis. The report also provides recommendations that will help inform the design of the next phase of the NGP.
The report is a valuable contribution to the knowledge base on natural resources management in the Philippines. The methodology underpinning the analysis is useful for the Philippine government for replicating this work in other areas of the country. The capacity developed among the DENR technical staff will be a significant input in the current effort of the Department to institutionalize natural capital accounting in the country.
RICARDO L. CALDERON, CESO IIIDirector
Forest Management Bureau - DENR
v

AcknowledgementsThe study would not have been possible without the support of the government of the Philippines through the Department of Environment and Natural Resources (DENR) who provided resources, staff, and technical inputs to this work, the Project Management Committee, Technical Working Group, and the Secretariat. Specifically, we would like to thank the Forest Management Bureau (FMB), Foreign-Assisted and Special Projects Service (FASPS), River Basin Control Office (RBCO), the DENR Regional Offices 4A, 5 and 13, the Department of Agriculture through the Bureau of Soils and Water Management (BSWM) and the National Irrigation Authority (NIA), the Department of Science and Technology through the Philippine Atmospheric, Geophysical, and Astronomical Services Administration (PAG-ASA), and the many national government agencies that have extended their support and cooperation to this study.
The team would also like to thank its respondents and participants from the three study sites: the Upper Marikina River Basin Protected Landscape, the Libmanan Pulantuna watershed, and the Umayam, Minor and Agusan Marsh sub-basins. Moreover, we would like to show our appreciation to the following individuals for providing technical inputs and reviewing the work: Dr. Ma. Larissa Lelu Pessimo-Gata, Dr. Gem Castillo, Dr. Canesio Predo, Dr. Nathaniel Bantayan, and Dr. Victor Ella from the University of the Philippines – Los Baños; and Dr. Lars Hein from the University of Wageningen.
The work was done under the management of Iain Shuker (Practice Manager, GEN2A, World Bank) and Christophe Crepin (Practice Manager, GEN2B, World Bank). Technical review of the report was provided by Sofia Elisabet Ahlroth (Senior Environmental Economist, World Bank), Diji Chandrasekharan Behr (Senior Natural Resource Economist, World Bank), Juan Pablo Castaneda Sanchez (Environmental Economist, World Bank), Stefanie Sieber (Senior Environmental Economist, World Bank), and Ulf Narloch (Environmental Economist, former World Bank).
Financial support for this work was provided by the Program on Forests (PROFOR). A multidonor partnership housed at the World Bank, PROFOR finances forest-related analysis and processes that support improving people’s livelihoods through better management of forests and trees, enhancing forest law enforcement and governance, financing sustainable forest management, and coordinating forest policy across sectors.
vi

List of Figures
Figure 1: Framework for how forest ecosystem services contribute to poverty reduction through enhancing resilience to climate change and support incomes and livelihoods
10
Figure 2: Study sites in the Philippines 23
Figure 3: Comparison of average simulated monthly water yield from ground water during the period 2002-2012 under landscape simulations at the UMRBPL site
30
Figure 4: Comparison of simulated average daily streamflow rates at the Santo Nino River Station in the UMRBPL during the dry season under four landscape simulations for the period 2002-2012
31
Figure 5: Comparison of ‘proportion of dry season where the flow rate of the rivers in the study sites is > the 80% DFR’ across the four landscape simulations at the UMRBPL, LPW and UMAM study sites for the period 2002-2012
34
Figure 6: Avoided floodwater (flood regulation ecosystem service) on an average monthly basis facilitated by forest in UMRBPL
38
Figure 7: Simulations of streamflow at the Santo Nino River Station under Forested, 2015 Land Cover and Bare-Urban simulations for the period September 25 to 27, 2009 during Typhoon Ketsana (Ondoy)
39
Figure 8: Comparison of modeled average annual potential erosion (in situ) between lands under forest cover and where forest cover has been removed and the landscape is bare, UMRBPL
40
Figure 9: Comparison of modeled average annual sediment export from the three watersheds under four different landscape simulations for the period 2002-2012
41
Figure 10: Reported contribution to the average benefits of forests to cash income and meeting the subsistence (non-cash) needs of upland communities in UMRBPL
50
Figure 11: 2015 Land Cover in UMRBPL 79
Figure 12: 2015 Land Cover in LPW 80
Figure 13: 2015 Land Cover in UMAM 81
Figure 14: Ag-Use landscape scenario in UMRBPL, overlain with protected area zones 90
Figure 15: Comparison of simulated daily streamflow rates at the Libmanan watershed outlet during the dry season under four landscape simulations in the Libmanan-Pulantuna Watershed study site for the period 2002-2012
93
Figure 16: Comparison of simulated daily streamflow rates at the UMAM outlet during the dryseason under four landscape simulations in the UMAM study site for the period 2002-2012
93
Figure 17: Simulations of streamflow of the Libmanan-Pulantuna watershed outlet under the 2015 land cover, and the Forested and Bare-Urban landscapes for the period September 14-18, 2012
94
vii

List of TablesTable 1: Ecosystem services modeled and valued at Upper Marikina RIver Basin Protected Landscape (UMRBPL), Libmanan-Pulantuna Watershed (LPW). and Umayam, Minor and Agusan Marsh Sub-basin (UMAM) study sites
16
Table 2:Forest ecosystem services modeled and valued by study site 20
Table 3: Proportion of households (in %) with annual incomes (in PHP) below and above the poverty line of PHP 109,680/year (US$ 2,367/year) in UMRBPL and UMAM
25
Table 4: Potential irrigated paddies of the three study areas under forest and conservation simulation 35
Table 5: Potential irrigated area of rice paddy under different land covers for the dry cropping season due to land cover in the UMRBPL, LPW and UMAM for the period 2002-2012
36
Table 6: Comparison of daily average dry season flow rates in UMRBPL, LPW and UMAM by landscape simulation for the periods 2000-2012 and 2050
36
Table 7: List of forest and farm products accessed by upland communities at UMRBPL, LPW and UMAM 44
Table 8: Components of annual household income in UMRBPL 50
Table 9: Priority forest products/farm produce use to support income and used for subsistence by upland communities in the UMRBPL
51
Table 10: Measure of association of forest resources used to derive income, by gender, wealth, and self-reported income
52
Table 11: Measure of association of forest resources used for subsistence based on gender, wealth, and self-reported income
53
Table 12: Forest problems in UMRBPL ranked in descending order of priority 54
Table 13: Land cover configuration for the “No Use”, “Wise Use”, and “Ag-Use” scenarios for the year 2030 56
Table 14: Key drivers of change under each scenario and the status of implementation of the drivers 57
Table 15: Comparison of estimated service indicator values under the three land cover scenarios and the baseline (2015) land cover
62
Table 16: Summary trade-off matrix for the gains and losses faced by the upland poor communities in the UMRBPL under different scenarios
65
Table 17: Key assumptions of the simulated landscapes 82
Table 18: Land cover by area for the baseline and four simulated landscapes for UMRBPL. 84
Table 19: Land cover by area for the baseline and four simulated landscapes for LPW 85
Table 20: Land cover by area for the baseline and four simulated landscapes for UMAM 86
Table 21: Household consumption and value of water in UMRBPL for various uses 87
Table 22: Total cost of rainwater harvesting using ferrocement water tanks for UMRBPL 88
Table 23: Household consumption and value of water for various uses in LPW 88
Table 24: Total cost of rainwater harvesting using ferrocement water tanks for LPW 89
Table 25: Module titles and objectives 91
Table 26: Field Tools and Their Purpose 92
Table 27: Replacement cost of erosion control service under various scenarios, UMRBPL, LPRB and Middle Agusan Basin
95
Table 28: Replace cost of sediment control ecosystem service under various scenarios, UMRBPL. LPW and UMAM
96
Table 29: Total number of HHS and qualified tenured migrants in UMRBPL 97
Table 30: Key assumptions of the scenarios 98
Table 31: Value of carbon sequestration using social cost of carbon (SC-CO2) 100
viii

Acronyms and Abbreviations
CBMS Community-Based Monitoring System
CCC Climate Change Commission
DA Department of Agriculture
DAR Department of Agrarian Reform
DENR Department of Environment and Natural Resources
DFR Dependable Flow Rate
ES Ecosystem Services
FES Forest Ecosystem Services
FGD Focus Group Discussions
FLUP Forest Land Use Plans
GoP Government of the Philippines
HEC-HMS Hydrologic Modeling System
HH Household
LGU Local Government Unit
LPW Libmanan-Pulantuna Watershed
NAP National Adaptation Plan
NCA Natural Capital Accounting
NDRRMC National Disaster Risk Reduction and Management Council
NGP National Greening Program
NPV Net Present Value
NTFP Non-Timber Forest Product
PAGASA Philippine Atmospheric Geophysical and Astronomical Services Administration
PhilCCAP Philippine Climate Change Adaptation Project
Phil WAVES Philippines Wealth and the Valuation of Ecosystems Service Project
PHP Philippine Peso
PRDP Philippine Rural Development Program
RRSP Risk Resiliency and Sustainability Program
SEDNET Sediment and Nutrient Budgets for River Networks
ix

SEEA System of Environmental and Economic Accounts
SRPAO Survey and Registration of Protected Area Occupants
SWAT Soil and Water Assessment Tool
UMAM Umayam, Minor and Agusan Marsh sub-basins
UMRBPL Upper River Basin Protected Landscape
WAVES Wealth Accounting and the Valuation of Ecosystem Services
x

EXECUTIVE SUMMARY
The Philippines is among many countries vulnerable to the impacts of climate variability and change. Climate change is likely to exacerbate the occurrence and severity of extreme weather events in the Philippines. With rising temperatures, increased variability in precipitation, longer dry spells, and more frequent and intensified weather hazards, the impacts from climate variability and change have already damaged physical infrastructure, endangered human lives and health, and affected livelihoods - particularly among the poor. Typhoons, droughts and floods have reported to cause average annual damages of PhP 12 billion.a
More than an environmental issue, climate change is a threat to poverty reduction and economic growth. Increased temperature and rainfall variability is expected to reduce rural landscape productivity. For upland communities, whose primary sources of income are based on rain-fed agriculture, the effects of increased rain-fall variability makes them especially vulnerable. Three out of four poor Filipinos live in rural areas, including growing peri-urban areas, and most of them depend on ecosystem-based activities, including agriculture, which are affected by disasters and climate change. As such, climate change compounds the existing vulnerabilities of poor households by eroding their asset base, which in turn compounds the impacts of climate change. If left unmitigated, this trend could potentially undo many of the development gains made in recent decades.
The Philippine government is taking action to build national resilience to climate change. With these compelling realities, the Philippine government has - over the past decade - taken action to promote resiliency and adaptation across all sectors. Recent analysis of climate change and development has shown that measures for resilience and adaptation can contribute to sustainable growth, job creation, and poverty reduction. Investments made by the government in forest development through the flagship National Greening Program (NGP), aim to significantly increase the country's forest cover to enhance climate resilience at both the local and national level, and at the same time support local livelihoods through sustaining and improving forest ecosystem services.
a Climate Change Commission. 2011. National Climate Change Action plan 2011-2028.
1
orest ecosystem services are critical to building climate resilience in the Philippines. With two-thirds of the poor living in rural areas and relying heavily on natural resources for their livelihoods and subsistence, healthy forests are a natural, low-cost adaptation strategy against the impacts of climate change and a vital asset to income and wealth generation.F

This study sheds new light on two important aspects of climate change and forest ecosystems. It looks at how forest ecosystems help enhance people’s resilience to climate impacts, and how forest ecosystems support livelihood development for the poor. The analytical report that follows presents the findings of empirical work undertaken between May 2015 and November 2016.
The report relies on new empirical work. In applying a mix of analytical approaches, including ecosystem accounting models, focus group discussions, and participatory scenario development, the study valuates forest benefits, implements forest use surveys, and performs trade-off analysis at three case study sites in the Philippines. Landscape simulations were developed to test ecosystem service provision under different land cover extent and spatial arrangements within a watershed. Together, the analyses help inform a better understanding of how forests and their ecosystem services contribute to poverty alleviation in the Philippines and at the same time enhance resilience to climate change.
The findings have important implications for forest land use planning and management. Findings of the study are expected to provide technical guidance for the NGP and will complement on-going efforts by the Philippine government. By providing evidence of the potential benefits of forests for enhancing community resilience and by accounting for the benefits of forests in supporting local livelihoods, the study recommends that ecosystem service modeling and valuation, forest use analysis and scenarios be incorporated into forest land use planning and forest management. An ecosystem accounting approach is well suited as the framework for such work, which also requires hydrological modeling to pinpoint the specific forest areas of high importance to water regulation.
The study puts forward two important messages on forests and development. First, forests are relevant to climate resilience. Healthy forests help reduce risks to climate variability by providing high-quality ecosystem services that contribute to more resilient communities. Second, forests are vital to income and wealth generation. Forests serve as a safety net against poverty and potentially increase access to economic opportunities. Enhancing community resilience to climate change and consequent shocks to livelihoods and the national economy is therefore a key component of poverty reduction.
2

3
Study Objectives and Methodology
The study completed three analytical tasks to understand how forest ecosystem services - provisioning, cultural, and regulating - contribute to poverty alleviation and climate resilience:
✦ Modeling and valuing forest ecosystem services using the System of Environmental-Economic Accounting (SEEA) framework;
✦ Conducting surveys, interviews, focus group discussions, and visual mapping to understand how communities use forest resources to support their livelihoods; and
✦ Participatory scenario development and tradeoff analyses to determine how forest communities could be impacted by certain types of landscape development and to illustrate how data and information on forest ecosystem services could inform local watershed development planning
Four landscape simulations were developed at the study sites to test ecosystem service provision under different land cover extent and spatial arrangements within a watershed:
✦ "Forested" is a landscape simulation where the majority of the land cover of the watershed consists of closed forests;
✦ "Conservation" is a landscape simulation where enforcement of regulations regarding forest cover in riparian zones, on slopes greater than or equal to 50%, and on lands 1,000 meters above sea level are maintained;
✦ "Agricultural" is a landscape simulation with a heavy focus on agriculture; and
✦ "Bare-Urban" is a landscape where the watershed is highly urbanized with large scale conversion of natural vegetation to built-up areas.
Three case study sites across the Philippines were selected using select criteria, namely climate change risk, poverty incidence, extent of forest cover, and information availability:
✦ Upper Marikina River Basin Protected Landscape (UMRBPL), located in the province of Rizal upstream of Metro Manila;
✦ Libmanan-Pulantuna Watershed (LPW), which traverses the provinces of Camarines Sur and Camarines Norte in the Bicol region; and
✦ Umayam, Minor and Agusan Marsh sub-basins (UMAM) in Agusan River Basin in Caraga region.

Key FindingsForests are relevant to climate resilience. By providing essential ecosystem services in regulating water flow and reducing hazards, forests are a cost effective option to enhance resilience to climate change, both in local communities and nationally.
• Higher forest cover generates higher water yields in the driest months of the year. Water yield, for instance, from shallow ground water in the UMRBPL was estimated to be on average 149% to 167% higher under the Forested landscape simulation compared to the Bare- Urban landscape simulation. During the dry months, this helps building resilience in local communities dependent on these water resources for agriculture and subsistence.
• Higher forest cover reduces the volume of floodwater generated in the wettest months of the year. The regulating function of forests on water flow reduces potential floodwater generation in watersheds and in areas downstream of watersheds. During the wettest months of the year, higher forest cover can help reduce the volume of floodwater generated in a watershed by as much as 47%. This is particularly important to flood-prone areas downstream of watersheds.
• Higher forest cover protects against erosion and sediment generation to reduce the risk of hazards. Forests provide important protective functions. A decline in sediment generation reduces the potential for flooding, and lowers treatment costs for people consuming water from streams. Forests on steep slopes (>30%) help mitigate the risk of and have the potential to reduce annual sediment outflows from watersheds by seven to a hundred times compared to bare soil.
• Replacing regulating ecosystem services is costly. Manmade erosion and sediment control services are extremely costly. Reforestation is a lower-cost alternative to securing erosion regulating ecosystem services over the medium term. For example, in comparing results from UMRBPL with the cost of installing cocomats in Rizal, it was found that installing cocomats costs PHP 3 million 2 (US$ 0.06 million)/ha, while reforestation costs on the average PHP 15,750 (US$315)/ha.
Forests are vital to income and wealth generation. Forests ecosystem services can contribute to development by preventing or reducing poverty, especially among rural households with high forest-related income dependency.
• Poor upland communities depend highly on provisioning forest ecosystem services. Upland communities in UMRBPL, for instance, reported that about 7% of their annual cash income comes from the sale of forest resources like bamboo products, charcoal, fish, and bush meat.
• Forests provide essential subsistence benefits to poor upland communities through its provisioning and regulating function. Water is the most important benefit, used for domestic services and to some extent for irrigation. Other benefits include water regulation, wood
4

production, and biodiversity regulation. Forests also supply fuel wood for energy needs and herbal medicines for common ailments.
• Poorer households in upland communities rely more on forest resources for income and subsistence. Results of analyses using statistical measures of association suggest that the use of forest resources for income and subsistence is more important among poor households compared to others.
The Way Forward
The results show that managing landscapes to improve forest resources and enhance the ecosystem services derived from them requires not only to increase forest stocks, but also to carefully consider how forests are used by forest-dependent communities to support their incomes and livelihoods. Leading the way forward, the following policy recommendations are focused on developing a forest landscape that can boost the resilience of local communities vulnerable to climate change.
1. Incorporate ecosystem service modeling and valuation, forest use analysis and scenarios in forest land use planning (FLUP) and forest management. A practical application of these tools is the targeting of potential areas for tree plantations, agroforestry, and enrichment planting of protected areas. Better understanding the value of the forest and forestland assets and ecological services can help inform the revision of prices for permits for forest resources, including for water extraction.
2. Use ecosystem service indicators for monitoring the performance of FLUPs and assessing the outcome of the NGP. For example. an ecosystem service indicators that would be relevant in the context of the NGP would be average annual erosion regulation. Establishing ecosystem service targets could enhance the monitoring of the impact of forest development on erosion reduction, landslide reduction, and water provisioning.
3. Incorporate the Forest-Poverty Linkages toolkit for deepening analysis and undertaking site specific analysis of how forest dwelling communities use the forest. Forest use analysis can be used to deepen the knowledge on how people use and access the forest with qualitative and quantitative site specific data, so that appropriate forest types can be developed and livelihood activities could be appropriately sited.
4. Increase the income derived from forest resources especially for poor upland communities. Options for improving the livelihoods of poor upland communities should consider improving forest resources and adding economic value to forest resources. The valuation results from this study can help build the attractiveness of forests for investors.
5

Options include:
❖ Increasing the value of forest resources (non-timber forest products, fruits and other forest foods) by transforming these products through value addition, thus making non-timber forests an asset to poverty reduction;
❖ Developing community-managed woodlots and plantations that can facilitate the legal harvesting of wood for household consumption to meet energy needs, and provide a sustainable supply of wood for income-generating activities;
❖ Creating a market for forest services;
❖ Tapping the support of the Department of Agriculture (DA) and Department of Agrar ian Reform (DAR) is cr i t ica l to the commercialization and value addition of forest commodities.
5. Develop a research agenda for forest ecosystem services. Development of a research agenda for forest ecosystem services (FES) may be a useful start to institutionalizing and formulating a coordinated effort for data collection, data sharing and analysis. The Ecosystems Research and Development Bureau of the DENR could be a strategic clearinghouse for FES information that can be used to support planning and decision-making on forest and landscapes.
6

1 | Introduction
Background of the study
Situational Analysis
Given its location, climate and topography, the Philippines is exposed to a range of climate-related events, such as typhoons, floods, landslides, and droughts, many of which are projected to become more frequent and severe under a continuously changing climate. Impacts are expected to include higher temperatures, changing precipitation patterns, rising sea levels, more intense weather events, as well as inland and coastal flooding (see Box 1). Climate change is expected to increase rainfall during the wet season, which in turn will heighten the risks, for instance, of floods and landslides, and reduce rainfall during the dry season, which will potentially affect crop production, and water supply for other uses. Climate change is expected to increase rainfall during the wet season, which in turn will heighten the risks, for instance, of floods and landslides, and reduce rainfall during the dry season, which will potentially affect crop production.
The majority of the Philippines’ poor, about 75% live in rural areas1, and depend on natural resources for their livelihoods2. High dependence of these rural communities — especially upland communities3 — on rain-fed agriculture as the primary source of income and natural resources for their subsistence and livelihoods, makes them especially vulnerable to rainfall-related effects of climate change4. Increased temperature and rainfall variability are expected to reduce rural landscape productivity. Negative rainfall shocks reduce rural
7
1 Poverty incidence, or the proportion of households with annual household incomes below PHP 109,680 (US$ 2,203) in the Philippines in 2015, was estimated at 21.6%. The poverty incidences in the regions where the study sites are found are: Region IV (Upper Marikina River Basin Protected Landscape or UMRBPL – 36.8%; Region V (Libmanan Pulantuna Watershed or LPW) — 61.1%; and Region XIII (Caraga, (Umayam, Minor, and Agusan Marsh sub-basins, otherwise called UMAM).
2 Information from the Philippine Poverty-Environment Initiative
3 A 2014 study by GIZ projected that approximately 45 million persons in the Philippines live in rural areas, 45% (20 million) of whom live in upland areas (Fortenbacher, 2014). It also found that upland dwellers are among the poorest in the country’s rural population.
4 A recent report by the World Bank noted that natural disasters such as these that could be a result climate change, have a particularly impact on poverty because poor people are more affected by disasters than the rest of the population: they are more often exposed to hazards; they always lose more as a fraction of their wealth when they are hit; and they receive less support from friends and family, the financial system, and governments (Hallegatte 2017).

household consumption, with impacts varying across regions, of which the most affected include Ilocos and Western Visayas islands.5
Philippine’s Climate Change Response
Recognizing the country’s vulnerability to the impacts of climate change, the Philippine government is pursuing an agenda of enhancing the resilience6 of its people and the economic sectors. This includes the Philippines Disaster
8
5 Safir 2013. Disquiet on the weather front: The welfare impacts of climatic variability in the Philippines.
6 Resilience refers to the ability of human settlements or communities to withstand and to recover quickly from any plausible hazards according to UN HABITAT.
BOX 1Key findings of climate change projections for 2020 and 2050 in the Philippines
• All areas of the Philippines will get warmer, more so in the relatively warmer summer months.
• Annual mean temperatures (i.e., average of maximum and minimum temperatures) in all parts of the country are expected to rise by 0.9 °C to 1.1 °C in 2020 and by 1.8 °C to 2.2 °C in 2050, relevant to the baseline (1971-2000) climate.
• In terms of seasonal rainfall change, generally, there will be a substantial spatial difference in the projected changes in rainfall in 2020 and 2050 in most parts of the Philippines, with reduced rainfall in most provinces during the summer season March, April and May (MAM), making the dry season drier. Rainfall increases are likely in most areas of Luzon and Visayas during the southwest monsoon June, July and August (JJA) and the September, October, November (SON) seasons, making these seasons wetter, and thus with likelihood of both droughts and floods in areas where these are projected.
• The northeast monsoon December, January and February (DJF) season rainfall is projected to increase, particularly in areas marked by Type II climate, with potential for flooding enhanced.
• During the southwest monsoon season (JJA), larger increases in rainfall are expected in Luzon provinces (0.9% to 63%) and Visayas (2% to 22%). Generally decreasing trends are expected in most of the provinces in Mindanao in 2050.
• Projections for extreme events in 2020 and 2050 show that hot temperatures (indicated by the number of days with maximum temperature exceeding 35 °C) will continue to become more frequent, and the number of dry days (days with less than 2.5 mm of rain) will increase in all parts of the country. Heavy daily rainfall (exceeding 300 mm) events will also continue to increase in Luzon and Visayas.

Risk Reduction and Management Act of 2010, which emphasized a substantial policy shift from emergency response to disaster preparedness, risk reduction, prevention and mitigation, rehabilitation and recovery, and financial protection. The establishment of the National Disaster Risk Reduction and Management Council (NDRRMC) facilitated the coordination and management of all government interventions on disaster risk reduction. The NDRRMC has developed masterplans, frameworks, and strategies that consolidate various initiatives on disaster risk reduction and management at the national, regional, local, and barangay levels. At the local level, climate change adaptation and disaster risk reduction are being integrated into local development plans and land use plans, guided by Disaster Risk Reduction Management and Climate Change Adaptation planning guidelines.
The Climate Change Commission (CCC) of the Philippines is leading national efforts to develop an overall national adaptation plan (NAP) for climate change for the different sectors of the economy by 2017. Already there are several national and sub-national programs, some of which were recently completed, focusing on enhancing resilience to climate change that can contribute to the NAP through building up the knowledge base and expertise for adaptation planning.
These programs include the Philippines Climate Change Adaptation Program (PhilCCAP), which aimed to strengthen institutional frameworks for climate change adaptation and demonstrate cost-effective adaptation strategies in agriculture, upland forests, and coastal sectors; Analysis and Mapping of Impacts under Climate Change for Adaptation and Food Security (AMICAF), which undertook climate change impact assessments of agriculture and analyzed household food insecurity vulnerability to build the information base for adaptation planning in the agriculture sector; Communities for Resilience (CORE), which aims to strengthen the technical knowledge and capacity of local government units (LGUs) in developing local climate change action plans.
The Government of the Philippines’ (GoP) recent large-scale investments in natural resources like the National Greening Program (NGP) are a strategic move toward building national resilience to climate change impacts and to economic and environmental shocks that can disrupt sustainable development efforts including poverty reduction. Better management of natural resources, particularly forests, is seen as vital to economic development and enhancing resilience.
The National Greening Program (NGP) is an ongoing flagship initiative of the GoP, which, inter alia, will significantly increase the country’s share of forests, and potentially improve the health and resilience of existing forested areas. While the GoP originally envisioned the NGP as a key greenhouse gas mitigation strategy, it also recognizes the potential of the program to improve forest ecosystem services and thereby enhance climate resilience. The NGP includes a livelihood support and poverty reduction component by involving upland communities in reforestation efforts, and developing agroforestry plantations that can support non-timber enterprises.
9

The government is also working on developing natural capital accounts for different ecosystems through its engagement with the World Bank Group (WBG) on the Wealth Accounting and the Valuation of Ecosystem Services (WAVES) global partnership program. The Philippines WAVES program (Phil WAVES) supports the government by promoting better understanding of the contribution of natural capital to the development and sustainability of the Philippine economy, and by exploring options for expanding the national accounting system to include the (monetary) values of natural capital. A third major government undertaking that is expected to contribute to enhancing resilience is the Risk Resilience and Sustainability Program (RRSP), a convergence budget approach that aims to strengthen the resilience of natural systems and urban built environment, as well as the adaptive capacities of vulnerable groups and communities to current and future risks and disasters due to climate change.
Forests for climate resilience and livelihood support
The potential roles of forests in mitigating climate and weather-related impacts are often used as basis for formulating watershed and forest protected area policies. Intact forests can play a critical role in enhancing climate resilience and reducing disaster risk by, for example, decreasing erosion of hillsides, reducing and retarding surface runoff and sediment transport, and mitigating flood risks (CIFOR, 2005; de Bello et al., 2010; Wang et al., 2012). Similarly, mangroves have been found to reduce the heights of storm surges, promote shoreline stabilization, and provide coastal protection (Seppala et al., 2009; McIvor et al. 2012). To date, however, there are relatively few studies in the Philippines showing how forest ecosystem services help enhance climate resilience by mitigating climate and weather impacts in the country.
Recent developments in raising awareness of the contribution of the forest-derived benefits to livelihood, especially among the poor, reinforce the need to sustain forests and invest in reforestation. The forest and poverty nexus has been studied in detail using data from the Poverty Environment Network (PEN)7, which showed that globally an average of approximately 22% of the income of the poor is derived from forests (Angelsen et al., 2014). The study also found large and systematic regional variations in terms of forest-related incomes. For example, in Latin America, forest income constituted 28.6% of the average household income, whereas in Asia and Africa forest income shares were pegged at 20.1% and 21.4%, respectively (Angelsen et al., 2014). Another key finding from the PEN data showed that forest and environmental resources could be an important source of cash and subsistence incomes
10
7 PEN is the largest and most comprehensive global analysis of tropical forests and poverty to date. Its database contains survey data on 8000+ households in 40+ study sites in 25 developing countries. At the core of PEN is comparative, detailed socio-economic data that was collected at the household and village level by 50+ research partners using standardized definitions, questionnaires, and methods. The study sites were chosen to obtain widely representative coverage of different geographical regions, forest types, forest tenure regimes, levels of poverty, infrastructure and market access, and population density (CIFOR, 2016). The Philippines is not included within the PEN study sites.

during shocks (Wunder et al., 2014)8. The study concluded, however, that this potential value is place-specific and therefore requires site-specific research, and that site-specific information may facilitate more efficient forest planning to better serve the livelihood needs of the poor.
In the Philippine context, there are two significant information gaps that, if filled, can help the government better account for investments in forests, and better target areas and plan for forest development: (1) how forest ecosystems help enhance people’s resilience to climate impacts, and (2) how forest ecosystems support livelihoods of the poor.
Objectives and Added Value of the Study
This analytical work aims to enhance understanding of how forests and their ecosystem services contribute to enhancing resilience and supporting livelihoods of the poor in the Philippines. Specific tasks undertaken to realize this objective included: (1) modeling and valuing ecosystem services at three study sites; (2) conducting surveys to facilitate understanding of how forest communities use forest resources to support their livelihoods; and (3) undertaking participatory scenario development and tradeoff analyses to further determine how the forest communities could be impacted by certain types of landscape development.
This study has the ability to influence the conduct of the NGP at specific sites, and comes at a strategic time as the NGP is embarking on its second phase and therefore there is opportunity to influence its design. The study also has the potential to influence how local government units undertake their forest and land use planning by adopting the tools and approaches in the FLUP design process. Finally, the study also adds to the global knowledge base on how forests enhance resilience to climate change9.
Entry Points for Analysis
This analytical work has two key entry points for analysis, based on common understandings from the literature on forests and development, and watersheds:
(1) forests are relevant to climate resilience — that is, forests in good health help reduce risks to climate variability by providing high-quality ecosystem services that contribute to more resilient communities; and
11
8 The study by Wunder et al. (2014) classified three types of shocks: (1) covariate shocks: serious crop failure, major livestock loss (theft, drought, etc.), and other major forms of asset loss (fire, theft, flood, etc.); (2) labor (idiosyncratic) shocks: serious illness in family, death of productive age-group adult; (3) other (idiosyncratic) shocks: land loss (expropriation, etc.); lost wage employment; fine from the environmental regulation agency; delays in receiving payments; and other shocks.
9 This work continues to build on and complements the PROFOR-funded work on forests and climate change resilience. See Chandrasekharan Behr et al. n.d.

(2) forests are vital to income and wealth generation — which means forests serve as a safety net against poverty and potentially increase access to economic opportunities.
Climate change and other shocks can render poor people poorer, as they are often more vulnerable than the non-poor. Enhancing resilience of communities to climate change and other shocks is therefore important for poverty reduction. (Figure 1 shows a schematic diagram that describes these relationships.)
Figure 1: Framework for how forest ecosystem services contribute to poverty reduction through enhancing resilience to climate change and support incomes and livelihoods
Definition of Terms
This report uses a variety of terms to discuss forest ecosystem services, climate change resilience, and poverty, which were derived from both existing global literature as well as Philippine-specific terminology.
• Ecosystem services are the contributions of ecosystems to benefits used in economic and other human activities10. Services are categorized into (1) provisioning services, which relate to the products people obtain from ecosystems such as food, fuel, fiber, fresh water, and genetic resources; (2) cultural services, which refer to the non-material benefits people obtain from ecosystems through spiritual enrichment, recreation, such as tourism and recreation; and (3) regulating services, which are ecosystems’ contributions to the benefits people obtain from the regulation of ecosystem processes, including nutrient cycling, erosion control, natural hazard regulation (protection from floods, storms), pollination, waste processing and
12
10 SEEA Experimental Ecosystem Accounting Framework (2012) (UN et al. 2014).
FOREST ECOSYSTEM SERVICES
Enhance resilience to climate change
Contribute to poverty reduction
Protection of assets and livelihoods
Support incomes and livelihoods
Asset accumulation
water purification, regulation of human diseases, primary production, production of oxygen, and soil formation11.
• Forests are defined by the Philippine government as land with “an area of more than 0.5 hectares and tree crown (or equivalent stocking level) of more than 10%, which includes natural, and plantation and production forests.” The trees should reach a minimum height of 5 meters at maturity in situ. It consists either of closed forest formations, where trees of various storeys and undergrowth cover a high proportion of the ground; or open forest formations with a continuous vegetation cover in which tree crown cover exceeds 10%. Young natural stands and all plantations established for forestry purposes, which have yet to reach a crown density of more than 10% or tree height of 5 meters, also are classified as forests.
• Forest ecosystem services (FES) refer to goods and benefits that forest provide as a result of their physiology and structure. Based on the results of the scoping studies and forest use analysis exercises undertaken for this study, a mix of eight provisioning and regulating ecosystem services were selected for assessment. Provisioning services included timber, non-timber forest products (NTFPs), and freshwater. Regulating services covered carbon sequestration, water flow regulation, water purification, erosion, and sediment regulation.
o Timber and non-timber forest production are an outcome of the high diversity of species in natural forests, which facilitates the provision of goods such as food (fruits, nuts, root crops, wildlife), and fibers (for timber, fuelwood, paper pulp). Timber production was assessed only for Umayam, Minor and Agusan Marsh (UMAM) site due to a moratorium on timber harvesting from forests at the other two study sites.
o Carbon sequestration result from the use of carbon dioxide for plant photosynthesis that stores carbon in plant biomass. As soils are also significant stores of organic carbon, forests overlying soils help protect the soil and subsequently minimize carbon release.
o Forests in watersheds regulate the flow rate and volume of water (called water flow regulation) transmitted through a watershed by creating temporary storages and flow obstructions. The rough surface of the forest floor created by leaf litter and debris reduces the velocity of overland flow, and root systems aid in creating channels within the soil for infiltration and recharge of groundwater. Water is filtered of nutrients, pollutants, and sediments as it passes through the soil to groundwater storage or base flow. This process is called water purification. Water flow regulation and water purification contribute to the provision of clean freshwater. This ecosystem service is called water yield.
13
11 Adapted from “Millennium Ecosystem Assessment” (Hassan 2005).

o Forest ecosystems reduce the erosive impact of rainfall on the soil surface, as well as the velocity and erosive power of overland flow. Roots bind the soil and reduce its erodibility. On slopes, forests help reduce the transport of eroded sediment by decreasing the velocity of overland flow (agent of transport), promoting deposition, and enhancing infiltration of overland flow. Forest ecosystems reduce the potential rates at which soil is eroded and transported, thereby providing erosion and sediment regulation services.
• Poverty in the Philippines is estimated by comparing per capita income/expenditure to per capita poverty threshold. The poverty threshold is the minimum income/expenditure required for a household to meet the basic food and non-food requirements. Poverty is measured using the poverty incidence, which is defined as the proportion of families/individuals with per capita income/expenditure less than the per capita poverty threshold to the total number of families/individuals. The poverty threshold established for the Philippines is PHP 109,680/household/year (US$ 2,203/year)12.
• Resilience refers to the ability of human settlements or communities to withstand and recover quickly from any plausible hazards (UN HABITAT). This study characterized resilience as a relative concept, and assessed it by examining how changes in forest extent in a watershed affects certain watershed ecosystem services that people depend on for livelihood support and protection. A watershed that can provide a higher quality of watershed ecosystem services for a community increases the latter’s resilience to hazards. Resilience can be enhanced in different ways by forest ecosystem services:
o Timber and non-timber forest provision can provide households with access to alternative incomes when other livelihood activities fail due to extreme events like droughts;
o Forests can regulate streamflow during excessive, and in the absence of, rain;
o Forests help stabilize soil on slopes, thereby reducing soil erosion and the risk of of landslides and mudslides during heavy rainfall.
• Upland communities are those residing on hillsides or mountainsides in the Philippines. Most of the upland population has no legal tenure rights and is often excluded from government census. As a result, only an informal approximation of the actual population size in the uplands exists. An estimated 17 to 22 million people live in state-owned uplands in the Philippines13.
14
12 Source: Philippines Statistical Authority (PSA), https://psa.gov.ph/. PHP to USD conversion based on a rate of USD$ 1 = PHP 49.777 obtained from the Bangko Sentral ng Pilipinas on November 30, 2016.
13 Source: Upland Agriculture in the Philippines: Potential and Challenges (Fortenbacher 2014).

Structure of the Report
This report is structured as follows: Chapter 2 presents the methodology for the study and describes the study sites. Chapter 3 presents the results of the ecosystem service modeling and valuation and builds a case for using the (1) ecosystem service provision as a proxy for resilience, and (2) forested landscapes such as watersheds as a means to build the resilience of people living in and around these watersheds. In Chapter 4, the results of forest use analysis undertaken using focus group discussions, key informant interviews, and gender-wealth analysis describe how people use and benefit from forests. Three land development scenarios for the Upper Marikina River Basin Protected Landscape (UMRBPL), and the impacts of these scenarios on ecosystem services and on the livelihoods of poor upland communities are discussed in Chapter 4. The final chapter (5) presents conclusions and recommendations on how ecosystem service-based approaches applied to this study could be used to enhance landscape management planning, with a particular focus on forested landscapes.
15

16

2 | About the Analytical Study
Conduct of the analytical study
The approaches used for the study were intended to generate data and information that would address the two issues of how forests could help enhance resilience to climate change and support the livelihoods of the poor in the Philippines. These issues could be addressed through an ecosystem accounting framework that facilitates measurement of the extent and condition of the ecosystem, its services, and the value of those services. Accordingly, the System of Environmental-Economic Accounting (SEEA) Experimental Ecosystem Accounting (EEA) framework14 was the ecosystem accounting framework used for this analytical work. However, this study did not produce actual ecosystem accounts but drew on the concepts, definitions, and classifications of the SEEA framework to guide the analysis.
The use of the SEEA framework was also strategic as this is the framework applied by the Philippine government for natural capital accounting. Therefore, the data and information generated by the analysis are consistent with the government’s accounting framework. Ecosystem service modeling was used to provide data and information on how forests could enhance communities’ resilience to climate change. Surveys and ecosystem service valuation yielded data and information addressing the question of how forests support the livelihoods of the poor in the Philippines. The ecosystem services measured, valued, and discussed in the report are shown in Table 1. Ecosystem service modeling and valuation and forest use surveys are briefly described in this report, while further details are provided in the background reports to this study: forest use analysis — Gata 2016 and Ignacio 2016; ecosystem service modeling — Araza 2016; ecosystem service valuation – Calderon 2016.
17
14 The SEEA Central Framework is a multipurpose conceptual framework for understanding the interactions between the economy and the environment, and for describing stocks and changes in stocks of environmental assets. The framework consists of a comprehensive set of tables and accounts, which guide the compilation of consistent and comparable statistics and indicators for policymaking, analysis, and research (UN 2014).

18
Ecos
yste
m
Serv
ice
Des
crip
tion
of
ecos
yste
m s
ervi
ceEc
osys
tem
Ser
vice
In
dica
tor
Pote
ntia
l B
enefi
ciar
ies
UM
RB
PLLP
WU
MA
M
Prov
isio
ning
Ser
vice
sPr
ovis
ioni
ng S
ervi
ces
Prov
isio
ning
Ser
vice
sPr
ovis
ioni
ng S
ervi
ces
Prov
isio
ning
Ser
vice
sPr
ovis
ioni
ng S
ervi
ces
Prov
isio
ning
Ser
vice
s
Tim
ber
p
rovi
sio
nTi
mb
er a
nd n
on-
tim
ber
fo
rest
pro
visi
on
is a
n o
utco
me
of
the
hig
h d
iver
sity
of
spec
ies
in n
atur
al f
ore
sts,
whi
ch in
tur
n fa
cilit
ates
the
pro
visi
on
of
go
od
s su
ch a
s fo
od
(fr
uits
, nut
s, r
oo
t cr
op
s, w
ildlif
e),
and
fib
ers
(fo
r ti
mb
er, f
uelw
oo
d, p
aper
p
ulp)
. Tim
ber
pro
duc
tio
ns w
as a
sses
sed
o
nly
for
the
UM
AM
site
due
to
a
mo
rato
rium
on
tim
ber
har
vest
ing
fro
m
fore
sts
(EO
23)
at t
he o
ther
tw
o s
ites.
Tota
l tim
ber
yie
ld
(m3
/ ha
/yr
)O
nsite
co
mm
unit
ies,
w
oo
d-b
ased
in
dus
trie
s
X
No
n-ti
mb
er
fore
st p
rod
ucts
(N
TF
Ps)
Tim
ber
and
no
n-ti
mb
er f
ore
st p
rovi
sio
n is
an
out
com
e o
f th
e hi
gh
div
ersi
ty o
f sp
ecie
s in
nat
ural
fo
rest
s, w
hich
in t
urn
faci
litat
es t
he p
rovi
sio
n o
f g
oo
ds
such
as
foo
d (
frui
ts, n
uts,
ro
ot
cro
ps,
wild
life)
, an
d fi
ber
s (f
or
tim
ber
, fue
lwo
od
, pap
er
pul
p). T
imb
er p
rod
ucti
ons
was
ass
esse
d
onl
y fo
r th
e U
MA
M s
ite d
ue t
o a
m
ora
tori
um o
n ti
mb
er h
arve
stin
g f
rom
fo
rest
s (E
O23
) at
the
oth
er t
wo
site
s.
Ons
ite c
om
mun
itie
s X
XX
Fre
shw
ater
Pro
visi
on
of
clea
n fr
eshw
ater
fro
m
surf
ace
and
gro
und
so
urce
s th
at is
fa
cilit
ated
by
reg
ulat
ing
eco
syst
em
serv
ices
of
the
fore
st s
uch
as w
ater
flow
re
gul
atio
n an
d w
ater
pur
ifica
tio
n
Tota
l wat
er y
ield
(m
3 /ha
/yr)
Ons
ite c
om
mun
itie
s,
and
far
mer
s, w
ater
d
istr
icts
, off
site
(d
owns
trea
m)
com
mun
itie
s, f
arm
ers,
an
d in
dus
trie
s
XX
X
Reg
ulat
ing
serv
ices
Reg
ulat
ing
serv
ices
Reg
ulat
ing
serv
ices
Reg
ulat
ing
serv
ices
Reg
ulat
ing
serv
ices
Reg
ulat
ing
serv
ices
Reg
ulat
ing
serv
ices
Car
bo
n se
que
stra
tio
nC
arb
on
seq
uest
rati
on
resu
lts
fro
m t
he
use
of
carb
on
dio
xid
e fo
r p
lant
p
hoto
synt
hesi
s th
at s
tore
s ca
rbo
n in
p
lant
bio
mas
s. A
s so
ils a
re a
lso
si
gni
fican
t st
ore
s o
f o
rgan
ic c
arb
on,
fo
rest
s ov
erla
ying
so
ils h
elp
pro
tect
the
so
il an
d s
ubse
que
ntly
min
imiz
e ca
rbo
n re
leas
e.
Tota
l car
bo
n se
que
ster
ed (
t/ha
/yr
)
Ons
ite c
om
mun
itie
s X
XX
Tabl
e 1:
Eco
syst
em s
ervi
ces
mod
eled
and
val
ued
at U
pper
Mar
ikin
a R
iver
Bas
in P
rote
cted
Lan
dsca
pe (
UM
RB
PL),
Li
bman
an-P
ulan
tuna
Wat
ersh
ed (
LPW
), a
nd U
may
am, M
inor
and
Agu
san
Mar
sh S
ub-b
asin
s (U
MA
M)
stud
y si
tes

19
Wat
er fl
ow
reg
ulat
ion
Fo
rest
s in
wat
ersh
eds
help
reg
ulat
e th
e flo
w r
ate
and
vo
lum
e o
f w
ater
tr
ansm
itte
d t
hro
ugh
a w
ater
shed
by
crea
ting
tem
po
rary
sto
rag
es a
nd fl
ow
ob
stru
ctio
ns.
Dur
ing
hig
h ra
infa
ll in
tens
ity,
fo
rest
s ca
n he
lp s
low
the
mov
emen
t o
f w
ater
th
roug
h th
e ec
osy
stem
and
incr
ease
the
ti
me
that
it t
akes
rai
nfal
l to
rea
ch t
he
stre
am, t
hus
red
ucin
g t
he p
ote
ntia
l fo
r flo
od
ing
tha
t re
sult
s fr
om
ove
rban
k flo
w.
Pro
po
rtio
n o
f th
e d
ry s
easo
n in
a y
ear
whe
n d
aily
wat
er
flow
rat
e eq
uale
d o
r ex
ceed
ed 8
0%
d
epen
dab
le fl
ow
rate
(%
)
Num
ber
of
hect
ares
un
der
irri
gat
ion
(ha)
Vo
lum
e an
d d
elay
of
pea
k d
isch
arg
es in
st
orm
eve
nts
(m3;
ho
urs)
Avo
ided
po
tent
ial
floo
dw
ater
(m
3 )
Ons
ite c
om
mun
itie
s,
and
far
mer
s, w
ater
d
istr
icts
, off
site
co
mm
unit
ies
and
fa
rmer
s
XX
X
Ero
sio
n an
d
sed
imen
t re
gul
atio
n
Fo
rest
eco
syst
ems
red
uce
the
ero
sive
im
pac
t o
f ra
infa
ll o
n th
e so
il su
rfac
e, a
nd
the
velo
city
and
ero
sive
pow
er o
f ov
erla
nd fl
ow. R
oo
ts a
lso
bin
d t
he s
oil
and
red
uce
its
ero
dab
ility
. On
slo
pes
, fo
rest
s he
lp r
educ
e th
e tr
ansp
ort
of
ero
ded
sed
imen
t by
dec
reas
ing
the
ve
loci
ty o
f ov
erla
nd fl
ow (
agen
t o
f tr
ansp
ort
), p
rom
oti
ng d
epo
siti
on
and
in
filtr
atio
n o
f ov
erla
nd fl
ow. F
ore
st
eco
syst
ems
red
uce
the
po
tent
ial r
ates
at
whi
ch s
oil
is e
rod
ed a
nd t
rans
po
rted
.
Avo
ided
so
il er
od
ed
(t/h
a/yr
)
Sed
imen
t re
tent
ion
cap
acit
y o
f fo
rest
(t
/ha/
yr)
Ons
ite a
nd off
site
(d
owns
trea
m)
com
mun
itie
s
XX
X
No
tes
on
Tab
le 1:
1.
The
stud
y fo
cuse
d o
n th
e flo
w o
f sp
ecifi
c ec
osy
stem
ser
vice
s, d
efine
d in
the
co
ntex
t o
f th
e S
EE
A E
xper
imen
tal
Eco
syst
em A
cco
unti
ng 2
012
(U
N 2
014
) as
“th
e co
ntri
but
ions
of
eco
syst
ems
to b
enefi
ts u
sed
in e
cono
mic
and
oth
er h
uman
act
ivit
y”.
2.E
cosy
stem
ser
vice
s w
ere
sele
cted
fro
m a
long
lis
t o
f fo
rest
eco
syst
em s
ervi
ces
follo
win
g th
e co
nduc
t o
f sc
op
ing
stud
ies
at t
he s
tud
y si
tes
and
revi
ew o
f lit
erat
ure
to
det
erm
ine
whi
ch s
ervi
ces
fro
m f
ore
st e
cosy
stem
s w
ere
rele
vant
to
the
stu
dy
que
stio
ns.
3.E
cosy
stem
ser
vice
cap
acit
y in
dic
ato
rs a
re i
nclu
ded
in
the
tab
le a
long
sid
e th
e p
ote
ntia
l b
enefi
ciar
ies
of
the
serv
ices
. F
or
pur
po
ses
of
this
stud
y, t
he b
enefi
ciar
ies
refe
rred
to
are
po
tent
ial a
nd n
ot
actu
al, a
s th
e su
rvey
s d
id n
ot
asse
ss a
ll us
ers
of
eco
syst
em s
ervi
ces
or
eco
syst
em s
ervi
ce d
eman
ds.
4
.W
ater
pur
ifica
tio
n m
od
elin
g r
esul
ts a
re n
ot
incl
uded
in t
his
rep
ort
, but
can
be
foun
d in
Ara
za (
2016
).

Modeling ecosystem services
Ecosystem services were simulated using three software — SedNet, Soil and Water Assessment Tool applied in ArcGIS (ArcSWAT), and the hydrologic modeling system (HEC-HMS) — as well as two customized approaches for modeling timber provision and carbon sequestration. SedNet was used to model the erosion regulation and sedimentation control services. ArcSWAT was applied to model water yield, water flow regulation, and water purification. HEC-HMS helped estimate the flood regulation service. Customized approaches developed by the Forest Management Bureau (FMB) for assessing timber and carbon helped estimate the carbon sequestration and timber provision services. Calibration and validation of the ArcSWAT and HEC-HMS models were done using observed streamflow data from the Santo Nino River in UMRBPL.
As observed streamflow data was neither available for the Libmanan and Pulantuna Rivers in the LPW, nor for the Agusan River in UMAM, calibration and validation of the models could not be done. The accuracy of simulated streamflow results for the LPW and UMAM are assumed to be lower than for UMRBPL where observed streamflow data was available for model calibration and validation. The SedNet model was not calibrated and validated using observed data from the study areas, which limited the accuracy of the results. Details of the modeling including descriptions of the models, input data, and calibration and validation statistics are included in the background report for ecosystem service modeling (Araza 2016).
Landscape simulations were developed to assess ecosystem services under different land cover extent and spatial arrangements within a watershed. These simultations do not advocate a particular land development trajectory, but were instead used to illustrate the impact of changes in forests (extent and location) on ecosystem services, and the potential effects of these changes on watershed resilience.
Forested: The Forested landscape simulation represents a situation where the majority of the land cover of the watershed consists of closed forests. In this landscape, areas that were previously open forests, perennial crops, grasslands, shrubs, and barren land were converted to forest. Annual crops in the gently sloping areas (<8%)15 were maintained.
Conservation: The Conservation landscape simulation represents a situation where enforcement of regulations regarding forest cover in riparian zones16, on slopes greater than or equal to 50%, and on lands 1,000 meters above sea level (absl) are maintained. In this simulation, closed forests are situated in riparian zones, on slopes greater than or
20
15 The threshold of 8% was selected, as studies undertaken by the Philippine Bureau of Soils and Water shows higher rates of moderate to severe soil degradation on lands under agriculture on slopes >8%, compared to slopes <8% (Francisco 1998).
16 Riparian areas are defined in the Revised Forestry Code of the Philippines as land areas within a 20-meter boundary along the edge of the normal high waterline of rivers and streams with channels at least 5 meters wide.
equal to 50%, and on lands 1,000 meters absl. Open forests were converted to closed forests. Grasslands, woodlands, and areas under annual crops were converted to perennial crops.
Agricultural: The Agricultural landscape simulation represents a situation where there is a heavy focus on agriculture within the watershed and forests have been converted to perennial crops or annual crops. There is no forest cover in the watershed.
Bare-Urban: The Bare-Urban landscape simulation represents a situation where the watershed is highly urbanized and there has been a large-scale conversion of natural vegetation to barren lands and built-up (urban) land cover.
Land cover area tables for each of the sites under the different landscape simulations are presented in Annex 2. Assumptions for the land cover conversion and maps of the land cover simulations for the different sites are included in Araza (2016).
Valuing forest ecosystem services
Valuation of forest-based provisioning and regulating ecosystem services was undertaken using exchange values, which is in line with the System of National Accounts (SNA) 2008 and SEEA (2012). The ecosystem services that were modeled in the study, and for which values were estimated, are included in Table 2. The unit resource rent can be assessed by analyzing the difference between the exchange value of a benefit unit and the sum of the unit costs of labor, produced assets, and intermediate inputs (UN 2014). It provides an estimated value of the ecosystem service.
In the replacement cost method, the value of the ecosystem service is based on the costs associated with mitigating actions if the ecosystem service were lost. The approach to value carbon sequestration using the Social Cost of Carbon (SC-CO2) was adopted from Phil WAVES. The SC-CO2 provides an estimate of the economic damage associated with a small increase in carbon dioxide (CO2) emissions, conventionally 1 metric ton, in a given year (US Environmental Protection Agency). One of the approaches suggested by SNA and SEEA in estimating the value of timber resources is using the net present value (NPV) method. The NPV of the annual resource rent is derived by discounting the expected future net resource rents from the timber asset. The estimation of resource rent was based on the stumpage value method, obtained by deducting various management and harvesting costs from the pickup price of logs (UN 2014).
21

Table 2: Forest ecosystem services modeled and valued by study siteEcosystem
ServiceInterpretation Valuation
MethodologyUMRBPL LPW UMAM
Water Provision
Supply of water or water yield Replacement cost (water delivery, rainwater harvesting)
Yes Yes Yes
Water flow Regulation
Regulated water supply (based on additional irrigable area)
Resource rent
Yes Yes Yes
Erosion Control
Avoided soil erosion Replacement cost
Yes Yes Yes
Sediment Control
Reduced sediment load in waterways
Replacement cost
Yes Yes Yes
Carbon Sequestration
The amount of CO2 sequestered by standing forests
Social cost of carbon
Yes Yes Yes
Timber Provision
Supply of timber traded in a market or used for subsistence
Net present value
No No Yes
Analyzing forest use
A two-step approach was undertaken for forest use analysis: (1) a series of focus group discussions (FGDs) were undertaken with residents at the study sites; (2) a series of FGDs and key informant interviews (KIIs) was conducted only in the UMRBPL using wealth and gender lens to deepen the analysis.
The first step used an FGD interview guide (see Annex 5), which was developed based on the “National socio-economic surveys in forestry: Guidance and survey modules for measuring the multiple roles of forests in household welfare and livelihoods” produced by the Food and Agriculture Organization (FAO), the Center for International Forestry Research (CIFOR), the International Forestry Resources and Institutions Research Network (IFRI), the Program on Forests (PROFOR), and the World Bank. The second step applied the Poverty-Forests Linkages Toolkit developed by the PROFOR to guide the FGDs and KIIs. The toolkit is a field manual designed to aid practitioners on data collection and analysis in understanding forest dependency and thereby reduce vulnerability among poor upland communities. It consists of eight modules on participatory appraisal/assessment.
During the FGDs, the participants were asked to base their answers on their experiences or observations in the last five years (2011-2015) except for those revolving around forest changes and clearances, which should be based on the last 10 years.
22
In addition to the modules, community mapping was also undertaken to facilitate understanding of the spatial location of the forest from the community where the participants collect forest products. Due to time and resource constraints, it was not possible to include in the FGD all barangays within the Libmanan-Pulantuna Watershed and Umayam, Minor and Agusan Marsh Sub-basins. Representative barangays were tapped instead based on their dependence on forest ecosystem services and ecosystem type (upland, lowland, marsh, and mangrove). These barangays were randomly grouped into clusters and were represented by six participants, who in turn were selected based on their knowledge of river basin conditions drawn from many years of living in the area, as well as on gender, livelihood, and participation in reforestation/restoration programs like the NGP.
The PROFOR Poverty-Forests Linkages toolkit provides a set of fieldwork methods and analytic tools based on participatory appraisal/assessment tools (see Annex 5). As the toolkit was applied in the Philippine setting, the study team implemented wealth ranking, local landscape situation analysis, livelihood analysis, and forest problem and solution matrix. Forest product tools were also ranked to achieve efficient and effective data collection and analysis strategies given the brief engagement allotted for this deep-dive analysis.
Developing scenarios
Three watershed scenarios were created for the UMRBPL to illustrate how data and information on forest ecosystem services, as well as the use of forest ecosystem services, could inform local watershed development planning. The scenarios, collectively termed ‘No Use, Wise Use, and Ag-Use’, featured different land covers and uses, and describe some of the key drivers that led to the land covers and uses.
The scenarios were developed using a participatory scenario development process that drew on the methods described in Ash (2010). A wide range of stakeholders provided inputs to the scenarios17. Some of the results of the ecosystem service modeling and forest use analysis were used to approximate forest ecosystem services under the different scenarios, and assess the impact of the watershed development scenarios on the upland community in the UMRBPL through tradeoff analysis. Ecosystem services estimated under the ‘Forested’ landscape simulation were used as an approximation for ecosystem services under the ‘No Use’ scenario. Ecosystem
23
17Participants in the scenario development exercise included representatives of the following: Climate Change Commission; Department of Agriculture; Department of Environment and Natural Resources (DENR); DENR agencies, namely, Biodiversity Management Bureau, Climate Change Service, Ecosystem Research and Development Bureau, Foreign-Assisted and Special Project Service, Forest Management Bureau, and Policy and Planning Service; Laguna Lake Development Authority; National Mapping and Resource Information Authority; Region 13 Field Office; Region 4A Field Office; Region 5 Field Office; River Basin Control Office; Rizal provincial and municipal government offices; National Economic and Development Authority; People's Organization of UMRBPL; World Bank. A total of 50 individuals participated in the scenario development workshops.

services under the ‘Conservation’ landscape simulation were used as an approximation for ecosystem services under the ‘Wise Use’ scenario. Ecosystem service modeling was undertaken for the projected land cover under the ‘Ag-Use’ scenario. However, these results are not included in Chapter 3.
Study Sites
Three study sites across the Philippines were selected for the conduct of forest use analysis, ecosystem service modeling, and ecosystem services valuation. The sites allowed for comparison of results trends across these areas. The specific modeling results would necessarily be different as the sites have different biophysical characteristics. Selection of study sites was guided by a set of established criteria that included climate change risk, poverty incidence, proportion of forest cover, and availability of information. Final selection of study sites, namely, the Upper Marikina River Basin Protected Landscape (UMRBPL), the Libmanan-Pulantuna watershed (LPW), and Umayam, Minor and Agusan Marsh (UMAM) sub-basins, was made following prioritization based on the above criteria and agreement with the Philippine government to ensure that these sites were sufficiently representative to allow for extrapolation of the findings and conclusions from the analysis to other local upland areas.
A map of the study sites is shown in Figure 2, and brief descriptions of the study site are presented in the following sub-sections. (More detailed information on the study sites is available in the Scoping Report for the study; see Ignacio 2015.)
Upper Marikina River Basin Protected Landscape (UMRBPL)
The UMRBPL watershed covers five municipalities of the province of Rizal — Rodriguez, Antipolo, Baras, San Mateo, and Tanay — and is located upstream of Metro Manila. The watershed covers an area of 26,126 ha18 and is drained by the Santo Niño/Marikina River. The watershed has a total population of approximately 15,788 persons or 3,370 households19 . Official poverty incidence statistics are available at the provincial scale, and poverty incidence was estimated at 10.4% for the first semester of 2015 for Rizal20. According to the Survey and Registration of Protected Area Occupants (SRPAO) undertaken by the government in 2013, the poverty incidence in UMRBPL was higher than the provincial average, while the annual income among 88% of households fell below the poverty level of PHP 109,680/year (US$ 2,367/year). (See Table 3.)
24
18 By virtue of Proclamation No. 296 s. 2011 (http://www.gov.ph/2011/11/24/proclamation-no-296-s-2011/).
19 Survey of Protected Area Occupants (SRPAO) 2011-2013.
20 A poverty incidence of 10.4% for the first semester of 2015 was determined by the Philippines Statistical Authority for the province of Rizal, where the UMRBPL is situated (http://psa.gov.ph/).

Figure 2: Study sites in the Philippines
25
The UMRBPL watershed is considered degraded due to human activities, and is affected by severe soil erosion, intensive land use, and land degradation. Forest cover in 2015 was estimated at 21.1% (2.1% closed forest and 19% open forest)21; a map of land cover in the UMRBPL is shown in Annex 1. The watershed is also threatened by the urban sprawl of Eastern Metro Manila and has experienced massive land use changes in recent years. The UMRBPL is important to Metro Manila owing to its watershed services including domestic water supply, and its role in reducing the incidence and scale of rainfall-induced flooding in the urban area.
UMRBPL was declared a protected area in 2011 following the massive flooding in Metro Manila caused by Typhoon Ketsana (locally known as Ondoy) in 2009 in order to protect and conserve forested areas in the watershed and reduce the potential for flooding in Metro Manila.
Libmanan-Pulantuna Watershed (LPW)
The Libmanan-Pulantuna watershed is a sub-basin of the Bicol River Basin, and covers the provinces of Camarines Sur and Camarines Norte. The watershed covers an area of 74,345 ha22, and is drained by the Libmanan and Pulantuna Rivers. Estimated population levels in 2015 were 214,458 persons or 43,767 households. Historically, the communities making up the Bicol River Basin have experienced high levels of rural poverty. Approximately 9,235 households earn annual incomes below the poverty line of PHP 109,680/year. (US$ 2,203/year.)23 , and 1,101 households earn incomes below the subsistence level of PHP 79,620 (US$ 1,600/year).
The watershed faces a combination of man-made and natural threats. Unsustainable use of forest resources to support livelihoods, timber poaching, and the conversion into agricultural production areas were identified as key threats in the LPW. Forest cover in 2015 was estimated at 15.6% of the LPW watershed area — comprising 3.9% closed forest, 10.7% open forest, and 1% mangrove forest (see map of land cover in LPW in Annex 1.) The watershed is also highly exposed to typhoon activity as it is also located in the region most frequented by tropical cyclones.
Umayam, Minor and Agusan Marsh Sub-basins (UMAM)
The UMAM is situated in the Agusan River Basin in the Caraga region in the northeastern part of the southern island region of Mindanao. An estimated 27% of the UMAM falls within the jurisdiction of Agusan del Norte, 72% in Agusan del Sur, and 1% in Bukidnon and Compostela Valley provinces. The sub-basins of Kayonam/Umayan and Minor/Lam-awan comprise the Middle
26
21 Data was obtained from the Philippine Forest Management Bureau and the National Mapping and Resource Information Authority.
22 Integrated Ecosystems Management Framework of the Libmanan-Pulantuna Watershed, 2011.
23 Using the provincial poverty incidence of 21.1% (psa.gov.ph)

Agusan River Basin or UMAM, and occupy a total area of 311,845 ha24. The main river draining the UMAM is the Agusan River. UMAM’s population as of 2015 was 1.16 million or 250,942 households25.
Data from the 2015 Community-Based Monitoring System (CBMS) survey showed poverty incidence among Agusan del Sur households within the UMAM sub-basins at about 85%, which was significantly higher than the provincial average poverty incidence of 54.8%. About 34% of these households earned incomes below PHP 10,000/year (US$ 201/year ) in 2015. (See Table 3.)
Key challenges in the Agusan River Basin are mining and forest degradation. The use of mercury, cyanide, and explosives is adversely affecting the water quality downstream. Deforestation is also a major concern. Forest cover as of 2015 in the UMAM was 29% (6.1% closed forest, 22.5% open forest, 0.4% mangrove forest). Most of the existing forest is situated in Agusan del Sur (see map of land cover in UMAM in Annex 1). Together mining and deforestation have contributed to problems of poor water quality, sedimentation, and flooding. Other issues include resource use conflicts such as those involving land, mineral, forest, fisheries, domestic water supply and environmental risks and hazards.
Economic activities in the Caraga region, including UMAM, are oriented toward agriculture and forestry. Several local wood and forest-based industries contribute to the national economy, making the region the top producer of major forest-based products (logs, lumber, veneer, plywood) in the entire country. Caraga ranks fifth among all the regions in terms of vegetative cover, which includes second-growth forest, brushland, plantation forest, and old-growth dipterocarp forests. Mining, agricultural conversion and expansion, climate change, and land conversion to settlements contribute to the pressures on the forestlands of the region.
Table 3: Proportion of households (in %) with annual incomes (in PHP) below and above the poverty line of PHP 109,680/year (US$ 2,367/year) in UMRBPL and UMAM
Annual household income (PHP)
UMRBPL UMAM
Below poverty lineBelow poverty lineBelow poverty line
<10,000 23.5 33.7
10,001-30,000 31 28.5
30,001-70,000 22.6 22.7
27
24 The breakdown of land area is as follows: Agusan Marsh — 19,330 ha, according to Presidential Proclamation 913; Umayam — 72,597 ha, according to the ARB Master Plan; Minor/Middle — 219,918 ha, according to the ARB Master Plan.
25 Based on the 2007 average household size of 5.1 persons per household for Region 13 (psa.gov.ph)

Annual household income (PHP)
UMRBPL UMAM
70,001-109,680 10.9 8
Sub-total 88 93
Above poverty lineAbove poverty lineAbove poverty line
109,680-140,000 4.8 2
140,001-250,000 4.8 3
250,001-500,000 1.8 1.2
>500,000 0.5 0.8
Sub-total 12 7
Note: similar data on annual household income by range could not be obtained for LPWSources: SRPAO 2011-2013 and CBMS Survey, 2015
28

3 | Forests and Climate Resilience
Summary of Key Findings
The overarching message of the study on the relationship between forests and climate resilience is that forests are relevant to climate resilience. Healthy forests help reduce risks to climate variability by providing high-quality ecosystem services that contribute to more resilient communities. The resulting data help corroborate some common understandings of the role of forest ecosystems in facilitating water flows and reducing hazards. The key findings of the analysis include the following:
1. Higher forest cover generates higher water yields in the driest months of the year compared to lower forest cover, thereby helping enhance the resilience of communities dependent on these water resources.
• Water yield from shallow ground water in the UMRBPL was estimated to be on average 149% to 167% higher under the Forested simulation compared to the Bare-Urban landscape simulation.
• Stream discharge under forested conditions was found to be greater and more regulated compared to the discharge under bare-slope conditions during the three driest months of the year.
• The study estimated that forests help maintain stream flows above the 80% dependable flow rate for more than 60% to 80% of the three driest months of the year. If this service were replaced by delivered water, the expected costs would be PHP 20,875 (US$ 419) per household per year in UMRBPL; PHP 52,953 (US$ 1,064) per household per year in LPW; and PHP 44,854 (US$ 901) per household per year in UMAM. These costs will be prohibitive to most households in the study sites as the majority subsist below the poverty line.
• Forests have the potential to increase the service area that can be irrigated by as much as a factor of 24 (65 ha to 1,571 ha) during the three driest months of the year in UMRBPL.
2. Water flow regulation by forests reduces potential floodwater generation in watersheds and in areas downstream of watersheds, thereby reducing the risk of flooding.
• Higher forest cover can help reduce the volume of floodwater generated in a watershed by 27% to 47% during the three wettest months of the year compared to a ‘No Forest’ cover simulation in the UMRBPL.
• Forests can help reduce the potential flooding impacts of heavy rainstorms and typhoons by increasing the time difference
29

between peak rainfall and peak discharge by two to seven hours, and reducing the peak discharge by 20% to 32%.
3. The protective function of forests helps reduce potential erosion and sediment generation and has been estimated to have high value for natural hazard reduction. Reduced sediment generation contributes to reduced potential flooding, and as well lower treatment costs for people consuming water from streams.
• Forests on steep slopes (>30%) help mitigate the risk of erosion on a per hectare basis by 68% to 99%, and have the potential to reduce annual sediment outflows from watersheds by seven to a hundred times compared to bare soil.
4. Replacing regulating ecosystem services is costly.
• Replacing erosion and sediment control services with manmade control measures will cost billions of pesos. Reforestation was thus determined to be a lower-cost alternative to securing erosion regulation ecosystem services over the medium term.
Resilient Watersheds and Ecosystem Services
The resilience of watershed ecosystems is characterized by their ability to sustain the provision of ecosystem services amid weather and climate variations. The aspect of resilience considered here is the ability of forest systems within watersheds to buffer disturbances, and maintain the ecological functions that underpin watershed ecosystem services. A resilient watershed is therefore expected to show smaller variations in ecosystem service provision compared to a less resilient watershed in the face of disturbance.
To assess resilience, four different landscape simulations were modeled to determine how the extent and spatial arrangement of forests affect the watershed ability to deliver water flow regulation, water provision, and erosion and sediment regulation ecosystem services under different weather conditions. Descriptions of the landscape simulations are discussed in Chapter 2 of this report, while details of the ecosystem service modeling are provided in the background report on ecosystem service modeling (Araza 2016).
Two hypotheses on resilience were tested in this study:
1. A watershed with a greater proportion of forest, and forests situated in critical areas such as on steep slopes and within riparian zones, is more resilient to weather variation, based on its ability to regulate water flows throughout the year. This ecosystem service helps ensure that
30
dry season flows do not fall below the dependable flow rate26 , and reduces the relative amounts of sediment discharge, resulting in smaller variations in flow rates due to changes in rainfall amounts compared to a less forested watershed.
2. For a storm event, a watershed with a greater proportion of forest, and forests situated in critical areas such as on steep slopes and within riparian zones, will have a lower peak discharge, a longer lag time, and lower sediment generation and sediment flow.
Water Yield and Flow Regulation During Dry Season
Dry season water shortages are currently a challenge in the Philippines, and are expected to be exacerbated by climate change. Declining rainfall levels and resultant declines in streamflow result in water shortages during the dry season. Philippine Atmospheric and Geophysical and Astronomical Services Administration (PAGASA) expects more dry days across the Philippines due to climate change27.
Water shortages are exacerbated by extreme weather events such as El Niño, which have led to drought conditions in the Philippines twice in the past decade. Drought periods are expected to worsen in the future owing to climate change and the consequent increased surface temperatures and reduced rainfall. Results of the modeling under the different land cover scenarios make a compelling case for the key role forests play in maintaining seasonal water flows and, consequently, in reducing the impacts of weather variability on ecosystem services like water provisioning, on which livelihoods depend.
Comparison of simulated yield from groundwater across the year for the UMRBPL shows that water yield from groundwater is highest during every month of the year in the Forested simulation and then declines steadily across the Conservation, Agriculture, Bare-Urban landscape simulations (see Figure 3). Groundwater availability under the Forested simulation is 149% to 167% greater compared to the Bare-Urban simulation.
These results underscore the role that forests play in facilitating rainwater infiltration and groundwater recharge. Water supply from groundwater storages contributes to increased number of days in the dry season, where streamflow could be maintained at or above usable levels. Therefore, forests, given their role in groundwater recharge, could help reduce water shortages during dry seasons.
31
26 The dependable flow rate (DFR) is the expected daily flow of a river at a particular point within a particular period. The DPR is an input in water resources planning and is often used as a benchmark for water scarcity. For the study the 80% dependable flow rate (flow rate expected with 80% probability) was used. This is consistent with use in the Philippine water sector.
27 See PAGASA 2011, “Climate Change in the Philippines”.

Changes in forest cover are not the only factor affecting groundwater recharge, as soil hydraulic conductivity plays a key role in rate of infiltration. High proportions of forests also create more opportunities for water loss through evapotranspiration, while rates of evapotranspiration are influenced by vegetation type and structure. There is therefore a need for caution when planning forest development for the delivery of water provision ecosystem service. Hence it is recommended that models such as SWAT, which consider a number of different surface and sub-surface hydrological processes, and vegetation characteristics be used.28 It is also important to realize that reforestation does not immediately lead to a healthy soil with high infiltration and water storage rates. It usually takes a number of years after reforestation for soil organic matter and the herb layer to build up, leading to a delay in the full realization of the hydrological services of forests.
Figure 3: Comparison of average simulated monthly water yield from ground water during the period 2002-2012 under landscape simulations at the UMRBPL site
Comparison of simulated surface water flows during the dry season across all three sites shows similar trends across the landscape simulations. Average daily streamflow rates during the dry season are highest under the Forested simulation but decreases steadily across Conservation, Agriculture, and Bare-Urban landscape simulations. This trend does not apply to LPW, where the dry season is not very pronounced and rainfall is high throughout the year.
Although trends show higher streamflow under forested landscapes for UMRBPL and UMAM, the differences are small, and so the potential benefits
0
60,000
120,000
180,000
240,000
300,000
Jan Mar May Jul Sep Nov
wat
er v
olum
e, (m
3)
Bare-Urban Agriculture Forested Conservation
32
28 See Krishnaswamy (2012) and Krishnaswamy (2013) for discussions on the relationships between land cover, evapotranspiration, infiltration, and runoff.

provided by forests in terms of improving daily streamflows may be minimal as well. Results shown in Figure 4 indicate that the UMRBPL simulated streamflow rates under the Forested and Conservation simulations are fairly steady despite a slight decline between the start of the dry season in February and end of the season in May. These rates are on average higher than the flow rates yielded by the Agriculture and Bare-Urban simulations, which are found to be highly fluctuating and responsive to rainfall events. This trend of steady flow and highest total water yield under forested conditions stem from higher rates of rainfall infiltration that takes place under such conditions, leading to groundwater recharge and sub-surface soil water storages, which in turn make water available for base flow to sustain streamflow even on days without rainfall.
The high responsiveness of streamflow to rainfall under the Bare-Urban and Agricultural simulations is a result of the conversion of much of the rainfall to overland (surface) flow, which rapidly makes its way to the stream. The results of dry season flow simulation for the LPW and UMAM (included in Annex 6) show smaller variations in daily flow rates under the Forested and Conservation scenarios compared to Agriculture and Bare-Urban simulations. The trend is less pronounced in these watersheds compared to the UMRBPL.
The watersheds can be expected to respond differently as they are of different sizes and shapes. Rainfall levels and frequency are different across the three sites within the dry season. It must be noted that the extent of closed forest land cover and the proportion of land covers under the different simulations at the different sites are not the same. (See landcover tables in Annex 2.) For example, closed forest extent under the Forested simulation is 92% for UMRBPL, 81% for LPW, and 61% for UMAM.
Figure 4: Comparison of simulated average daily streamflow rates at the Santo Nino Station in the UMRBPL during the dry season under four landscape simulations for the period 2002-2012.
33

The importance of water flows facilitated by forests for human well-being, especially during drier months, becomes evident using ecosystem service indicators and the estimated values of the water provisioning service to upland communities for domestic consumption and irrigation. Freshwater for domestic use at all three study sites is sourced from rivers, streams, and springs. In the UMRBPL, water used for domestic purposes is mainly sourced from groundwater from springs and wells, and surface water from rivers and creeks. In the LPW, households that are not served by water districts (83% of households) source drinking water from wells, and water for non-drinking from springs, wells, and creeks.
Water from the Santo Niño River in UMRBPL, Libmanan and Pulantuna rivers in LPW, and Agusan River in UMAM is used for irrigation of rice paddies, coconut, abaca, and pineapple. Irrigation is supported throughout the year by these rivers, but it is more needed during the dry season, when there is insufficient rainfall, to support crop systems. Some farmers in LPW and UMAM reported irrigation challenges due to insufficient surface water during the dry season. Increasing the irrigation service area in the Philippines is important because it helps prevent food insecurity and enhances income from livelihoods.
The proportion of the dry season where flow rates are above the 80% dependable flow rate (DFR) was one of the water flow regulation ecosystem service indicators used in this study29. The DFR is the expected daily flow rate at a particular point in the stream within a specific time period. It is an input in water resource planning and is often used as a benchmark for water scarcity.
The 80% DFR is consistent with its use in the Philippine water sector for determining available water to be allocated for water permit applications. The results presented in Figure 5 for the three study sites show that based on this indicator, the Forested landscape simulation performs best by ensuring flows above the DFR during the dry season; this is followed by Conservation, Agriculture, and Bare-Urban simulations. The importance of forest cover in helping ensure dry season water flows above the DFR is more pronounced for the UMRBPL, where, under the Forested and Conservation landscape simulations, dry season water flows are above the DFR for about 50 to 60% of the season. This is in contrast to the situation under the Agriculture and Bare-Urban simulations, where for 90% of the dry season, flow rates are lower than the DFR.
To determine the value of the water provisioning service of the forest at the three sites to the upland communities, the annual costs of replacing the water
34
29 The 80% dependable flow rate (flow rate expected with 80% probability) was used, which is consistent with use in the Philippine water sector.
used by these communities was determined30. Data from water service delivery providers was used to estimate the costs households will incur to have water delivered by water trucks to them. There is a cost differential in the prices of drinking and non-drinking water, which was used in determining the replacement cost of the water provisioning services. Details of consumption and prices for all sites are included in Annex 4. The costs of replacing the water provisioning service to households in accessible and less accessible areas was found to be between PHP 20,875 (US$ 419) and PHP 26,417 (US$ 531) per household per year in UMRBPL; PHP37,702 (US$ 757) per household per year in LPW; and PHP 24,145 (US$ 485), and PHP 26,873 (US$ 540) per household per year in UMAM.
The costs of replacing the water provisioning service provided by the forests is likely to be prohibitive to many of the upland communities at the three sites. The costs of securing water through delivery represent a significant proportion of the income of the upland communities. For example, 81% of households in the UMRBPL earn less than PHP 76,380 (US$ 1,534) per year. In a scenario where water provisioning services cannot be provided by forests, upland communities in the UMRBPL may spend as much as 25% of their annual incomes on securing drinking water instead of on other needs or activities.
The implications of such a scenario may be severe for these poor upland communities and pose additional challenges to poverty reduction. Households belonging to the upper-income brackets and living above the poverty level have better adaptive capacity, because they can afford to have water delivered to them or erect rainwater harvesting tanks. Households living below the poverty line will be the hardest hit if the water provisioning service of the watersheds is lost or impaired.
35
30 A second approach to estimating the value of the water provisioning service is to consider the annualized cost of household rainwater harvesting facilities; details of the prices are included in Annex 3. Water tanks made of ferrocement are common in rural areas of the Philippines, where there are no water districts or barangay water systems. Using the second approach, the values of the water provisioning service were estimated to be between PHP 2,857 and PHP 5,333 per household per year in UMRBPL; between PHP 2,830 and PHP 5,276 per household per year in LPW; and PHP 2,446 and PHP 4,564 per household per year in UMAM.

Figure 5: Comparison of proportion of dry season where the flow rate of the rivers in the study sites is > the 80% DFR across the four landscape simulations at the UMRBPL, LPW, and UMAM study sites for the period 2002–2012
Note for Figure 5: Using observed streamflow data for the dry season months for the period 2002-2012, the 80% DFR flow rate was calculated at 2.9 m3/s for the Santo Niño River in UMRBPL. Simulated daily stream flow was used to determine the 80% DFR for the Libmanan River in LPW and Agusan River in UMAM — 9.3 m3/s and 199 m3/s, respectively. The differences between UMRBPL, LPW, and UMAM are likely due to the differences in the extent of closed forest land cover. The proportion of land covers under the different simulations across the different sites varies. For example, closed forest extent under the Forested simulation is 92% for UMRBPL, 81% for LPW, and 61% for UMAM. (See landcover tables in Annex 2.)
A second ecosystem service indicator used for water flow regulation was the area of land that could potentially be irrigated31. Results shown in Table 4 using this indicator indicate that 1,571 ha of rice paddies can potentially be irrigated in the dry season due to water flow rates under a Forested landscape simulation in the UMRBPL, which is about 24 times the area that could be irrigated in the dry season under a Bare-Urban simulation32 . Results for LPW and UMAM also indicate an increase in the service area for irrigation under the Forested landscape simulation.
The value of the water provisioning service of the forest to irrigation was estimated using the service area that could potentially be irrigated under the different land cover simulations, and the resource rents that could be captured. Table 4 shows that the Forested simulation yielded the highest potential areas that can be irrigated across the three sites, followed by the Conservation simulation. Consequently, the additional paddies that could be
Forested Conservation Agriculture Bare-Urban
0
30
60
90
UMRBPL LPW UMAM
Perc
enta
ge o
f dry
sea
son
whe
re d
aily
flow
s >
80%
DFR
36
31 A study by Duku et al. (2015) in Benin used a similar indicator of crop water supply.
32 The assumptions used regarding water use by irrigated rice are included in Araza 2016.

irrigated during the dry season relative to the Bare-Urban simulation is also highest under the Forested simulation.
Focusing on the UMAM, where there is a gap between the potential area that could be irrigated and the actual area that is irrigated, the additional paddies that could be irrigated under the Forested simulation is 3,946 ha, and 3,069 ha under the Conservation simulation. The unit resource rents for the dry season of UMRBPL, LPW, and UMAM are PHP 7,600 (US$ 153)/ha, PHP16,796 (US$ 337)/ha, and PHP12,230 (US$ 246)/ha, respectively33. The additional resource rents during the dry season under the Forested simulation are higher than those of the Conservation simulations for the three sites, and are highest for UMAM under both scenarios (see Table 4). The value of the water provisioning service for irrigation could be inferred from these results.
Table 4: Potential irrigated paddies of the three study areas under forest and conservation simulation
UMRBPL LPW UMAM
Potential Irrigated Paddies, Dry SeasonPotential Irrigated Paddies, Dry SeasonPotential Irrigated Paddies, Dry SeasonPotential Irrigated Paddies, Dry Season
Bare (ha) 65 16,875 5,310
Forest (ha) 1,571 17,070 9,256
Conservation (ha) 1,557 16,971 8,379
Additional Irrigated Paddies, Dry SeasonAdditional Irrigated Paddies, Dry SeasonAdditional Irrigated Paddies, Dry SeasonAdditional Irrigated Paddies, Dry Season
Forest vs. Bare (ha) 1,506 195 3,946
Conservation vs. Bare (ha)
1,492 96 3,069
Unit Resource Rent, Dry Season (PHP/ha)
7,600 16,796 12,230
Additional Resource Rent, Dry Season
Forest vs. Bare (PHP/year)
11,445,646 3,275,220 48,259,580
Conservation vs. Bare (PHP/year)
11,339,200 1,612,416 37,533,870
37
33 Resource rent estimation is provided in Calderon (2016), “Valuation of Forest Ecosystem Services.”

Table 5: Potential irrigated area of rice paddy under different land covers for the dry cropping season due to land cover in the UMRBPL. LPW and UMAM for the period 2002-2012
Landscape simulation
Potential area for rice paddy irrigation in the dry season (ha)Potential area for rice paddy irrigation in the dry season (ha)Potential area for rice paddy irrigation in the dry season (ha)Landscape simulation
UMRBPL LPW UMAM
Bare-Urban 65 16,875 5,310
Forested 1,5171 17,070 9,256
Additional areas irrigated due to forest cover
1,506 195 3,946
The water flow regulating service provided by forests during the dry season is important for resilience to future climate change. Under a high-impact climate scenario, rainfall projections for 2050 were reduced by 29% and 31% relative to 2015 rainfall levels in UMRBPL and UMAN, respectively34. Accordingly, flow rates under all of the simulations at these two sites have also decreased as less rainfall contributes to lower streamflows.
Rainfall levels in the LPW increased in 2050 according to PAGASA’s climate projections, resulting in an increased daily average water flow rate. in the modeling The comparison of water flow rates under the different simulations for 2050 shows a similar trend to the 2002-2012 average (see Table 6). For the UMRBPL site, while rainfall levels have decreased by 29%, average daily flows are still maintained above the 80% DFR35 for the dry season under the Forested and Conservation simulations.
Table 6: Comparison of daily average dry season flow rates in UMRBPL, LPW and UMAM by landscape simulation for the periods 2000-2012, and 2050
Landscape simulation
UMRBPLUMRBPLUMRBPL LPWLPWLPW UMAMUMAMUMAMLandscape simulation
2002-2012
2050 % change
2002-2012
2050 % change
2002-2012
2050 % change
Landscape simulation
Water Flow (m3/s)
Water Flow (m3/s)
% change
Water Flow (m3/s)
Water Flow (m3/s)
% change
Water Flow (m3/s)
Water Flow (m3/s)
% change
Forested 4.16 3.27 -27.2 53.48 78.19 32.9 460.3 418.6 -9.9
Conservation 4.03 3.1 -30.0 51.45 76.6 32.9 457.26 416.1 -9.9
Agriculture 1.8 1.65 -9.1 50.53 74.41 32.1 454.8 414.5 -9.7
38
34 Data obtained from PAGASA (2011) climate change projections using the PRECIS model at the regional scale. Extrapolation from the regional to watershed scales is likely to introduce inaccuracies in the projections.
35 Using 80% DFR developed from 2002-2012 data.

Landscape simulation
UMRBPLUMRBPLUMRBPL LPWLPWLPW UMAMUMAMUMAMLandscape simulation
2002-2012
2050 % change
2002-2012
2050 % change
2002-2012
2050 % change
Landscape simulation
Water Flow (m3/s)
Water Flow (m3/s)
% change
Water Flow (m3/s)
Water Flow (m3/s)
% change
Water Flow (m3/s)
Water Flow (m3/s)
% change
Bare-Urban 2.27 1.26 -80.2 52.81 71.74 26.4 441.18 401.9 -9.8
Natural Hazard Mitigation
Forests play a key role in reducing potential flood danger and damage by providing temporary stores for rainwater. They also facilitate infiltration of rainwater to sub-surface and groundwater stores, thus reducing overland flow, which is a key factor in flooding. This regulating service provided by forests is termed ‘avoided flooding’, and can be measured as water storage capacity in cubic meters36.
Floods in the Philippines are mainly of the rainy-fluvial type, and have been an increasing concern to the government due to climate change and the high sensitivity of its large poor population, many of whom live in areas exposed to flooding. Preventing or reducing the magnitude of flooding is therefore of high priority in the Philippines37. Mountainous areas in the Philippines, such as the UMRBPL, are as well vulnerable to flooding because floods there are formed in relatively small watersheds whose peak flows move fast along the river bed38.
Potential for flooding under the different land cover simulations was assessed for the UMRBPL by simulating the potential floodwater generated on a monthly basis39. The avoided floodwater (flood regulation ecosystem service) due to the forest ecosystem was determined as the difference between the potential flooding under the landscape simulations and Bare-Urban simulation (see Figure 6). This result shows that the avoided flooding service is greatest in July to September (wet season) and that forest can reduce potential floodwater volume by 27% to 48% during this period.
39
36 Challenges in integrating the concept of ecosystem services and values in landscape planning, management and decision making (de Groot 2010).
37 The flooding challenge, especially for Metro Manila, is a focal area of President Duterte's administration. See Duterte’s 2016 State of the Nation Address, http://www.rappler.com/nation/142958-duterte-emergency-powers-traffic-flooding-recto. Accessed on November 25, 2016.
38 Flood regulating ecosystem services—Mapping supply and demand, in the Etropole municipality, Bulgaria (Nedkov 2012).
39 This was done by comparing the stream discharge to bankfull discharge. Bankfull discharge is the flow that reaches the transition between the channel and its flood plain. Floodwater is therefore the volume of water that exceeds the volume at bankfull discharge.

Figure 6: Avoided floodwater (flood regulation ecosystem service) on an average monthly basis facilitated by forest in UMRBPL
The natural hazard mitigation service provided by forests in watersheds is also important during the rainy season, when heavy rainstorms and typhoons often result in widespread flooding in the Philippines as they release large amounts of rain in a relatively short time. The ability of forests to provide temporary storages and facilitate infiltration can reduce the potential impacts of heavy rainstorms and typhoons by reducing the time difference between peak rainfall and peak discharge – known as the lag time — and reducing peak discharge. Increasing the lag time has two practical benefits: (1) increased rainfall infiltration into the soil, and (2) longer time to prepare for potential flooding. Model simulations of river discharge in the UMRBPL under two landscape simulations — Forested and Bare-Urban – using rainfall data from Typhoon Ketsana (Ondoy) were undertaken to demonstrate the ability of forest to regulate flows even during extreme weather events (see Figure 7).
Results of simulations show differences in lag time of about five hours under the Forested and Bare-Urban simulations. Similar results were found for river discharge simulations in the LPW using weather data from other heavy rainfall events (see Annex 6), where the lag time under Bare-Urban situation was shorter by two to seven hours compared to the Forested simulation, and where the peak discharge is higher in the Bare-Urban simulation. These results support the trends found in the other model simulations, where the forested watershed yields better water flow regulation and contributes to watershed resilience to extreme weather events.
Forested Conservation Agriculture
0
12,500,000
25,000,000
37,500,000
50,000,000
Jan Feb Mar Apr May Jun Jul Aug Sep Oct Nov Dec
40
Avoi
ded
Floo
dwat
er (m
3 )

0.
37.5
75.
112.5
150.
0
250
500
750
1,000
0:00 4:00 8:00 12:00 16:00 20:00 0:00 4:00 8:00 12:00 16:00 20:00 0:00 4:00 8:00 12:00 16:00 20:00 0:00 4:00 8:00 12:00 16:00 20:00
rain
fall
(mm
)
Stre
amflo
w (m
3/s)
Time (hrs)
PCP Bare-Urban 2015 Land Cover Forested
Figure 7: Simulations of streamflow at the Santo Niño River Station under Forested, 2015 Land Cover and Bare-Urban simulations for the period September 25 to 27, 2009 during Typhoon Ketsana (Ondoy)
Note on Figure 7: The time difference between peak discharges for the simulations under Forested and Bare-Urban landscapes is about five hours, while peak discharge under forested conditions is 32% lower compared to Bare Slope conditions.
Role of Forests in Erosion and Sediment Regulation
Forests unequivocally help reduce erosion and the transport of eroded sediments. The differences in rates of potential erosion between the Forested and Conservation simulations, and between the Agricultural and Bare-Urban simulations (see Figure 8), indicate that forests in a landscape can help reduce the potential erosion by as much as 99.7% compared to bare soil landscape simulation. Further analysis of the effect of forests on reducing potential erosion on steep slopes (>30%) was done by comparing simulated erosion under Forested and Bare Slope conditions (see Figure 9). It was found that forest cover reduced potential erosion on a per hectare basis by 68% to 99% for UMRBPL, 99% for LPW, and 70% to 99% for UMAM.
These findings support the hillside management legislation40 in the Philippines that mandates forest conversation on steep slopes and highlands. The results of modeling sediment export under the different land cover simulations shown in Figure 9 illustrate the impact of forests on reducing the amount of sediment transported from watersheds. Across all sites the lowest sediment yield was found in the Forested landscape simulation. The highest sediment yield in the Bare-Urban landscape simulation, followed by the Agriculture landscape, then the Conservation landscape, simulations, was observed at the three sites. Sediment outflows are 30 to 90 times greater in the Bare-Urban simulation compared to the Forested simulation. These findings must be treated with caution as calibration and validation of the ArcSWAT and SEDNET models using observed sediment data was not undertaken.
41
40 DENR Admin Order 24, series of 1991, banned forest harvesting in critical areas such as steep slopes (above 50%) and areas1000 m above mean sea level (amsl).
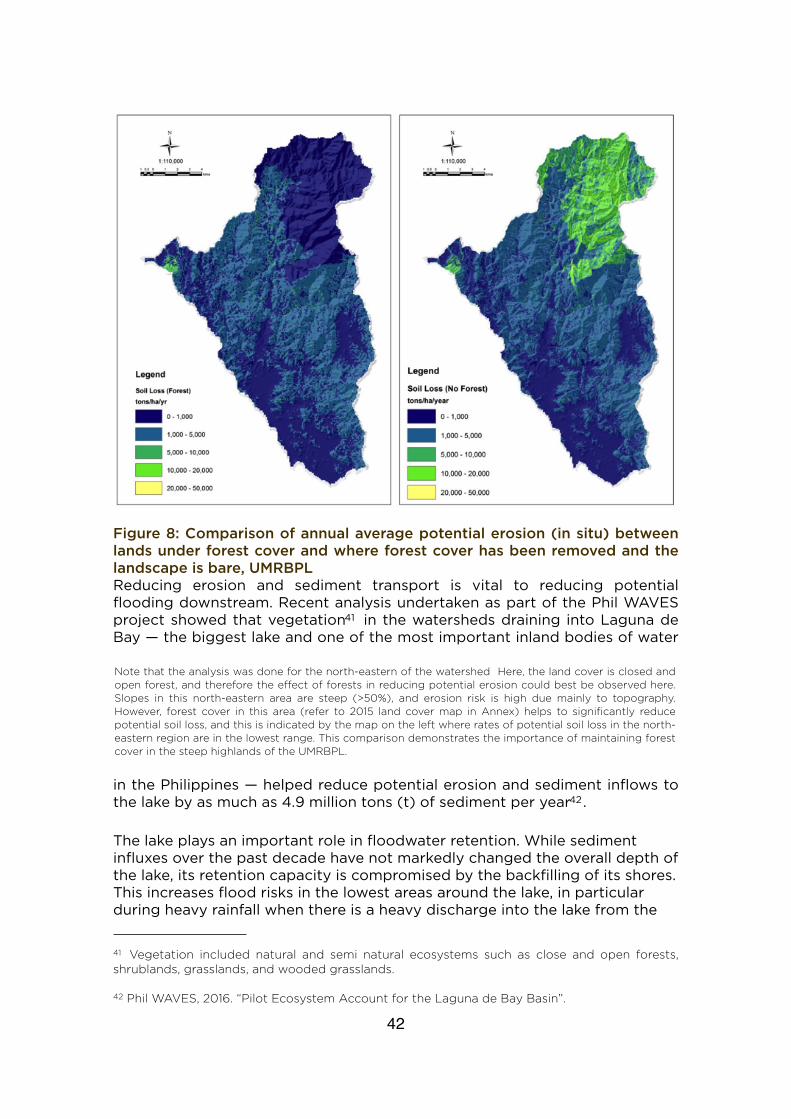
Figure 8: Comparison of annual average potential erosion (in situ) between lands under forest cover and where forest cover has been removed and the landscape is bare, UMRBPL Reducing erosion and sediment transport is vital to reducing potential flooding downstream. Recent analysis undertaken as part of the Phil WAVES project showed that vegetation41 in the watersheds draining into Laguna de Bay — the biggest lake and one of the most important inland bodies of water
in the Philippines — helped reduce potential erosion and sediment inflows to the lake by as much as 4.9 million tons (t) of sediment per year42.
The lake plays an important role in floodwater retention. While sediment influxes over the past decade have not markedly changed the overall depth of the lake, its retention capacity is compromised by the backfilling of its shores. This increases flood risks in the lowest areas around the lake, in particular during heavy rainfall when there is a heavy discharge into the lake from the
42
41 Vegetation included natural and semi natural ecosystems such as close and open forests, shrublands, grasslands, and wooded grasslands.
42 Phil WAVES, 2016. “Pilot Ecosystem Account for the Laguna de Bay Basin”.
Note that the analysis was done for the north-eastern of the watershed Here, the land cover is closed and open forest, and therefore the effect of forests in reducing potential erosion could best be observed here. Slopes in this north-eastern area are steep (>50%), and erosion risk is high due mainly to topography. However, forest cover in this area (refer to 2015 land cover map in Annex) helps to significantly reduce potential soil loss, and this is indicated by the map on the left where rates of potential soil loss in the north-eastern region are in the lowest range. This comparison demonstrates the importance of maintaining forest cover in the steep highlands of the UMRBPL.

23 subwatersheds draining into the lake (which only has one outflow, with limited capacity, i.e. Pasig river).’Maintaining forest cover in a landscape is therefore a useful strategy for reducing erosion and sediment loss. Other interventions can be applied to reduce erosion and sediment loss, and were used as basis for estimating the costs of replacing the erosion regulation and sediment control services of the forest, alongside the value of these ecosystem services.Figure 9: Comparison of modeled average annual sediment export from the three watersheds under four different landscape simulations for the period
2002-2012
Note: the similarity in rends across the three sites which emphasize the importance and effect of vegetation cover in reducing potential erosion
The erosion control service was estimated using the costs of installing cocomats to control erosion. Cocomats are a type of erosion blanket that is used for soil erosion control in different areas of the Philippines, including the UMRBPL, by the Department of Environment and Natural Resources (DENR). It is usually installed in areas with steep slopes where erosion must be immediately controlled, and complements reforestation as an erosion control measure by providing a relatively quick approach to reducing erosion.
The capacity of coco fiber matting to control erosion was estimated at 469 kg/m2. The study estimated that for UMRBPL replacing the erosion control ecosystem service provided by forests based on the 2015 land cover will require 31.125 million m2 (3,112 ha) of cocomats, with a total cost of PHP 9.34 billion (US$ 0.19 billion), or an annualized cost of PHP 2.47 million (US$0.05 million)/year based on a unit cost of PHP300 (US$6)/m2 for installing cocomats. Replacement cost estimates for the LPW and UMAM are placed at PHP 9.82 billion (US$0.2 billion) and PHP 24.15 billion (US$0.49 billion), which translate to annualized replacement costs of PHP2.60 billion (US$0.05 billion)/year and PHP6.38 billion (US$0.13 billion)/year, respectively. A
43
0
1,250
2,500
3,750
5,000
UMRBPL
Tota
l sus
pend
ed s
edim
ents
(t/y
r)
Forested Conservation
Agriculture Bare-urban
0
1,250
2,500
3,750
5,000
LPW
Tota
l sus
pend
ed s
edim
ents
(t/y
r)
Forested Conservation
Agriculture Bare-urban
0
10,000
20,000
30,000
40,000
UMAM To
tal s
uspe
nded
sed
imen
ts (t
/yr)
Forested Conservation
Agriculture Bare-urban

summary table of the estimated replacement costs for the erosion control service at the three sites is shown in Annex 6.
Comparison of the costs of reforestation with the cost of installing cocomats shows that reforestation is a more cost-effective option. Based on a comparison of the costs of installing cocomats in Rizal in UMRBPL with those of reforestation in UMRBPL for a similar period, it was found that installing cocomats costs PHP 3 million (US$ 0.06 million)/ha, while reforestation costs on average PHP 15,750 (US$ 315)/ha43. However, these data should be viewed with caution as the cocomat provides an immediate erosion regulation service, whereas planted forest trees take some time to develop into a forest that could provide the same level of erosion regulation as the former. Yet such a comparison is useful for informing watershed management planning over the medium to long term.
The sediment control service was estimated using the costs of installing and maintaining the costs of check dams. Check dams in the UMRBPL are used for multiple purposes such as sediment control, flood control, irrigation, and reduction of streamflow velocity in steep channels. The sediment control ecosystem service was based on estimations of total suspended solids (TSS) exported from a land cover simulation vis-à-vis the Bare-Urban (no forests) landscape. To replace the sediment control ecosystem service provided by forests and avoid export of 3.649 million t/ha/year of sediments from the UMRBPL, 10,467 check dams are needed, with total cost of which PHP5.105 billion (US$ 0.1 billion). On average, each check dam costs PHP 487,712 (US$ 9,798) to construct. Assuming a check dam has a lifespan of eight years and a discount rate of 15%, the annualized cost of check dams for the whole UMRBPL is PHP1.138 billion/year (US$ 0.02 billion).
Additionally, the desiltation cost (maintenance) amounts to PHP 912 million (US$ 18 million)/year. If the ecosystem service of sediment control provided by forests in the UMRBPL will be replaced with check dams, the estimated cost will be PHP 2.05 billion (US$ 0.04 billion) per year. The replacement costs of the sediment control service in LPW and UMAM were estimated at PHP 2.156 billion (US$ 0.04 billion) and PHP 2.356 billion (US$ 0.05 billion), respectively44. A summary table of the estimated replacement costs for the erosion control service at the three sites is shown in Annex 6.
44
43 From 2012 to 2015, Provincial Environment and Natural Resources Officer — Rizal installed 5.2 ha of cocomats with vetiver grass at a total cost is PHP 20.8 million (US$ 0.4 million), or PHP3 (US$ 0.06 ) million/ha. The unit cost of installation was PHP 300/m2 (US$ 6/m2). The costs of reforestation under the National Greening Program for the same period were PHP 12,400/ha (US$249) (2012), PHP 13,400/ha (US$269) (2013), PHP 16,450/ha (US$ 330) (2014), and PHP 20,450/ha (US$ 411) (2015). The differences in costs over the years are mainly due to the activities included, such as site assessment and planning, seedling production, social mobilization, monitoring, and protection. A total of 13,634 ha were planted in the UMRBPL under the NGP from 2012-2014, at a cost of PHP 194.46 million (US$ 3.9 million). Reforesting the 5,757 ha that require cocomats to provide the equivalent ecosystem service of erosion control would cost PHP 117.73 million (US$ 2.4 million), which is less than 1% of the cost of installing the cocomats.
44 Estimations for sediment control at three sites are based on the 2015 land cover.

4 | Forest Ecosystem Services Use and Values
Summary of Key Findings
This chapter discusses how the communities at each of the study sites use forest ecosystem services to support their incomes and livelihoods. Future landscape development scenarios in the UMRBPL were also developed, and tradeoff analyses were undertaken to better understand how landscape development, which includes forest development, could impact the incomes and livelihoods of forest-dependent upland communities in the UMRBPL.
1. Poor upland communities have high dependence on provisioning forest ecosystem services.
• Upland communities in UMRBPL reported that about 7% of their annual cash income comes from the sale of forest resources like bamboo products, charcoal, fish, and bush meat.
• Upland communities in the UMRBPL also reported that approximately 40% of their annual income comes from the sale of farm produce, including vegetables and bananas. Upland rice, fruits, bamboo products, and root crops are other sources of income. Farm produce is derived from farm lots in upland areas (on land classified as forest land) as well as from the forest.
• The timber provisioning service helps support the incomes of many tree farmers in the UMAM sub-basin.
2. Poor upland communities also derive several subsistence benefits from provisioning and regulating forest ecosystem services like water supply, water regulation, wood production, and biodiversity regulation.
• Water was cited by poor upland communities as the most important subsistence benefit from the forest, which they use for domestic purposes and, in some instances, for irrigation. The water provisioning service provided by forests is highly valued by upland communities regardless of gender and wealth.
• Forests also provide fuelwood and wood for charcoal, which supplies the majority of the energy needs of the upland communities.
• Herbal medicines sourced from the forests are used for common ailments like colds and coughs.
3. Poorer households in upland communities rely more on forest resources for income and subsistence.
• Results of analyses using statistical measures of association suggest that the use of forest resources for income and subsistence is more important for poorer households than for relatively wealthier ones.
45

Forest Resource Use at Study Sites
A wide range of resources are derived from forests, and communities in the study areas draw on these resources to support their livelihoods. These include non-timber forest products, fuelwood, water, and wild animals (see Table 7). Water regulation and biodiversity regulation services facilitated by forests help provide freshwater and wild animals for human consumption and support agricultural production. The use of forest resources varies among the study sites, so it is useful to provide details on how forest resources at each site are used by community groups. FGDs were undertaken at the three study sites to better understand how forest resources are used by the communities45.
Table 7: List of forest and farm products accessed by upland communities at UMRBPL, LPW, and UMAM
Forest and Farm Products UMRBPL LPW UMAM
X denotes use by communities in the watershedX denotes use by communities in the watershedX denotes use by communities in the watershed
Charcoal X X
Fuelwood X X X
Bamboo (Bambusa sp.) including shoots
X X X
Wildflowers X
Mushroom (Agaricus bisporus) X
Fern X
Banana (Musa sp.) X X
Marang (Litsea cordata) X
Rambutan (Nephelium lappaceum) X
Bignay (Antidesma bunius) X
Duhat (Syrygium cumini) X
Mango (Mangifero indica) X
Sweet Potato (Ipomoea batatas) X X
Pineapple (Ananas comasus) X X
Santol (Sandoricum koetjape) X
Jackfruit (Artocorpus heterophyllus) X
46
45 In UMRBPL 135 persons representing the nine barangays found in the site participated in the FGDs. For UMAM four FGDs comprising a total of 58 participants from 12 barangays covering the three sub-basins were conducted. For LPW, four FGDs with 30 representatives from eight barangays were held.

Forest and Farm Products UMRBPL LPW UMAM
Citronella (Citronella sp.) X
Passion Fruit (Passiflora edulis) X
Lanzones (Lasium domesticum) X
Cassava (Manihot escukenta) X X
Peanut (Arachis hypogaea) X
Avocado (Persea gratissima) X
Corn (Zea mays) X X X
Honey X X
Wild chicken (Gallus gallus) X
Wild boar (Sus scrofa) X X
Monkey (Macaca fascicularis) X
Monitor Lizard (Varanus sp.) X
Phyton (Pythonidae sp.) X
Cogon (Imperata cylindrica) X
Coconut (Cocos nucifera) X
Rattan (Calamaea sp.) X X X
Nito (Lygodium flexuosum) X
Anahaw (Livistona rotundifolia) X
Buri leaves (Corypha utan) X
Tiger grass (Thysanolaena latifolia) X
Abaca (Musa textilis) X X
Rice (Oryza sativa) X X X
Rootcrops X X X
Wild orchids X
Nipa (Nypa fruticans) X
Medicinal herbs X
Bird's nest X
Fish X X X
Vegetables X X X
47
Libmanan-Pulantuna Watershed (LPW)
Forest resources and resources from cultivation within forests, which are used for cash income and subsistence by communities within the LPW, include rice, coconut sold as copra46, pineapples (Formosa or Queen varieties), bananas and other fruits, root crops (cassava and sweet potato), and vegetables. Cultivation of crops is done on private lands, and one or two crops are cultivated during the year depending on location of the farms and availability of water. Tiger grass, which is sourced from both secondary forest and cultivated lands and used in broom-making, is also sold for cash. LPW communities also sell abaca, timber (red and white lauan and mahogany), and wood products, which are sourced from state-owned secondary forests; and fish and nipa, which are sourced from mangrove areas.
Harvesting of trees is prohibited under Executive Order 23, but is still practiced by some farmers. Bamboo, rattan, and nito (a kind of vine) are used for furniture and handicraft, while anahaw and buri leaves (palms) are used for making mats. Local communities harvest forest products (rice, coconut, fruits, vegetables, and fish), which they sell to small-scale local commercial users. Pineapples and rice are sold to large-scale commercial users. Forest products used for subsistence are collected by the users themselves.
Based on the FGDs forest resources in the LPW are important for community groups in times of economic and weather shocks47 and associated food shortages. Charcoal/fuelwood, root crops like sweet potato and cassava, and bananas help communities cope with agricultural shocks. Root crops are especially vital because these are not easily destroyed by strong winds and rains. The products gathered from the forests are both for own use and sale.
Local community groups noted declines in the availability of forest products over the past five years. Fish catch for cash and subsistence generally decreased due to the increasing harvests of fish for sale and for own use/subsistence48. Water supply was also perceived to have decreased owing to reduced forest area and climate change. Reduced availability of forest resources is attributed to declines in forest extent caused by deforestation, which in turn is triggered by charcoal making and cultivation. In some areas, however, reforestation efforts have led to increases in forest cover.
Umayam, Minor and Agusan Marsh (UMAM) Sub-basins
Several forest resources (rice, corn, fruits, rattan, bamboo, and fish) contribute to some extent to the income of communities living in UMAM. Rattan is sourced from old-growth and secondary forests, and collected by
48
46 Copra is the dried kernel of the coconut used to extract coconut oil.
47 Economic shocks include fall in crop prices, large rise in food prices, and rise in agricultural input prices. Climate shocks include droughts/severe water shortage and floods, as well as crop diseases/pests and livestock loss.
48 Community groups noted that there are clear rules (de jure) governing fishing activities, enforced by local government units.
persons living within and outside of the watershed. Fish is caught mostly in the marsh areas and from rivers.
Cultivation of plots for agricultural purposes is done within the forests to grow fruits, rice, and corn; the latter two are also cultivated for subsistence. Other resources for subsistence/personal use are freshwater, fuelwood, root crops, and bananas. Water is harvested from streams flowing from old-growth and secondary or regenerating forests. Fuelwood is sourced from the forest and managed plantations, and collected by individuals within the watershed area. Rice, corn, and root crops come from cultivated land/agricultural areas within the forests. Food resources from the forests are considered especially important for both cash income and subsistence during economic and climate shocks, and are considered as a coping mechanism for communities in the watershed. Resources like root crops, fruits, nipa/ubod (palm heart), wild boar, wild vegetables, pangi/baay (medicines), and upland rice are sold and consumed by communities.
Timber resources also provide income for some communities in the UMAM, and are estimated to have high economic value. The net present value (NPV) of timber was used to estimate the value of the timber provisioning service. The major tree plantation species planted are falcata (Paraserianthes falcataria), gmelina (Gmelina arborea), mangium (Acacia mangium), rubber (Hevea brasiliensis), and fruit trees like durian (Durio zibethinus. The NPV of a 1 ha plantation of falcata at a discount rate of 15% and rotations of eight, nine, and 10 years are PHP 206,083 (US$ 4,140)/ha, PHP 198,320 (US$ 3,984)/ha and PHP 185,907 (US$ 3,735)/ha, with the eight-year rotation having the highest NPV. This means that tree farmers can harvest their tree plantations after eight years to maximize the NPV, and forego a waiting period of one or two more years. The annualized NPV of falcata at rotations of eight, nine, and 10 years was estimated to be PHP 45,926 (US$ 923)/ha/year, PHP 41,563 (US$ 835)/ha/year, and PHP 37,042 (US$ 744)/ha/year.
These values attest to the magnitude of the ecosystem service derived from the timber provisioning function of the forest, especially for Agusan del Sur. However, the wealth generated from the timber asset is not equitably distributed. Agusan del Sur is classified as a first-class province (with an average annual income of PHP 450 million [US$ 9 million] or more), while Agusan del Norte is a third-class province (with an average annual income of PHP 270 [US$ 5.4 million] million to PHP 360 million [US$ 7.2 million]). The municipalities of Agusan del Sur, which lie within the Middle Agusan Basin, suffer from high poverty levels (85% or higher), suggesting that the province’s income is not enjoyed by most of the households.
It is common for these households to have 1 or 2 ha planted to falcata. Theoretically, engaging in falcata plantation can provide a household an NPV of as much as PHP 206,083 (US$ 4,140)/ha, which can only be realized though at the end of the rotation. The demand for falcata, particularly in Butuan City and Cagayan do Oro City, where many of the wood-processing plants are located, is high. However, many of the tree farmers interviewed for the study admitted that they remain poor for at least two reasons: they usually resort to borrowing from middlemen to finance plantation
49

development and their personal or household needs; and they are burdened with high harvesting, transportation, and transaction costs. The length of time it takes falcata trees to mature is too long to be feasible for many families, as by the time of harvest, most of the income generated goes to the money lenders.
The availability of forest resources is faced with a number of challenges, including the practice of unsustainable levels of kaingin (swidden or slash and burn farming) for agricultural cultivation and expansion. Residents of the watershed said climate change impacts (in particular, decreased rainfall levels), small-scale timber extraction, and infrastructure development also contribute to a decline in forest area. Despite existing regulations on forest management and resource extraction, which community groups are aware of, enforcement of regulations is poor, which is similar to the situation in other forested parts of the Philippines.
Upper Marikina River Basin Protected Landscape (UMRBPL)
Forest resources in the UMRBPL – derived from state-owned forests49 — help boost the incomes of some of communities and are also used for human consumption.
Bamboo and wood for charcoal are harvested from secondary and regenerating forests by local residents, and are sold to commercial users outside of the UMRBPL. Although the harvesting of wood for charcoal production is illegal as a result of a moratorium on logging (EO 23), growing demand for charcoal from Metro Manila and surrounding areas has made charcoal production an attractive enterprise for communities in the UMRBPL. Sale of fruits such as bananas and pineapples, as well as rice in the towns surrounding the UMRBPL, boosts the income of UMRBPL residents. Cultivation of these crops, including vegetables and root crops used for subsistence, is undertaken on small agricultural plots (< 3 ha) within the forests of UMRB.
Water for domestic use is sourced from the Marikina River and its tributaries. Fuelwood — which is also used for domestic purposes — is collected by the local community from the forest and some from managed plantations in the UMRBPL. Forest resources are also vital to community groups during economic and climate shocks50 and associated food shortages.
50
49 The UMRB is a legally established protected area and is therefore state-owned and cannot be privately titled. There are, however, indigenous peoples (Dumagat-Remontado) with Certificate of Ancestral Domain Claim (CADC) as well as people’s organizations which were issued Community-Based Forest Management Agreement (CBFMA) and Protected Area Community-Based Resource Management Agreement (PACBRMA), and became Social Forestry beneficiaries. As such they are granted tenure and access to the forest/natural resources and enjoined them to participate in the National Greening Program and similar government initiatives.
50 Climate and economic shocks include drought, crop disease, fall in crop prices, large rise in food prices and severe illnesses.

A survey of a sample of the population of UMRBPL (n=103) using gender and wealth lens supports the FGD findings that poor upland communities have high dependence on forests for their livelihoods. Forest resources contribute both to cash income and meeting subsistence needs (see Figure 10). Respondents to the survey reported that upland communities in UMRBPL derive about 46% of their annual income from the sale of forest resources and farm products (see Table 8). The majority of income comes from the sale of farm produce. Income derived from the UMRBPL forests (7% of annual income) fell below the average forest income share of 22% revealed by a synthesis of Poverty Environment Network (PEN) studies51. On a per hectare basis the revenue generated from forest resources is sometimes low compared to alternative uses (e.g. vegetables), but that this is also related to a lack of support for revenue optimization in forest management.
The majority of the upland community derives cash income from the sale of fruits and other food resources from the forest. Bananas and vegetables were cited as the most economically important of these products. Other sources of cash income indicated by the sample population were charcoal, firewood, and bamboo (see Table 9).
Water, which is used mainly for domestic purposes and to some extent for irrigation, emerged as the most important subsistence benefit from the forest. The cost of purchasing water via water delivery trucks was deemed prohibitive by the vast majority of the UMRPBL population, of whom 88% lives below the national poverty line of PHP 109,680 (US$ 2,203). The replacement cost of the water provisioning service in the UMBRPL was estimated at PHP 20,875 (US$ 419) per household per year, which is almost half the protected area’s average annual household income of PHP 57,787 (US$ 1,161). Other subsistence benefits from the forest include food and fruits, wood for fuel and construction (see Table 8).
Results of analyses suggest that the use of forest resources for income and subsistence is more important to poorer households than to relatively wealthier ones. Results of statistical measures of association using Eta correlation and Spearman’s rank-order correlation are presented in Tables 10 and 11. Columns 1 and 3 in both tables show the results for the Eta correlation coefficient. Those for the Spearman’s rank-order correlation coefficient are presented in column 5; columns 2, 4, and 6 show the probability values.
Contributions to total annual income from charcoal production and sale of fruit and vegetables were found to be moderately associated with the household income status. This suggests that relatively wealthier households depend less on incomes generated from these sources compared to poorer ones. Use of herbal medicinal resources, and fruit and root crops for subsistence were also found to be moderately associated with the economic status of households. Relatively wealthier households rely less on these resources for subsistence than poorer households.
51
51 Angelsen 2014. Environmental Income and Rural Livelihoods: A Global Comparative Analysis.

Gender linkages were also explored in the survey, which showed no statistically significant associations between gender and forest resources and therefore indicated no significant difference between how males and females earn incomes from and use forest resources in the UMRBPL. However, male-dominated livelihoods in the UMRBPL emerged as major sources of household incomes from the forest, including private plantations, National Greening Program plantations, and pasturelands. Males are usually the owners and decision makers in these areas. Ownership and decision making over natural resources is often dominated by males. Relevant literature offers several reasons why this kind of situation seems prevalent52.
No specific female-dominated arenas related to forests were found in the UMRBPL. However, there are economic activities where men and women work together in complementary ways, an example of which is charcoal production. Men are usually in charge of harvesting the trees and making the charcoal, while women take on the task of packing the charcoal into sacks and facilitating the sale.
46%
54%
Cash Non-cash
Figure 10: Reported contribution to the average benefits of forests to cash income and meeting the subsistence (non-cash) needs of upland communities in UMRBPL
52
52 See Sunderland (2014).
Note on Figure 10: The participants were first divided by gender into male and female categories, and the gender categories further divided into relatively rich and poor categories based on self-reported income.

Source % of annual HH income
Sale of Forest Products 6.6%
Bamboo products 3.7%
Charcoal 1.7%
Fish 0.5%
Bush meat 0.3%
Honey 0.2%
Lumber 0.2%
Sale of Farm Produce 39.5%
Vegetables 13.4%
Banana 11.4%
Upland rice 5.4%
Fruit trees 4.3%
Root crops 2.9%
Corn 2.1%
Other sources of income 53.9%
Notes on Table 8: 1. The contribution of each of the sources to household (HH) income is not an actual contribution
but is based on a perceived relative contribution by a sample group of the UMRBPL population (n=103). See the background study on Forest Use Analysis (Gata 2016) for more information.
2. Other sources of income refer to income derived from activities not related to forestry or agriculture such as trade/vending, construction, driving, and providing security services.
Note on Table 9: The rank of importance was determined using a relative importance weighting exercise undertaken with key informants (n=103) in the UMRBPL.
53
Rank of importance For cash income Forest subsistence
1 Food & fruits Water for HH consumption
2 Charcoal Food and fruits
3 Firewood Firewood
4 Bamboo Materials for home construction
5 Wood Herbal medicine
6 Herbal medicine Charcoal
7 Bush meat Bush meat
8 Rattan
Table 9: Priority forest products/farm produce used to support income and used for subsistence by upland communities in the UMRBPL
Table 8: Components of annual household income in UMRBPL
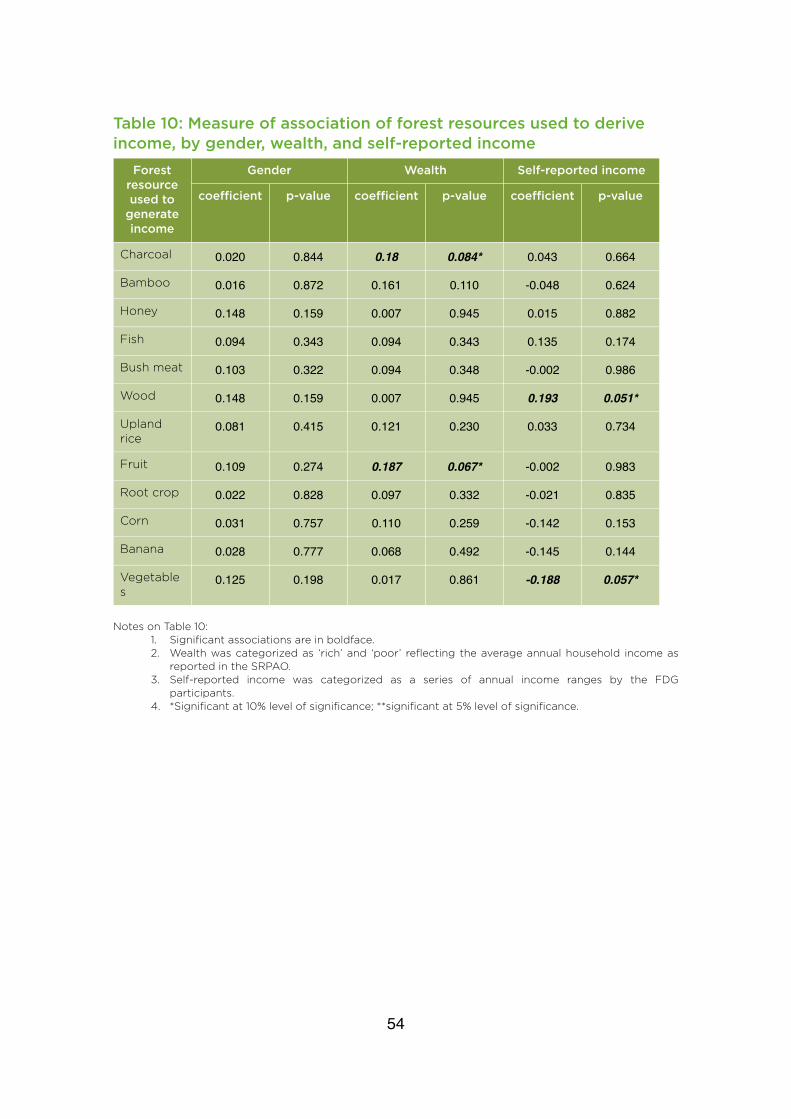
Table 10: Measure of association of forest resources used to derive income, by gender, wealth, and self-reported income
Forest resource used to
generate income
GenderGender WealthWealth Self-reported incomeSelf-reported incomeForest resource used to
generate income
coefficient p-value coefficient p-value coefficient p-value
Charcoal 0.020 0.844 0.18 0.084* 0.043 0.664
Bamboo 0.016 0.872 0.161 0.110 -0.048 0.624
Honey 0.148 0.159 0.007 0.945 0.015 0.882
Fish 0.094 0.343 0.094 0.343 0.135 0.174
Bush meat 0.103 0.322 0.094 0.348 -0.002 0.986
Wood 0.148 0.159 0.007 0.945 0.193 0.051*
Upland rice
0.081 0.415 0.121 0.230 0.033 0.734
Fruit 0.109 0.274 0.187 0.067* -0.002 0.983
Root crop 0.022 0.828 0.097 0.332 -0.021 0.835
Corn 0.031 0.757 0.110 0.259 -0.142 0.153
Banana 0.028 0.777 0.068 0.492 -0.145 0.144
Vegetables
0.125 0.198 0.017 0.861 -0.188 0.057*
Notes on Table 10:1. Significant associations are in boldface.2. Wealth was categorized as ‘rich’ and ‘poor’ reflecting the average annual household income as
reported in the SRPAO.3. Self-reported income was categorized as a series of annual income ranges by the FDG
participants. 4. *Significant at 10% level of significance; **significant at 5% level of significance.
54

Table 11: Measure of association of forest resources used for subsistence based on gender, wealth, and self-reported income
Forest resource used to
generate income
GenderGender WealthWealth Self-reported incomeSelf-reported incomeForest resource used to
generate income
coefficient p-value coefficient p-value coefficient p-value
Charcoal 0.019 0.853 0.103 0.301 0.109 0.272
Bamboo 0.158 0.110 0.119 0.231 0.003 0.974
Rattan 0.104 0.296 0.094 0.343 0.135 0.174
Honey 0.093 0.350 0.093 0.350 0.082 0.412
Ferns 0.003 0.978 0.160 0.107 0.126 0.206
Wild flower
0.122 0.219 0.065 0.515 -0.059 0.552
Herbal medicine
0.115 0.246 0.219 0.026** 0.059 0.552
Mushroom 0.003 0.973 0.060 0.545 -0.012 0.905
Fish 0.203 0.040** 0.100 0.317 -0.020 0.839
Bush meat 0.090 0.368 0.008 0.937 0.142 0.152
Water 0.038 0.700 0.007 0.942 0.109 0.273
Cogon 0.227 0.022** 0.070 0.482 0.142 0.155
Wood 0.183 0.064* 0.061 0.541 0.118 0.237
Upland rice
0.276 0.005** 0.123 0.218 -0.054 0.590
Fruit 0.106 0.288 0.068 0.493 0.251 0.011**
Root crop 0.154 0.120 0.074 0.460 0.166 0.093*
Corn 0.064 0.523 0.007 0.948 0.041 0.679
Banana 0.107 0.282 0.027 0.789 0.089 0.369
Vegetables 0.123 0.217 0.043 0.669 0.046 0.642
Notes on Table 11:1. Significant associations are in boldface.2. Wealth was categorized as ‘rich’ and ‘poor’ reflecting the average annual household income as
reported in the SRPAO.3. Self-reported income was categorized as a series of annual income ranges by the FGD
participants. 4. *Significant at 10% level of significance; **significant at 5% level of significance.
Community groups in the UMRBPL noted an increase in the availability of some forest resources from the UMRBPL over the past five years, and a decrease of others. Expansion of cultivated areas within the forests and increased use of agricultural inputs, better management of plantations for fuelwood, and less demand for forest resources from persons external to
55

UMRBPL have led to greater availability of fuelwood, and increased production of certain crops. Residents also observed that declining levels of soil fertility have contributed to declining yields from root crops. Water yields dropped during the summer period (dry season), which the residents linked to climate change and forest loss arising from deforestation to make way for swidden farming or kaingin.
The FGDs for this study also showed increased vigilance by authorities against illegal logging and kaingin in some areas of the UMRBPL, resulting in reduced charcoal production and rice cultivation. Security of tenure was highlighted as a major problem in the UMRBPL, but the extent to which this influences how forest resources are used by upland communities is not explored in this study. However, evidence in the literature indicates that lack of security of tenure coupled with perceived open access of the forest as a common resource can impact negatively on its use. Other challenges that have potential adverse impacts on how upland communities use forests for livelihood included illegal timber poaching and drought.
Table 12: Forest problems in UMRBPL ranked in descending order of priority
Rank Forest Problem Rank Forest Problem
1 Security of tenure/land titling 9 Fire in old dumpsites caused by biogas
2 Timber poaching 10 Climate change
3 Drought 11 Low quality of water in river
4 Deforestation 12 Illegal ranch
5 Exhaustive charcoal making 13 Storms
6 Vector-borne diseases 14 Unavailability of roads
7 Floods 15 Forest fire
8 Water shortage
Prospective Watershed Scenarios for UMRBPL
Descriptions of scenarios
The watershed scenarios developed for the UMRBPL for 2030, and dubbed ‘Ag-Use’, ‘Wise-Use’, ‘No-Use’, are consistent with the government’s trajectory to reduce the loss of forest and increase natural forest cover. This is based on the recognition that forests provide a number of benefits to the Filipinos. These scenarios build on the country’s major forest restoration programs that are either already underway or are on the government’s radar.
It is also acknowledged that forests help combat climate change through greenhouse gas mitigation, and play a role in achieving Nationally Determined Contributions (NDC), which the Paris Agreement on global
56

climate is anchored on. Moreover, it is believed that it is highly important for the country to increase its resilience to climate change impacts. The scenarios for 2030, and their underlying goals, were developed based on the 2015 baseline. For example, by 2030 under the ‘No-Use’ scenario, closed forest cover shall have expanded by 90% (a summary of the key changes under each scenario is described in Table 14.) An integral part of the scenarios is the projected timeline for realizing the target changes and their key drivers. Changes in ecosystem services under each scenario are described in Table 16. Additional background information about the upland communities of UMRBPL, and assumptions underlying the scenarios are concluded in Annex 7.
Note this study does not advocate any of these scenarios for landscape development. Instead, the scenarios help illustrate how ES data and information can be used together with socioeconomic information to better understand the impact of development on poor communities.Under the ‘Ag-Use’ scenario the UMRBPL shall be transformed into a mixed-use landscape by 2030. The landscape features a high proportion (49%) of closed forest relative to 2015 forest cover levels. These forests are situated in the no-use (strict protection) zones of the protected area such as in riparian zones, on slopes >50%, and on lands more than 1,000 meters above sea level. Commercialization of agriculture and the development of commodity value chains in the area are a characteristic here with the push of the government to make the UMRBPL an economically productive area to support the livelihoods of the upland communities. Accordingly, land that is not under closed forests will be devoted to perennial crops or annual crops. Woodlots that supply fuelwood, wood for charcoal, and construction materials are included in some of the perennial areas to meet the needs of upland communities.
The ‘Ag-Use’ scenario represents the closest to being a ‘business as usual’ scenario in 2030, which reflects the growth of the trees planted in phases under the National Greening Program during the period 2011-2016. It aligns with the no-use and mixed-use zones of the Upper Marikina Protected Area Management Plan (UMPAP) approved in 2011 (see map of zones in Annex 4). As the local government has enforced a no in-migration policy in the UMRBPL, the number of households in the area are projected to stay at about 3,370 between 2015 and 203053.
The ‘Wise-Use’ scenario prioritizes high forest cover in the UMRBPL while recognizing the importance of agriculture and forest resources in supporting livelihoods. Accordingly, the landscape features a high proportion of closed forest (72%), which overlaps with the strict-protection zones established in the UMPAMP. It also extends to the mixed-use zone established by the UMPAMP (see Table 13). Perennial crops have also expanded under this scenario relative to 2015 levels, while woodlots have been established to serve the needs of the upland communities. Guided by the enhanced National Integrated Protected Areas System (NIPAS), a decision was made to relocate
57
53 This assumes no natural population growth.

households classified by the 2013 SRPAO as ‘untenured’ out of the UMRBPL. These households comprised approximately 2,037 or 60% of the total households in the UMRBPL in 2015. As the local government has enforced a no in-migration policy in the UMRBPL, the number of households in the UMRBPL is projected to remain at about 1,333 between 2015 and 2030.
The ‘No-Use’ scenario prioritizes high forest cover in the UMRBPL. Accordingly, the landscape under this scenario features a high proportion of closed forest cover (92% of the land area), marked by strict protection measures and non-use of these forests (Table 13). Relocation of untenured households also occurs under this scenario.
Table 13: Land cover configuration for the “No Use”, “Wise Use”, and “Ag-Use” scenarios for the year 2030
Land Cover Category
Land cover (2015)
Land cover (2015) Ag-Use (2030)Ag-Use (2030) Wise Use (2030)Wise Use (2030) No Use (2030)No Use (2030)
Land Cover Category
Ha
% of total land
cover
Ha
% of total land
cover
Ha
% of total land
cover
Ha% of total
land cover
Closed forest 644 2 15,110 50 21,985 72 28,146 92
Open forest 5,790 19 0 0 0 0 0 0
Perennial crop 1,817 6 1,890 6 6,161 20 0 0
Annual crop 1,082 4 3,253 11 1,082 4 1,082 4
Wooded grasslandWooded grasslandWooded grasslandWooded grasslandWooded grasslandWooded grasslandWooded grasslandWooded grasslandWooded grassland
On slopes <8% 209 1 0 0 0 0 0 0
On slopes 8-50% 4,776 16 0 0 0 0 0 0
On slopes >50% 1,691 6 0 0 0 0 0 0
ShrubsShrubsShrubsShrubsShrubsShrubsShrubsShrubsShrubs
On slopes <8% 280 1 0 0 0 0 0 0
On slopes 8-50% 7,273 24 0 0 0 0 0 0
On slopes >50% 2,388 8 0 0 0 0 0 0
GrasslandGrasslandGrasslandGrasslandGrasslandGrasslandGrasslandGrasslandGrassland
On slopes <8% 350 1 0 0 0 0 0 0
On slopes 8-50% 2,347 8 0 0 0 0 0 0
On slopes >50% 471 2 0 0 0 0 0 0
Open-barren 109 0 0 0 0 0 0 0
Bamboo/rattan 0 0 432 1 0 0 0 0
Agroforestry 0 0 8543 28 0 0 0 0
Inland water 362 1 362 1 362 1 362 1
Built-up 934 3 934 3 934 3 934 3
Total 30,524 100 30,524 100 30,524 100 30,524 100
58

59
Tabl
e 14
: Key
dri
vers
of
chan
ge u
nder
eac
h sc
enar
io a
nd t
he s
tatu
s of
impl
emen
tati
on o
f th
e dr
iver
s
Key
cha
nge
Scen
ario
(X
sig
nifie
s ch
ange
s ap
ply
to s
cena
rio;
H
C, M
C, L
C in
dica
te
confi
denc
e le
vels
)
Scen
ario
(X
sig
nifie
s ch
ange
s ap
ply
to s
cena
rio;
H
C, M
C, L
C in
dica
te
confi
denc
e le
vels
)
Scen
ario
(X
sig
nifie
s ch
ange
s ap
ply
to s
cena
rio;
H
C, M
C, L
C in
dica
te
confi
denc
e le
vels
)
Ant
icip
ated
ti
mel
ine
Key
(po
licy)
dri
ver
of
chan
geSt
atus
of
polic
y in
20
16Sp
ecifi
c pr
ovis
ion
in t
he
polic
y m
enti
oned
in t
he
prev
ious
col
umns
Key
cha
nge
No-
use
Wis
e-U
seA
g-U
se
Ant
icip
ated
ti
mel
ine
Key
(po
licy)
dri
ver
of
chan
geSt
atus
of
polic
y in
20
16Sp
ecifi
c pr
ovis
ion
in t
he
polic
y m
enti
oned
in t
he
prev
ious
col
umns
Exp
ansi
on
of
clo
sed
fo
rest
co
ver
X HC
X HC
X MC
2026
Exe
cuti
ve O
rder
(E
O)
23, w
hich
dec
lare
d a
m
ora
tori
um o
n th
e cu
ttin
g a
nd h
arve
stin
g
of
tim
ber
co
ntin
ued
Und
er
imp
lem
enta
tio
n
A m
ora
tori
um o
n th
e cu
ttin
g
and
har
vest
ing
of
tim
ber
in t
he
natu
ral a
nd r
esid
ual f
ore
sts
of
the
coun
try
is h
ereb
y d
ecla
red
.
Exp
ansi
on
of
clo
sed
fo
rest
co
ver
X HC
X HC
X MC
2026
EO
193
Und
er
imp
lem
enta
tio
n
8.3
mill
ion
hect
ares
of
exis
ting
fo
rest
s p
rote
cted
, co
nser
ved
an
d s
usta
inab
ly m
anag
ed in
10
year
s
Exp
ansi
on
of
clo
sed
fo
rest
co
ver
X HC
X HC
X MC
2026
Phi
lipp
ine
Mas
ter
Pla
n fo
r C
limat
e R
esili
ent
Fo
rest
ry D
evel
op
men
t
Und
er
imp
lem
enta
tio
n
Est
ablis
hmen
t, m
aint
enan
ce,
and
ren
ewal
of
com
mer
cial
fo
rest
pla
ntat
ions
wit
hin
14
year
s
Exp
ansi
on
of
clo
sed
fo
rest
co
ver
X HC
X HC
X MC
2026
Nat
iona
l Fo
rest
P
rote
ctio
n P
rog
ram
U
nder
im
ple
men
tati
on
Stre
ngth
en p
rote
ctio
n m
echa
nism
of
the
coun
try'
s re
mai
ning
nat
ural
fo
rest
s

60
Key
cha
nge
Scen
ario
(X
sig
nifie
s ch
ange
s ap
ply
to s
cena
rio;
H
C, M
C, L
C in
dica
te
confi
denc
e le
vels
)
Scen
ario
(X
sig
nifie
s ch
ange
s ap
ply
to s
cena
rio;
H
C, M
C, L
C in
dica
te
confi
denc
e le
vels
)
Scen
ario
(X
sig
nifie
s ch
ange
s ap
ply
to s
cena
rio;
H
C, M
C, L
C in
dica
te
confi
denc
e le
vels
)
Ant
icip
ated
ti
mel
ine
Key
(po
licy)
dri
ver
of
chan
geSt
atus
of
polic
y in
20
16Sp
ecifi
c pr
ovis
ion
in t
he
polic
y m
enti
oned
in t
he
prev
ious
col
umns
Key
cha
nge
No-
use
Wis
e-U
seA
g-U
se
Ant
icip
ated
ti
mel
ine
Key
(po
licy)
dri
ver
of
chan
geSt
atus
of
polic
y in
20
16Sp
ecifi
c pr
ovis
ion
in t
he
polic
y m
enti
oned
in t
he
prev
ious
col
umns
Exp
ansi
on
of
per
enni
al/
agro
fore
stry
cr
op
s in
clud
ing
p
lant
atio
ns a
nd
wo
od
lots
fo
r fu
el
X HC
X HC
2022
Dep
artm
ent
Ad
min
istr
ativ
e O
rder
(D
AO
) 20
04
-32
Rev
ised
Pro
tect
ed A
reas
C
om
mun
ity-
Bas
ed R
eso
urce
M
anag
emen
t A
gre
emen
t (P
AC
BA
RM
A)
reg
ulat
ions
Und
er
imp
lem
enta
tio
n
PAC
BA
RM
A h
old
ers
wer
e g
iven
ex
clus
ive
rig
hts
in o
bta
inin
g a
p
erm
it t
o e
xtra
ct, u
tiliz
e, a
nd
dis
po
se o
f an
y al
low
ed N
TF
Ps/
F
Ps
in a
llow
able
zo
nes
Exp
ansi
on
of
per
enni
al/
agro
fore
stry
cr
op
s in
clud
ing
p
lant
atio
ns a
nd
wo
od
lots
fo
r fu
el
X HC
X HC
2022
Pre
sid
enti
al D
ecre
e (P
D)
705
Rev
ised
Fo
rest
ry C
od
e o
f th
e P
hilip
pin
es
Und
er
imp
lem
enta
tio
n
Est
ablis
hmen
t o
f m
ulti
ple
use
zo
nes
in t
he f
ore
stla
nds
whi
ch
will
pro
duc
e th
e o
pti
mum
b
enefi
ts t
o t
he d
evel
op
men
t an
d p
rog
ress
of
the
coun
try
and
the
pub
lic w
elfa
re, w
itho
ut
imp
airm
ent
or
wit
h th
e le
ast
inju
ry t
o it
s re
sour
ces
Exp
ansi
on
of
per
enni
al/
agro
fore
stry
cr
op
s in
clud
ing
p
lant
atio
ns a
nd
wo
od
lots
fo
r fu
el
X HC
X HC
2022
Phi
lipp
ine
Mas
ter
Pla
n fo
r C
limat
e R
esili
ent
Fo
rest
ry
Dev
elo
pm
ent
Und
er
imp
lem
enta
tio
n
Co
mm
erci
al f
ore
st p
lant
atio
n d
evel
op
men
t fo
r ro
und
wo
od
p
rod
ucti
on
fuel
wo
od
pla
ntat
ion
dev
elo
pm
ent
Exp
ansi
on
of
per
enni
al/
agro
fore
stry
cr
op
s in
clud
ing
p
lant
atio
ns a
nd
wo
od
lots
fo
r fu
el
X HC
X HC
2022
Fo
rest
Inve
stm
ent
Ro
adm
ap P
rop
ose
d f
or
2017
Est
ablis
hed
pla
ntat
ions
su
pp
lyin
g r
aw m
ater
ial
req
uire
men
t o
f th
e fo
rest
bas
ed
ind
ustr
y
Exp
ansi
on
of
per
enni
al/
agro
fore
stry
cr
op
s in
clud
ing
p
lant
atio
ns a
nd
wo
od
lots
fo
r fu
el
X HC
X HC
2022
Enh
ance
d N
GP
(eN
GP
) co
mm
od
ity
road
map
P
rop
ose
d f
or
2017
Incl
usio
n o
f ca
cao,
rub
ber
, co
ffee
, bam
bo
o, r
atta
n an
d f
ruit
bea
ring
tre
es a
s re
fore
stat
ion
spec
ies
Exp
ansi
on
of
per
enni
al/
agro
fore
stry
cr
op
s in
clud
ing
p
lant
atio
ns a
nd
wo
od
lots
fo
r fu
el
X HC
X HC
2022
Pro
vinc
ial C
om
mo
dit
ies
Inve
stm
ent
Pla
n fo
r R
izal
U
ncer
tain
Unc
erta
in

61
Key
cha
nge
Scen
ario
(X
sig
nifie
s ch
ange
s ap
ply
to s
cena
rio;
HC
, MC
, LC
in
dica
te c
onfid
ence
leve
ls)
Scen
ario
(X
sig
nifie
s ch
ange
s ap
ply
to s
cena
rio;
HC
, MC
, LC
in
dica
te c
onfid
ence
leve
ls)
Scen
ario
(X
sig
nifie
s ch
ange
s ap
ply
to s
cena
rio;
HC
, MC
, LC
in
dica
te c
onfid
ence
leve
ls)
Ant
icip
ated
ti
mel
ine
Key
(po
licy)
dri
ver
of c
hang
eSt
atus
of
polic
y in
20
16
Spec
ific
prov
isio
n in
the
pol
icy
men
tion
ed in
the
pre
viou
s co
lum
nsK
ey c
hang
e
No-
use
Wis
e-U
seA
g-U
se
Ant
icip
ated
ti
mel
ine
Key
(po
licy)
dri
ver
of c
hang
eSt
atus
of
polic
y in
20
16
Spec
ific
prov
isio
n in
the
pol
icy
men
tion
ed in
the
pre
viou
s co
lum
ns
Exp
ansi
on
of
annu
al c
rop
sX HC
2022
DA
O 2
00
4-3
2 R
evis
ed
PAC
BA
RM
A r
egul
atio
ns
Und
er
imp
lem
enta
tio
n
Uti
lize,
ext
ract
, and
dev
elo
p a
llow
able
zo
nes
bas
ed o
n th
e P
rote
cted
Are
a M
anag
emen
t P
lan
Exp
ansi
on
of
annu
al c
rop
sX HC
2022
Pro
vinc
ial C
om
mo
dit
ies
Inve
stm
ent
Pla
n fo
r R
izal
U
ncer
tain
Unc
erta
in
Exp
ansi
on
of
annu
al c
rop
sX HC
2022
10-p
oin
t S
oci
o-e
cono
mic
Ag
end
a #
5 "p
rom
ote
rur
al a
nd v
alue
cha
in
dev
elo
pm
ent
tow
ard
incr
easi
ng
agri
cult
ural
and
rur
al e
nter
pri
se
pro
duc
tivi
ty a
nd r
ural
to
uris
m
No
t ye
t p
lann
ed
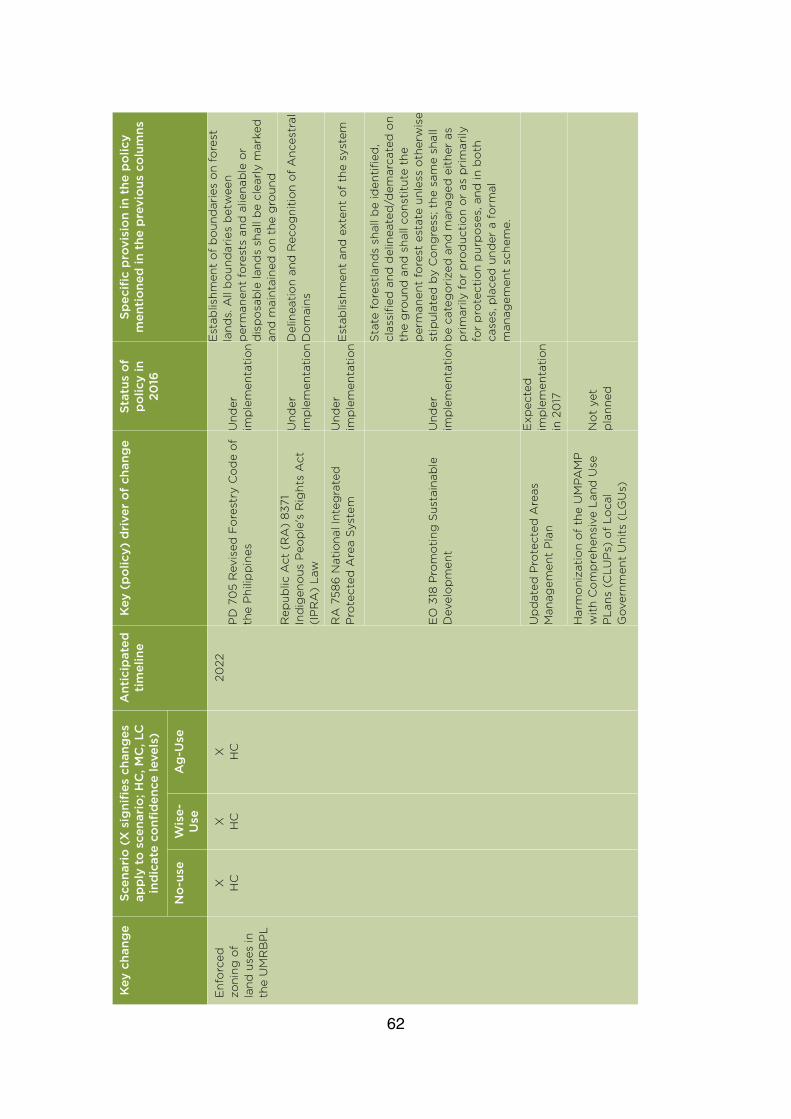
62
Key
cha
nge
Scen
ario
(X
sig
nifie
s ch
ange
s ap
ply
to s
cena
rio;
HC
, MC
, LC
in
dica
te c
onfid
ence
leve
ls)
Scen
ario
(X
sig
nifie
s ch
ange
s ap
ply
to s
cena
rio;
HC
, MC
, LC
in
dica
te c
onfid
ence
leve
ls)
Scen
ario
(X
sig
nifie
s ch
ange
s ap
ply
to s
cena
rio;
HC
, MC
, LC
in
dica
te c
onfid
ence
leve
ls)
Ant
icip
ated
ti
mel
ine
Key
(po
licy)
dri
ver
of c
hang
eSt
atus
of
polic
y in
20
16
Spec
ific
prov
isio
n in
the
pol
icy
men
tion
ed in
the
pre
viou
s co
lum
nsK
ey c
hang
e
No-
use
Wis
e-U
seA
g-U
se
Ant
icip
ated
ti
mel
ine
Key
(po
licy)
dri
ver
of c
hang
eSt
atus
of
polic
y in
20
16
Spec
ific
prov
isio
n in
the
pol
icy
men
tion
ed in
the
pre
viou
s co
lum
ns
Enf
orc
ed
zoni
ng o
f la
nd u
ses
in
the
UM
RB
PL
X HC
X HC
X HC
2022
PD
70
5 R
evis
ed F
ore
stry
Co
de
of
the
Phi
lipp
ines
U
nder
im
ple
men
tati
on
Est
ablis
hmen
t o
f b
oun
dar
ies
on
fore
st
land
s. A
ll b
oun
dar
ies
bet
wee
n p
erm
anen
t fo
rest
s an
d a
liena
ble
or
dis
po
sab
le la
nds
shal
l be
clea
rly
mar
ked
an
d m
aint
aine
d o
n th
e g
roun
d
Enf
orc
ed
zoni
ng o
f la
nd u
ses
in
the
UM
RB
PL
X HC
X HC
X HC
2022
Rep
ublic
Act
(R
A)
8371
In
dig
eno
us P
eop
le's
Rig
hts
Act
(I
PR
A)
Law
Und
er
imp
lem
enta
tio
nD
elin
eati
on
and
Rec
og
niti
on
of
Anc
estr
al
Do
mai
ns
Enf
orc
ed
zoni
ng o
f la
nd u
ses
in
the
UM
RB
PL
X HC
X HC
X HC
2022
RA
758
6 N
atio
nal I
nteg
rate
d
Pro
tect
ed A
rea
Syst
em
Und
er
imp
lem
enta
tio
nE
stab
lishm
ent
and
ext
ent
of
the
syst
em
Enf
orc
ed
zoni
ng o
f la
nd u
ses
in
the
UM
RB
PL
X HC
X HC
X HC
2022
EO
318
Pro
mo
ting
Sus
tain
able
D
evel
op
men
t U
nder
im
ple
men
tati
on
Stat
e fo
rest
land
s sh
all b
e id
enti
fied
, cl
assi
fied
and
del
inea
ted
/dem
arca
ted
on
the
gro
und
and
sha
ll co
nsti
tute
the
p
erm
anen
t fo
rest
est
ate
unle
ss o
ther
wis
e st
ipul
ated
by
Co
ngre
ss; t
he s
ame
shal
l b
e ca
teg
ori
zed
and
man
aged
eit
her
as
pri
mar
ily f
or
pro
duc
tio
n o
r as
pri
mar
ily
for
pro
tect
ion
pur
po
ses,
and
in b
oth
ca
ses,
pla
ced
und
er a
fo
rmal
m
anag
emen
t sc
hem
e.
Enf
orc
ed
zoni
ng o
f la
nd u
ses
in
the
UM
RB
PL
X HC
X HC
X HC
2022
Up
dat
ed P
rote
cted
Are
as
Man
agem
ent
Pla
n
Exp
ecte
d
imp
lem
enta
tio
n in
20
17
Enf
orc
ed
zoni
ng o
f la
nd u
ses
in
the
UM
RB
PL
X HC
X HC
X HC
2022
Har
mo
niza
tio
n o
f th
e U
MPA
MP
w
ith
Co
mp
rehe
nsiv
e La
nd U
se
PLa
ns (
CLU
Ps)
of
Loca
l G
over
nmen
t U
nits
(LG
Us)
No
t ye
t p
lann
ed

63
Key
cha
nge
Scen
ario
(X
sig
nifie
s ch
ange
s ap
ply
to s
cena
rio;
H
C, M
C, L
C in
dica
te
confi
denc
e le
vels
)
Scen
ario
(X
sig
nifie
s ch
ange
s ap
ply
to s
cena
rio;
H
C, M
C, L
C in
dica
te
confi
denc
e le
vels
)
Scen
ario
(X
sig
nifie
s ch
ange
s ap
ply
to s
cena
rio;
H
C, M
C, L
C in
dica
te
confi
denc
e le
vels
)
Ant
icip
ated
ti
mel
ine
Key
(po
licy)
dri
ver
of
chan
geSt
atus
of
polic
y in
20
16Sp
ecifi
c pr
ovis
ion
in t
he
polic
y m
enti
oned
in t
he
prev
ious
col
umns
Key
cha
nge
No-
use
Wis
e-U
seA
g-U
se
Ant
icip
ated
ti
mel
ine
Key
(po
licy)
dri
ver
of
chan
geSt
atus
of
polic
y in
20
16Sp
ecifi
c pr
ovis
ion
in t
he
polic
y m
enti
oned
in t
he
prev
ious
col
umns
Rel
oca
tio
n o
f un
tenu
red
o
ccup
ants
out
of
the
UM
RB
PL
X HC
X HC
2026
PD
70
5 R
evis
ed
Fo
rest
ry C
od
e o
f th
e P
hilip
pin
es
Und
er
imp
lem
enta
tio
n
Kai
ngin
ero
s o
r sw
iden
far
mer
s,
squa
tter
s, c
ultu
ral m
ino
riti
es,
and
oth
er o
ccup
ants
and
re
sid
ents
in f
ore
st la
nds.
No
p
erso
n sh
all e
nter
into
fo
rest
la
nds
and
cul
tiva
te t
he s
ame
wit
hout
leas
e o
r p
erm
it.
Rel
oca
tio
n o
f un
tenu
red
o
ccup
ants
out
of
the
UM
RB
PL
X HC
X HC
2026
Enh
ance
d N
IPA
S L
aw
Pro
po
sed
rev
isio
n ov
er 2
017
to
20
19
Imp
rove
d
land
scap
e m
anag
emen
t in
th
e U
MR
BP
L
X HC
X HC
X HC
2026
Ris
k R
esili
ency
and
S
usta
inab
ility
Pro
gra
m
(RR
SP
)
Pro
po
sed
im
ple
men
tati
on
for
2017
Pro
vid
e an
op
erat
iona
l fr
amew
ork
to
imp
rove
the
re
spo
nse
to c
limat
e ri
sks
thro
ugh
bet
ter
adap
ted
and
m
ore
res
ilien
t ec
osy
stem
s,
infr
astr
uctu
re, a
nd li
velih
oo
d in
vu
lner
able
are
as a
cro
ss
Phi
lipp
ine
land
scap
e
Imp
rove
d
land
scap
e m
anag
emen
t in
th
e U
MR
BP
L
X HC
X HC
X HC
2026
Inst
itut
iona
l cap
acit
y b
uild
ing
of
Pro
tect
ed
Are
a M
anag
emen
t B
oar
d (
PAM
B)
and
LG
Us
Und
er
imp
lem
enta
tio
n
No
te o
n Ta
ble
14:
The
confi
den
ce l
evel
tha
t th
e ke
y ch
ang
e w
ill h
app
en i
n a
spec
ific
scen
ario
is
ind
icat
ed
by a
ny o
ne t
he
follo
win
g:
HC
— H
igh
confi
den
ce; M
C —
Med
ium
co
nfid
ence
; LC
— L
ow c
onfi
den
ce

64
Ecos
yste
m S
ervi
ce
Indi
cato
rSc
enar
ioSc
enar
ioSc
enar
ioSc
enar
ioD
iffer
ence
fro
m b
asel
ine
Diff
eren
ce f
rom
bas
elin
eD
iffer
ence
fro
m b
asel
ine
Ecos
yste
m S
ervi
ce
Indi
cato
rB
asel
ine
(20
15)
No
Use
Wis
e U
seA
g-U
seN
o U
seW
ise
Use
Ag-
Use
Ave
rag
e st
ream
flow
ra
te d
urin
g t
hree
d
ries
t m
ont
hs o
f th
e ye
ar (
m3 /
s)
3.4
84
.01
3.87
3.61
0.5
30
.39
0.13
Ave
rag
e d
aily
wat
er
volu
me
in t
hree
dri
est
mo
nths
of
the
year
(m
3 /d
ay)
300
,99
834
6,13
633
4,2
7131
2,26
74
5,13
833
,273
11,2
69
Pro
po
rtio
n o
f ti
me
whe
re fl
ows
are
abov
e th
e 80
%
dep
end
able
flow
rat
io
(DF
R)
(%)
46
.16
056
.650
.4
13.9
10.5
4.3
0
Ave
rag
e an
nual
p
ote
ntia
l ero
sio
n (t
ons
/yr)
1,00
7,57
23,
388
43,
185
56,8
68
-1,0
04
,184
-96
4,3
87-9
50,7
04
Ave
rag
e an
nual
se
dim
ent
flow
s (t
ons
/yr
)
251,8
9384
710
,79
614
,217
-251
,04
6-2
41,0
97-2
37,6
76
Avo
ided
flo
od
wat
er
(m3 )
128,
66
6,6
96
159,
694
,96
815
0,2
72,8
94
132,
058
,80
031
,028
,272
21,6
06
,198
3,39
2,10
4
Car
bo
n se
que
stra
tio
n (t
ons
CO
2/yr
)47
,125
128,
851
350
,110
no
dat
a81
,726
302,
985
-47,
125
Tabl
e 15
: Com
pari
son
of e
stim
ated
eco
syst
em s
ervi
ce in
dica
tor
valu
es u
nder
thr
ee la
nd c
over
sce
nari
os a
nd
the
base
line
(20
15)
land
cov
er

Note on Table 15:Although the scenarios ‘No Use’, ‘Wise Use’, and Ag-Use are discussed in the context of 2030, the ecosystem service values were modeled using data from the 2002-2012 datasets. And while rainfall and temperature estimations for 2050 were available from PAGASA, there was greater confidence in the use of observed values for undertaking the modeling. Comparison of ecosystem services under the different scenarios and the baseline was therefore possible. Differences in ecosystem service were thus influenced by the land cover (amount and spatial arrangement in the model). Caution should be applied, however, in the use of these results as changes in vegetation cover often result in localized climatic changes that could influence ecosystem system service provision.
Scenarios and trade-off analyses: inputs for landscape and forest use planning
It is well worth noting that scenarios are not predictions but rather are plausible or desired futures, and are therefore useful for building discussions on what it takes to achieve different types of development. Achieving forest increases under all of the scenarios will require resources for seedlings, labor, and fertilizers. Already some of these inputs are provided under the NGP program, but these are unlikely to see large increases in forest cover (e.g., 90% within 15 years).
This study did not analyze the investment needs for increasing the stock of closed forests, the costs of which should be factored into planning. A number of policy drivers included in the scenarios, such as the harmonization of the Comprehensive Upper Marikina River Basin Protected Landscape Management Plan with the Comprehensive Land Use Plan of LGUs and the implementation of the forest commodity roadmap, are not yet implemented but are likely to be important to achieving the scenarios.Decision makers will need to consider how these will be implemented.
Two options for untenured migrants in UMRBPL are explored alongside the impacts on these migrants under the different scenarios, and present a useful entry point for discussion among decision makers in the UMRBPL on how the issue of untenured persons in protected areas could be addressed. The scenarios do not include all the variables that can influence the desired changes, and therefore they necessarily present some uncertainty.
The value added of a scenarios approach to tradeoff analysis can be appreciated in terms of how the scenarios exercise can simultaneously consider major intended outcomes of landscape management and incorporate these in the planning. For UMRBPL, the GoP has three concerns which could be addressed using the scenarios approach to landscape planning: (1) reducing downstream flooding; (2) increasing seasonal water yield; (3) and improving the income-base and livelihoods of upland communities in UMRBPL. All of the scenarios present increasing levels of forest cover.
Consistent with the findings presented in chapter three, the regulating services are assumed to increase and thereby contribute to reduction in downstream flooding and improving seasonal water yield relative to the 2015 land cover. However, when considering the impact on income and livelihoods
65

of upland communities, the ‘Ag-Use’ scenario presented the best option in terms of potentially addressing these concerns (see tradeoff matrix in Table 16).
In the Ag-Use scenario, regulating ES provision has increased compared to the baseline, which translates into higher potential benefits for users of these services. Consider the following: streamflow (9% increase in the number of days with dependable flows during the dry season), sediment regulation (96% reduction in sediment outflow from the watershed), and avoided floodwater (3% increase in avoided floodwater). These indicators suggest that in terms of reducing downstream flooding and improving season water yield, the Ag-Use landscape scenario is an improvement over the baseline landscape.
There could be larger gains in the regulating ecosystem service provision under the ‘No-Use’ and ‘Wise-Use’ scenarios. For example, under the former there is a 30% increase in the number of days with dependable flows during the dry season relative to the baseline, and 24% increase in avoided potential floodwater relative to the baseline. The latter posts a 23% increase in the number of days with dependable flows during the dry season relative to the baseline, and a 17% rise in avoided floodwater relative to the baseline.
However, the ‘Ag-Use’ scenario presents a more positive outlook for the livelihoods of upland communities than the ‘No-Use’ and ‘Wise-Use’ scenarios (Table 16). There is a major positive tradeoff in terms of increasing potential income from agriculture. This scenario also presents an option for ensuring that untenured occupants could be accommodated as part of the landscape development, and that their income streams could be sustained and/or improved after forest development. By establishing woodlots and perennial tree farms (e.g., fruit orchards), agricultural production and income can be increased in the UMRBPL. Higher incomes may also be possible from increased charcoal production with a sustainable supply of wood from these woodlots.
Landscape planners and managers are therefore presented with options on how the landscape could be designed in order to optimize the delivery of services. The modeling results suggest that by increasing closed forest cover, the provision of the regulating ecosystem services is likely to increase. There is a tradeoff, however, in increasing closed forest extent on agroforestry and perennial land covers, which contribute to the agricultural and NTFP incomes of the upland communities. A land cover configuration for optimization may therefore be a combination of the ‘Wise-Use’ and ‘Ag-Use’ scenarios. Arriving at such an optimization decision could be facilitated if there are clear targets for ecosystem services provision from a landscape.
The added-value of ecosystem service-based spatial scenarios is the facilitation of modeling exercises that could provide quantitative information on how land cover can affect ecosystem service provision. The ‘Ag-Use’ scenario has included a number of land cover changes such as the establishment of woodlots for fuelwood, orchards of fruit trees, no-harvest zones, areas for harvesting of bamboo, rattans, etc. The modeling can assist
66

in the spatial siting of these introduced land covers within the watershed by allowing landscape planners to apply criteria for land cover, and to test the impact of these criteria. An important criteria that was not considered in the modeling for this study is the location of people. Access to woodlots and plantations will be an important consideration as well in the planning.
Table 16: Summary tradeoff matrix for the gains and losses faced by the upland poor communities in the UMRBPL under different scenarios
Ecosystem Service
No Use Wise Use Ag-UseEcosystem Service
Winners and Losers Winners and Losers Winners and Losers
Water yield and regulation
Winners: Approximately 1,333 tenured HHs are expected to benefit from the water regulation service under this scenario.
Winners: Approximately 1,333 HHs are expected to benefit from the water regulation service under this scenario.
Winner: Approximately 3,370 HHs are expected to benefit from the water regulation service under this scenario.
Flood regulation Winners: Benefits of improved flood regulation under this scenario are likely to be felt by the 1,333 tenured HHs in the UMRBPL, as well as by poor communities residing along the Marikina River.
Winners: Benefits of improved flood regulation under this scenario are likely to be felt by the 1,333 tenured HHs in the UMRBPL, as well as by poor communities residing along the Marikina River.
Winners: Benefits of improved flood regulation under this scenario are likely to be felt by the 3,370 HHs in the UMRBPL, as well as by poor communities residing along the Marikina River.
Erosion and sediment control
Winners: Reduced water treatment cost for 1,333 tenured HHs as water quality in the Santo Niño and Marikina Rivers is improved relative to the baseline levels.
Winners: Reduced water treatment cost for 1,333 tenured HHs as water quality in the Santo Niño and Marikina Rivers is improved relative to the baseline levels.
Winners: Reduced water treatment cost for 3,370 tenured HHs as water quality in the Santo Niño and Marikina Rivers is improved relative to the baseline levels.
Carbon sequestration
Winners: Potential income from carbon trading (PHP 64.5 to PHP 187.7 million) for approximately 1,333 tenured HHs.
Winners: Potential income from carbon trading (PHP 175 to PHP 509 million) for approximately for approximately 1,333 tenured HHs.
67

Ecosystem Service
No Use Wise Use Ag-UseEcosystem Service
Winners and Losers Winners and Losers Winners and Losers
Fuelwood/ Charcoal
Losers: Foregone contribution to annual HH income between PHP 8,000 and PHP 36,000 for the 3,370 untenured HHs that are relocated from UMRBPL. Forest resources for fuelwood/charcoal used for subsistence may now have to be purchased, thereby increasing HH expenditure.
Winners: Reduced negative health impacts of charcoal production on HHs. Increased charcoal production using wood from woodlots.
Losers: Foregone contribution to annual HH income between PHP 8,000 and PHP 36,000 for the 2,037 untenured HHs that are relocated from UMRBPL. Forest resources for fuelwood/ charcoal used for subsistence may now have to be purchased, thereby increasing HH expenditure.
Winners: Reduced negative health impacts in charcoal production. Increased charcoal production using wood from woodlots.
Food Losers: As much as PHP 22,884 or 39.6% of annual HH income could be foregone for 3,370 HHs without access to food resources from forest and cultivation on forest lands. Food accessed from the forest for subsistence may now have to be purchased, thereby increasing HH expenditure.
Winners: Increased irrigation could lead to higher yields in the summer months for 1,333 tenured HHs.
Losers: 2,037 untenured HHs can lose 39.6% of annual HH income without access to food resources from forest and cultivation on forestlands.
Winners: Increased irrigation could lead to higher yields in the summer months. HH income from improved agricultural production could increase from PHP 54,316 to PHP 258,163 per year. These benefits accrue to the 3,370 HHs.
68

Ecosystem Service
No Use Wise Use Ag-UseEcosystem Service
Winners and Losers Winners and Losers Winners and Losers
NTFPs Losers: For 3,370 HHs in UMRBPL approximately PHP 2,832 or 5% of annual HH income could be foregone without access to forest for NTFPs. NTFPs accessed from the forest for subsistence may now have to be purchased, thereby increasing HH expenditure.
Winners: NTFP production may increase due to increase in extent of agroforestry, and provide additional incomes to 3,370 HHs.
Losers: For 2,037 untenured HHs in UMRBPL approximately PHP 2,832 or 5% of annual HH income could be foregone without access to forest for NTFPs.
Winners: NTFP production may increase due to increase in extent of agroforestry, and provide additional incomes to 3,370 HHs.
69

70

5 | The Way Forward
Forest ecosystem services can contribute to development by preventing or reducing poverty, especially among rural households with high forest-related income dependency. Managing landscapes to improve forest resource management and enhance the ecosystem services derived from them requires not only increasing forest stocks but also carefully considering how forests are used by forest-dependent communities to support their incomes and livelihoods.
The study results show that maintaining forests in the landscape can contribute to enhancing resilience by providing important ecosystem services, and therefore should be considered alongside built infrastructure as part of the Philippines’ resilience strategy. This entails the ability to measure the contributions of forests to resilience and adaptation. The scenario and tradeoff analyses showed that a mixed land use, for example, under the Ag-Use scenario provides ecosystem service benefits, for which forest-dwelling and forest-dependent communities are beneficiaries. Therefore access to the forest is important in forest management. The scenario results also show that trees outside of the forest, such as those on farms, help provide ecosystem services that could yield resilience as well as income and livelihood benefits, and the importance of tree farms should therefore also be considered as the DENR considers forest planning for ecosystem services.
In the context of the results of the study, three recommendations are provided for how ecosystem service approaches can be used in forest land use planning in the Philippines. The report concludes with some key considerations for the “way forward” for landscape planning and forest management that can achieve a landscape where forests help enhance resilience, support incomes, and provide livelihood benefits. These points on the way forward were not derived directly from the study, but are nonetheless important in the context of this study.
Recommendations
Recommendation 1: Incorporate ecosystem service modeling and valuation, forest use analysis and scenarios in forest land use planning (FLUP) and forest management. A practical application of these tools is the targeting of areas for the establishment of tree plantations, agroforestry, and enrichment planting of protected areas. The National Greening Program (NGP) planning framework does not currently consider ecosystem services, and this could be an entry point in forest management planning and could be especially significant in justifying zoning within landscapes.
The value added of this study for the FLUP and the NGP lies in creating a better understanding of the value of the forest and forestland assets and ecological services. Such understanding can help inform the revision of prices for permits for forest resources, including for water extraction. The same
71

tools cited above can add value to the FLUP process by creating different landscape options (scenarios) and quantifying the impacts of these options on ecosystem service provision and tradeoffs on people, thus providing FLUP decision makers with a more informed basis for planning.
Recommendation 2: Use ecosystem service indicators for monitoring the performance of FLUPs and assessing the outcome of the NGP. Establishing ecosystem service targets could enhance the monitoring of the impact of forest development on erosion reduction, landslide reduction, and water provisioning – all of which the NGP supports. Indicators can be selected from among those utilized in this study. These include “total water yield (m3/ha/yr.), avoided soil eroded (t/ ha/ yr.), and proportion of the dry season when daily water flow rate equaled or exceeded 80% dependable flow rate”. Monitoring some of these indicators involves the development of hydrological models, and the collection of baseline and historical data for calibrating and validating models. Indicator data can also be instrumental in the design and implementation of payment for ecosystem service (PES) schemes, as an additional financing mechanism for upland and rural communities.
Recommendation 3: Incorporate the Forest-Poverty Linkages toolkit for deepening analysis and undertaking site specific analysis of how forest dwelling communities use the forest. Forest use analysis can be used to deepen the knowledge on how people use and access the forest with qualitative and quantitative site specific data, so that appropriate forest types can be developed and livelihood activities could be appropriately sited. Incorporating tools from the PROFOR Forests and Poverty Linkages Toolkit into the protected areas survey could be useful for deepening understanding of the socio-economic conditions of the local communities. This in turn could enhance the crafting of policies and programs that address poverty and conservation of natural resources.
The Way Forward
Increase the income derived from forest resources especially for poor upland communities. The study results show that upland communities depend significantly on forest resources to support incomes. However, it is unlikely that current incomes from forests are sufficient to help forest communities accumulate assets that can help lift them out of poverty. Options for improving the livelihoods of poor upland communities should consider improving forest resources and adding economic value to forest resources. The DENR is already moving along this path with the development of the Forestry Investment Roadmap, which seeks to prioritize and determine options for increasing investments in forests, including through value addition of forest products. The valuation results from this study can help build the attractiveness of forests for investors. Options for increasing the value of forest resources are as follows:
1. Increasing the value of forest resources (NTFPs, fruits, and other forest foods) by transforming these products through value addition,
72

thus making non-timber forests an asset for poverty reduction. The vehicle for doing this will likely be the Philippine Rural Development Program (PRDP) under which the Provincial Commodity Investment Plan (PCIP) prioritizes commodities for investment at the provincial level. For example, pineapple, mango, and banana are priority commodities for Rizal Province under the PRDP, and can be integrated into the farming systems of upland farmers.
Efforts must also be geared toward increasing agricultural productivity by (1) training of upland farmers in sustainable hillside farm practices; (2) improving use of inputs to increase yields; (3) promoting climate-smart agriculture; and (4) increasing extension support to upland farmers. Considerable work has been done by the DENR, supported by development partners on agroforestry systems. At the same time there is a good understanding of the challenges in promoting and developing economically viable agroforestry systems; see for example Fortenbacher and Alave (2014). Among these challenges are the lack of extension support for agroforestry and the lack of awareness of agroforestry as an economic enterprise. The involvement of the Department of Agriculture and agricultural extension through the local government units in improving the agricultural systems of upland farmers is critical in this undertaking. It behooves the DA and the DENR to would work together in the upland areas.
2. Developing community-managed woodlots and plantations that can facilitate the legal harvesting of wood for household consumption to meet energy needs, and provide a sustainable supply of wood for income-generating activities. Efforts linked to charcoal making should include the expansion of cleaner charcoal production practices introduced by the Asian Development Bank and Climate Change Commission to help reduce the impacts of charcoal production on health and the environment.
3. Creating a market for forest services. Examples of ecosystem service markets that could be feasible in UMRB and other parts of the Philippines are payment schemes for (i) watershed service such as water yield, water flow regulation, and avoided flooding; and (ii) carbon sequestration from trees. The modeling results showed substantive increases in water yield and sediment regulation under increased forest cover scenarios, and these can be a basis for initiating discussions with potential buyers of services, including water concessionaires. As there is yet no law in the Philippines supporting ecosystem service markets. Crafting such legislation will provide a legal underpinning for the PES that will help define roles and responsibilities, monitoring, and cost and payment norms.
4. Support from the Department of Agriculture (DA) and Department of Agrarian Reform (DAR) would be critical for commercialization and value addition of forest commodities. DA has programs for commodity investment such as the Provincial Commodity Investment Plans (PCIP) under the Philippine Rural Development Program (PRDP), which
73

should be aligned with the DENR’s proposal for investment in upland areas or protected landscapes. Convergence of the efforts of the two departments will support the alignment of these plans. There is an ongoing initiative for convergence of DENR, DAR, and DA, which, while occuring at the national level, requires more support at the provincial level.
Develop a research agenda for forest ecosystem services. Development of a research agenda for forest ecosystem services (FES) may be a useful start to institutionalizing and formulating a coordinated effort for data collection, data sharing and analysis. The Ecosystems Research and Development Bureau of the DENR could be a strategic clearinghouse for FES information that can be used to support planning and decision-making on forest and landscapes, and as well can provide a foundation for natural capital accounting. The following steps are suggested for developing the research agenda: (i) undertake stakeholder identification of agencies and institutions at national and regional levels that have the potential to generate or use FES data and information; (ii) undertake needs analysis with stakeholders to understand the different types of landscape management questions that decision makers need to answer; (iii) identify the agencies/ institutions with a mandate for ecosystems data collection, and determine the data and information that could be collected, analyzed and disseminated by the different agencies; (iv) develop a memorandum of understanding (where this does not already exist) between agencies and institutions for data and information sharing, and for sharing of resources; and (v) regular update of the research agenda.
74
6 | References
Agrawal A., and A. Angelsen. 2009. Using community forest management to achieve REDD+ goals. Bogor: CIFOR.
Angelsen, A., Jagger, P., Babigumira, R., Belcher, B., Hogarth, N.J., Bauch, S., Börner, J., Smith-Hall, C., Wunder, S. 2014. "Environmental Income and Rural Livelihoods: A Global-Comparative Analysis." World Development S12–S28.
Araza, Arnan. 2016. "Ecosystem Service Modeling Report: The Role of Forests in Reducing Poverty and Enhancing Climate Resilience."
Ash, Nelville, Hernán Blanco, Claire Brown, Keisha Garcia, Thomas Henrichs, Nicolas Lucas, Ciara Raudsepp-Hearne, R. David Simpson, Robert Scholes, Thomas P. Tomich, Bhaskar Vira, and Monika Zurek. 2010. Ecosystems and human well-being : a manual for assessment practitioners. Washington D.C.: Island Press.
Calderon, Margaret. 2016. "Valuation of Forest Ecosystem Services: The Role of Forests in Reducing Poverty and Enhancing Climate Resilience ."
Chandrasekharan Behr, Diji, Lisa Robbins, Aaron J.M. Russell. n.d. How Forests Enhnace Resilence to Climate Change: What We Know and Case Studies from Burkina Faso, Hondruas, and Lao PDR. Washington D.C.: Program on Forests (PROFOR).
Chopra, Kanchan and Pushpam Kumar. 2004. "Forest biodiversity and timber extraction: an analysis of the interaction of market and non-market mechanisms." Ecological Economics 135–148.
CIFOR, Center for International Forestry Research. 2005. Forests and floods: Drowning in fiction or thriving on facts? Bogor, Indonesia: Center for International Forestry Research (CIFOR).
CIFOR, Centre for International Forestry Research. 2016. Poverty Environment Network. October 30. Accessed November 29, 2016. http://www1.cifor.org/pen/.
Clarkin, Kim et al. 2006. “Glossary” in Low-Water Crossings: Geomorphic, Biological, and Engineering Design Considerations. US Department of Agriculture Forest Service. HYPERLINK "http://www.fs.fed.us/eng/pubs/pdf/LowWaterCrossings/Hi_pdf/9_Chapter8.pdf" http://www.fs.fed.us/eng/pubs /pdf/LowWaterCrossings/Hi_pdf/9_Chapter8.pdf
Climate Change Commission. 2011. National Climate Change Action plan 2011-2028.
de Bello, F., Lavorel, S., Diaz, S., Harrington, R., Cornelissen, J.H.C., Bardgett, R.D., Berg, M.P., Cipriotti, P., Feld, C.K., Hering, D., da Silva, P.M., Potts, S.G., Sandin, L., Sousa, J.P., Storkey, J., Wardle, D.A. & Harrison, P.A. 2010. "Towards an assessment of multiple ecosystem processes and services via functional traits." Biodiversity Conservation 2873-2893.
de Groot, R. S., R. Alkemade, L. Braat, L. Hein, and L. Willemen. 2010. "Challenges in Integrating the Concept of Ecosystem Services and Values in Landscape Planning, Management and Decision Making." Ecological Complexity 260-272.
Duku, C., H. Rathjens, S. J. Zwart, and L. Hein. 2015. "Towards ecosystem accounting: a comprehensive approach to modelling multiple
75

hydrological ecosystem services." Hydrology and Earth System Sciences 4377–4396.
Fortenbacher, Dominik, Kristine Alave. 2014. Upland Agriculture in the Philippines: Potential and Challenges. Manila: Deutsche Gesellschaft für Internationale Zusammenarbeit (GIZ).
Francisco, H., and M. de los Angeles. 1998. Soil Rresources Depreciation and Deforestation: Philippine Case Study in Resource Accounting. Rome: FAO.
Gata, Larissa Lelu P. 2016. "Forest Use Analysis with Gender Wealth Lens: The Role of Forests in Reducing Poverty and Enhnacing Climate Resilience."
Hallegatte, Stephane, Adrien Vogt-Schilb, Mook Bangalore, Julie Rozenberg. 2017. Unbreakable : Building the Resilience of the Poor in the Face of Natural Disasters. . Washington D.C.: The World Bank Group.
Hassan, Rashid, Robert Scholes, Neville Ash. 2005. Ecosystems and human well-being : current state and trends : findings of the Condition and Trends Working Group. Washington D.C.: Island Press.
Ignacio, Gordon, and Margaret Calderon. 2016. "Report of Forest Use Analysis: The Role of Forests in Reducing Poverty and Enhancing Climate Resilience."
—. 2015. Scoping Report: The Role of Forests in Reducing Poverty and Enhnacing Climate Resilience.
Krishnaswamy, Jagdish, Michael Bonell, Basappa Venkatesh, Bekal K. Purandara, K.N. Rakesh, Sharachchandra Lele, M.C. Kiran, Veerabasawant Reddy, Shrinivas Badiger. 2013. "The groundwater recharge response and hydrologic services of tropical humid forest ecosystems to use and reforestation: Support for the‘‘infiltration-evapotranspiration trade-off hypothesis’’." Journal of Hydrology 191-209.
Krishnaswamy, Jagdish, Michael Bonell, Basappa Venkatesh, Bekal K. Purandara, Sharachchandra Lele, M.C. Kiran, Veerabasawant Reddy, Shrinivas Badiger, K.N. Rakesh. 2012. "The rain–runoff response of tropical humid forest ecosystems to use and reforestation in the Western Ghats of India." Journal of Hydrology 472-473.
McIvor, A.L., Möller, I., Spencer, T. and Spalding. M. 2012. Reduction of wind and swell waves by mangroves. Cambridge: The Nature Conservancy and Wetland.
National Water Resources Board. 2011. “Water Balance Study” in The Study on Integrated Water Resources Management for Poverty Alleviation and Economic Development in the Pampanga River Basin in the Republic of the Philippines. http://open_jicareport.jica.go.jp/pdf/12018982_05.pdf
Nedkova, Stoyan, and Benjamin Burkhard. 2012. "Flood regulating ecosystem services—Mapping supply and demand, in the Etropole municipality, Bulgaria." Ecological Indicators 67–79.
New Hampshire Department of Environmental Services. 2007. “Glossary of River Ecology Terms” in New Hampshire Volunteer River Assessment Program. http://des.nh.gov/organization/commissioner/ pip/publications/wd/documents/vrap_glossary.pdf
76
PAGASA, Philippine Atmospheric Geophysical and Astronomical Services Administration. 2011. Climate Change in the Philippines. Manila: PAGASA.
PSA, Philippines Statistics Authority. 2016. Statistical Figures. October 30. Accessed November 29, 2016 . https://psa.gov.ph/.
Safir, Abla, Sharon Faye Piza and Emmanuel Skoufias. 2013. Disquiet on the Weather Front: The Welfare Impacts of Climatic Variability in the Rural Philippines. Washington D.C.: The World Bank Group.
Seppälä, Risto, Alexander Buck, Pia Katila. 2009. Adaptation of Forests and People to Climate Change: A Global Assessment Report. Helsinki: International Union of Forest Research Organizations (IUFRO).
Sunderland, T., Achdiawan, R., Angelsen, A., Babimigura, R., Ickowitz, A., Paumgarten, F., et al. 2014. "Myths and truths about men, women, and forest resources: A global comparative study ." World Development.
UN, United Nations. 2014. System of Environmental Economic Accounting 2012 - Central Framework. New York: United Nations.
US National Oceanic and Atmospheric Administration National Weather Service. “Glossary of Hydrologic Terms” in Service Hydrologist Reference Manual. Las updated 2008. http://www.nws.noaa.gov/om /hod/SHManual/SHMan014_glossary.htm
Wang, Z., Hou, Y., Fang, H., Yu, D., Zhang, M., Xu, C., Chen, M. & Sun, L. 2012. "Effects of plant species diversity on soil conservation and stability in the secondary succession phases of a semihumid evergreen broadleaf forest in China ." Journal of Soil and Water Conservation 311-320.
WAVES, Phil. 2016. Pilot Ecosystem Account for Laguna de Bay Basin. Manila: World Bank Group.
World Resources Institute. “What is an INDC?” http://www.wri.org/indc-definition
Wunder, S., Börner, J., Shively, G., & Wyman, M. 2014. "Safety Nets, Gap Filling and Forests: A Global-Comparative Perspective." World Development S29-S42.
77

78

7 | Glossary of Terms
Bankfull discharge - the stream discharge corresponding to the water stage that first overstops the natural banks. (Source: DES-NH)
Base flow - that part of the stream not derived from direct runoff from precipitation. It is sustained by ground water inflows. (Source: USFS)
Carbon sequestration — the process by which carbon sinks remove carbon dioxide from the atmosphere. (Source: Phil WAVES Brief)
Dependable flow — the flow which possesses the probability of exceedance of 80% in a flow duration curve under a quasi-natural flow condition. (Source: JICA)
Discharge — the volume of water passing a certain point along a stream or river in a given period of time. (Source: DES-NH)
Erosion — the removal or wearing away of soil or rock by water, wind, or other agents. (Source: DES-NH)
Evaporation — the process by which liquid water is converted into water vapor. (Source: NWS-NOAA)
Evapotranspiration - Combination of evaporation from free water surfaces and transpiration of water from plant surfaces to the atmosphere. (Source: NWS-NOAA)
Floodplain — the portion of a river valley that has been inundated by the river during historic floods. (Source: NWS-NOAA)
Ground Water Flow — refers to streamflow resulting from precipitation that infiltrates into the soil and eventually moves through the soil to the stream channel. This is also referred to as base flow, or dry-weather flow. (Source: NWS-NOAA)
Intended Nationally Determined Contributions (INDCs) — a term under the UN Framework Convention on Climate Change that outlines the post-2020 climate actions countries will take under the Paris Agreement. The climate actions communicated in these INDCs largely determine whether the world achieves the long-term goals of the Paris Agreement. (Source: WRI)
79
Lag time — the time it takes a flood wave to move downstream.
Net Present Value — valuation method to value stocks of natural resources. It is obtained by discounting future flows of economic benefits to the present period. (Source: OECD)
Overbank Flow — water flow over the top of the bankfull channel onto the floodplain. (DES-NH)
Peak Discharge — the highest rate of discharge of a volume of water passing a given location during a given period of time. (Source: NWS-NOAA)
Rainfall — the quantity of water that falls as rain. (Source: USGS)
Replacement cost — estimates the value of an ecosystem service based on the costs associated with mitigating actions if it would be lost. (Source: PROFOR Valuation training)
Runoff — that part of precipitation that flows toward the streams on the surface of the ground or within the ground. Runoff is composed of base flow and surface runoff. (Source: NWS-NOAA)
Sediment Load - The soil particles transported through a channel by stream flow.
Sedimentation - The combined processes of soil erosion, entrainment, transport, deposition, and consolidation; deposition of sediments. (Source: DES-NH)
Social cost of carbon – The marginal global damage costs of carbon emissions. It is usually estimated as the net present value of climate change impacts over the next 100 years (or longer) of one additional ton of carbon emitted to the atmosphere today. (Source: OECD)
Streamflow - The amount of water flowing in a river. (Source: USGS)
Unit resource rent – Equals the value of capital services flows rendered by the natural resources; usually associated with provisioning services, e.g. outputs of agriculture, forestry and fisheries. (Source: OECD)
80

8 | Annexes
Annex 1 Land Cover Maps for three sites
81
Figure 11: 2015 Land Cover in UMRBPL
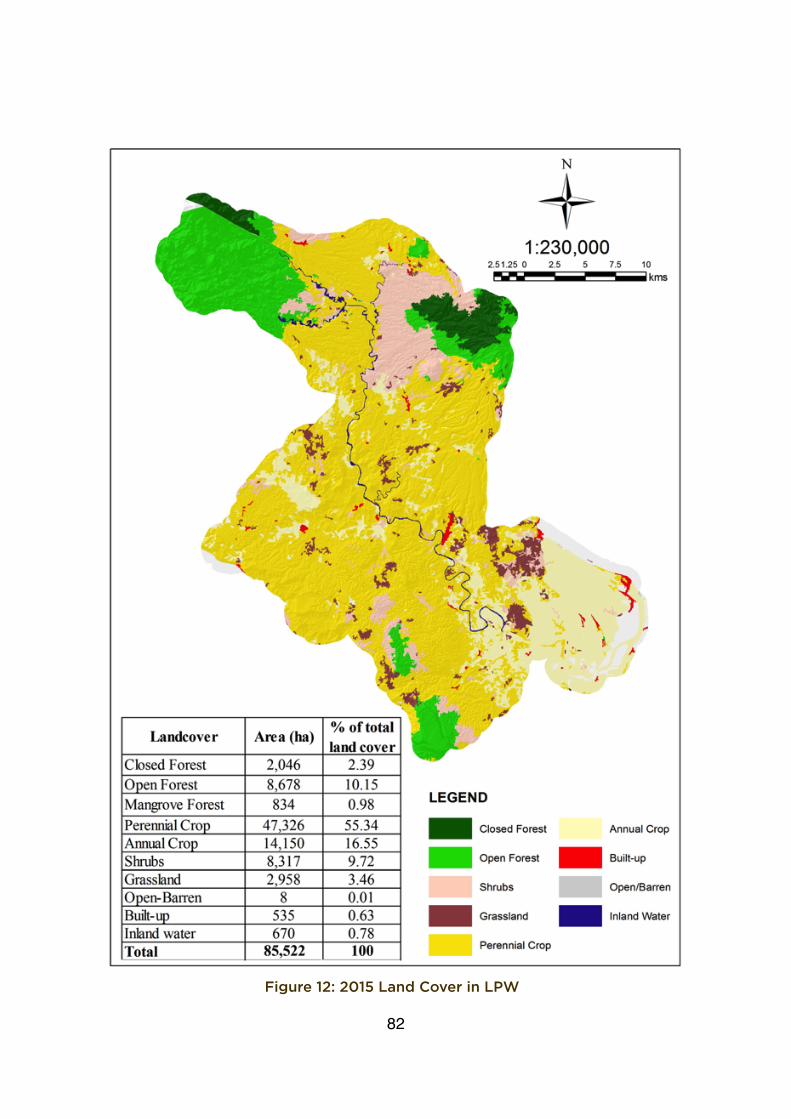
82
Figure 12: 2015 Land Cover in LPW
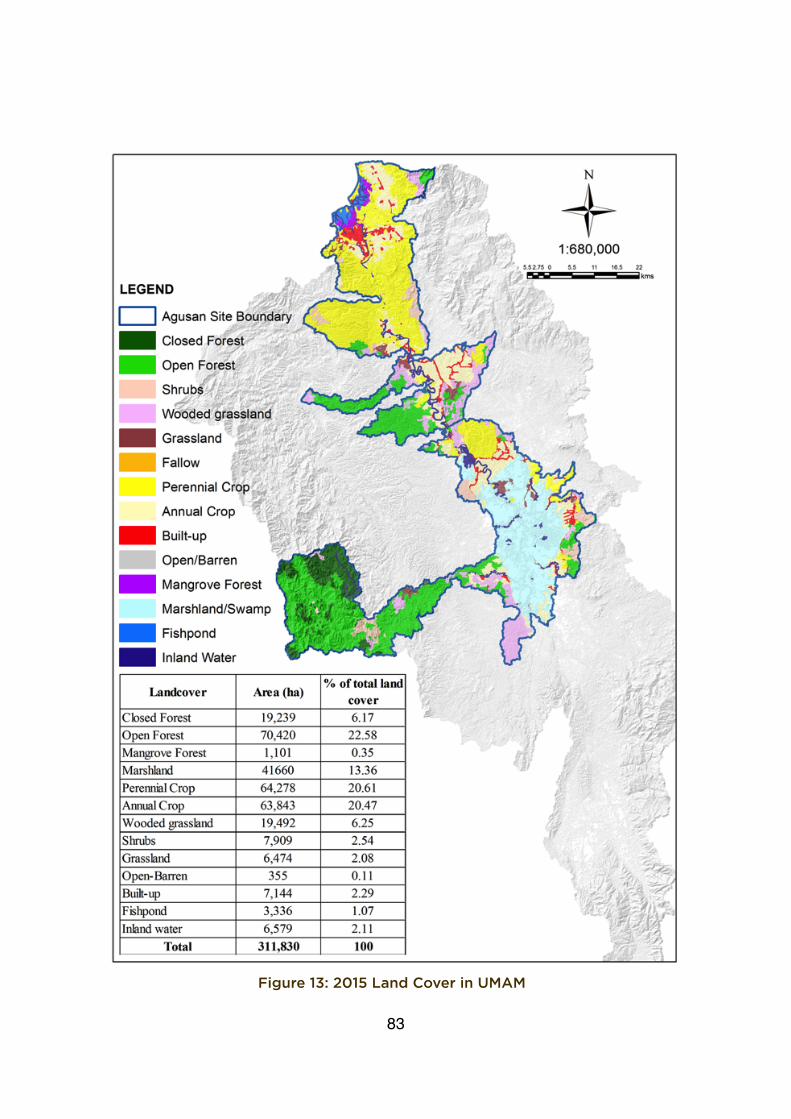
83
Figure 13: 2015 Land Cover in UMAM

Annex 2 Land Cover Area Tables for each scenario for each site
Land Cover Classification
Simulated LandscapeSimulated LandscapeSimulated LandscapeSimulated LandscapeLand Cover Classification
Forested Conservation Agriculture Bare-Urban
Closed Forest Closed Forest is maintained
Closed Forest is maintained
Closed Forest situated on >18% slopes are converted to perennial crop, otherwise converted to annual crop
Converted to Open-Barren
Open Forest Converted to Closed Forest
Open forests situated on slopes >50% and in riparian zones are converted to closed forest, otherwise converted to perennial crop
Open forest situated on >18% slopes are converted to perennial crop, otherwise converted to annual crop
Converted to Open-Barren
Perennial crop Converted to Closed Forest
Perennial crop is maintained
Perennial crop is maintained
Perennial crop is maintained
Annual crop Annual Crop is maintained
Annual Crop is maintained
Annual Crop is maintained
Annual Crop is maintained
Wooded grassland
Converted to Closed Forest
Wooded grassland situated on slopes >50% and in riparian zones are converted to closed forest, otherwise converted to perennial crop
Wooded grassland situated on >18% slopes are converted to perennial crop, otherwise converted to annual crop
Converted to Open-Barren
Table 17: Key assumptions of the simulated landscapes
84
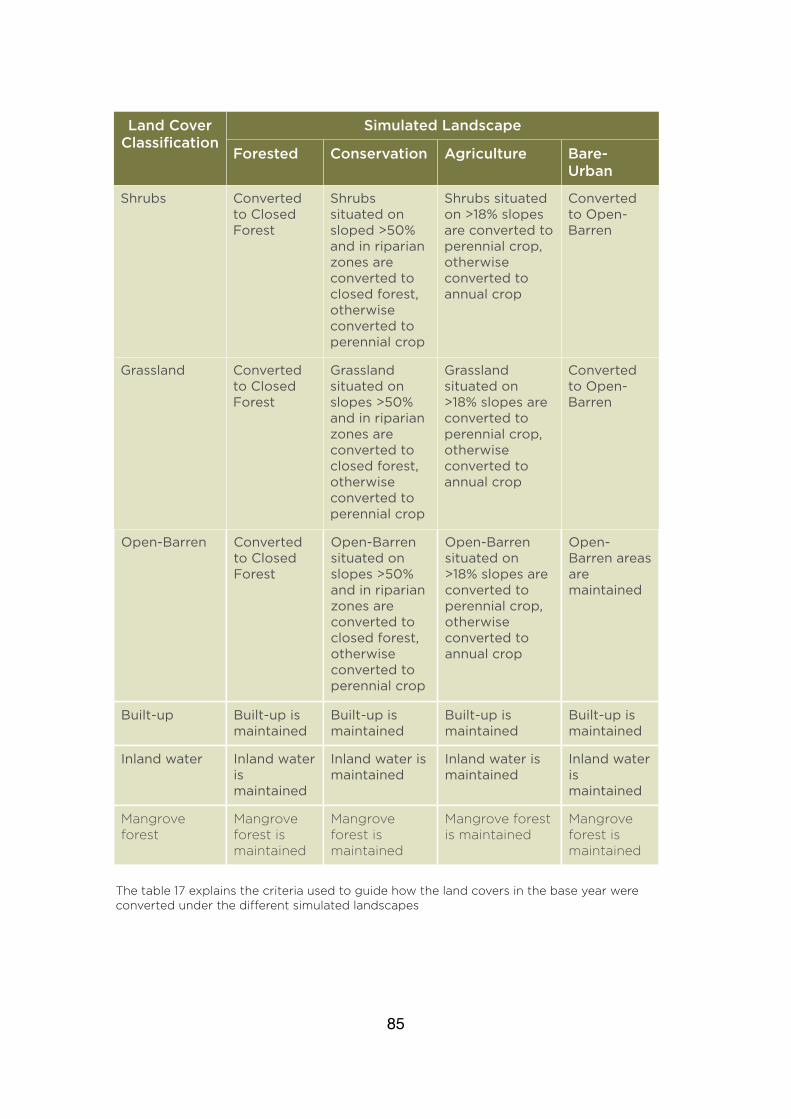
Land Cover Classification
Simulated LandscapeSimulated LandscapeSimulated LandscapeSimulated LandscapeLand Cover Classification
Forested Conservation Agriculture Bare-Urban
Shrubs Converted to Closed Forest
Shrubs situated on sloped >50% and in riparian zones are converted to closed forest, otherwise converted to perennial crop
Shrubs situated on >18% slopes are converted to perennial crop, otherwise converted to annual crop
Converted to Open-Barren
Grassland Converted to Closed Forest
Grassland situated on slopes >50% and in riparian zones are converted to closed forest, otherwise converted to perennial crop
Grassland situated on >18% slopes are converted to perennial crop, otherwise converted to annual crop
Converted to Open-Barren
Open-Barren Converted to Closed Forest
Open-Barren situated on slopes >50% and in riparian zones are converted to closed forest, otherwise converted to perennial crop
Open-Barren situated on >18% slopes are converted to perennial crop, otherwise converted to annual crop
Open-Barren areas are maintained
Built-up Built-up is maintained
Built-up is maintained
Built-up is maintained
Built-up is maintained
Inland water Inland water is maintained
Inland water is maintained
Inland water is maintained
Inland water is maintained
Mangrove forest
Mangrove forest is maintained
Mangrove forest is maintained
Mangrove forest is maintained
Mangrove forest is maintained
85
The table 17 explains the criteria used to guide how the land covers in the base year were converted under the different simulated landscapes

86
Tabl
e 18
: Lan
d co
ver
by a
rea
for
the
base
line
and
four
sim
ulat
ed la
ndsc
apes
for
UM
RB
PL
Land
Cov
er
Cla
ssifi
cati
onB
asel
ine
(20
15 la
nd
cove
r)B
asel
ine
(20
15 la
nd
cove
r)Fo
rest
edFo
rest
edC
onse
rvat
ion
Con
serv
atio
nA
gric
ultu
reA
gric
ultu
reB
are-
Urb
anB
are-
Urb
anLa
nd C
over
C
lass
ifica
tion
Are
a (h
a)%
of
tota
l la
nd c
over
Are
a (h
a)%
of
tota
l la
nd
cove
r
Are
a (h
a)%
of
tota
l la
nd
cove
r
Are
a (h
a)%
of
tota
l la
nd
cove
r
Are
a (h
a)%
of
tota
l la
nd
cove
r
Clo
sed
Fo
rest
64
42.
1128
,146
92.2
122
,083
72.3
50
0.0
00
0.0
0
Op
en F
ore
st5,
790
18.9
70
0.0
00
0.0
00
0.0
00
0.0
0
Per
enni
al C
rop
1,817
5.9
56
,063
19.8
628
,146
92.2
10
0.0
0
Ann
ual C
rop
1,082
3.54
1,082
3.54
1,082
3.54
1,082
3.54
00
.00
Wo
od
ed
gra
ssla
nd6
,676
21.8
70
0.0
00
0.0
00
0.0
00
0.0
0
Shr
ubs
9,9
41
32.5
70
0.0
00
0.0
00
0.0
00
0.0
0
Gra
ssla
nd3,
169
10.3
80
0.0
00
0.0
00
0.0
00
.00
Op
en-B
arre
n10
90
.36
00
.00
00
.00
00
.00
23,16
075
.87
Bui
lt-u
p93
43.
06
934
3.0
693
43.
06
934
3.0
67,
00
222
.94
Inla
nd w
ater
362
1.19
362
1.19
362
1.19
362
1.19
362
1.19
Tota
l30
,524
100
30,5
2410
030
,524
100
30,5
2410
030
,524
100

87
Tabl
e 19
: Lan
d co
ver
by a
rea
for
the
base
line
and
four
sim
ulat
ed la
ndsc
apes
for
LPW
Land
Cov
er
Cla
ssifi
cati
onB
asel
ine
(20
15
land
cov
er)
Bas
elin
e (2
015
la
nd c
over
)Fo
rest
edFo
rest
edC
onse
rvat
ion
Con
serv
atio
nA
gric
ultu
reA
gric
ultu
reB
are-
Urb
anB
are-
Urb
anLa
nd C
over
C
lass
ifica
tion
Are
a (h
a)%
of
tota
l la
nd
cove
r
Are
a (h
a)%
of
tota
l la
nd
cove
r
Are
a (h
a)%
of
tota
l la
nd
cove
r
Are
a (h
a)%
of
tota
l la
nd
cove
r
Are
a (h
a)%
of
tota
l la
nd
cove
r
Clo
sed
Fo
rest
2,0
46
2.39
69,3
3381
.07
24,3
7128
.50
00
.00
00
.00
Op
en F
ore
st8,
678
10.15
00
.00
00
.00
00
.00
00
.00
Man
gro
ve F
ore
st83
40
.98
834
0.9
883
40
.98
834
0.9
883
40
.98
Per
enni
al C
rop
47,3
2655
.34
00
.00
44
,96
252
.57
35,3
144
1.29
00
.00
Ann
ual C
rop
14,15
016
.55
14,15
016
.55
14,15
016
.55
48,
169
56.3
213
,163
15.3
9
Shr
ubs
8,31
79.
720
0.0
00
0.0
00
0.0
00
0.0
0
Gra
ssla
nd2,
958
3.4
60
0.0
00
0.0
00
0.0
00
0.0
0
Op
en-B
arre
n8
0.0
10
0.0
00
0.0
00
0.0
070
,320
82.2
2
Bui
lt-u
p53
50
.63
535
0.6
353
50
.63
535
0.6
353
50
.63
Inla
nd w
ater
670
0.7
867
00
.78
670
0.7
867
00
.78
670
0.7
8
Tota
l85
,522
100
85,5
2210
085
,522
100
85,5
2210
085
,522
100

88
Tabl
e 20
: Lan
d co
ver
by a
rea
for
the
base
line
and
four
sim
ulat
ed la
ndsc
apes
for
UM
AM
Land
Cov
er
Cla
ssifi
cati
onB
asel
ine
(20
15 la
nd
cove
r)B
asel
ine
(20
15 la
nd
cove
r)Fo
rest
edFo
rest
edC
onse
rvat
ion
Con
serv
atio
nA
gric
ultu
reA
gric
ultu
reB
are-
Urb
anB
are-
Urb
anLa
nd C
over
C
lass
ifica
tion
Are
a (h
a)%
of
tota
l la
nd c
over
Are
a (h
a)%
of
tota
l la
nd
cove
r
Are
a (h
a)%
of
tota
l la
nd
cove
r
Are
a (h
a)%
of
tota
l la
nd c
over
Are
a (h
a)%
of
tota
l la
nd c
over
Clo
sed
Fo
rest
19,2
396
.1719
1,50
361
.41
105,
071
33.6
90
0.0
00
0.0
0
Op
en F
ore
st70
,420
22.5
80
0.0
00
0.0
00
0.0
00
0.0
0
Man
gro
ve F
ore
st1,1
01
0.3
51,1
01
0.3
51,1
01
0.3
51,1
01
0.3
51,1
01
0.3
5
Ag
rofo
rest
ry0
0.0
00
0.0
024
,112
7.73
00
.00
00
.00
Mar
shla
nd4
1,66
013
.36
41,6
60
13.3
64
1,66
013
.36
41,6
60
13.3
64
1,66
013
.36
Per
enni
al C
rop
64
,278
20.6
10
0.0
058
,984
18.9
218
1,693
58.2
70
0.0
0
Ann
ual C
rop
63,8
43
20.4
763
,84
320
.47
63,8
43
20.4
770
,317
22.5
50
0.0
0
Wo
od
ed
gra
ssla
nd19
,492
6.2
50
0.0
00
0.0
00
0.0
00
0.0
0
Shr
ubs
7,9
09
2.54
00
.00
00
.00
00
.00
00
.00
Gra
ssla
nd6
,474
2.0
80
0.0
00
0.0
00
0.0
00
0.0
0
Op
en-B
arre
n35
50
.110
0.0
00
0.0
00
0.0
025
2,0
1080
.82
Bui
lt-u
p7,
144
2.29
7,14
42.
297,
144
2.29
7,14
42.
297,
144
2.29
Fis
hpo
nd3,
336
1.07
00
.00
3,33
61.0
73,
336
1.07
3,33
61.0
7
Inla
nd w
ater
6,5
792.
116
,579
2.11
6,5
792.
116
,579
2.11
6,5
792.
11
Tota
l31
1,830
100
311,8
3010
031
1,830
100
311,8
3010
031
1,830
100

Annex 3 Assumptions and data used for ecosystem service modeling
Water Use
Householda Consumption
(m3/year)
Cost of Delivered
Water, Accessible
Areasb
(PHP/household)
Cost of Delivered
Water, Less Accessible
Areas c(PHP/
household)
Value of Water
Consumption for All
Households in Accessible
Areas (PHP/year)
Value of Water
Consumption for All
Households in Less
Accessible Areas
(PHP/year)
Drinking 5.31 11,220 12,625 27,287,113 11,842,004
Non-drinking
55.17 9,655 13,793 23,480,352 12,937,365
Total, Drinking and Non-drinking
60.48 20,875 26,417 50,767,465 24,779,369
Total Water Replacement Cost, Accessible and Less Accessible Areas
Total Water Replacement Cost, Accessible and Less Accessible Areas
Total Water Replacement Cost, Accessible and Less Accessible Areas
Total Water Replacement Cost, Accessible and Less Accessible Areas
Total Water Replacement Cost, Accessible and Less Accessible Areas
75,546,834
a Average household size, in the province of Rizal as of 2010: 4.5 (https://psa.gov.ph) b For accessible areas: total number of households - 2,432 households; price of drinking water: PHP 8/gallon = PHP 2,113.37/cu m; price of non-drinking water: PHP 35/drum, 5 drums/cu m = PHP 175.00/cu m c For less accessible areas: total number of households - 938 households; price of drinking water: PHP 8/gallon = PHP 2,337.54/cu m; price of non-drinking water: PHP 50/drum, 5 drums/cu m = PHP 250/cu m
89
Table 21: Household consumption and value of water in UMRBPL for various uses

Table 22: Total Cost of rainwater harvesting using ferrocement water tanks for UMRBPL
Tank Capacity
Price per tankPrice per tankPrice per tank Total Cost of Tanks for All Households
(PHP)d
Annualized Cost of Tanks
for All Households (PHP/year)e
Tank Capacity
1990(US$)a
2015(US$)b
2015(PHP)c
Total Cost of Tanks for All Households
(PHP)d
Annualized Cost of Tanks
for All Households (PHP/year)e
2 cu m 67 313 14,254 48,321,558 9,628,170
4 cu m 125 584 26,594 90,152,161 17,963,004
aSource: Sourcebook of Alternative Technologies for Freshwater Augmentation in Some Countries in Asia.pdf, United Nations Environment Programme, Division of Technology, Industry and Economics. Date accessed: June 3, 2016b1990 prices converted to 2015 values using the average inflation rate (1990-2015) of 6.11% (http://data.worldbank.org)c 2015 Average US$1:PHP45.52 (Source: http://www.usforex.com/forex-tools/historical-rate-tools/yearly-average-rates)d3,390 households in UMRBPL (Source: SRPAO 2012-2013)eTotal cost was annualized using a 15% discount rate and a 10-year lifespan per water tank
Table 23: Household consumption and value of water for various uses in LPW
Water Use Householda Consumpti
on (m3/year)
Delivery Price of Water(PHP/m3)
Value of Water
Consumption(PHP/
household/year)
Value of Water
Consumption not Served
by WD(PHP/year)
Value of Water
Consumption, All
Households (PHP/year)
Drinking 13.33 1,585.03 21,126.04 768,840,028 924,623,458
Non-drinking
66.31 1,000.00 16,576.46 603,266,927 725,501,706
Total, Drinking and Non-drinking
79.63 3,505.03 37,702.50 1,372,106,955 1,650,125,164
90
aSource: Sourcebook of Alternative Technologies for Freshwater Augmentation in Some Countries in Asia.pdf, United Nations Environment Programme, Division of Technology, Industry and Economics. Date accessed: June 3, 2016b1990 prices converted to 2015 values using the average inflation rate (1990-2015) of 6.11% (http://data.worldbank.org)c 2015 Average US$1:PHP45.52 (Source: http://www.usforex.com/forex-tools/historical-rate-tools/yearly-average-rates)d3,390 households in UMRBPL (Source: SRPAO 2012-2013)eTotal cost was annualized using a 15% discount rate and a 10-year lifespan per water tank

Tabl
e 24
: Tot
al C
ost
of r
ainw
ater
har
vest
ing
usin
g fe
rroc
emen
t w
ater
tan
ks fo
r LP
Wa
91
Tank
C
apac
ity
Pric
e pe
r ta
nkPr
ice
per
tank
Pric
e pe
r ta
nkTo
tal C
ost
of
Tank
s H
ouse
hold
s w
itho
ut W
ater
C
onne
ctio
n(P
HP)
Tota
l Cos
t of
Ta
nks
for
All
Hou
seho
lds
(PH
P)d
Ann
ualiz
ed C
ost
of T
anks
H
ouse
hold
s
Wit
hout
Wat
er
Con
nect
ion
(PH
P/ye
ar)
Ann
ualiz
ed
Cos
t of
Tan
ks
for
All
Hou
seho
lds
(PH
P/ye
ar)e
Tank
C
apac
ity
1990
(US$
)b20
15(U
S$)c
2015
(PH
P)d
Tota
l Cos
t of
Ta
nks
Hou
seho
lds
wit
hout
Wat
er
Con
nect
ion
(PH
P)
Tota
l Cos
t of
Ta
nks
for
All
Hou
seho
lds
(PH
P)d
Ann
ualiz
ed C
ost
of T
anks
H
ouse
hold
s
Wit
hout
Wat
er
Con
nect
ion
(PH
P/ye
ar)
Ann
ualiz
ed
Cos
t of
Tan
ks
for
All
Hou
seho
lds
(PH
P/ye
ar)e
2 cu
m67
313
14,2
5451
8,74
5,82
26
23,8
54,8
1810
3,36
1,175
124
,30
4,3
59
4 c
u m
125
584
26,5
94
967
,835
,44
21,1
63,9
39,5
98
192,
843,
208
231,9
17,3
66

Annex 4 Zones UMRBPL
92
Figure 14: Ag-Use landscape scenario in UMRBPL, overlain with protected area zones

Annex 5 Survey tools used in forest use analysis
Table 25: Module titles and objectives
Module No.
Title Purpose
1 Seasonal Calendar Identify the products that are available/harvested in their respective barangays and to identify the time of harvest, sale or combination of harvest and sale, and whether these products are for cash/sales or for the communities’ subsistence
2 Most Important Products (MIP) from the forest
Determines the origin, ownership, access, and changes in availability of MIP’s from the forests
3 Community Benefits
Looks into the benefits that local communities have received as a result of their participation in forestry-related programs and activities
4 Food shortage and crises
Looks into the way the barangays use forest products during times of food shortage and crises
5 Forest changes and clearance
Describe changes in the forest that are used by the local communities and the extent of forest clearance
6 Households’ observation of climate change
Describe households’ observations about climate change and strategies they employ to adapt to these changes, including the use of forest ecosystem services
7 Forest institutions Evaluated the participant’s familiarity with rules and regulations governing the use of forest services, particularly the most important forest products for cash and subsistence
8 Community practices to reduce effects of climate change variability
Understand whether the community practices forest management activities to cope with climate variability
93

Table 26: Field Tools and Their Purpose
ToolNo.
Title Purpose
1 Wealth Ranking Understand how poor households use and depend on forest resources
2 Local Landscape Situation Analysis
Understand how villagers use local resources
3 Timeline and Trends Record changes in forest resources, agriculture, local livelihood strategies, and income
4 Livelihood Analysis Determine subsistence reliance on forests and the annual income from forests
5 Forest Problem and Solution Matrix
Identify and rank forest problems and suggest solutions
6 Ranking Forest Products
Rank forest products by importance for cash and subsistence use
7 Millennium Development Goals (MDGs) Chart
Show the contribution of forests to the achievement of the MDGs
8 Monetary Values Express the contribution of forestry in monetary terms
Source: www.profor.info/node/3
94

Annex 6 Results of Ecosystem Service Modeling and Valuation
Figure 15: Comparison of simulated daily streamflow rates at the Libmanan watershed outlet during the dry season under four landscape simulations in the Libmanan-Pulantuna Watershed study site for the period 2002-2012
Average streamflow under the Forested landscape was found to be 52.48 m3/s; under the Conservation landscape – 51.45 m3/s; under the agriculture landscape – 50.53 m3/s; and under Bare-Urban – 52.81 m3/s.
Figure 16: Comparison of simulated daily streamflow rates at the UMAM outlet during the dry season under four landscape simulations in the UMAM study site for the period 2002-2012Average streamflow under the Forested landscape was found to be 460.25 m3/s; under the Conservation landscape – 457.26 m3/s; under the agriculture landscape – 454.82 m3/s; and under Bare-Urban – 441.18 m3/s.
95

Figure 17: Simulations of streamflow of the Libmanan-Pulantuna watershed outlet under the 2015 land cover, and the Forested and Bare-Urban landscapes for the period September 14-18, 2012
The differences between peak discharges for the simulations using the Forested and Bare-Urban landscapes range from two to seven hours, and peak discharge under forested conditions is 20.7-28.6% less than under the Bare-Slope conditions.
96

97
Scen
ario
Soil
Loss
(kg
/yea
r)Er
osio
n A
void
ed R
elat
ive
to B
are
Scen
ario
(kg
/ye
ar)
Qua
ntit
y of
Ero
sion
B
lank
ets
Req
uire
d (m
2 /ye
ar)
Tota
l Rep
lace
men
t C
ost
(PH
P)A
nnua
lized
Rep
lace
men
t C
ost
(PH
P/ye
ar)
MR
BP
LM
RB
PL
MR
BP
LM
RB
PL
MR
BP
LM
RB
PL
Bas
e15
,124
,932
,00
0
2015
4,0
54,9
41,0
00
14,5
97,8
21,0
00
31,12
5,4
189,
337,
625
,373
2,4
67,3
45,
243
Fo
rest
ed11
7,73
0,0
00
16,2
82,2
87,0
00
34,7
17,0
3010
,415
,108,
955
2,75
2,0
56,17
2
Co
nser
vati
on
240
,39
1,00
016
,159,
626
,00
034
,455
,493
10,3
36,6
47,7
612,
731,3
23,8
29
Ag
ricu
ltur
e1,4
41,7
56,0
00
14,9
58,2
61,0
00
31,8
93,9
479,
568,
184
,00
92,
528,
267,
344
LPW
LPW
LPW
LPW
LPW
LPW
Bas
e17
,935
,070
,028
2015
2,58
0,5
87,6
3015
,354
,482
,39
832
,738
,76
89,
821,6
30,5
322,
595,
237,
269
Fo
rest
ed56
6,17
4,8
3817
,30
8,89
5,19
137
,033
,892
11,11
0,16
7,4
99
2,93
5,71
6,2
91
Co
nser
vati
on
1,50
6,4
39,4
8016
,428
,630
,54
935
,029
,063
10,5
08,
718,
90
12,
776
,79
1,374
Ag
ricu
ltur
e3,
94
4,8
63,3
8413
,99
0,2
06
,64
429
,829
,86
58,
94
8,9
59,4
742,
364
,64
5,36
8
UM
AM
UM
AM
UM
AM
UM
AM
UM
AM
UM
AM
Bas
e4
2,9
06
,24
0,0
00
2010
5,15
7,0
00
,00
037
,74
9,24
0,0
00
80,4
88,7
8524
,146
,635
,39
46
,380
,432
,24
1
Fo
rest
ed1,3
99,
687
,411
41,5
06
,552
,589
88,5
00
,112
26,5
50,0
33,6
397,
015
,49
8,75
8
Co
nser
vati
on
2,4
90
,638
,192
40
,415
,60
1,80
886
,171,9
91
25,8
52,19
7,31
86
,831
,104
,647
Ag
ricu
ltur
e8,
976
,54
8,0
3633
,929
,69
1,96
472
,34
4,7
5921
,70
3,4
27,6
96
5,73
4,8
46
,59
6
Tabl
e 27
: Rep
lace
men
t co
st o
f er
osio
n co
ntro
l ser
vice
und
er v
ario
us s
cena
rios
, UM
RB
PL, L
PRB
and
Mid
dle
Agu
san
Bas
in

98
Tabl
e 28
: R
epla
cem
ent
cost
of
sedi
men
t co
ntro
l ec
osys
tem
ser
vice
und
er v
ario
us s
cena
rios
, U
MR
BPL
, LP
W,
and
UM
AM
.Si
te/S
cena
rio
TSS
(ton
/yea
r)TS
S A
void
ed
Rel
ativ
e to
Bar
e Sc
enar
ioa (m
3 /ye
ar)
No.
of
Che
ck
Dam
s R
equi
red
(uni
ts/y
ear)
Cos
t of
Che
ck D
ams
(PH
P)A
nnua
lized
Cos
t of
C
heck
Dam
s (P
HP/
year
)
Des
iltat
ion
Cos
t (P
HP/
year
)R
epla
cem
ent
Cos
t (P
HP/
year
)
UM
RB
PL
UM
RB
PL
UM
RB
PL
UM
RB
PL
UM
RB
PL
UM
RB
PL
UM
RB
PL
UM
RB
PL
Bar
e-U
rban
4,10
0,0
04
2015
450
,54
92,
280
,90
910
,467
5,10
4,9
83,12
71,1
37,6
45,
94
99
12,3
63,7
502,
050
,00
9,69
9
Fo
rest
ed31
,538
4,0
68,
46
611
,669
5,69
1,110
,119
1,26
8,26
4,4
02
1,017
,116
,50
02,
285,
380
,90
2
Co
nser
vati
on
60
,09
84
,039
,90
611
,587
5,6
51,15
9,4
09
1,259
,361
,383
1,00
9,97
6,5
00
2,26
9,33
7,88
3
Ag
ricu
ltur
e36
0,4
393,
739,
565
10,7
265,
231,0
32,0
931,1
65,
735,
973
934
,89
1,250
2,10
0,6
27,2
23
LPW
LPW
LPW
LPW
LPW
LPW
LPW
LPW
Bar
e-U
rban
4,4
83,7
68
2015
64
5,14
72,
399,
138
11,0
105,
369,
599,
205
1,19
6,6
15,6
64
959
,655
,150
2,15
6,2
70,8
14
Fo
rest
ed14
1,54
42,
713,
890
12,4
546
,074
,057
,29
41,3
53,6
04
,212
1,085
,555
,94
92,
439
,160
,162
Co
nser
vati
on
376
,610
2,56
6,9
7411
,780
5,74
5,23
8,37
71,2
80,3
26,8
871,0
26,7
89,4
09
2,30
7,11
6,2
96
Ag
ricu
ltur
e9
86,2
162,
185,
970
10,0
324
,892
,49
9,82
71,0
90
,29
4,0
2587
4,3
87,9
151,9
64
,681
,94
0
Mid
dle
Ag
usan
Bas
inM
idd
le A
gus
an B
asin
Mid
dle
Ag
usan
Bas
inM
idd
le A
gus
an B
asin
Mid
dle
Ag
usan
Bas
inM
idd
le A
gus
an B
asin
Mid
dle
Ag
usan
Bas
inM
idd
le A
gus
an B
asin
Bar
e-U
rban
4,7
67,3
60
2010
573,
00
02,
621
,475
12,0
305,
867,
220
,148
1,30
7,51
0,5
361,0
48,
590
,00
02,
356
,100
,536
Fo
rest
ed15
5,52
12,
882,
399
13,2
276
,451
,20
4,8
881,4
37,6
51,5
871,1
52,9
59,7
94
2,59
0,6
11,3
81
Co
nser
vati
on
276
,738
2,80
6,6
3912
,880
6,2
81,6
42,
577
1,39
9,86
4,6
111,1
22,6
55,6
06
2,52
2,52
0,2
17
Ag
ricu
ltur
e9
97,3
94
2,35
6,2
2910
,813
5,27
3,56
2,39
01,1
75,2
13,8
519
42,
49
1,44
32,
117,
705,
294
a 1 to
n se
dim
ent =
1.6
m3

Annex 7 Background data for Scenarios
Table 29: Total number of HHS and qualified tenured migrants in UMRBPL
Name of Barangay/
Municipality
Total No of
HHs
Total Household Member
(including household head)
Total Household Member
(including household head)
Total Area (ha)Total Area (ha)Total Area (ha) % of HHS with
annual incomes below
the poverty
level
Qualified Tenured Migrants, % of HH
Population
Name of Barangay/
Municipality
Total No of
HHs
Total Female Farmlot (ha)
Homelot (ha)
Total (ha)
% of HHS with
annual incomes below
the poverty
level
Qualified Tenured Migrants, % of HH
Population
Calawis, Antipolo City
949 4,504 2,161 1,961.86 67.43 2,029.28 81.03 28
Pintong Bocaue, San Mateo
457 1,972 980 363.60 56.71 420.31 86.54 37
San Jose, Antipolo City
758 3,520 949 874.85 741.73 1,616.58 84.38 42
San Juan, Antipolo City
268 1,318 648 126.21 23.09 149.30 87.31 18
Cuyambay, Tanay 52 253 119 130.00 45.95 175.95 89.92 23
Mascap, Rodriguez
32 121 50 132.50 0.27 132.77 96.40 41
Panugay, Baras 129 592 291 0.00 64.11 64.11 91.42 28
Puray, Rodriguez 444 2,222 1,081 1,003.83 9.22 1,013.05 63.81 69
San Rafael, Rodriguez
281 1,286 594 502.78 6.23 509.01 92.17 58
Total, UMRBPL 3,370 15,788 6,873 5,095.62 1,014.74 6,096.88 85.89 40
99
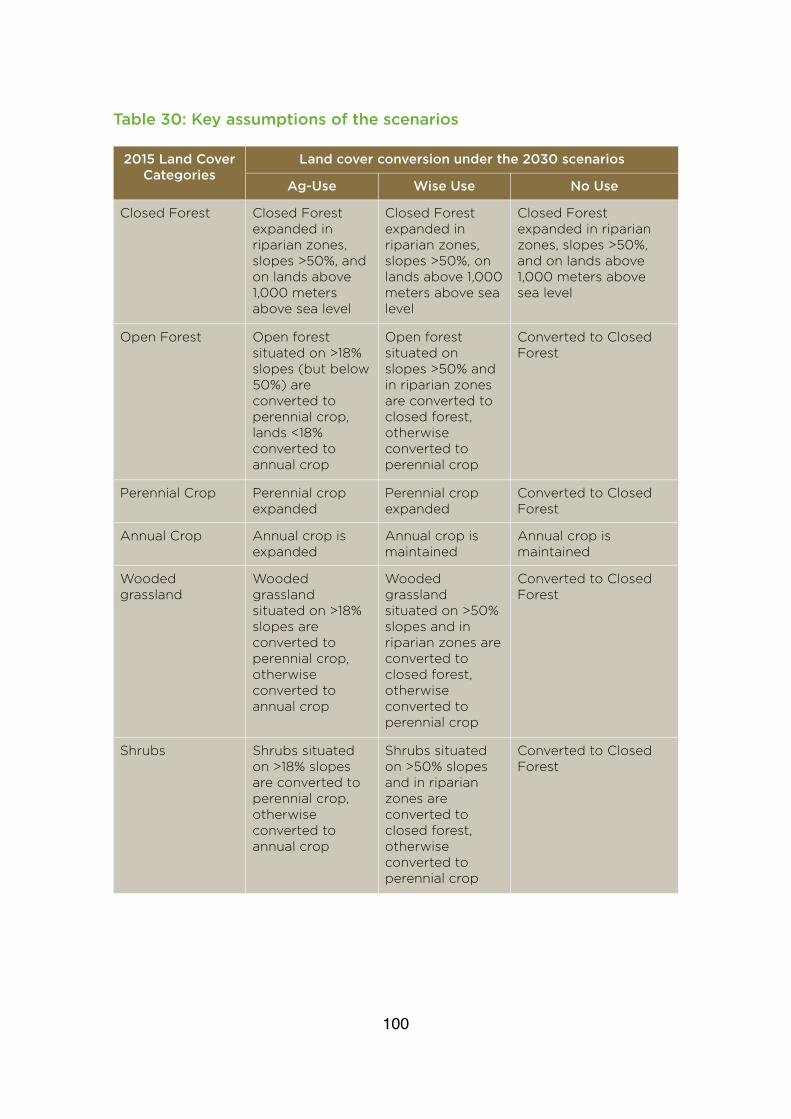
Table 30: Key assumptions of the scenarios
2015 Land Cover Categories
Land cover conversion under the 2030 scenariosLand cover conversion under the 2030 scenariosLand cover conversion under the 2030 scenarios2015 Land Cover Categories
Ag-Use Wise Use No Use
Closed Forest Closed Forest expanded in riparian zones, slopes >50%, and on lands above 1,000 meters above sea level
Closed Forest expanded in riparian zones, slopes >50%, on lands above 1,000 meters above sea level
Closed Forest expanded in riparian zones, slopes >50%, and on lands above 1,000 meters above sea level
Open Forest Open forest situated on >18% slopes (but below 50%) are converted to perennial crop, lands <18% converted to annual crop
Open forest situated on slopes >50% and in riparian zones are converted to closed forest, otherwise converted to perennial crop
Converted to Closed Forest
Perennial Crop Perennial crop expanded
Perennial crop expanded
Converted to Closed Forest
Annual Crop Annual crop is expanded
Annual crop is maintained
Annual crop is maintained
Wooded grassland
Wooded grassland situated on >18% slopes are converted to perennial crop, otherwise converted to annual crop
Wooded grassland situated on >50% slopes and in riparian zones are converted to closed forest, otherwise converted to perennial crop
Converted to Closed Forest
Shrubs Shrubs situated on >18% slopes are converted to perennial crop, otherwise converted to annual crop
Shrubs situated on >50% slopes and in riparian zones are converted to closed forest, otherwise converted to perennial crop
Converted to Closed Forest
100
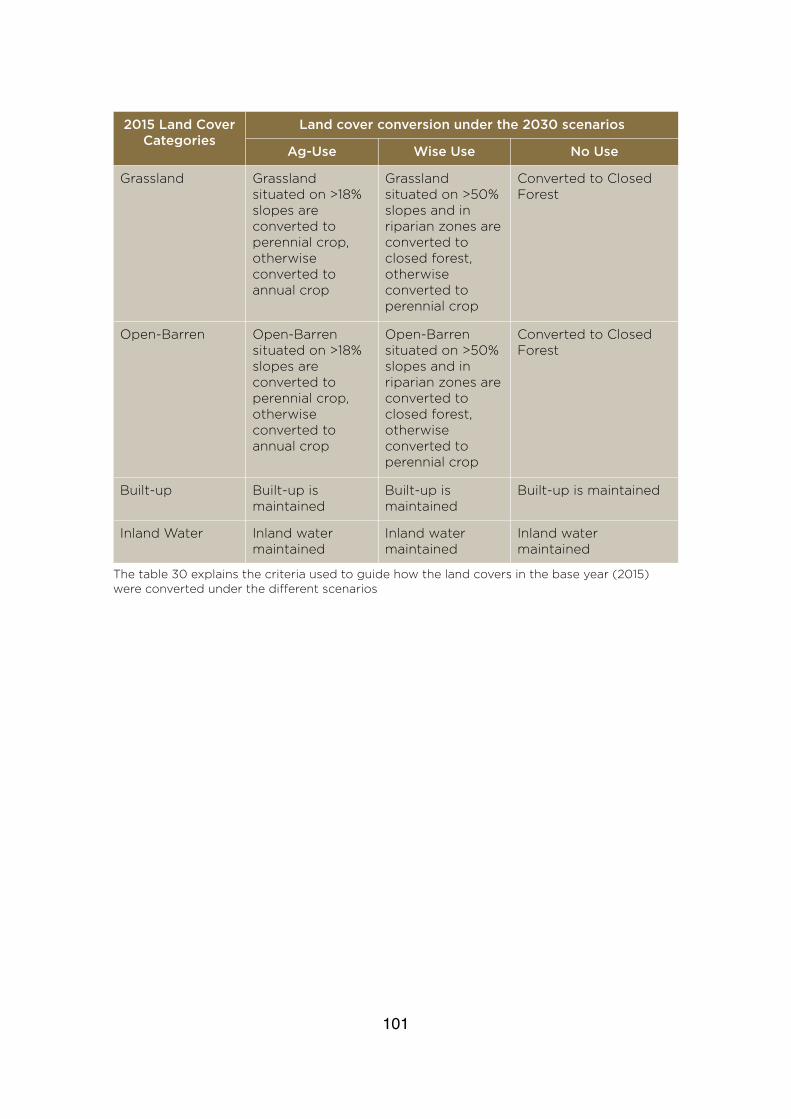
2015 Land Cover Categories
Land cover conversion under the 2030 scenariosLand cover conversion under the 2030 scenariosLand cover conversion under the 2030 scenarios2015 Land Cover Categories
Ag-Use Wise Use No Use
Grassland Grassland situated on >18% slopes are converted to perennial crop, otherwise converted to annual crop
Grassland situated on >50% slopes and in riparian zones are converted to closed forest, otherwise converted to perennial crop
Converted to Closed Forest
Open-Barren Open-Barren situated on >18% slopes are converted to perennial crop, otherwise converted to annual crop
Open-Barren situated on >50% slopes and in riparian zones are converted to closed forest, otherwise converted to perennial crop
Converted to Closed Forest
Built-up Built-up is maintained
Built-up is maintained
Built-up is maintained
Inland Water Inland water maintained
Inland water maintained
Inland water maintained
The table 30 explains the criteria used to guide how the land covers in the base year (2015) were converted under the different scenarios
101

102
Tabl
e 31
: Val
ue o
f ca
rbon
seq
uest
rati
on u
sing
soc
ial c
ost
of c
arbo
n (S
C-C
O2)
a Act
ual fo
rest
cov
er s
cena
rio fo
r UM
AMb A
ctua
l fore
st c
over
sce
nario
for U
MRB
PL a
nd L
PW
Site
Nam
e/Fo
rest
Ty
peC
arbo
n Se
ques
trat
ion
Val
ue b
y La
nd C
over
Sce
nari
os (
in t
ons
of C
O2
and
PHP)
Car
bon
Sequ
estr
atio
n V
alue
by
Land
Cov
er S
cena
rios
(in
ton
s of
CO
2 an
d PH
P)C
arbo
n Se
ques
trat
ion
Val
ue b
y La
nd C
over
Sce
nari
os (
in t
ons
of C
O2
and
PHP)
Car
bon
Sequ
estr
atio
n V
alue
by
Land
Cov
er S
cena
rios
(in
ton
s of
CO
2 an
d PH
P)C
arbo
n Se
ques
trat
ion
Val
ue b
y La
nd C
over
Sce
nari
os (
in t
ons
of C
O2
and
PHP)
Car
bon
Sequ
estr
atio
n V
alue
by
Land
Cov
er S
cena
rios
(in
ton
s of
CO
2 an
d PH
P)C
arbo
n Se
ques
trat
ion
Val
ue b
y La
nd C
over
Sce
nari
os (
in t
ons
of C
O2
and
PHP)
Car
bon
Sequ
estr
atio
n V
alue
by
Land
Cov
er S
cena
rios
(in
ton
s of
CO
2 an
d PH
P)C
arbo
n Se
ques
trat
ion
Val
ue b
y La
nd C
over
Sce
nari
os (
in t
ons
of C
O2
and
PHP)
Site
Nam
e/Fo
rest
Ty
peA
ctua
l (20
10a
/20
15b
)A
ctua
l (20
10a
/20
15b
)A
ctua
l (20
10a
/20
15b
)Fo
rest
edFo
rest
edFo
rest
edC
onse
rvat
ion
Con
serv
atio
nC
onse
rvat
ion
Site
Nam
e/Fo
rest
Ty
pe
Car
bon
Sequ
este
red
(ton
s C
O2/
year
)
Ann
ual V
alue
(S
CC
= U
S$32
)A
nnua
l Val
ue
(SC
C -
US$
11)
Car
bon
Sequ
este
red
(ton
s C
O2/
year
)
Ann
ual V
alue
(S
CC
= U
S$32
)A
nnua
l Val
ue
(SC
C -
US$
11)
Car
bon
Sequ
este
red
(ton
s C
O2/
year
)
Ann
ual V
alue
(S
CC
= U
S$32
)A
nnua
l Val
ue
(SC
C -
US$
11)
UM
RB
PL
UM
RB
PL
UM
RB
PL
UM
RB
PL
UM
RB
PL
UM
RB
PL
UM
RB
PL
UM
RB
PL
UM
RB
PL
UM
RB
PL
Clo
sed
Fo
rest
2,9
48
4,2
94
,473
1,476
,225
128,
851
187,
689
,821
64
,518
,376
101,3
2414
7,59
2,51
050
,734
,925
Op
en F
ore
st4
4,17
76
4,3
50,4
1522
,120
,455
00
00
00
Pla
ntat
ion
Fo
rest
00
00
00
248,
786
362,
391,7
49
124
,572
,164
Man
gro
ve F
ore
st0
00
00
00
00
Tota
l47
,125
68,
64
4,8
8823
,59
6,6
8012
8,85
118
7,6
89,8
216
4,5
18,3
7635
0,11
050
0,9
84,2
5917
5,30
7,0
89
LPW
LPW
LPW
LPW
LPW
LPW
LPW
LPW
LPW
LPW
Clo
sed
Fo
rest
9,36
613
,64
3,0
214
,689
,789
337,
917
492
,223
,99
016
9,20
1,99
610
7,51
915
6,6
15,7
7253
,836
,672
Op
en F
ore
st6
6,2
159
6,4
51,7
1333
,155,
276
00
00
00
Pla
ntat
ion
Fo
rest
00
00
00
40
,328
58,7
44
,104
20,19
3,28
6
Man
gro
ve F
ore
st9,
522
13,8
70,4
45
4,7
67,9
65
00
011
,827
17,2
77,0
43
5,92
1,79
6
Tota
l85
,104
123,
96
5,17
94
2,61
3,0
3033
7,9
174
92,2
33,9
90
169,
201,9
96
159,
674
232,
586
,919
79,9
51,7
53
UM
AM
UM
AM
UM
AM
UM
AM
UM
AM
UM
AM
UM
AM
UM
AM
UM
AM
UM
AM
Clo
sed
Fo
rest
88,0
6712
8,28
1,851
44
,09
6,8
8686
1,416
1,254
,773
,46
84
31,3
28,3
804
46
,49
067
9,50
8,4
3623
3,58
1,025
Op
en F
ore
st32
2,37
84
69,5
88,18
116
1,420
,937
00
024
5,47
935
7,57
4,11
512
2,9
16,10
2
Pla
ntat
ion
Fo
rest
00
00
00
8,0
3911
,710
,30
84
,025
,419
Man
gro
ve F
ore
st5,
04
17,
343,
016
2,52
4,16
212
,577
18,3
20,4
546
,297
,656
2,80
94
,09
1,219
1,40
6,3
57
Tota
l4
15,4
866
05,
213,
04
820
8,0
41,9
8587
3,9
94
1,273
,093
,922
437
,626
,036
722,
817
1,052
,884
,078
361,9
28,9
02

103

104
For more information, please contact:
The SECRETARIATForest Management Bureau
Visayas Avenue, Diliman, 1100Quezon City, Philippines
+632 920 8650 | +632 920 [email protected]
http://forestry.denr.gov.ph/profor/update.phpwww.profor.info