understanding the recent sino-u.s. trade conflict
TRANSCRIPT

Full Terms & Conditions of access and use can be found athttps://www.tandfonline.com/action/journalInformation?journalCode=rcej20
China Economic Journal
ISSN: 1753-8963 (Print) 1753-8971 (Online) Journal homepage: https://www.tandfonline.com/loi/rcej20
Understanding the recent Sino-U.S. trade conflict
Miaojie Yu & Rui Zhang
To cite this article: Miaojie Yu & Rui Zhang (2019) Understanding the recent Sino-U.S. tradeconflict, China Economic Journal, 12:2, 160-174, DOI: 10.1080/17538963.2019.1605678
To link to this article: https://doi.org/10.1080/17538963.2019.1605678
Published online: 22 Apr 2019.
Submit your article to this journal
Article views: 115
View Crossmark data

Understanding the recent Sino-U.S. trade conflictMiaojie Yua and Rui Zhangb
aNational School of Development, Peking University, Beijing, China; bNational School of Development,Peking University, Beijing, China
ABSTRACTTo understand Sino-U.S. trade relations, this article interprets the tradeimbalance between China and the United States from the Trumpadministration’s perspective. The Trump administration claims thatthe Chinese government’s subsidies and high import tariffs cause theSino-U.S. trade deficit, resulting in job losses in the U.S. The Trumpadministration therefore argues that imposing high tariffs on Chineseexports can resolve the deficit. The article finds that U.S. statisticalaccounting overestimates the deficit. Reducing China’s imports cannotincrease U.S. employment, and China provides the United States withlow-price and high-quality products. Chinese investors tend to investthe surplus by purchasing U.S. Treasury bonds. In addition, the UnitedStates limits Chinese investments due to ‘national security’ concerns.China’s upgrading to the high end of the global value chain is aconsequence of economic development. Therefore, the two countriesshould rebalance Sino-U.S. trade by seeking economic and tradecooperation via trade negotiations.
ARTICLE HISTORYReceived: 8 April 2019Accepted: 8 April 2019
KEYWORDSSino-US trade; tradeimbalance; value chain;statistical accounting; tariff;trade cooperation
1. Introduction
In March 2018, the U.S. Trump administration triggered a trade conflict with China byplanning to impose a 25% tariff on $50 billion worth of imports from China starting on6 July 2018. China reacted to this unilateral trade measure by imposing higher tariffs on$50 billion worth of imports from the United States, based on the rule of ‘Equal Sizeand Equal Proportion.’ On July 24, the Trump administration threatened to imposehigher tariffs on another $200 billion worth of imports from China. On August 1, theTrump administration continued to threaten to impose a 25% tariff on all imports fromChina (around $510 billion, according to U.S. statistics). On September 18, the Trumpadministration announced a 10% tariff on $200 billion worth of imports from China.China reacted by imposing 5%-10% tariffs on $60 billion worth of imports from theUnited States and filing additional charges against the U.S. trade measures on Chinesegoods at the World Trade Organization (WTO). Since then, the escalating trade conflicthas moderated, and trade talks between the two countries have been in progress sincethe meeting between President Xi and President Trump at the Group of TwentySummit on 1 December 2018. However, all these Chinese and U.S. trade measureshave posed serious challenges for the normal bilateral trade and cooperation
CONTACT Miaojie Yu [email protected] article has been republished with minor changes. These changes do not impact the academic content of the article.
CHINA ECONOMIC JOURNAL2019, VOL. 12, NO. 2, 160–174https://doi.org/10.1080/17538963.2019.1605678
© 2019 Informa UK Limited, trading as Taylor & Francis Group

relationship between China and the United States and cast a shadow on the currentglobal trade system.
The ongoing Sino-U.S. trade conflict continues to escalate, because the Trumpadministration aims to resolve the Sino-U.S. trade imbalance. Therefore, to understandthe nature of the trade imbalance between China and the United States, it is extremelyimportant to forecast future potential trade conflicts between the two countries. Tounderstand Sino-U.S. trade relations and the causes of the conflict, it is useful to start byevaluating the Sino-U.S. trade imbalance from the perspective of the Trump adminis-tration and analyzing the validity of its views and arguments.
This paper is organized as follows. Section 2 outlines the core views of the Trumpadministration toward Sino-U.S. trade relations and provides comprehensive analysis ofthe arguments raised by the Trump administration. Section 3 argues that the Sino-U.S. trade imbalance does not hurt the U.S. economy. Section 4 analyzes the funda-mental causes of the Sino-U.S. trade imbalance and evaluates the validity of the Trumpadministration’s accusations that China’s trade policies are unfair. Section 5 providesevidence of China’s upgrading along the global value chain in the long run. Section 6concludes.
2. How the trump administration views the Sino-U.S. trade imbalance
Since China joined the WTO in 2001 and became its 143rd member, the volume oftrade between China and the United States has continued to expand. China and theUnited States have benefited enormously from deepening trade liberalization.However, the United States also continues to run a trade deficit in the Sino-U.S. trade relation.
The Trump administration holds four views on the growing trade imbalancebetween China and the United States. (1) In bilateral trade between China and theUnited States, the surplus benefits China, and the deficit hurts the U.S. economy. (2)The main causes of the Sino-U.S. trade imbalance are the Chinese government’ssubsidies for Chinese exporters and unfair tariff policies. (3) To solve the tradeimbalance between China and the United States, the only solution is to suppressChina’s exports by imposing high tariffs on Chinese exports to the United States. (4)The goal of resolving the Sino-U.S. economic and trade imbalances is to force China tocontinue specializing in the low-value-added segments of the global value chain, so thatthe United States can maintain its monopoly market power in the high-value-addedsegments of the global value chain.
‘Made in China 2025’ aims to build up and strengthen China’s capacity as a globaltrade power. Keeping China from achieving this goal has become the main motivationfor the United States’ continued expansion of the trade conflict. This is the mostimportant view of the Trump administration, which believes that doing so can preventthe Chinese economy from catching up with the U.S. economy.
The Trump administration claims that the United States has been hurt significantlyby the Sino-U.S. trade imbalance. As shown in Figure 1, since China’s accession to theWTO, trade between China and United States has been increasing over time. Thebilateral trade volume between China and the United States has surged, from
CHINA ECONOMIC JOURNAL 161

$98 billion in 2001 to $524 billion in 2016, at an annual growth rate of 14%. China andthe United States have thus become each other’s most important trading partners.
Meanwhile, the trade imbalance between China and the United States has alsogrown. According to the statistics of the General Administration of Customs ofChina, the U.S. trade deficit with China was $275.8 billion in 2017. According toU.S. statistics, the trade imbalance between China and the United States is even larger.The United States reports $516 billion worth of imports from China and $150 billionworth of exports to China in 2017, resulting in a deficit of $370 billion.
The discrepancy between the two countries’ measures of the deficit hinges on how tomeasure China’s exports. China’s statistical agency does not include Hong Kong’sexports to the United States in China’s total exports to the United States. This isbecause exports from Hong Kong are mainly re-exports from not only mainlandChina, but also, to a large extent, from many other Association of Southeast AsianNations countries to the United States. In contrast, the U.S. statistical agency simplyincludes all exports from Hong Kong in calculating the total exports from China to theUnited States, ignoring the large proportion of re-exports, and therefore tends tooverestimate the size of the trade imbalance between China and the United States.
Nevertheless, the difference in statistical accounting practices between China and theUnited States does not affect the share of the Sino-U.S. trade imbalance in the totalU.S. deficit. Regardless of the statistical method, the Sino-U.S. trade deficit accounts fortwo-thirds of the total U.S. trade deficit. Table 1 reports the two industries featuring thelargest Sino-U.S. trade imbalances, textiles and mechanical and electronic equipment, aswell as the industry that is subject to the most anti-dumping and countervailinginvestigations, steel and aluminum.
Moreover, the Trump administration is concerned about the labor market conse-quences of the Sino-U.S. trade imbalance. According to the estimates of Autor, Dorn,and Hanson (2013), across various zones in the United States, the U.S. manufacturingindustry has lost nearly three million jobs due to import competition from China.
-100.00
0.00
100.00
200.00
300.00
400.00
500.00
600.00
700.00
1984 1987 1990 1993 1996 1999 2002 2005 2008 2011 2014 2017
US$
, bill
ions
Sino-U.S. Bilateral Trade, 1984-2018
Imports from the US Exports to the US Trade surplus
Figure 1. Sino-U.S. Bilateral Trade.Source: CEIC database.
162 M. YU AND R. ZHANG

Similarly, Pierce and Schott (2016) find that U.S. manufacturing industries that aremore exposed to China’s exports, due to the United States granting Permanent NormalTrade Relations status to China, have seen larger declines in manufacturing employ-ment. In short, the Trump administration holds an ingrained ‘Mercantilist’ view – thata trade surplus is always beneficial for a country, while a trade deficit will definitelyimpair a country’s welfare. Such a view is not without political basis. Using U.S. electiondata, Autor et al. (2016) find that regions that have been hit harder by importcompetition from China have been more politically polarized in congressional elections,and, more importantly, those regions have shifted toward the Republican candidate inpresidential elections.
The Trump administration tends to blame the Chinese government’s large subsidies forexporters and high tariffs for the huge bilateral imbalance in Sino-U.S. trade. First, theTrump administration believes that the Chinese government has provided a large amountof export subsidies to export firms. In particular, because China has initiated a clear-cutindustrial policy plan, ‘Made in China 2025,’ a considerable number of high-tech sectors areheavily subsidized, especially integrated circuits and machines and equipment used toproduce semiconductors and integrated circuits. As a result, the subsidies effectivelylower the production cost of these industrial products, undermining the advantages ofU.S. firms competing within the same product segments in the internationalmarket. Second, the Trump administration argues that China’s high import tariffs havesignificantly hampered U.S. exports to China. For example, China’s import tariff onautomobiles is 25%, while the U.S. average import tariff on automobiles is 2.5%. Third,the Trump administration accuses China of restricting the maximum shareholding of
Table 1. Sino-U.S. bilateral trade, selected industries, 1993–2016 (US$, billions).Steel Textile Mechanical & electronic equipment
Year Exports Imports Exports Imports Exports Imports
1993 3.3 0.2 2.9 3.81994 3.2 0.9 4.6 4.51995 3.2 1.4 5.5 5.11996 3.2 1.1 6.5 5.61997 3.6 1.0 8.3 5.41998 3.8 0.4 10.5 6.51999 4.0 0.2 12.5 8.02000 4.6 0.3 16.4 9.22001 4.6 0.3 18.0 11.42002 5.4 0.4 26.2 11.22003 7.2 1.1 39.4 11.42004 9.1 2.3 56.7 15.52005 16.7 2.1 72.8 16.82006 19.9 3.0 92.6 21.42007 22.9 2.4 107.9 23.72008 6.92 1.22 23.3 2.6 113.5 26.22009 1.51 0.90 24.6 1.7 104.7 22.32010 1.63 0.63 31.5 3.1 132.9 28.72011 2.58 0.65 35.1 4.2 150.0 29.52012 2.88 0.57 36.2 5.0 163.4 29.02013 2.75 0.58 39.0 3.8 169.3 38.32014 4.02 0.69 41.9 2.5 182.9 38.32015 2.85 0.58 44.8 2.0 179.9 35.72016 1.71 0.45 42.4 1.3 172.9 31.3
Source: CEIC database.Note: The values are for China’s exports to and imports from the United States.
CHINA ECONOMIC JOURNAL 163

foreign investors, especially U.S. investors, to 25%. Fourth, the Trump administrationbelieves that China lacks effective intellectual property protection and even instructs state-owned enterprises to acquire U.S. companies, to ‘plagiarize’ their high-tech technologies.
Based on such an understanding, the Trump administration has moved toward theUnited States imposing high tariffs on imports from China, to balance and compensatethe trade imbalance between the two countries. By doing so, the United States cancontinuously maintain its position in the high-value-added segments of the global valuechain, monopolizing and dominating the two ends of the ‘smile curve’ of the globalvalue chain.1 Thus, the United States aims to keep China in the low-value-addedsegments of the global value chain and specializing in the middle segments of the‘smile curve.’
The four arguments above constitute the Trump administration’s core views on thecurrent trade imbalance between China and the United States, as well as the adminis-tration’s starting point in designing trade and diplomatic policies. The first three coreviews of the Trump administration are only held by the administration itself and its fewcore supporters. The majority of the economists around the world are clearly opposedto these views, because they deviate from basic facts or fundamental economic ratio-nales. However, the last core idea – that China should remain at the low-value-addedsegments of the global value chain while the United States should keep its monopolisticposition in the high-value-added segments of the global value chain – is not only heldby the Trump administration, but also by some U.S. economists. It is therefore criticalto analyze and evaluate the causes and consequences of the Sino-U.S. trade imbalanceto disentangle facts from opinions.
3. Sino-U.S. trade imbalance does not hurt the U.S. economy
Since China’s accession to the WTO, the Sino-U.S. trade imbalance has continued towiden. But the trade imbalance between China and the United States does not hurt theU.S. economy. Instead, if the U.S. government can properly design and apply itsrelevant policies, the Sino-U.S. trade imbalance could benefit the United States, forthe following three reasons.
First, China’s expanding exports provide U.S. consumers with many products at lowprices and good quality. The Chinese manufacturing sector covers almost the wholeindustrial chain. Within the U.S. imports from China, consumer goods account forabout 32%, intermediate products account for about 27%, and capital goods account forabout 41%. If the United States imposes high tariffs on Chinese products, the amountsimported from China will be significantly reduced. In such a case, the United Stateswould have to substitute imports from other countries for imports previously fromChina, which would significantly increase U.S. domestic prices.
Amiti, Redding, and Weinstein (2019) and Fajgelbaum et al. (2019) find that importtariff burdens are completely passed through to domestic consumers. The resulting aggre-gate real income loss is $1.4 billion per month, according to Amiti, Redding, andWeinstein(2019), or an aggregate welfare loss of $7.8 billion, according to Fajgelbaum et al. (2019). Inan earlier study, Amiti et al. (2017) find that China’s WTO entry reduced the U.S. priceindex of manufactured goods by 7.6% over 2000 to 2006. More broadly, as discussed byFeenstra (2018), opening up to trade can improve an importing country’s welfare by
164 M. YU AND R. ZHANG
increasing product varieties, facilitating creative destruction, fostering competition, andlowering market power. Costinot and Rodríguez-Clare (2018) find that the U.S. gains fromtrade are equivalent to 2%-8% of U.S. gross domestic product (GDP).
Second, taking a step back, reducing imports from China would not necessarilycreate more jobs in the United States. For example, the United States pays $10 fora shirt produced by China, $12 for a shirt produced by Vietnam, and $13 for a shirtproduced by United States itself. Because China’s price is the lowest, China possessesthe distinct comparative advantage in shirt production, and the United States importsshirts from China. The Trump administration blames China for ‘robbing’ jobs in theUnited States and the decline in manufacturing employment. However, if the UnitedStates imposes a 25% tariff on China, the price of a shirt made in China would be $12.5,which is higher than the price of a shirt made in Vietnam ($12), so the United Stateswould divert its imports of shirts from China to Vietnam, rather than shift the demandto U.S. domestic producers. Such a trade diversion effect hampers the creation ofU.S. domestic jobs by imposing higher tariffs only on China’s products.
Moreover, with global input-output linkages nowadays, U.S. manufacturers relyheavily on imported intermediate inputs to produce. Imposing higher tariffs onChina’s products would thus potentially reduce U.S. employment, by increasing theimported input costs of U.S. manufacturing firms. For example, Wang et al. (2018) findthat intermediate inputs imported from China help downstream U.S. firms to expandtheir employment through the global supply chain, especially employment in the servicesector.
Summing the negative competition effect of imports on the own and upstreamindustries and the positive supply chain effect of imports on the downstream industries,the net effect of imports from China on U.S. employment turns out to be positive 1.27%across U.S. regions. This finding overturns the conventional perception that increases inimports from China negatively impact the U.S. labor market. Fort, Pierce, and Schott(2018) document that the decline in U.S. manufacturing employment started in the late1970s, and one-fourth of the manufacturing decline is explained by firm exit. They findthat the decline in manufacturing employment has been driven by not just trade, butalso technology (such as automation). Lee and Yi (2018) use a multi-country generalequilibrium model to show that the decline in trade cost between China and the UnitedStates led both countries to specialize in their sectors of comparative advantage,increasing the skill premia in both countries. Therefore, trade opening also causesdistributional effects, and the U.S. government should also use redistributive mechan-isms to ameliorate the inequality induced by globalization. Lyon and Waugh (2018) findthat a progressive tax system is valuable in redistributing the gains from trade acrossdifferent workers.
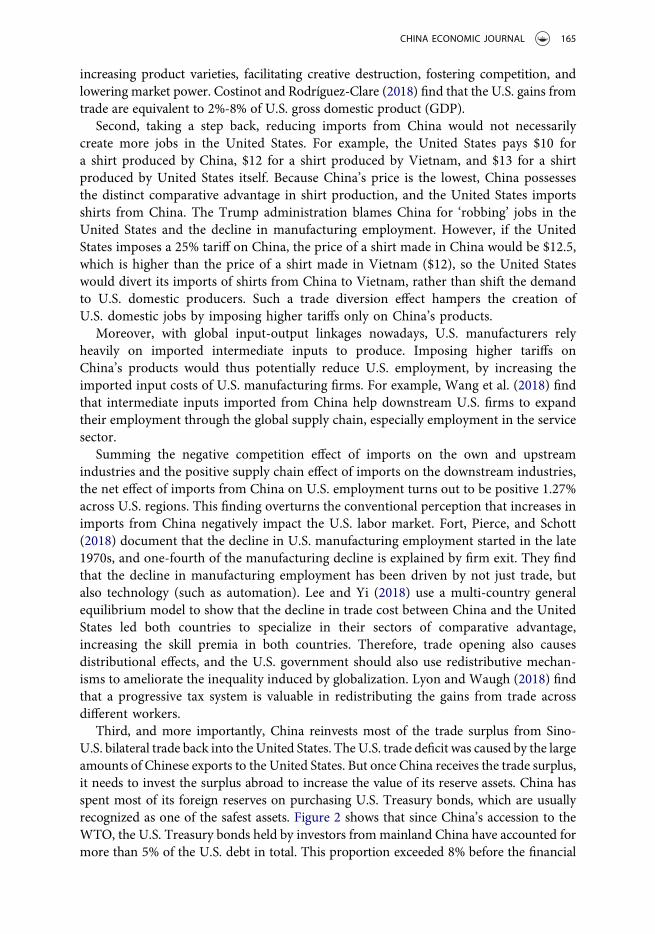
Third, and more importantly, China reinvests most of the trade surplus from Sino-U.S. bilateral trade back into theUnited States. The U.S. trade deficit was caused by the largeamounts of Chinese exports to the United States. But once China receives the trade surplus,it needs to invest the surplus abroad to increase the value of its reserve assets. China hasspent most of its foreign reserves on purchasing U.S. Treasury bonds, which are usuallyrecognized as one of the safest assets. Figure 2 shows that since China’s accession to theWTO, the U.S. Treasury bonds held by investors frommainland China have accounted formore than 5% of the U.S. debt in total. This proportion exceeded 8% before the financial
CHINA ECONOMIC JOURNAL 165

crisis. Meanwhile, the U.S. Treasury bonds held by investors from mainland Chinaaccounted for more than 35% of China’s current account balances over the years. Fromthis perspective, China is the United States’ creditor, and the United States is borrowingChina’s wealth and resources. Therefore, the United States has benefited twice from itstrade relations with China: U.S. consumers and firms enjoy the low prices of Chineseproducts, and the U.S. economy borrows from China to develop its own economy.
4. Comparative advantage determines the Sino-U.S. trade imbalance
The Trump administration claims that the bilateral trade surplus was caused by Chinesegovernment subsidies for exporters or unfair trade policies. But the key source of thetrade imbalance between China and the United States is comparative advantage due tothe difference in factor endowments. The following analysis disentangles different typesof exports: labor-intensive products and capital-intensive products.
For labor-intensive products, China’s trade surplus arises from its advantage of lowlabor costs. The cost of labor in China is only $750 per month; in the United States, it isabout $4,200 per month, more than five times higher than in China. However, as shownin Figure 3, China’s labor productivity has reached 45% of that of the United States. Inother words, for a labor-intensive product, China has obvious comparative advantage.Such a comparative advantage has led to a large trade surplus in China’s labor-intensiveproducts.
For capital-intensive products, a large trade surplus is the inevitable consequence ofthe division of the global value chain. The United States is in the upstream of theindustrial chain, and the United States, South Korea, and other countries export a largenumber of intermediate input products of parts and core components to China. Chinaprocesses and assembles all these intermediate products into final products, leveragingits comparative advantage in the labor-intensive tasks (Figure 4). China then exports
0.00%
5.00%
10.00%
15.00%
20.00%
25.00%
30.00%
35.00%
40.00%
45.00%
0.00
200.00
400.00
600.00
800.00
1,000.00
1,200.00
1,400.00
2001
2002
2003
2004
2005
2006
2007
2008
2009
2010
2011
2012
2013
2014
2015
2016
2017
2018
China's Holdings of U.S. Debt, 2001-2018
Mainland China's holding of US debt (billion US)
share of total US debt
share of China foreign reserve
Figure 2. China’s Holdings of U.S. Debt, Size and Share.Source: Wind Economic Database.
166 M. YU AND R. ZHANG

the final products to the United States, the European Union, and other places.Therefore, although China runs a huge trade surplus in the statistics, the actual value-added attributed to China is small. Take the iPhone 4 as an example. The price of thefinished product exported from China to the United States is $179, but China’s valueadded is only $6.5. The other $172.5 is from raw materials and intermediates producedby various countries around the world.
Therefore, based on the analysis above, China’s trade surplus is an inevitable con-sequence of economic development and the division of the global value chain, and it isclosely related to the income gap between China and the United States. It is not causedby China’s subsidies to its domestic companies. Even if China and the United States did
-6.00%
-4.00%
-2.00%
0.00%
2.00%
4.00%
6.00%
8.00%
00.05
0.10.15
0.20.25
0.30.35
0.40.45
0.5
1998 2000 2002 2004 2006 2008 2010 2012 2014
China's TFP Level and Growth, 1998-2014
China TFP relative to US (US=1) China TFP growth in %
Figure 3. China’s total factor productivity relative to the United States.Source: Penn World Table 9.0.
0.00%
10.00%
20.00%
30.00%
40.00%
50.00%
60.00%
1993 1995 1997 1999 2001 2003 2005 2007 2009 2011 2013 2015 2017
Share of Processing Exports in Total Exports, 1993-2018
Processing with assembly Processing with inputs All processing
Figure 4. China’s processing exports.Source: CEIC database.
CHINA ECONOMIC JOURNAL 167
not implement any strategic trade policies, the Sino-U.S. trade imbalance would remain,not only from the past two decades, but also in the future for a long period of time.
Here we analyze the four arguments that the Trump administration usually uses toaccuse China of unfair trade policies. The first argument is that the Sino-U.S. tradeimbalance is due to the high tariffs that China imposes on U.S. imports. For example,China imposes a 25% tariff on automobiles produced in the United States, while the UnitedStates only imposes a 2.5% tariff on China-produced automobiles. However, although thenumbers are all correct, this argument is invalid. The reasons are as follows. First, China’s25% tariff on U.S. automobiles before 1 July 2018 was clearly stipulated when China joinedthe WTO, and it was also agreed by the United States. Thus, China is acting in accordancewith theWTO rules. According to theWTO regulations, developing economies can imposehigher tariffs on imports. China’s GDP per capita in 2017 was about $9,400. According tothe World Bank’s categorization, China is still a developing economy. Therefore, althoughChina’s economy has developed rapidly in the 40 years of reform and opening up, it has notyet become a developed economy. Of course, when China fully develops to a high-incomeeconomy in the future, its tariffs should also be reduced to the level of developed economiesaccordingly.
Second, if the United States has any issues with China’s tariff policies, it shouldinitiate a complaint with the WTO Dispute Resolution Committee. For the UnitedStates to raise its tariffs unilaterally violates the WTO regulations and undermines theeffectiveness of the WTO dispute resolution mechanism.
Third, compared with other developing economies, China’s import tariff on auto-mobiles is not high, and the U.S. tariff on automobiles is not lower than the tariffsimposed by other developed economies. For example, Japan’s import tariff on auto-mobiles is already zero.
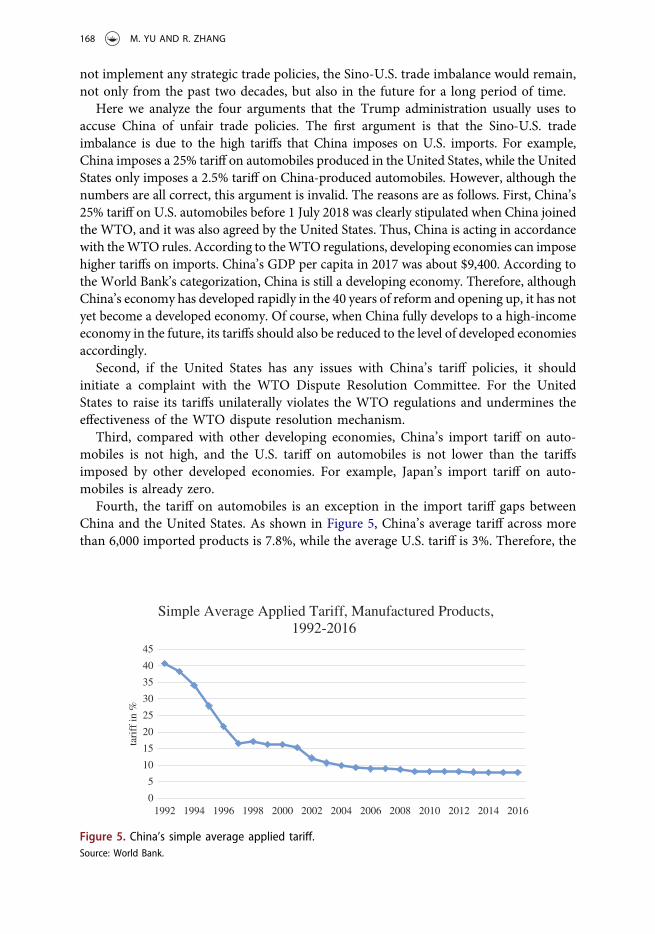
Fourth, the tariff on automobiles is an exception in the import tariff gaps betweenChina and the United States. As shown in Figure 5, China’s average tariff across morethan 6,000 imported products is 7.8%, while the average U.S. tariff is 3%. Therefore, the
0
5
10
15
20
25
30
35
40
45
1992 1994 1996 1998 2000 2002 2004 2006 2008 2010 2012 2014 2016
tari
ff in
%
Simple Average Applied Tariff, Manufactured Products, 1992-2016
Figure 5. China’s simple average applied tariff.Source: World Bank.
168 M. YU AND R. ZHANG

actual gap in average tariffs between China and the United States is not as large as whatthe Trump administration claims.
The second argument of the Trump administration is that the Chinese government hasprovided a large amount of export subsidies for exporters. Mainly, the Trump administra-tion claims that China has subsidized the key manufacturing industries that China intendsto develop in the future. This argument is obviously invalid. First, the WTO does notprohibit its member states from providing industrial subsidies. In contrast, subsidies forcertain industries, especially green industries, are even encouraged. TheWTO requires thatits member countries be transparent about their industrial subsidies, and China complieswith this requirement. In particular, Chinese above-scale manufacturing firms explicitlyreport the amounts of subsidies received from the state in their financial statements. Bycontrast, the United States has frequently used such industrial subsidies as well.
Second, the United States usually imposes non-tariff barriers, such as export sub-sidies, to protect its own industries. For example, in the U.S.-Japan trade war in the1980s, the United States directly imposed high tariffs on Japan’s motorcycles exportedto the United States, to protect the Harley-Davidson. Similarly, the United Statesimposed a voluntary export restraint to limit the quantity of Japanese vehicles exportedto the United States in the early 1980s. Before 2005, the United States, together with theEuropean Union and Canada, imposed import quotas on certain textile and clothingproducts produced by developing economies. The United States has also used strictimport quotas for white sugar, to protect its sugar production industry. Recently, theTrump administration issued a subsidy of $12 billion to agricultural products inresponse to the Chinese government’s high tariff on U.S. soybeans.
The third argument of the Trump administration in accusing China of unfair tradepolicies has to do with China’s shareholding restriction on foreign-invested companies,especially U.S. investors, which is 25% at maximum. As for this complaint, the bottomline is that China has always been willing to attract foreign direct investment. In 2015,foreign direct investment in China amounted to $135 billion. In the first 35 years ofChina’s reform and opening up, foreign investors in China mostly enjoyed so-called‘super national treatment.’ To be specific, foreign-invested companies in China canenjoy the preferential policy of ‘Exemption for Two Years, Discount for Three Years.’That is, in the first two years of their establishment, foreign-invested enterprises areexempted from paying interest and taxes, and in the following three years, they enjoya discounted interest and tax rate of 17%, which is half the regular corporate tax rate.Therefore, the shareholding restriction is consistent with the rationale of ‘GradualReform.’ More importantly, the investment restriction is not particularly targeted atU.S. investors.
By contrast, the United States has often conducted administrative intervention onChinese companies’ investments in the United States and frequently refused thoseinvestments for reasons of ‘national security.’ The usual argument from the UnitedStates is that Chinese companies would obtain advanced technologies from the acquiredcompanies. However, in international investment, obtaining the advanced technologiesof another company is exactly the purpose of mergers and acquisitions. Entrepreneursare not philanthropists, and the goal of mergers and acquisitions is to maximizeexpected profits, a purely commercial behavior that should be respected by a marketeconomy.
CHINA ECONOMIC JOURNAL 169

Of course, in certain cases that really involve national security issues, the UnitedStates should take actions on the acquisition, given that it would affect the country’snational security. However, this does not always seem to be the case. Two years ago,when a Chinese company acquired a pork-selling company in California, theU.S. government refused the transaction due to concerns about national security,which is extremely confusing and unreasonable. In addition, the United States haslong refused to allow Chinese state-owned enterprises to acquire U.S. companies.Recently, the U.S. government has intensified its stipulations, by refusing any invest-ments or acquisitions if the participating Chinese companies have any committees ofthe Communist Party of China. Obviously, such an action goes beyond the scope ofeconomic disputes. Furthermore, many private enterprises from China have beenblocked by the United States because of ‘national security’ concerns. The failure ofSany Heavy Industry, which is a private enterprise, to acquire U.S. companies last yearis another example.
Finally, the fourth argument of the Trump administration is to accuse China of poorintellectual property protection. Admittedly, China’s intellectual property protection isnot as strong as that in the United States, and many areas need further strengthening.However, two caveats should be recognized. First, the protection of intellectual propertyrights is closely related to the income and development stage of an economy.Intellectual property protection in high-income countries is relatively complete, whileintellectual property protection in low- and middle-income countries is still catchingup. For example, a textbook of ‘Principles of Economics’ sells for about $100 in theUnited States, but the same package of contents sells for around $26 in Hong Kong,with the notice ‘Not Sold in the US or Canada.’ Because firms realize that per capitaincome in Asia is generally lower than that in the United States and Canada, they needto implement ‘pricing to market.’
Second, China’s intellectual property protection has made great progress andadvancement since China’s accession to the WTO. Compared with countries ata similar per capita income level, China’s current intellectual property protection isremarkable.
5. China’s value-added upgrading is the consequence of economicdevelopment
The Trump administration’s motivation for launching a large-scale trade conflict withChina is to keep the United States in the high-value-added segments of the global valuechain and China in the low-value-added segments. Clearly, such an idea reflects typicalthoughts of historical nihilism and hegemony.
First, from a historical perspective, the United States was not always in the high-value-added segments of the global value chain. In 1894, the United States surpassed theUnited Kingdom in industrial output and became the world’s largest industrial country.Even so, the U.S. economy did not stand out among world economies by reaching thehigh-value-added segments of the global value chain until after World War II. In otherwords, the United States did not reach the high end of the global value chain in the verybeginning, and its rise in the value added of industrial products took a rather long
170 M. YU AND R. ZHANG

period of time. By the same token, it is unreasonable for the United States to restrictChina and other countries from upgrading along the global value chain.
Second, if China manages to upgrade from the low end to the middle and high endof the global value chain, the United States will not suffer losses but rather gain fromChina’s upgrading. The economic rationale is that increases in market size will reducethe fixed costs of all exported products, incentivizing manufacturers to increase outputsand thus achieve economies of scale in production.
Third, it is not viable for China to stay in the middle and low end of the global valuechain in the future. China has become the ‘world’s factory’ of global industrial products,mainly thanks to its relatively low labor costs compared with advanced economies suchas the United States, Europe, and Japan. However, China does not show significantcomparative advantage in costs of labor when compared with Southeast Asian coun-tries. As indicated in Figure 6, the wages of blue-collar workers (represented bymanufacturing workers) and white-collar workers (represented by manufacturing man-agers) in China are already at the high end of those in Southeast Asian countries.Currently, China is still exporting a large number of labor-intensive products to Europeand the United States. This is not because China still possesses comparative advantagein labor-intensive products compared with Southeast Asian countries, but simplybecause Southeast Asian countries with lower labor costs than China have relativelysmall export scales and are currently not able to take over the whole of China’s hugemarket shares in the developed economies.
Fourth, China has the capacity to upgrade along the global value chain. This can beseen by examining the export quality improvement of China’s industrial products,especially after 2000 (Yu 2015; Ing, Yu, and Zhang 2018). As indicated by Figure 7,
0 1000 2000 3000 4000 5000 6000 7000 8000Australia
New ZealandHong Kong
South KoreaSingapore
TaiwanMalaysia
ChinaThailand
IndonesiaPhilippines
IndiaVietnamPakistan
Sri LankaMyanmarCambodia
LaosBangladesh
Wages of Manufacturing Manager and Worker
wage of manufacturing worker (US$ per month)
wage of manufacturing manager (US$ per month)
Figure 6. Comparing costs of labor: White-Collar and Blue-Collar workers.
CHINA ECONOMIC JOURNAL 171

the median export quality index of Chinese manufacturing exports increased from 1.07in 2000 to 1.36 in 2012, an increase of around 27%. Therefore, China has been offeringproducts with not only low prices, but also high quality. According to the observationof the increasing quality of China’s manufacturing exports, China’s value added in itsexports should also be rising, which is a natural outcome of economic development.
6. Cooperation is the only solution to the Sino-U.S. trade imbalance
The Trump administration seems to believe that by imposing high tariffs on China’sexports, the United States can resolve the large Sino-U.S. trade imbalance and, at thesame time, expand employment. However, such measures will not work, for severalreasons. First, if the United States imposes high tariffs on imported products, China andother countries will certainly retaliate by imposing high tariffs on U.S. products, triggeringa large-scale trade conflict and trade war. In this case, on the one hand, consumer prices inthe United States will rise and consumer surplus will decrease accordingly. On the otherhand, exports from the United States to China will be hampered, reducing domesticmanufacturing production and employment.
Second, high tariffs on Chinese products cannot bring back lost jobs to the United States.Instead, high tariffs on Chinese products would increase the employment opportunities inother Southeast Asian countries through trade diversion. Guo et al. (2018) find that theSino-U.S. trade war will cost the United States an economic loss of about 0.7% of its totalGDP, which amounts to around $200 billion today.
Compare the trade policies of the Trump administration and the Obama adminis-tration. The Obama administration also tried to reduce the Sino-U.S. trade imbalance,but it adopted more sensible measures and policies. In contrast to the Trump admin-istration, the Obama administration did not impose high tariffs or trade barriers onChinese exports. Meanwhile, it also aimed to facilitate China’s imports from the UnitedStates. Therefore, from the perspective of the United States, Obama proposed the planof ‘doubling imports within five years.’ The advantage of this plan is that both Chinaand the United States have increased economies of scale and trade, making the ‘pies’
1
1.05
1.1
1.15
1.2
1.25
1.3
1.35
1.4
2000 2001 2002 2003 2004 2005 2006 2007 2008 2009 2010 2011 2012 2013
Median China Export Quality Index, 2000-2013
Figure 7. Median China export quality index.Source: Ing, Yu, and Zhang (2018).
172 M. YU AND R. ZHANG

bigger. By expanding the size of trade, the gains from trade of the two countries alsoincrease. The Chinese government has always promoted such types of economic andtrade cooperation to rebalance Sino-U.S. trade.
In short, the four main misunderstandings of the Sino-U.S. trade imbalance inducedthe Trump administration to trigger and expand the recent Sino-U.S. trade conflict. Thetrade imbalance between China and the United States has resulted from the differencesin factor endowments and global value chain positions of the two countries. Therefore,escalating the Sino-U.S. trade conflict cannot resolve the Sino-U.S. trade imbalance. Theonly solution to the Sino-U.S. trade imbalance is to achieve trade cooperation througheffective trade negotiations and other dispute resolution mechanisms.
Note
1. The concept of ‘smile curve’ was first proposed by Stan Shih, the founder of Acer Inc.According to Shih’s observation, in the personal computer industry, the left and upstreamend of the value chain focuses on technology and patent, the middle segment of the valuechain refers to manufacturing and assembly, and the right and downstream end of thevalue chain concentrates on marketing and branding. Usually, the left and right ends are ofhigher value-added, while the middle segment is of lower value-added. Therefore, a smilecurve is formed when one relates a segment’s value-added to its position in the valuechain.
Disclosure statement
No potential conflict of interest was reported by the authors.
References
Amiti, M., M. Dai, R. C. Feenstra, and J. Romalis. 2017. “How Did China’s WTO Entry BenefitUS Consumers?” No. w23487. Cambridge, MA: National Bureau of Economic Research.
Amiti, M., S. J. Redding, and D. E. Weinstein. 2019. “The Impact of the 2018 Trade War on USPrices and Welfare.” No. w25672. Cambridge, MA: National Bureau of Economic Research.
Autor, D., D. Dorn, G. Hanson, and K. Majlesi. 2016. “Importing Political Polarization? theElectoral Consequences of Rising Trade Exposure.” No. w22637. Cambridge, MA: NationalBureau of Economic Research.
Autor, D., D. Dorn, and G. H. Hanson. 2013. “The China Syndrome: Local Labor Market Effectsof Import Competition in the United States.” American Economic Review 103 (6): 2121–2168.doi:10.1257/aer.103.6.2121.
Costinot, A., and A. Rodríguez-Clare. 2018. “The US Gains from Trade: Valuation Using theDemand for Foreign Factor Services.” Journal of Economic Perspectives 32 (2): 3–24.doi:10.1257/jep.32.2.3.
Fajgelbaum, P. D., P. K. Goldberg, P. J. Kennedy, and A. K. Khandelwal. 2019. “The Return toProtectionism.” No. w25638. Cambridge, MA: National Bureau of Economic Research.
Feenstra, R. C. 2018. “Alternative Sources of the Gains from International Trade: Variety,Creative Destruction, and Markups.” Journal of Economic Perspectives 32 (2): 25–46.doi:10.1257/jep.32.2.25.
Fort, T. C., J. R. Pierce, and P. K. Schott. 2018. “New Perspectives on the Decline of USManufacturing Employment.” Journal of Economic Perspectives 32 (2): 47–72. doi:10.1257/jep.32.2.47.
CHINA ECONOMIC JOURNAL 173

Guo, M., L. Lu, L. Sheng, and M. Yu. 2018. “The Day after Tomorrow: Evaluating the Burden ofTrump‘S Trade War.” Asian Economic Papers 17 (1): 101–120. doi:10.1162/asep_a_00592.
Ing, L. Y., M. Yu, and R. Zhang. 2018. “The Evolution of Export Quality: China and Indonesia.”In World Trade Evolution, edited by L. Y. Ing and Y. Miaojie, 261–302. London, UnitedKingdom: Routledge.
Lee, E., and K. M. Yi. 2018. “Global Value Chains and Inequality with Endogenous LaborSupply.” Journal of International Economics 115: 223–241. doi:10.1016/j.jinteco.2018.09.006.
Lyon, S. G., and M. E. Waugh. 2018. “Redistributing the Gains from Trade through ProgressiveTaxation.” Journal of International Economics 115: 185–202. doi:10.1016/j.jinteco.2018.09.008.
Pierce, J. R., and P. K. Schott. 2016. “The Surprisingly Swift Decline of US ManufacturingEmployment.” American Economic Review 106 (7): 1632–1662. doi:10.1257/aer.20131578.
Wang, Z., S. J. Wei, X. Yu, and K. Zhu. (2018). “Re-Examining the Effects of Trading with Chinaon Local Labor Markets: A Supply Chain Perspective.” No. w24886. Cambridge, MA: NationalBureau of Economic Research.
Yu, M. 2015. “Processing Trade, Tariff Reductions and Firm Productivity: Evidence fromChinese Firms.” Economic Journal 125 (585): 943–988. doi:10.1111/ecoj.12127.
174 M. YU AND R. ZHANG