understanding the lithosphere in the vicinity of … · to using techniques that depend on...
TRANSCRIPT

AN ORGANISATION FOR A NATIONAL EARTH SCIENCE INFRASTRUCTURE PROGRAM
Understanding the lithosphere in the vicinity of seismic line 08GA-OM1 from Passive Seismic StudiesB.L.N. KennettResearch School of Earth SciencesThe Australian National University

Passive Seismic Studies
• The regional and global distribution of earthquakes means that Australia is well suited to using techniques that depend on exploiting recordings of distant earthquakes
• Such records can be used for :– Surface wave tomography: mostly for mantle structure– Receiver function studies: crustal structure– Body wave tomography: 3-D images of the crust and
uppermost mantle
Earth Imaging 2

ANU Portable Seismic Experiments (BB) 1992-2010

Sources and stations for surface wave tomography

Path coverage for surface wave tomography

Continent wide images of seismic wavespeed
6

7
Anisotropy in seismic wavespeed and major gradient zonesSections from the surface wave tomography results in the vicinity of line 08GA-OM1 (indicated by red line.
Anisotropy switches from dominantly east-west at 100km to close to the absolute plate direction at 200kmdepth
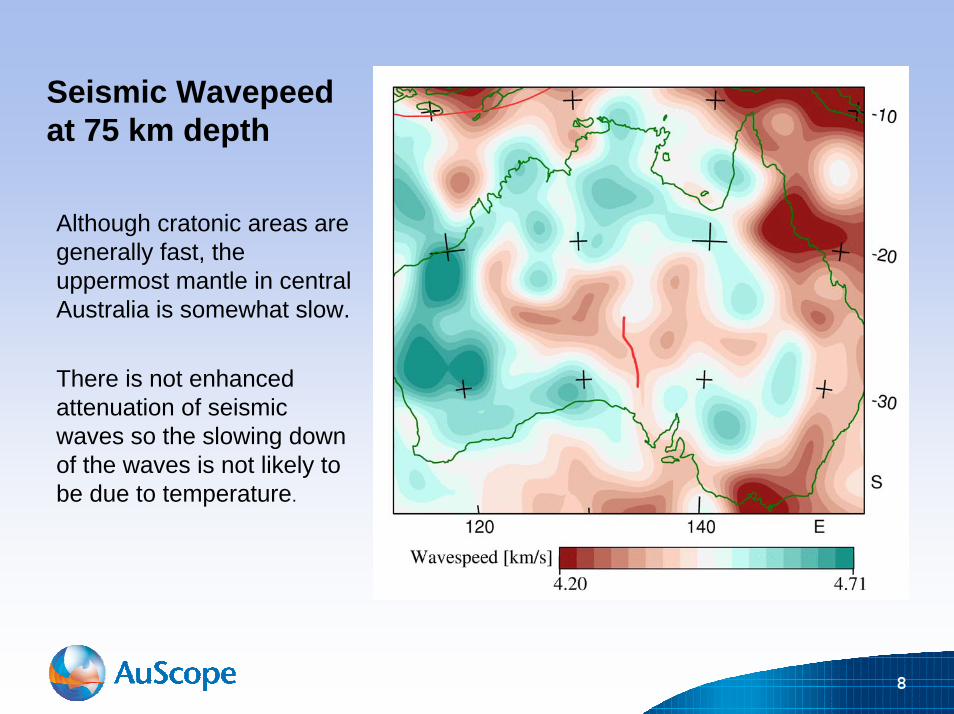
Seismic Wavepeed at 75 km depth
Although cratonic areas are generally fast, the uppermost mantle in central Australia is somewhat slow.
There is not enhanced attenuation of seismic waves so the slowing down of the waves is not likely to be due to temperature.
8

9
Comparison of MT results with seismic tomography for line 08GA-OM1
The sections are on approximately the same scale
The gradients in mantle properties correlate well
MT

Reciever Function studies
• The receiver function technique exploits the seismic energy following the onset of a P wave.
• The source response is deconvolved by using the main P energy and converted S wave energy is emphasised.
• The conversions are sensitive to discontinuities or zones of strong gradient in wavespeed, results can be affected by horizontal gradients as well as vertical.
• It is normally possible to recognise the Moho and the depth can be used as a check and calibrator for the reflection studies.
10

Comparison of Moho Depth estimatesThe map summarises all the estimates for Moho depth in the neighbourhood of the 08GA-OM1 line.Triangles denote depth estimates from reflection work and refraction.Diamonds, pentagons and circles represent results from Receiver Functions.There is very good correspondence between the different approaches
11

12
Moho depth estimates and surface geology

Receiver Function sampling at the Moho- projected onto reflection section
BL20BL21 BL19 BL17BL18
13

Receiver Function sampling at the Moho- projected onto reflection section
BL21 BL20 BL19 BL18 BL17
14
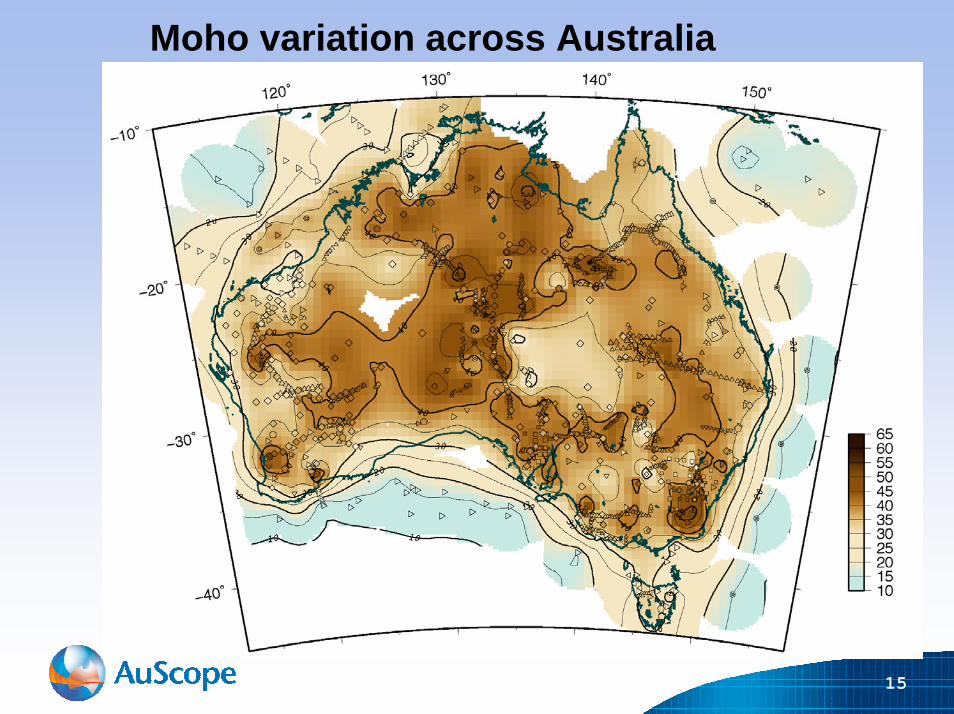
Moho variation across Australia
15

Moho depth estimates and solid geology
16

Seismic Tomography with Ambient Noise I
E. Saygin Ph.D. Thesis 2007E. Saygin Ph.D. Thesis 2007
• A new style of seismic tomography information on crustal seismic wavespeeds in the top 10 km and the presence of deep sedimentary basins
• The method is based on using the time-averaged cross-correlation of long sequences of ambient noise recordings at pairs of stations to extract surface wave trains for the path between the stations
• Over 1100 paths have been analysed from all the RSES portable broad-band stations and the limited number of permanent high-quality stations to provide dense coverage of the whole continent.
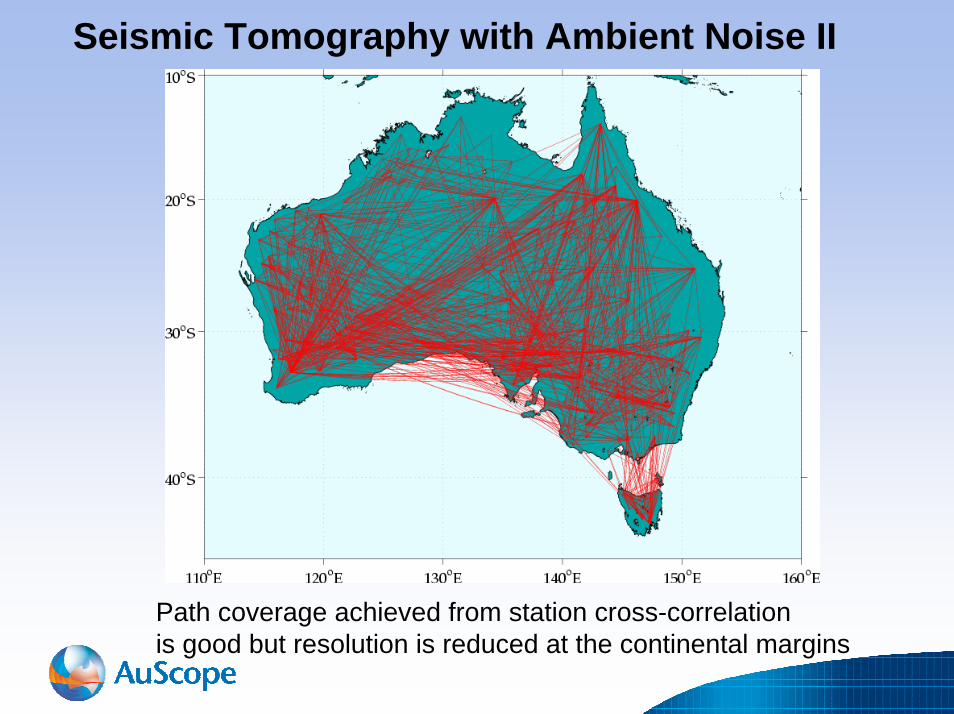
Seismic Tomography with Ambient Noise II
Path coverage achieved from station cross-correlationis good but resolution is reduced at the continental margins

Seismic Tomography with Ambient Noise III
Map at 5s period –dominated by influence of sediments
Map at 12.5s period – main influence from crustal variations
19

Current coverage for passive seismic studies
20
Acknowledgments
• Surface Wave Tomography: S. Fishwick, M.Heintz• Receiver Functions: E. Vanacore, M. Salmon• Reflection Sections: E. Saygin• Moho map compilation: M. Salmon• Ambient Noise Tomography: E. Saygin
• All the members of RSES who have helped with the collection of portable seismic data and subsequent data handling.
21

AN ORGANISATION FOR A NATIONAL EARTH SCIENCE INFRASTRUCTURE PROGRAM
AuScope 2007-2011