understanding the group dynamics and success of teams · pdf fileunderstanding the group...
TRANSCRIPT
Understanding the group dynamics and success of teams
Michael Klug1 and James P. Bagrow1,2,3,∗
1Department of Mathematics & Statistics, The University of Vermont
2Vermont Complex Systems Center, The University of Vermont
3Vermont Advanced Computing Core, The University of Vermont, Burlington, VT, USA∗To whom correspondence should be addressed. E-mail: [email protected]
April 22, 2016
Abstract
Complex problems often require coordinated group effort and can consume significant resources, yet
our understanding of how teams form and succeed has been limited by a lack of large-scale, quantitative
data. We analyze activity traces and success levels for ∼150,000 self-organized, online team projects.
While larger teams tend to be more successful, workload is highly focused across the team, with only
a few members performing most work. We find that highly successful teams are significantly more
focused than average teams of the same size, that their members have worked on more diverse sets of
projects, and the members of highly successful teams are more likely to be core members or ‘leads’ of
other teams. The relations between team success and size, focus and especially team experience cannot
be explained by confounding factors such as team age, external contributions from non-team members,
nor by group mechanisms such as social loafing. Taken together, these features point to organizational
principles that may maximize the success of collaborative endeavors.
1 Introduction
Massive datasets describing the activity patterns of large human populations now provide researchers with
rich opportunities to quantitatively study human dynamics [1, 2], including the activities of groups or
1
arX
iv:1
407.
2893
v4 [
cs.S
I] 2
1 A
pr 2
016
teams [3, 4]. New tools, including electronic sensor systems, can quantify team activity and performance [5,
4]. With the rise in prominence of network science [6, 7], much effort has gone into discovering meaningful
groups within social networks [8, 9, 10, 11, 12, 13, 14, 15] and quantifying their evolution [16, 15]. Teams
are increasingly important in research and industrial efforts [17, 18, 19, 3, 4, 20, 21] and small, coordi-
nated groups are a significant component of modern human conflict [22, 23]. There are many important
dimensions along which teams should be studied, including their size, how work is distributed among their
members, and the differences and similarities in the experiences and backgrounds of those team members.
Recently, there has been much debate on the “group size hypothesis”, that larger groups are more robust or
perform better than smaller ones [24, 25, 26, 27]. Scholars of science have noted for decades that collabora-
tive research teams have been growing in size and importance [28, 29, 30, 20]. At the same time, however,
social loafing, where individuals apply less effort to a task when they are in a group than when they are
alone, may counterbalance the effectiveness of larger teams [31, 32, 33]. Meanwhile, case studies show
that leadership [34, 3, 35, 36] and experience [37, 38] are key components of successful team outcomes,
while specialization and multitasking are important but potentially error-prone mechanisms for dealing with
complexity and cognitive overload [39, 40]. In all of these areas, large-scale, quantitative data can push the
study of teams forward.
Teams are important for modern software engineering tasks, and researchers have long studied the dig-
ital traces of open source software projects to better quantify and understand how teams work on software
projects [41, 42]. Researchers have investigated estimators of work activity or effort based on edit volume,
such as different ways to count the number of changes made to a software’s source code [43, 44, 45, 46]. Var-
ious dimensions of success of software projects, such as popularity, timeliness of bug fixes, or other quality
measures have been studied [47, 48, 49]. Successful open source software projects show a layered structure
of primary or core contributors surrounded by lesser, secondary contributors [50]. At the same time, much
work is focused on case studies [51, 45] of small numbers of highly successful, large projects [41]. Consid-
ering these studies alone runs the risk of survivorship bias or other selection biases, so large-scale studies of
large quantities of teams are important complements to these works.
Users of the GitHub web platform can form teams to work on real-world projects, primarily software
development but also music, literature, design work, and more. A number of important scientific computing
2
resources are now developed through GitHub, including astronomical software, genetic sequencing tools,
and key components of the Compact Muon Solenoid experiment’s data pipeline.1 A “GitHub for science”
initiative has been launched2 and GitHub is becoming the dominant service for open scientific development.
GitHub provides rich public data on team activities, including when new teams form, when members
join existing teams, and when a team’s project is updated. GitHub also provides social media tools for the
discovery of interesting projects. Users who see the work of a team can choose to flag it as interesting to
them by “starring” it. The number of these “stargazers” S allows us to quantify one aspect of the success of
the team, in a manner analogous to the use of citations of research literature as a proxy for “impact” [52].
Of course, as with bibliometric impact, one should be cautious and not consider success to be a perfectly
accurate measure of quality, something that is far more difficult to objectively quantify. Instead this is
a measure of popularity as would be other statistics such as web traffic, number of downloads, and so
forth [47].
In this study, we analyze the memberships and activities of approximately 150,000 teams, as they per-
form real-world tasks, to uncover the blend of features that relate to success. To the best of our knowledge
this is the largest study of real-world team success to date. We present results that demonstrate (i) how
teams distribute or focus work activity across their members, (ii) the mixture of experiential diversity and
collective leadership roles in teams, and (iii) how successful teams are different from other teams while
accounting for confounds such as team size.
The rest of this paper is organized as follows: In Sec. 2 we describe our GitHub dataset; give definitions
of a team, team success, and work activity/focus of a team member; and introduce metrics to measure
various aspects of the experience and experiential diversity of a team’s members. In Sec. 3 we present our
results relating these measures to team success. In Sec. 4 we present statistical tests on linear regression
models of team features to control for potential confounds between team features and team success. Lastly,
we conclude with a discussion in Sec. 5.1For examples, see https://github.com/showcases/science.2See https://github.com/blog/1840-improving-github-for-science.
3
2 Methods and Materials
Dataset and team selection
Public GitHub data covering 1 January 2013 to 1 April 2014 was collected from githubarchive.org in April
2014. In their own words, “GitHub Archive is a project to record the public GitHub timeline, archive it, and
make it easily accessible for further analysis”. These activity traces contain approximately 110M unique
events, including when users create, join, or update projects. Projects on GitHub are called “repositories”.
For this work we define a team as the set of users who can directly update (“push to”) a repository. These
users constitute the primary team members as they have either created the project or been granted autonomy
to work on the project. The number of team members was denoted by M. Activity or workload W was
estimated from the number of pushes. A push is a bundle of code updates (known as commits), however
most pushes contain only a single commit (see SI; see also ref. [46]). As with all studies measuring worker
effort from lines-of-code metrics, this is an imperfect measure as the complexity of a unit of work does not
generally map to the quantity of edits. Users on GitHub can bookmark projects they find interesting. This
is called “stargazing”. We take the maximum number of stargazers for a team as its measure of success S .
This is a popularity measure of success, however the choice to bookmark a project does imply it offers some
value to the user. To avoid abandoned projects, studied teams have at least one stargazer (S > 0) and at least
two updates per month on average within the githubarchive data. These selection criteria leave N = 151, 542
teams. We also collect the time of creation on GitHub for each team project. This is useful for measuring
confounds: for example, older teams may tend to both have more members and have more opportunities to
increase success. Of the teams studied, 67.8% were formed within our data window. Beyond considering
team age as a potential confounder, we do not study temporal dynamics such as team formation in this work.
A small number of studied teams (1.08%) have more than ten primary members (M > 10); those teams were
not shown in figures, but they were present in all statistical analyses. Lastly, to ensure our results are not
due to outliers, in some analyses we excluded teams above the 99th percentile of S . Despite a strong skew
in the distribution of S , these highly popular teams account for only 2.54% of the total work activity of the
teams considered in this study (2.27% when considering teams with M ≤ 10 members).
4
Secondary Team GitHub provides a mechanism for external, non-team contributors to propose work that
team members can then choose to use or not. These proposals are called pull requests. (Other mechanisms,
such as discussions about issues, are also available to non-team contributors.) These secondary or external
team contributors are not the focus of this work and have already been well studied by OSS researchers [41].
However, it is important to ensure that they do not act as confounding factors for our results, since more
successful teams will tend to have more secondary contributions than other teams. So we measure for each
team Mext, the number of unique users who submit at least one pull request, and Wext the number of pull
requests. We will include these measures in our combined regression models. Despite their visibility in
GitHub, pull requests are rare [53]; in our data, 57.7% of teams we study have Wext = 0, and when present
pull requests are greatly outnumbered by pushes on average: 〈W/Wext | Wext > 0〉 = 42.3 (median 16.0),
averaged over all teams with at least one pull request.
Effective team size
The number of team members, M, does not fully represent the size of a team since the distribution of work
may be highly skewed across team members. To capture the effective team size m, accounting for the
relative contribution levels of members, we use m = 2H , where H = −∑Mi=1 fi log2 fi, and fi = wi/W is
the fraction of work performed by team member i. This gives m = M when all fi = 1/M, as expected.
This simple, entropic measure is known as perplexity in linguistics and is closely related to species diversity
indices used in ecology and the Herfindahl-Hirschman Index used in economics.
Experience, diversity, and leads
Denote with Ri the set of projects that user i works on (has pushed to). (Projects in Ri need at least twice-
monthly updates on average, as before, but may have S = 0 so as to better capture i’s background, not just
successful projects.) We estimate the experience E of a team of size M as
E =1M
∑i
|Ri| − 1
5
and the experiential diversity D as
D =
∣∣∣⋃i Ri∣∣∣∑
i |Ri| ,
where the sums and union run over the M members of the team. Note that D ∈ [1/M, 1). Experience
measures the quantity of projects the team works on while diversity measures how many or how few projects
the team members have in common, the goal being to capture how often the team has worked together.
Lastly, someone is a lead when, for at least one project they work on, they contribute more work to that
project than any other member. A non-lead member of team j may be the lead of project k , j. The number
of leads Lk in team k of size Mk is:
Lk =
Mk∑i=1
min
∑j
Li j, 1
,where Li j = 1 if user i is the lead of team j, and zero otherwise. The first sum runs over the Mk members
of team k, the second runs over all projects j. Of course, the larger the team the more potential leads it
may contain so when studying the effects of leads on team success we only compare teams of the same size
(comparing L while holding M fixed). Otherwise, E and D already account for team size.
3 Results
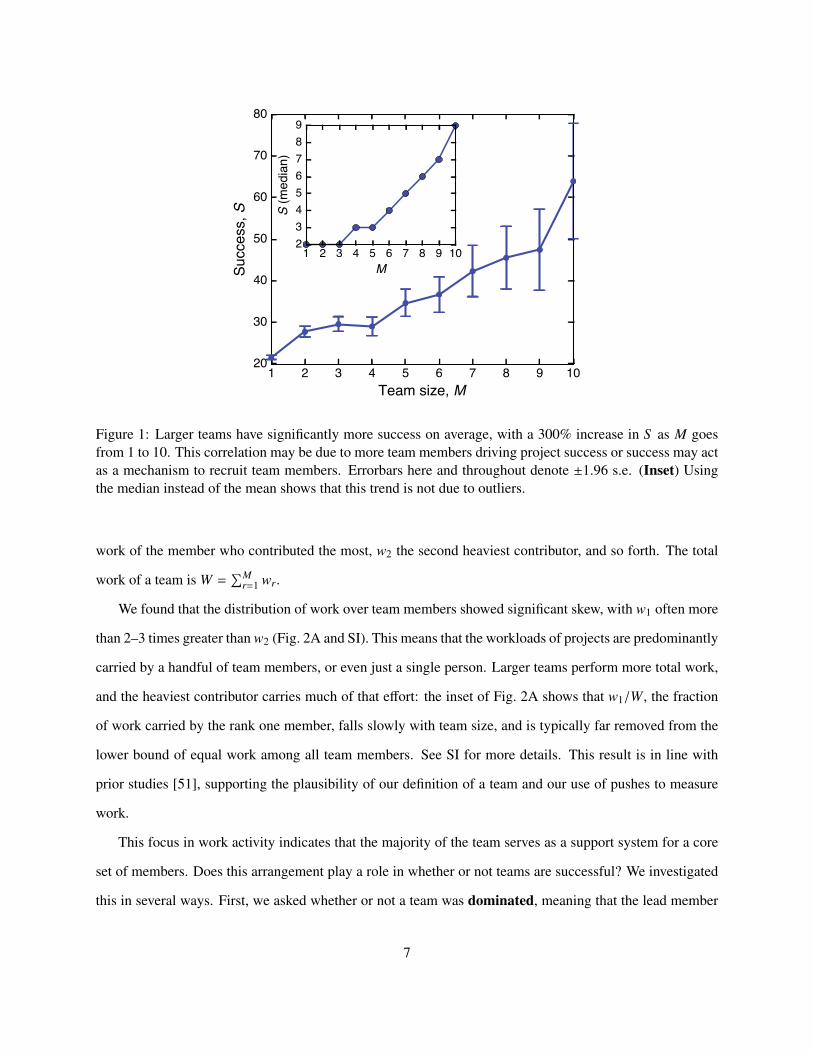
We began our analysis by measuring team success S as a function of team size M, the number of primary
contributors to the team’s project. Since S is, at least partially, a popularity measure, we expect larger
teams to also be more successful. Indeed, there was a positive and significant relationship (p < 10−10, rank
correlation ρ = 0.0845) between the size of a team and its success, with 300% greater success on average
for teams of size M = 10 compared to solos with M = 1 (Fig. 1). This strong trend holds for the median
success as well (inset). While this observed trend was highly significant, the rank correlation ρ indicates
that there remains considerable variation in S that is not captured by team size alone.
Our next analysis reveals an important relationship between team focus and success. Unlike biblio-
graphic studies, where teams can only be quantified as the listed coauthors of a paper, the data here allow us
to measure the intrinsic work or volume of contributions from each team member to the project. For each
team we measured the contribution wr of a member to the team’s ongoing project, how many times that
member updated the project (see Methods). Team members were ranked by contribution, so w1 counts the
6
1 2 3 4 5 6 7 8 9 10Team size, M
20
30
40
50
60
70
80
Succ
ess,
S1 2 3 4 5 6 7 8 9 10
M
23456789
S (m
edian
)
Figure 1: Larger teams have significantly more success on average, with a 300% increase in S as M goesfrom 1 to 10. This correlation may be due to more team members driving project success or success may actas a mechanism to recruit team members. Errorbars here and throughout denote ±1.96 s.e. (Inset) Usingthe median instead of the mean shows that this trend is not due to outliers.
work of the member who contributed the most, w2 the second heaviest contributor, and so forth. The total
work of a team is W =∑M
r=1 wr.
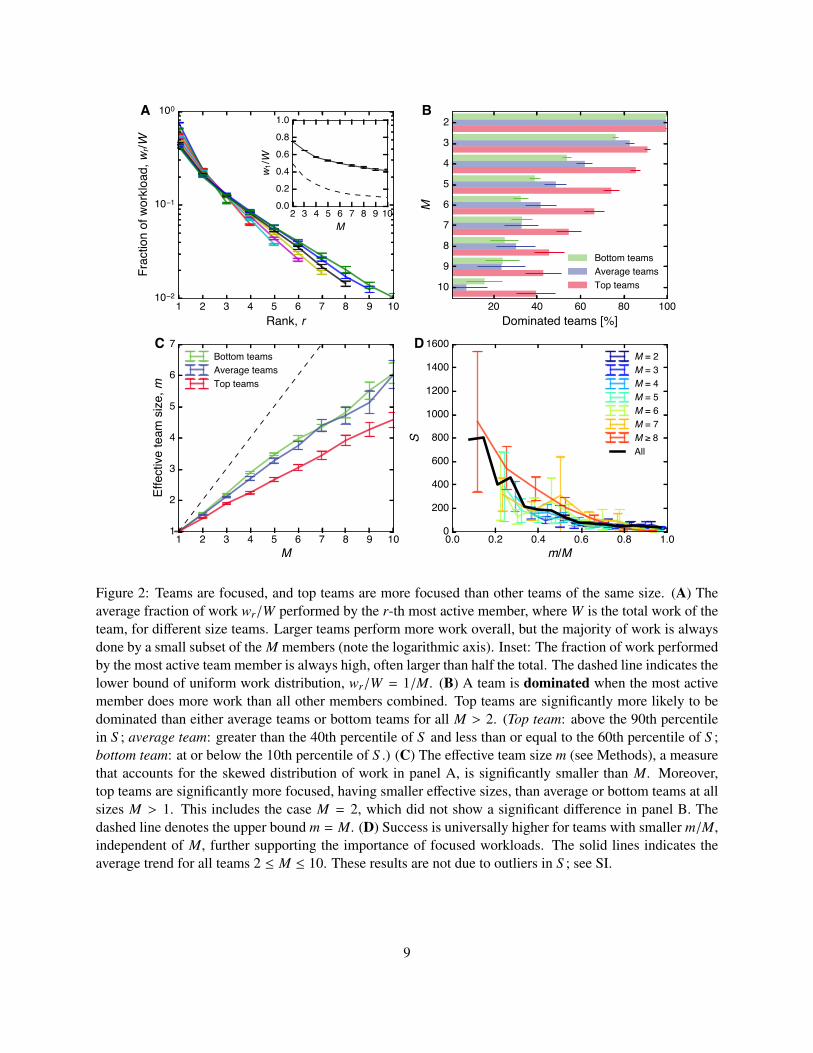
We found that the distribution of work over team members showed significant skew, with w1 often more
than 2–3 times greater than w2 (Fig. 2A and SI). This means that the workloads of projects are predominantly
carried by a handful of team members, or even just a single person. Larger teams perform more total work,
and the heaviest contributor carries much of that effort: the inset of Fig. 2A shows that w1/W, the fraction
of work carried by the rank one member, falls slowly with team size, and is typically far removed from the
lower bound of equal work among all team members. See SI for more details. This result is in line with
prior studies [51], supporting the plausibility of our definition of a team and our use of pushes to measure
work.
This focus in work activity indicates that the majority of the team serves as a support system for a core
set of members. Does this arrangement play a role in whether or not teams are successful? We investigated
this in several ways. First, we asked whether or not a team was dominated, meaning that the lead member
7
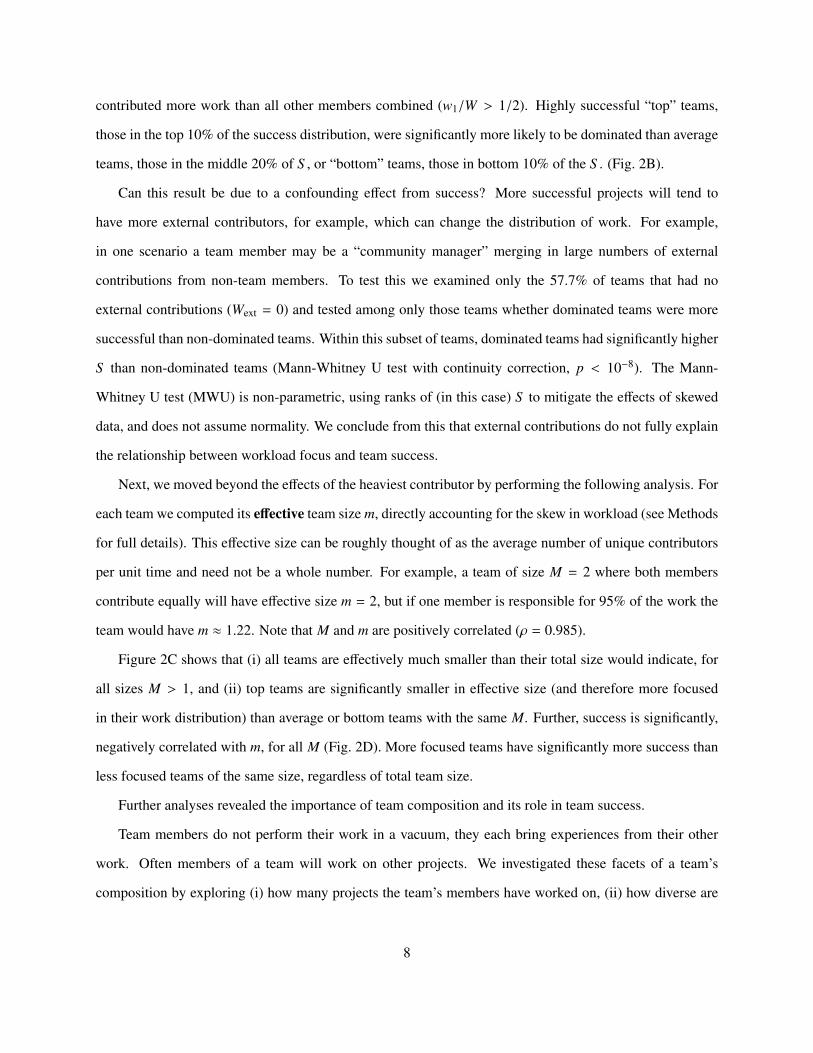
contributed more work than all other members combined (w1/W > 1/2). Highly successful “top” teams,
those in the top 10% of the success distribution, were significantly more likely to be dominated than average
teams, those in the middle 20% of S , or “bottom” teams, those in bottom 10% of the S . (Fig. 2B).
Can this result be due to a confounding effect from success? More successful projects will tend to
have more external contributors, for example, which can change the distribution of work. For example,
in one scenario a team member may be a “community manager” merging in large numbers of external
contributions from non-team members. To test this we examined only the 57.7% of teams that had no
external contributions (Wext = 0) and tested among only those teams whether dominated teams were more
successful than non-dominated teams. Within this subset of teams, dominated teams had significantly higher
S than non-dominated teams (Mann-Whitney U test with continuity correction, p < 10−8). The Mann-
Whitney U test (MWU) is non-parametric, using ranks of (in this case) S to mitigate the effects of skewed
data, and does not assume normality. We conclude from this that external contributions do not fully explain
the relationship between workload focus and team success.
Next, we moved beyond the effects of the heaviest contributor by performing the following analysis. For
each team we computed its effective team size m, directly accounting for the skew in workload (see Methods
for full details). This effective size can be roughly thought of as the average number of unique contributors
per unit time and need not be a whole number. For example, a team of size M = 2 where both members
contribute equally will have effective size m = 2, but if one member is responsible for 95% of the work the
team would have m ≈ 1.22. Note that M and m are positively correlated (ρ = 0.985).
Figure 2C shows that (i) all teams are effectively much smaller than their total size would indicate, for
all sizes M > 1, and (ii) top teams are significantly smaller in effective size (and therefore more focused
in their work distribution) than average or bottom teams with the same M. Further, success is significantly,
negatively correlated with m, for all M (Fig. 2D). More focused teams have significantly more success than
less focused teams of the same size, regardless of total team size.
Further analyses revealed the importance of team composition and its role in team success.
Team members do not perform their work in a vacuum, they each bring experiences from their other
work. Often members of a team will work on other projects. We investigated these facets of a team’s
composition by exploring (i) how many projects the team’s members have worked on, (ii) how diverse are
8
20 40 60 80 100Dominated teams [%]
23456789
10
M
B
Bottom teamsAverage teamsTop teams
1 2 3 4 5 6 7 8 9 10M
1
2
3
4
5
6
7
Effe
ctive
team
size
, m
CBottom teamsAverage teamsTop teams
1 2 3 4 5 6 7 8 9 10Rank, r
10 2
10 1
100
Frac
tion
of w
orklo
ad, w
r/W
A
2 3 4 5 6 7 8 9 10M
0.00.20.40.60.81.0
w 1/W
0.0 0.2 0.4 0.6 0.8 1.0m/M
0
200
400
600
800
1000
1200
1400
1600
S
DM = 2M = 3M = 4M = 5M = 6M = 7M 8All
Figure 2: Teams are focused, and top teams are more focused than other teams of the same size. (A) Theaverage fraction of work wr/W performed by the r-th most active member, where W is the total work of theteam, for different size teams. Larger teams perform more work overall, but the majority of work is alwaysdone by a small subset of the M members (note the logarithmic axis). Inset: The fraction of work performedby the most active team member is always high, often larger than half the total. The dashed line indicates thelower bound of uniform work distribution, wr/W = 1/M. (B) A team is dominated when the most activemember does more work than all other members combined. Top teams are significantly more likely to bedominated than either average teams or bottom teams for all M > 2. (Top team: above the 90th percentilein S ; average team: greater than the 40th percentile of S and less than or equal to the 60th percentile of S ;bottom team: at or below the 10th percentile of S .) (C) The effective team size m (see Methods), a measurethat accounts for the skewed distribution of work in panel A, is significantly smaller than M. Moreover,top teams are significantly more focused, having smaller effective sizes, than average or bottom teams at allsizes M > 1. This includes the case M = 2, which did not show a significant difference in panel B. Thedashed line denotes the upper bound m = M. (D) Success is universally higher for teams with smaller m/M,independent of M, further supporting the importance of focused workloads. The solid lines indicates theaverage trend for all teams 2 ≤ M ≤ 10. These results are not due to outliers in S ; see SI.
9
the other projects (do the team members have many or few other projects in common), and (iii) how many
team members were “leads” of other projects.
An estimate of experience, E, the average number of other projects that team members have worked on
(see Methods), was significantly related to success. However, the trend was not particularly strong (see SI)
and, as we later show via combined modeling efforts, this relationship with success was entirely explainable
by the teams’ other measurable quantities.
It may be that the volume of experience does not contribute much to the success of a team, but this
seems to contradict previous studies on the importance of experience and wisdom [37, 38]. To investigate,
we turned to a different facet of a team’s composition, the diversity of the team’s background. Successful
teams may tend to be comprised of members who have frequently worked together on the same projects
in the past, perhaps developing an experiential shorthand. Conversely, successful teams may instead have
multiple distinct viewpoints, solving challenges with a multi-disciplinary perspective [54].
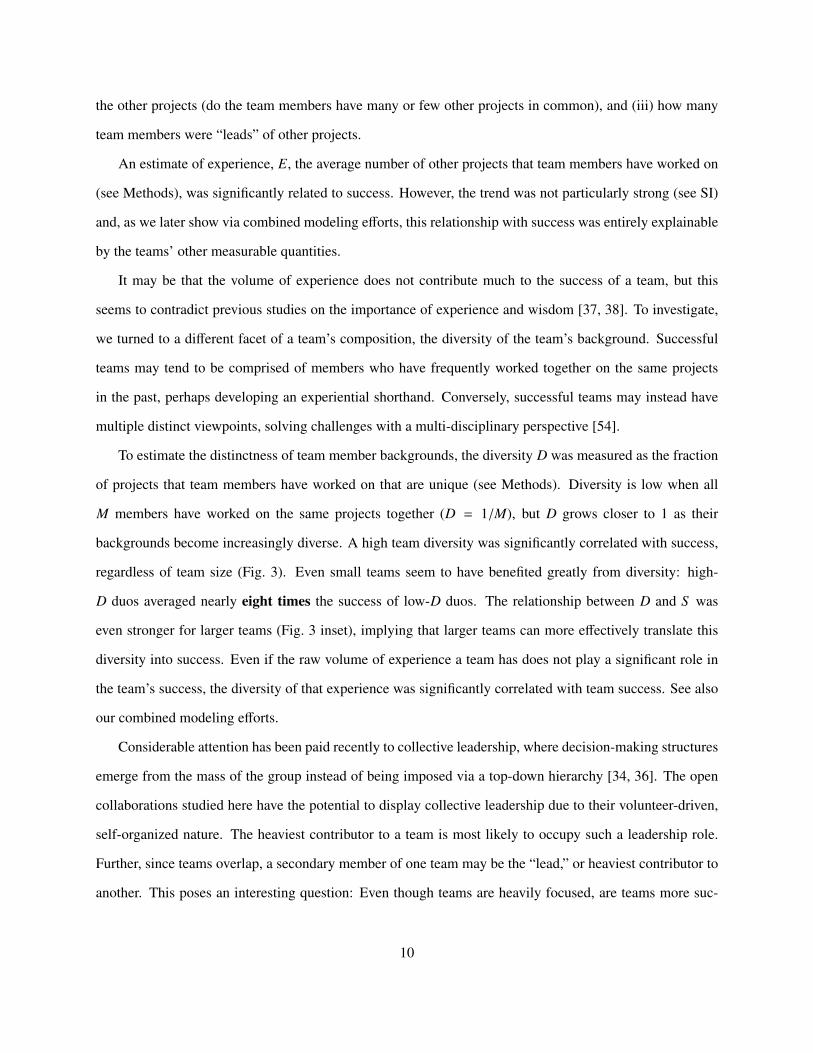
To estimate the distinctness of team member backgrounds, the diversity D was measured as the fraction
of projects that team members have worked on that are unique (see Methods). Diversity is low when all
M members have worked on the same projects together (D = 1/M), but D grows closer to 1 as their
backgrounds become increasingly diverse. A high team diversity was significantly correlated with success,
regardless of team size (Fig. 3). Even small teams seem to have benefited greatly from diversity: high-
D duos averaged nearly eight times the success of low-D duos. The relationship between D and S was
even stronger for larger teams (Fig. 3 inset), implying that larger teams can more effectively translate this
diversity into success. Even if the raw volume of experience a team has does not play a significant role in
the team’s success, the diversity of that experience was significantly correlated with team success. See also
our combined modeling efforts.
Considerable attention has been paid recently to collective leadership, where decision-making structures
emerge from the mass of the group instead of being imposed via a top-down hierarchy [34, 36]. The open
collaborations studied here have the potential to display collective leadership due to their volunteer-driven,
self-organized nature. The heaviest contributor to a team is most likely to occupy such a leadership role.
Further, since teams overlap, a secondary member of one team may be the “lead,” or heaviest contributor to
another. This poses an interesting question: Even though teams are heavily focused, are teams more suc-
10
0.0 0.2 0.4 0.6 0.8 1.0Diversity, D
0
50
100
150
200
SM 5M = 4M = 3M = 2
2 3 4 5 6 7 8 9 10M
0.00.10.20.30.4
(D,S
)
Figure 3: Teams whose members belong to more diverse sets of other teams tend to be more successful, re-gardless of team size. The dashed line denotes the average success of all teams. (Inset) The rank correlationρ between diversity and success grows with team size. Teams above the 99th percentile in S were excludedto ensure the trend is not due to outliers.
cessful when they contain many leads, or few? A team with many leads will bring considerable experience,
but most of its members may also be unable to dedicate their full attention to the team.
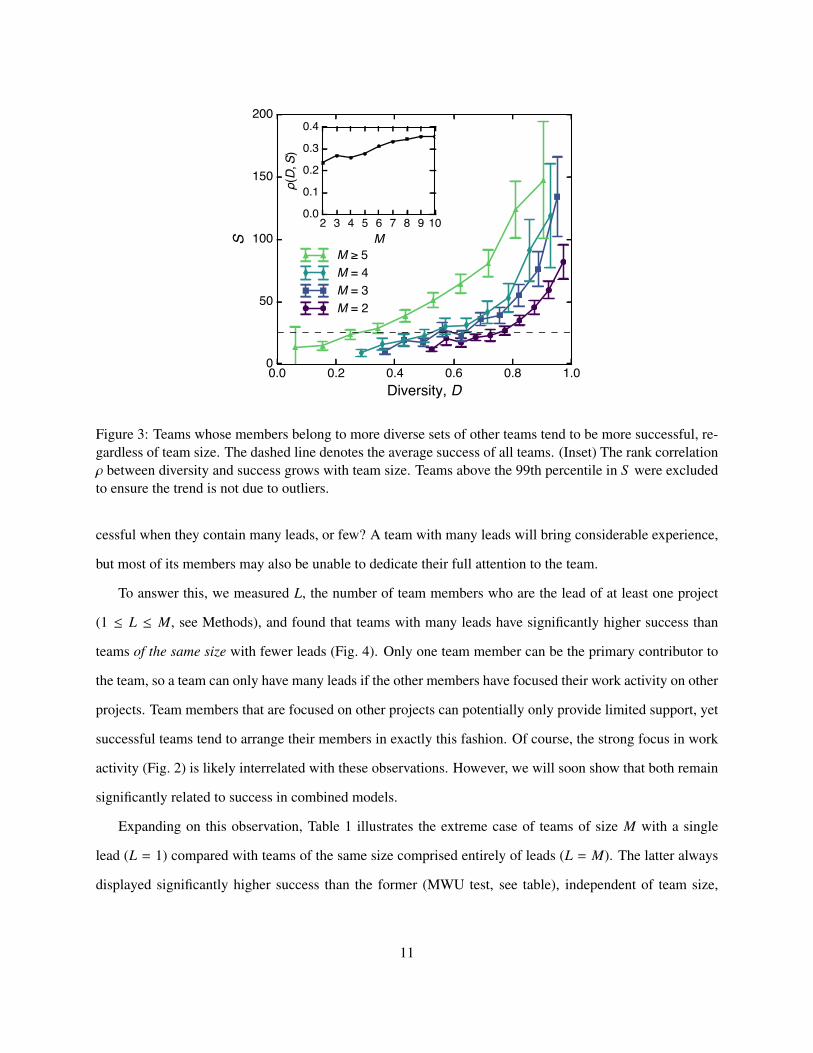
To answer this, we measured L, the number of team members who are the lead of at least one project
(1 ≤ L ≤ M, see Methods), and found that teams with many leads have significantly higher success than
teams of the same size with fewer leads (Fig. 4). Only one team member can be the primary contributor to
the team, so a team can only have many leads if the other members have focused their work activity on other
projects. Team members that are focused on other projects can potentially only provide limited support, yet
successful teams tend to arrange their members in exactly this fashion. Of course, the strong focus in work
activity (Fig. 2) is likely interrelated with these observations. However, we will soon show that both remain
significantly related to success in combined models.
Expanding on this observation, Table 1 illustrates the extreme case of teams of size M with a single
lead (L = 1) compared with teams of the same size comprised entirely of leads (L = M). The latter always
displayed significantly higher success than the former (MWU test, see table), independent of team size,
11
Team size, M
1 2 3 4 5 6 7 8 9 10Number of leads, L
1 2 3 4 5 6 7 8 9 10
Succ
ess,
S
0501001502002503003500 40 80 120 160 200 240 280
Success, S
1 2 3 4 5 6 7 8 9 10Number of leads, L
0
50
100
150
200
S
M 7M = 6M = 5M = 4M = 3M = 2
Figure 4: Teams with more leads have higher success than teams of the same size with fewer leads. A leadis someone who contributes more work to at least one team he or she belongs to than any other members ofthat team. Outliers in S were removed as before.
underscoring the correlations displayed in Fig. 4. Often the difference was massive: teams of size M = 7,
for example, averaged more than 1200% higher success when L = 7 than when L = 1.
These results on team composition cannot be easily explained as a confound with success or secondary
contributions as they study specific features and projects of the individuals who comprise a team, those
features are not related to the successes of other projects an individual may work on, and they strictly
control for total team size M (for example, we only compare teams with different values of L when they
have the same value M). These results further amplify our findings on team focus, and augment important
existing research [37, 3, 4, 36, 54].
Taken together, our results demonstrate that successful teams tend to be focused (Fig. 2), successful
teams tend to be experientially diverse (Fig. 3), and successful teams tend to have many leads (Fig. 4). We
have found that teams tend to do best when optimized along all three of these dimensions. Of course, it is
necessary to explore the joint effects of quantities, to see if one relationship can be explained by another,
which we will do with multivariate statistical models.
12
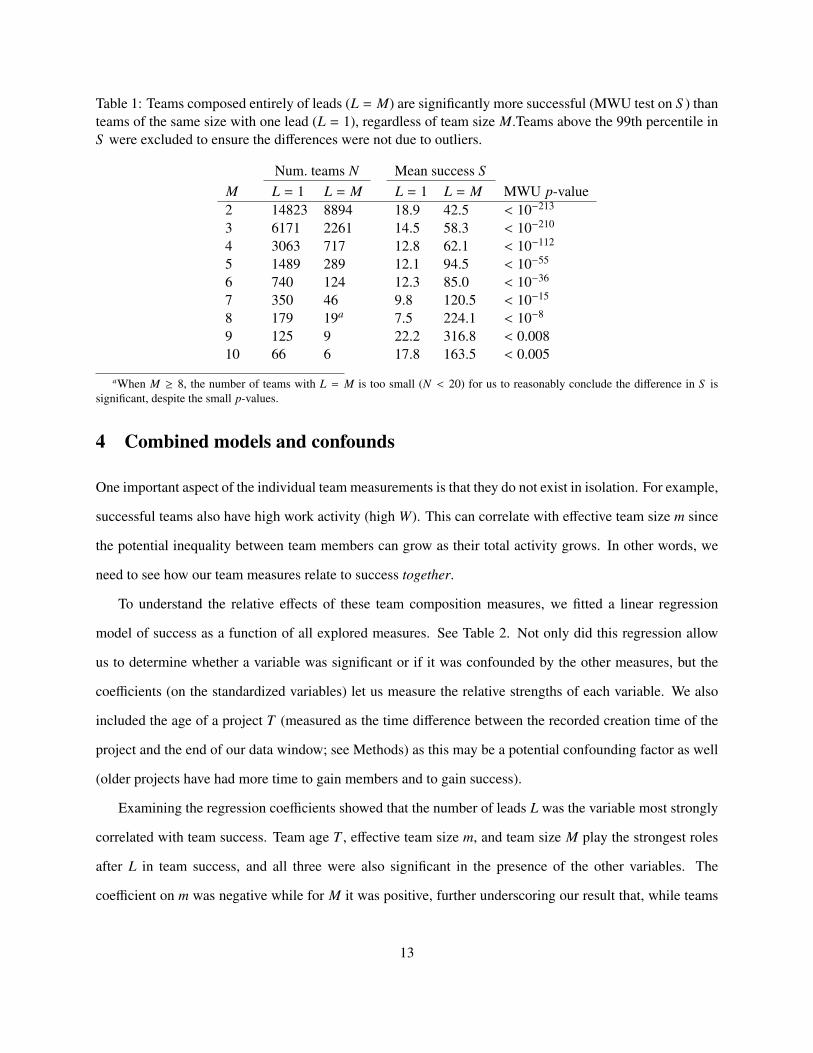
Table 1: Teams composed entirely of leads (L = M) are significantly more successful (MWU test on S ) thanteams of the same size with one lead (L = 1), regardless of team size M.Teams above the 99th percentile inS were excluded to ensure the differences were not due to outliers.
Num. teams N Mean success SM L = 1 L = M L = 1 L = M MWU p-value2 14823 8894 18.9 42.5 < 10−213
3 6171 2261 14.5 58.3 < 10−210
4 3063 717 12.8 62.1 < 10−112
5 1489 289 12.1 94.5 < 10−55
6 740 124 12.3 85.0 < 10−36
7 350 46 9.8 120.5 < 10−15
8 179 19a 7.5 224.1 < 10−8
9 125 9 22.2 316.8 < 0.00810 66 6 17.8 163.5 < 0.005
aWhen M ≥ 8, the number of teams with L = M is too small (N < 20) for us to reasonably conclude the difference in S issignificant, despite the small p-values.
4 Combined models and confounds
One important aspect of the individual team measurements is that they do not exist in isolation. For example,
successful teams also have high work activity (high W). This can correlate with effective team size m since
the potential inequality between team members can grow as their total activity grows. In other words, we
need to see how our team measures relate to success together.
To understand the relative effects of these team composition measures, we fitted a linear regression
model of success as a function of all explored measures. See Table 2. Not only did this regression allow
us to determine whether a variable was significant or if it was confounded by the other measures, but the
coefficients (on the standardized variables) let us measure the relative strengths of each variable. We also
included the age of a project T (measured as the time difference between the recorded creation time of the
project and the end of our data window; see Methods) as this may be a potential confounding factor as well
(older projects have had more time to gain members and to gain success).
Examining the regression coefficients showed that the number of leads L was the variable most strongly
correlated with team success. Team age T , effective team size m, and team size M play the strongest roles
after L in team success, and all three were also significant in the presence of the other variables. The
coefficient on m was negative while for M it was positive, further underscoring our result that, while teams
13
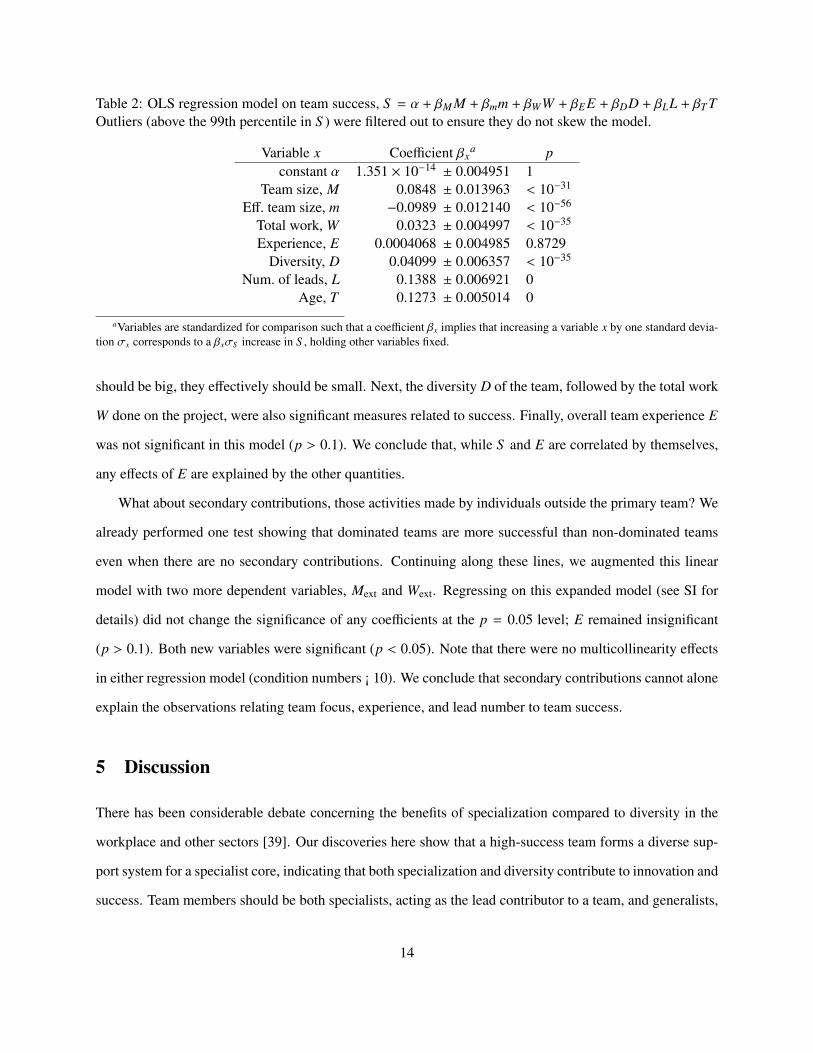
Table 2: OLS regression model on team success, S = α + βM M + βmm + βWW + βEE + βDD + βLL + βT TOutliers (above the 99th percentile in S ) were filtered out to ensure they do not skew the model.
Variable x Coefficient βxa p
constant α 1.351 × 10⁻¹⁴ ± 0.004951 1Team size, M 0.0848 ± 0.013963 < 10−31
Eff. team size, m −0.0989 ± 0.012140 < 10−56
Total work, W 0.0323 ± 0.004997 < 10−35
Experience, E 0.0004068 ± 0.004985 0.8729Diversity, D 0.04099 ± 0.006357 < 10−35
Num. of leads, L 0.1388 ± 0.006921 0Age, T 0.1273 ± 0.005014 0
aVariables are standardized for comparison such that a coefficient βx implies that increasing a variable x by one standard devia-tion σx corresponds to a βxσS increase in S , holding other variables fixed.
should be big, they effectively should be small. Next, the diversity D of the team, followed by the total work
W done on the project, were also significant measures related to success. Finally, overall team experience E
was not significant in this model (p > 0.1). We conclude that, while S and E are correlated by themselves,
any effects of E are explained by the other quantities.
What about secondary contributions, those activities made by individuals outside the primary team? We
already performed one test showing that dominated teams are more successful than non-dominated teams
even when there are no secondary contributions. Continuing along these lines, we augmented this linear
model with two more dependent variables, Mext and Wext. Regressing on this expanded model (see SI for
details) did not change the significance of any coefficients at the p = 0.05 level; E remained insignificant
(p > 0.1). Both new variables were significant (p < 0.05). Note that there were no multicollinearity effects
in either regression model (condition numbers ¡ 10). We conclude that secondary contributions cannot alone
explain the observations relating team focus, experience, and lead number to team success.
5 Discussion
There has been considerable debate concerning the benefits of specialization compared to diversity in the
workplace and other sectors [39]. Our discoveries here show that a high-success team forms a diverse sup-
port system for a specialist core, indicating that both specialization and diversity contribute to innovation and
success. Team members should be both specialists, acting as the lead contributor to a team, and generalists,
14
offering ancillary support for teams led by another member. This has implications when organizations are
designing teams and wish to maximize their success, at least as success was measured in these data. Teams
tend to do best on average when they maximize M (Fig. 1B) while minimizing m (Fig. 2D) and maximizing
D (Fig. 3) and L (Fig. 4).
Of course, some tasks are too large for a single person or small team to handle, necessitating the need
for mega-teams of hundreds or even thousands of members. Our results imply that such teams may be most
effective when broken down into large numbers of small, overlapping groups, where all individuals belong
to a few teams and are the lead of at least one. Doing so will help maximize the experiential diversity of each
sub-team, while ensuring each team has someone “in charge”. An important open question is what are the
best ways to design such pervasively overlapping groups [14], a task that may be project- or domain-specific
but which is worth further exploration.
The negative relationship between effective team size m and success S (as well as the significantly higher
presence of dominated teams among high success teams) further belies the myth of multitasking [39] and
supports the “surgical team” arguments of Brooks [17]. Focused work activity, often by even a single person,
is a hallmark of successful teams. This focus both limits the cognitive costs of task switching, and lowers
communication and coordination barriers, since so much work is being accomplished by one or only a few
individuals. We have provided statistical tests demonstrating that the relationship between focus and success
cannot be due to secondary/external team contributions alone.
Work focus could possibly be explained by social loafing where individual members of a group con-
tribute less effort as part of the group than they would alone, yet loafing does not explain the correlation
between, e.g., leads and success (Fig. 4). Likewise, our team composition results on group experience,
experiential diversity, and the number of leads cannot be easily explained as a confound with success or
secondary contributions: they study specific features of the individuals who comprise a team, those features
are not related to the successes of other projects an individual may work on, and they strictly control for total
team size M (except for the number of leads L, so for that measure we only compared teams with the same
M). The measures we used for external team contributions, Mext and Wext, may be considered measures
of success themselves, and studying or even predicting their levels from team features may prove a fruitful
avenue of future work.
15
Lastly, there are two remaining caveats worth mentioning. We do not specifically control for automati-
cally mirrored repositories (where a computer script copies updates to GitHub). Accurately detecting such
projects at scale is a challenge beyond the scope of this work. However, we expect most will either be
filtered out by our existing selection criteria or else they will likely only have a single (automated) user that
only does the copying. The second concern is work done outside of GitHub or, more generally, mismatched
assignments between usernames and their work. This is also challenging to fully address (one issue is that
the underlying git repository system does not authenticate users). We acknowledge this concern for our
workload focus results, but even it cannot explain the significant trends we observed on team composition
such as the density of leads. Noise due to improperly recorded or “out-of-band” work has in principle
affected all quantitative studies of online software repositories.
Data accessibility
All data analyzed are made publicly available by the GitHub Archive Project (https://www.githubarchive.
org).
Competing interests
We have no competing interests.
Authors’ contributions
MK participated in data collection and data analysis, and helped draft the manuscript; JB conceived of the
study, designed the study, carried out data collection and analysis, and drafted the manuscript. All authors
gave final approval for publication.
Acknowledgments
We thank Josh Bongard, Brian Tivnan, Paul Hines, Michael Szell, and Albert-Laszlo Barabasi for useful
discussions, and we gratefully acknowledge the computational resources provided by the Vermont Advanced
16
Computing Core, supported by NASA (NNX-08AO96G).
Funding
JB has been supported by the University of Vermont and the Vermont Complex Systems Center.
References
[1] Lazer D, Pentland AS, Adamic L, Aral S, Barabasi AL, Brewer D, et al. Life in the network: thecoming age of computational social science. Science. 2009;323(5915):721.
[2] Vespignani A. Modelling dynamical processes in complex socio-technical systems. Nature Phys.2012;8(1):32–39.
[3] Dyer JR, Johansson A, Helbing D, Couzin ID, Krause J. Leadership, consensus decision making andcollective behaviour in humans. Phil Trans R Soc B. 2009;364(1518):781–789.
[4] Pentland A. The new science of building great teams. Harvard Bus Rev. 2012;90(4):60–69.
[5] Choudhury T, Pentland A. Sensing and Modeling Human Networks using the Sociometer. 2012 16thInternational Symposium on Wearable Computers. 2003;0:216.
[6] Barabasi AL. Linked: How Everything Is Connected to Everything Else and What It Means forBusiness, Science, and Everyday Life. Plume; 2003.
[7] Newman MEJ. Networks: An Introduction. Oxford University Press; 2010.
[8] Wasserman S, Faust K. Social network analysis: Methods and applications. Cambridge UniversityPress; 1994.
[9] Sparrowe RT, Liden RC, Wayne SJ, Kraimer ML. Social networks and the performance of individualsand groups. Acad Manage J. 2001;44(2):316–325.
[10] Girvan M, Newman MEJ. Community structure in social and biological networks. Proc Natl Acad SciU S A. 2002;99(12):7821–7826.
[11] Watts DJ, Dodds PS, Newman MEJ. Identity and search in social networks. Science.2002;296(5571):1302–1305.
[12] Newman MEJ, Park J. Why social networks are different from other types of networks. Phys Rev E.2003;68(3):036122.
[13] Bird C, Pattison D, D’Souza R, Filkov V, Devanbu P. Latent social structure in open source projects.In: Proceedings of the 16th ACM SIGSOFT International Symposium on Foundations of SoftwareEngineering. SIGSOFT ’08/FSE-16. ACM; 2008. p. 24–35.
[14] Ahn YY, Bagrow JP, Lehmann S. Link communities reveal multiscale complexity in networks. Nature.2010;466(7307):761–764.
17
[15] Mucha PJ, Richardson T, Macon K, Porter MA, Onnela JP. Community structure in time-dependent,multiscale, and multiplex networks. Science. 2010;328(5980):876–878.
[16] Palla G, Barabasi AL, Vicsek T. Quantifying social group evolution. Nature. 2007;446(7136):664–667.
[17] Brooks Jr FP. The Mythical Man-Month. Pearson Education; 1995.
[18] Faraj S, Sproull L. Coordinating expertise in software development teams. Management science.2000;46(12):1554–1568.
[19] Rising L, Janoff NS. The Scrum software development process for small teams. IEEE software.2000;(4):26–32.
[20] Milojevic S. Principles of scientific research team formation and evolution. Proc Natl Acad Sci U SA. 2014;111(11):3984–3989.
[21] de Montjoye YA, Stopczynski A, Shmueli E, Pentland A, Lehmann S. The Strength of the StrongestTies in Collaborative Problem Solving. Sci Rep. 2014 06;4. Available from: http://dx.doi.org/10.1038/srep05277.
[22] Clauset A, Young M, Gleditsch KS. On the frequency of severe terrorist events. J Confl Resolut.2007;51(1):58–87.
[23] Bohorquez JC, Gourley S, Dixon AR, Spagat M, Johnson NF. Common ecology quantifies humaninsurgency. Nature. 2009;462(7275):911–914.
[24] Henrich J. Demography and cultural evolution: how adaptive cultural processes can produce maladap-tive losses: the Tasmanian case. Am Antiqu. 2004;69(2):197–214.
[25] Derex M, Beugin MP, Godelle B, Raymond M. Experimental evidence for the influence of group sizeon cultural complexity. Nature. 2013;503(7476):389–391.
[26] Andersson C, Read D. Group size and cultural complexity. Nature. 2014 07;511(7507):E1–E1. Avail-able from: http://dx.doi.org/10.1038/nature13411.
[27] Derex M, Beugin MP, Godelle B, Raymond M. Derex et al. reply. Nature. 2014 07;511(7507):E2–E2.Available from: http://dx.doi.org/10.1038/nature13412.
[28] Price DdS. Little science, big science. New York: Columbia University Press; 1963.
[29] Pao ML. Global and local collaborators: a study of scientific collaboration. Inf Process Manage.1992;28(1):99–109.
[30] Hudson J. Trends in multi-authored papers in economics. J Econ Perspect. 1996;10(3):153–158.
[31] Latane B, Williams K, Harkins S. Many hands make light the work: The causes and consequences ofsocial loafing. Journal of personality and social psychology. 1979;37(6):822.
[32] Harkins SG. Social loafing and social facilitation. Journal of Experimental Social Psychology.1987;23(1):1–18.
18
[33] Karau SJ, Williams KD. Social loafing: A meta-analytic review and theoretical integration. Journal ofpersonality and social psychology. 1993;65(4):681.
[34] Denis JL, Lamothe L, Langley A. The dynamics of collective leadership and strategic change inpluralistic organizations. Acad Manage J. 2001;44(4):809–837.
[35] Johnstone RA, Manica A. Evolution of personality differences in leadership. Proc Natl Acad Sci U SA. 2011;108(20):8373–8378.
[36] Contractor NS, DeChurch LA, Carson J, Carter DR, Keegan B. The topology of collective leadership.Leadersh Q. 2012;23(6):994–1011.
[37] Katzenbach JR. The wisdom of teams: Creating the high-performance organization. Harvard BusinessPress; 1993.
[38] Delmar F, Shane S. Does experience matter? The effect of founding team experience on the survivaland sales of newly founded ventures. Strateg Organ. 2006;4(3):215–247.
[39] Lindbeck A, Snower DJ. Multitask learning and the reorganization of work: From Tayloristic toholistic organization. J Lab Econ. 2000;18(3):353–376.
[40] Postrel S. Islands of shared knowledge: Specialization and mutual understanding in problem-solvingteams. Organ Sci. 2002;13(3):303–320.
[41] Crowston K, Wei K, Howison J, Wiggins A. Free/Libre open-source software development: What weknow and what we do not know. ACM Computing Surveys (CSUR). 2012;44(2):7.
[42] Scholtes I, Mavrodiev P, Schweitzer F. From Aristotle to Ringelmann: a large-scale analysis of teamproductivity and coordination in Open Source Software projects. Empirical Software Engineering.2015;p. 1–42.
[43] Albrecht AJ, Gaffney Jr JE. Software function, source lines of code, and development effort prediction:a software science validation. Software Engineering, IEEE Transactions on. 1983;(6):639–648.
[44] Rosenberg J. Some misconceptions about lines of code. In: Software Metrics Symposium, 1997.Proceedings., Fourth International. IEEE; 1997. p. 137–142.
[45] Koch S, Schneider G. Effort, co-operation and co-ordination in an open source software project:GNOME. Information Systems Journal. 2002;12(1):27–42.
[46] Alali A, Kagdi H, Maletic J, et al. What’s a typical commit? a characterization of open source softwarerepositories. In: Program Comprehension, 2008. ICPC 2008. The 16th IEEE International Conferenceon. IEEE; 2008. p. 182–191.
[47] Crowston K, Howison J, Annabi H. Information systems success in free and open source softwaredevelopment: Theory and measures. Software Process: Improvement and Practice. 2006;11(2):123–148.
[48] Subramaniam C, Sen R, Nelson ML. Determinants of open source software project success: A longi-tudinal study. Decision Support Systems. 2009;46(2):576–585.
19
[49] Ghapanchi AH, Aurum A, Low G. A taxonomy for measuring the success of open source softwareprojects. First Monday. 2011;16(8).
[50] Crowston K, Howison J. The social structure of free and open source software development. FirstMonday. 2005;10(2).
[51] Mockus A, Fielding RT, Herbsleb JD. Two case studies of open source software development:Apache and Mozilla. ACM Transactions on Software Engineering and Methodology (TOSEM).2002;11(3):309–346.
[52] Wang D, Song C, Barabasi AL. Quantifying long-term scientific impact. Science.2013;342(6154):127–132.
[53] Kalliamvakou E, Gousios G, Blincoe K, Singer L, German DM, Damian D. The promises and perilsof mining GitHub. In: Proceedings of the 11th Working Conference on Mining Software Repositories.ACM; 2014. p. 92–101.
[54] Horwitz SK, Horwitz IB. The effects of team diversity on team outcomes: A meta-analytic review ofteam demography. J Manag. 2007;33(6):987–1015.
20
Supporting InformationUnderstanding the group dynamics and success of teamsby Michael Klug and James P. Bagrow
Table of ContentsS1 GitHub popularity 1
S2 Number of commits per push 1
S3 The distribution of workload across team members 1
S4 Outliers in success do not skew team focus results 2
S5 Experience is weakly related to team success 3
S6 Linear model with secondary team contributions 3
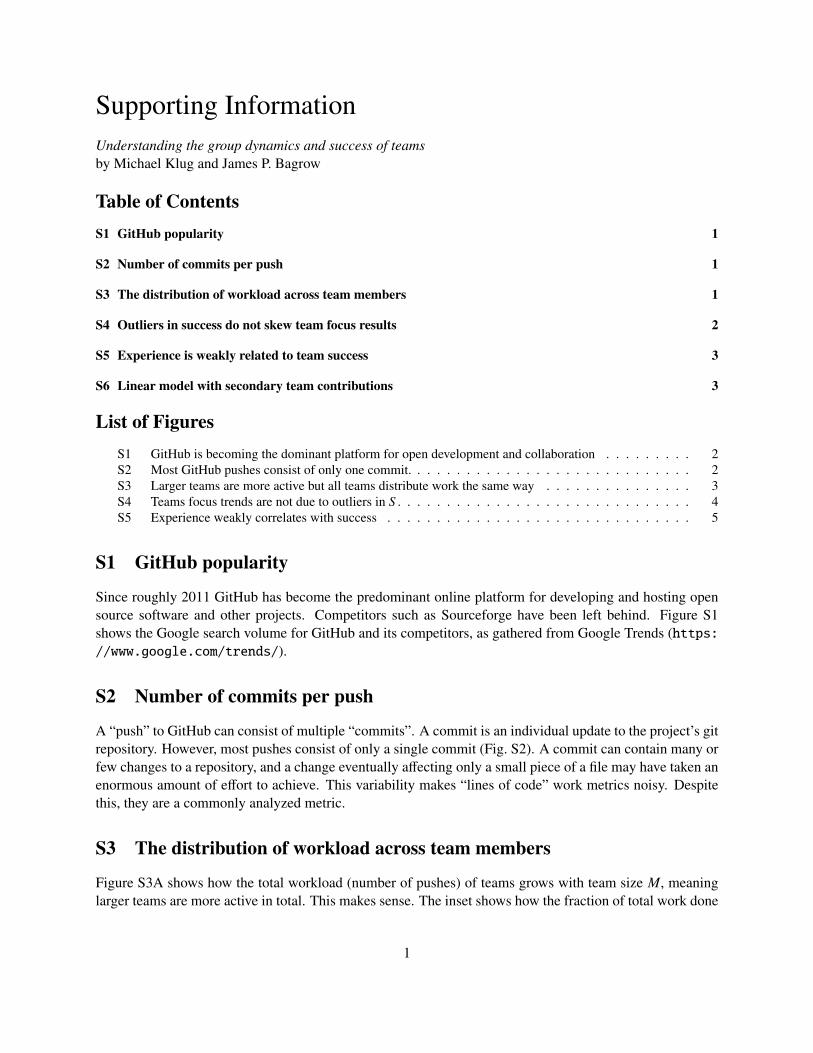
List of FiguresS1 GitHub is becoming the dominant platform for open development and collaboration . . . . . . . . . 2S2 Most GitHub pushes consist of only one commit. . . . . . . . . . . . . . . . . . . . . . . . . . . . . 2S3 Larger teams are more active but all teams distribute work the same way . . . . . . . . . . . . . . . 3S4 Teams focus trends are not due to outliers in S . . . . . . . . . . . . . . . . . . . . . . . . . . . . . . 4S5 Experience weakly correlates with success . . . . . . . . . . . . . . . . . . . . . . . . . . . . . . . 5
S1 GitHub popularity
Since roughly 2011 GitHub has become the predominant online platform for developing and hosting opensource software and other projects. Competitors such as Sourceforge have been left behind. Figure S1shows the Google search volume for GitHub and its competitors, as gathered from Google Trends (https://www.google.com/trends/).
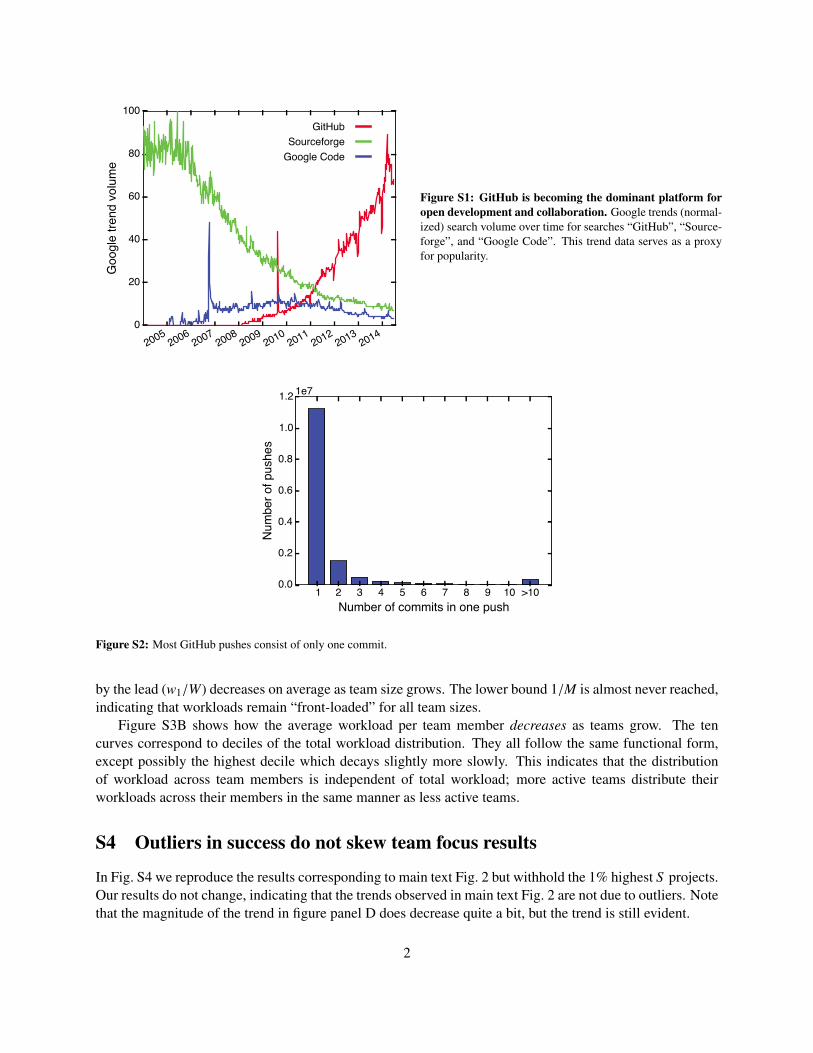
S2 Number of commits per push
A “push” to GitHub can consist of multiple “commits”. A commit is an individual update to the project’s gitrepository. However, most pushes consist of only a single commit (Fig. S2). A commit can contain many orfew changes to a repository, and a change eventually affecting only a small piece of a file may have taken anenormous amount of effort to achieve. This variability makes “lines of code” work metrics noisy. Despitethis, they are a commonly analyzed metric.
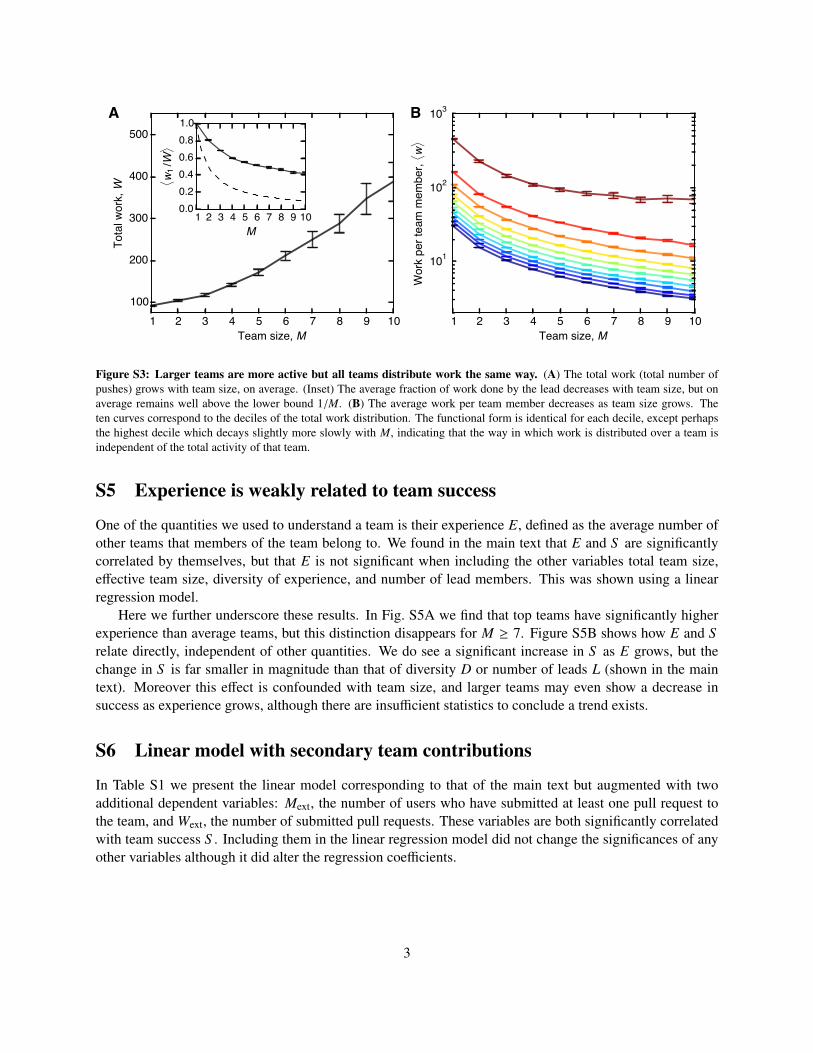
S3 The distribution of workload across team members
Figure S3A shows how the total workload (number of pushes) of teams grows with team size M, meaninglarger teams are more active in total. This makes sense. The inset shows how the fraction of total work done
1
20052006
20072008
20092010
20112012
20132014
0
20
40
60
80
100Go
ogle
trend
volum
eGitHub
SourceforgeGoogle Code
Figure S1: GitHub is becoming the dominant platform foropen development and collaboration. Google trends (normal-ized) search volume over time for searches “GitHub”, “Source-forge”, and “Google Code”. This trend data serves as a proxyfor popularity.
1 2 3 4 5 6 7 8 9 10 >10Number of commits in one push
0.0
0.2
0.4
0.6
0.8
1.0
1.2
Num
ber o
f pus
hes
1e7
Figure S2: Most GitHub pushes consist of only one commit.
by the lead (w1/W) decreases on average as team size grows. The lower bound 1/M is almost never reached,indicating that workloads remain “front-loaded” for all team sizes.
Figure S3B shows how the average workload per team member decreases as teams grow. The tencurves correspond to deciles of the total workload distribution. They all follow the same functional form,except possibly the highest decile which decays slightly more slowly. This indicates that the distributionof workload across team members is independent of total workload; more active teams distribute theirworkloads across their members in the same manner as less active teams.
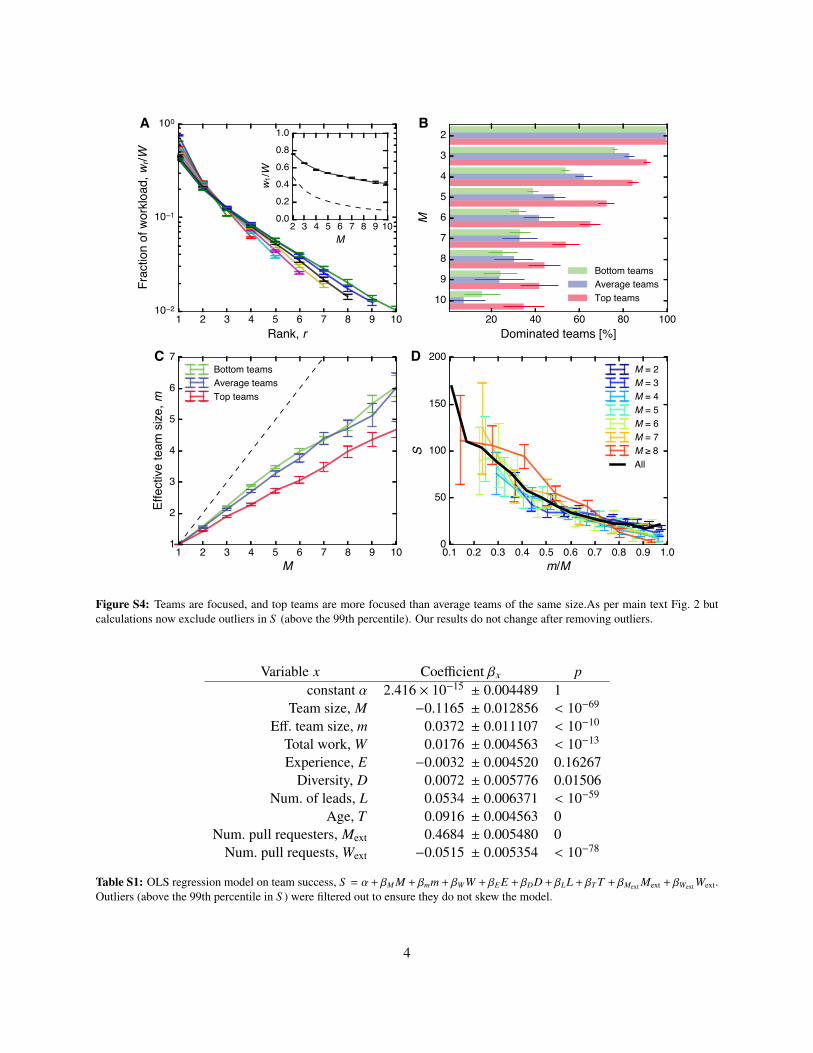
S4 Outliers in success do not skew team focus results
In Fig. S4 we reproduce the results corresponding to main text Fig. 2 but withhold the 1% highest S projects.Our results do not change, indicating that the trends observed in main text Fig. 2 are not due to outliers. Notethat the magnitude of the trend in figure panel D does decrease quite a bit, but the trend is still evident.
2
1 2 3 4 5 6 7 8 9 10Team size, M
101
102
103
Wor
k per
team
mem
ber, ⟨ w⟩
B
1 2 3 4 5 6 7 8 9 10Team size, M
100
200
300
400
500To
tal w
ork,
WA
1 2 3 4 5 6 7 8 9 10M
0.00.20.40.60.81.0
⟨ w 1/W⟩
Figure S3: Larger teams are more active but all teams distribute work the same way. (A) The total work (total number ofpushes) grows with team size, on average. (Inset) The average fraction of work done by the lead decreases with team size, but onaverage remains well above the lower bound 1/M. (B) The average work per team member decreases as team size grows. Theten curves correspond to the deciles of the total work distribution. The functional form is identical for each decile, except perhapsthe highest decile which decays slightly more slowly with M, indicating that the way in which work is distributed over a team isindependent of the total activity of that team.
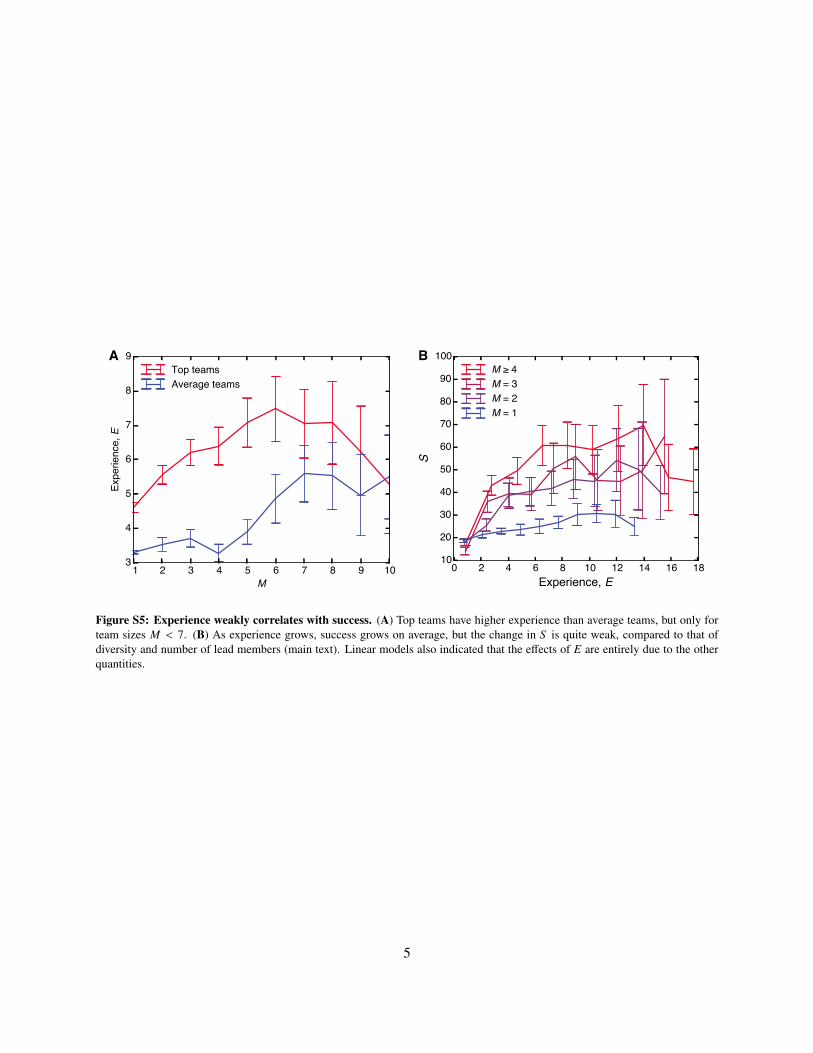
S5 Experience is weakly related to team success
One of the quantities we used to understand a team is their experience E, defined as the average number ofother teams that members of the team belong to. We found in the main text that E and S are significantlycorrelated by themselves, but that E is not significant when including the other variables total team size,effective team size, diversity of experience, and number of lead members. This was shown using a linearregression model.
Here we further underscore these results. In Fig. S5A we find that top teams have significantly higherexperience than average teams, but this distinction disappears for M ≥ 7. Figure S5B shows how E and Srelate directly, independent of other quantities. We do see a significant increase in S as E grows, but thechange in S is far smaller in magnitude than that of diversity D or number of leads L (shown in the maintext). Moreover this effect is confounded with team size, and larger teams may even show a decrease insuccess as experience grows, although there are insufficient statistics to conclude a trend exists.
S6 Linear model with secondary team contributions
In Table S1 we present the linear model corresponding to that of the main text but augmented with twoadditional dependent variables: Mext, the number of users who have submitted at least one pull request tothe team, and Wext, the number of submitted pull requests. These variables are both significantly correlatedwith team success S . Including them in the linear regression model did not change the significances of anyother variables although it did alter the regression coefficients.
3
20 40 60 80 100Dominated teams [%]
23456789
10
M
B
Bottom teamsAverage teamsTop teams
1 2 3 4 5 6 7 8 9 10M
1
2
3
4
5
6
7
Effe
ctive
team
size
, m
CBottom teamsAverage teamsTop teams
1 2 3 4 5 6 7 8 9 10Rank, r
10 2
10 1
100
Frac
tion
of w
orklo
ad, w
r/WA
2 3 4 5 6 7 8 9 10M
0.00.20.40.60.81.0
w 1/W
0.1 0.2 0.3 0.4 0.5 0.6 0.7 0.8 0.9 1.0m/M
0
50
100
150
200
S
DM = 2M = 3M = 4M = 5M = 6M = 7M 8All
Figure S4: Teams are focused, and top teams are more focused than average teams of the same size.As per main text Fig. 2 butcalculations now exclude outliers in S (above the 99th percentile). Our results do not change after removing outliers.
Variable x Coefficient βx pconstant α 2.416 × 10⁻¹⁵ ± 0.004489 1
Team size, M −0.1165 ± 0.012856 < 10−69
Eff. team size, m 0.0372 ± 0.011107 < 10−10
Total work, W 0.0176 ± 0.004563 < 10−13
Experience, E −0.0032 ± 0.004520 0.16267Diversity, D 0.0072 ± 0.005776 0.01506
Num. of leads, L 0.0534 ± 0.006371 < 10−59
Age, T 0.0916 ± 0.004563 0Num. pull requesters, Mext 0.4684 ± 0.005480 0
Num. pull requests, Wext −0.0515 ± 0.005354 < 10−78
Table S1: OLS regression model on team success, S = α + βM M + βmm + βW W + βE E + βDD + βLL + βT T + βMext Mext + βWext Wext.Outliers (above the 99th percentile in S ) were filtered out to ensure they do not skew the model.
4
1 2 3 4 5 6 7 8 9 10M
3
4
5
6
7
8
9
Expe
rienc
e, E
ATop teamsAverage teams
0 2 4 6 8 10 12 14 16 18Experience, E
10
20
30
40
50
60
70
80
90
100
S
BM 4M = 3M = 2M = 1
Figure S5: Experience weakly correlates with success. (A) Top teams have higher experience than average teams, but only forteam sizes M < 7. (B) As experience grows, success grows on average, but the change in S is quite weak, compared to that ofdiversity and number of lead members (main text). Linear models also indicated that the effects of E are entirely due to the otherquantities.
5