understanding the deep syn-rift petroleum systems of cauvery
TRANSCRIPT

Schlumberger Information Solutions, Navi Mumbai- 400706, India.
Email: [email protected]
10th Biennial International Conference & Exposition
P 254
Understanding the Deep Syn-Rift Petroleum Systems of Cauvery Basin: A
2D Case Study from Ramnad Basin
S. Dubey* and M. Mahapatra
Summary
Ramnad basin is a proven province producing from siliciclastic reservoirs of upper Cretaceous Nannilam and Bhuvanagiri
formations. The source rocks of late Jurassic age are fully mature and are well within the gas window. Numerous structural
and stratigraphic traps have been interpreted in the past. The deeper syn-rift sequences hosting good quality sandstone
sequences have not been targeted for exploration so far. 2D petroleum systems modelling carried out on a NW-SE section
aims to increase the understanding of the behaviour of deeper petroleum systems in the area.
Keywords: Petroleum Systems Modelling, Ramnad Basin, Cauvery Basin, Petroleum Migration, Source rock Maturity
Introduction
Petroleum systems modeling is a vital additional
component in assessing exploration risk before drilling, as
risks can be associated with reservoir location, structural
or stratigraphical traps, source rock maturation or regional
level seals holding hydrocarbons in place. By integrating
geological, geophysical, petrophysical and well data one
can model the evolution of basin and petroleum systems
with time.
Petroleum systems modelling helps to predict which traps
are most likely to contain hydrocarbons, as well as the type
of expected hydrocarbons and their properties.
Till date most of the exploration has targeted shallow
reservoirs such as the Bhuvnagiri, Nannilam and
Kamlapuram sandstones in the Ramnad sub-basin. This
case study aims to understand the petroleum systems
elements and their influence on hydrocarbon generation,
expulsion, migration and accumulation through geological
time.
Geological Settings of Cauvery Basin
The Cauvery basin forms the southwestern margin of the
Jurassic rift of the east coast of India (Figure 1). The
Cauvery Basin is an intra-cratonic rift basin, divided into a
number of sub-parallel horsts and graben, trending in NE-
SW direction (Vasudevan et al, 1998). The basin formed
during the fragmentation of Gondwana land during the
drifting of the India-Sri Lanka landmass away from the
Antarctica/Australia continental plate during Late Jurassic
to Early Cretaceous time. The Ramnad sub-basin is
bounded by the Pattukottai high in the northwest and in the
southeast by the Mandapam-Delft ridge .The sub basin
holds sediments over 6000 m in thickness, ranging in age
from late Jurassic to Recent.
Figure 1: Location map showing the cross section location

2
Petroleum Systems of Ramnad Sub-Basin
Exploration in the Ramnad sub-basin has provided a good
insight into the petroleum systems of the area. Known
reservoirs in the area are the middle Cretaceous Bhuvnagiri
sandstones, upper Cretaceous Nannilam sandstones and
Kamlapuram sands of Paleocene age (Chandra et al, 2006).
The syn-rift sequences of the Andimadam formation are
still not well understood in terms of source and reservoir
distribution. With the majority of production coming from
the Nannilam reservoirs, deeper reservoir formations of
Andimadam sequence are likely to be a next potential
target for hydrocarbon exploration.
The known source facies are established in the
lower Cretaceous Andimadam formation. Alternate
streaks of shale sequences in deeper parts are known to
have good source rock potential. These shales are
typically the main source rock encountered in the study
area. The source rocks are typically a mixture of type II-III
facies (Vasudevan et al, 2008). The area has good seals in
place, with shale sequences of Cenomanian, Santonian,
and Maastrichtian being the major regional seals
(Figure 2).
Figure 2: Generalized stratigraphy of Cauvery Basin with
indications of the different petroleum system elements
considered in the present study. (Modified after Chaudhuri et.
al., 2009)
Petroleum Systems Modelling Input
A 2D numerical model was constructed using a present
day, depth converted cross section from Ramnad
sub-basin (Chaudhuri et al, 2008). The cross section
with multiple horizons and faults was digitized to
define physical layers between the horizons (Figure 3).
Each layer was assigned with different lithological
properties and was given a stratigraphical age. Using
public domain data, identified layers were assigned to
different petroleum system elements such as source,
reservoir, seal and overburden. Kinetic input parameters
for type III source rock developed by (Pepper & Corvi,
1995) were used for kinetic modelling. Other input
parameters such as lithology, TOC, HI and erosion inputs
were also defined for the numerical model. Necessary
input parameters such as Paleo Water Depth (PWD),
Heat Flow (HF) and Sediment Water Interface
Temperature (SWIT) were also defined for the model as
boundary conditions. The model was simulated and
thermally calibrated to understand the basin and
petroleum systems evolution through geological time
scale.
Figure 3: Depth Cross section from Ramnad basin, showing
different layers and sub-division of layers along with faults.
Thermal Calibration
The simulated model was thermally calibrated against
the present day temperature and measured vitrinite
reflectance values, obtained from well RA-1, which is
located on the geological cross section used for modelling
(Figure 4).

3
Figure 4: Modelled temperature curve is calibrated against the
present day temperature and vitrinite reflectance value from well
RA-1.
Simulation Output: Burial History
A 1D profile extracted along the well RA-1 shows
that the source rocks from late Jurassic to Aptian show
different source rock transformation ratios with increasing
depth (Figure 5). At present day all the source rocks with
the exception of the shales in upper Andimadam
sequence, show more than 50% transformation from
kerogene to hydrocarbons. From the burial history it can
be inferred that deeper source rocks show signs of maturity
as early as lower Cretaceous. The shallower source
sequences however still have good potential to be
converted into hydrocarbons.
Figure 5: Burial history curve showing transformation ratio of the known and assumed source rock sequences within Andimadam
formation of late Jurassic to early Cretaceous.
Figure 6: Sweeney & Burnham maturity overlay showing maturity window for all the source rocks (white borders) considered in the
petroleum systems model.

4
Source Rock Maturity
Petroleum systems modelling indicates that all the known
source sequences from late Jurassic to pre Albian times are
mature and are in oil and gas windows. The deeper source
rocks of late Jurassic sequence are in dry gas window and
all other Cretaceous source rocks are in the oil window
(Figure 6). While the lower Jurassic formations had
entered late oil window, lower Cretaceous source rock
within Aptian and pre Aptian formations entered the main
oil window during Santonian – Campanian. Modelling
thus confirms the trends which have been previously
established by Phaye et. al., 2011.
Figure 7: Plot showing the generation potential (in Mtons) of
different source rocks for a) Pepper & Corvi type III kinetic
reaction b) Tissot in Waples type III kinetic reaction.
Hydrocarbon Generation
Most of the hydrocarbons which have been generated in
the Ramnad basin are thermogenic in nature (Vasudevan
et al, 2008). The source rocks of late Jurassic formations
achieved peak generation during late Cretaceous time.
Also, the deeper Oxfordian source rocks show a similar
trend but have generated lesser hydrocarbon masses.
Within the Cretaceous sequence, the source rocks show
lesser generation potential of hydrocarbons. Both the
source layers within the Andimadam formations are still
showing increasing trend of hydrocarbon generation
potential. Due to shallow burial depth the generation
potential of these source layers are lower (Figure 7a). A
sensitivity analysis was done by applying another
thermogenic kinetic reaction developed by Tissot and
Waples (1992) for type III kerogen. Application of Tissot
and Waples (1992) indicates that the source rocks show
different behaviour with respect to hydrocarbon
generation. More rapid and sudden attainment of peak
generation is achieved for deeper source rocks within late
Jurassic and Early Cretaceous (Figure 7b). It is likely that
the expulsion for deeper source rocks could have been
around late Cretaceous to early Tertiary times. Vasudevan
et al (2008) also discussed the possibility of the source
rocks reaching their expulsion stages during the same time.
Thus kinetic reaction is a key to understand hydrocarbon
generation and explusion from the source rocks, but
uncertainties must be taken into account.
Hydrocarbon Migration & Accumulation
Migration modelling has indicated that most of the
sandstone sequences encountered in Andimadam can serve
as a good reservoir, and that hydrocarbons can potentially
accumulate (Figure 8). Both structural and stratigraphic
traps were in place during the evolution of basin at
different times. Migration routes within the area are mostly
vertical due to buoyancy. At some places, faults can also
be seen acting as a conduit for fluid migration. The model
considers the effect of open and close faults for
understanding the hydrocarbon migration, which takes
place during different time steps of basin evolution (Figure
8). The stratigraphical and structural traps present within
the Andimadam formation can be a good target for deeper
exploration in future (Figure 9).
Conclusions
• Petroleum systems modelling of Ramnad Basin has
provided a new insight with respect to hydrocarbon
generation, explusion, migration and accumulation
within the syn-rift sequences of Andimadam
formation.
• The early syn-rift sequences, having source facies
are fully mature and are within the gas window.
The upper sequences which are potential source
rocks fall within the oil window during present day.
• Deeper source rocks in Andimadam formation
show a transformation ratio of more than 80%
while the potential source rocks in upper
Andimadam formations show an attainment of
more than 50%.
• Thermal calibration for well RA-1 was achieved
against the temperature and VRo values.
• The generation potential of deeper source rocks
remains unchanged but shows a steep rise which
depicts from the sensitivity analysis of thermogenic
kinetics.
• Hydrocarbon generation in Ramnad basin starts
during lower Cretaceous and attains peak during
5
upper Cretaceous time. The shallow sources started
generating hydrocarbon from mid Cretaceous time
and have not attained their peak generation
capacity.
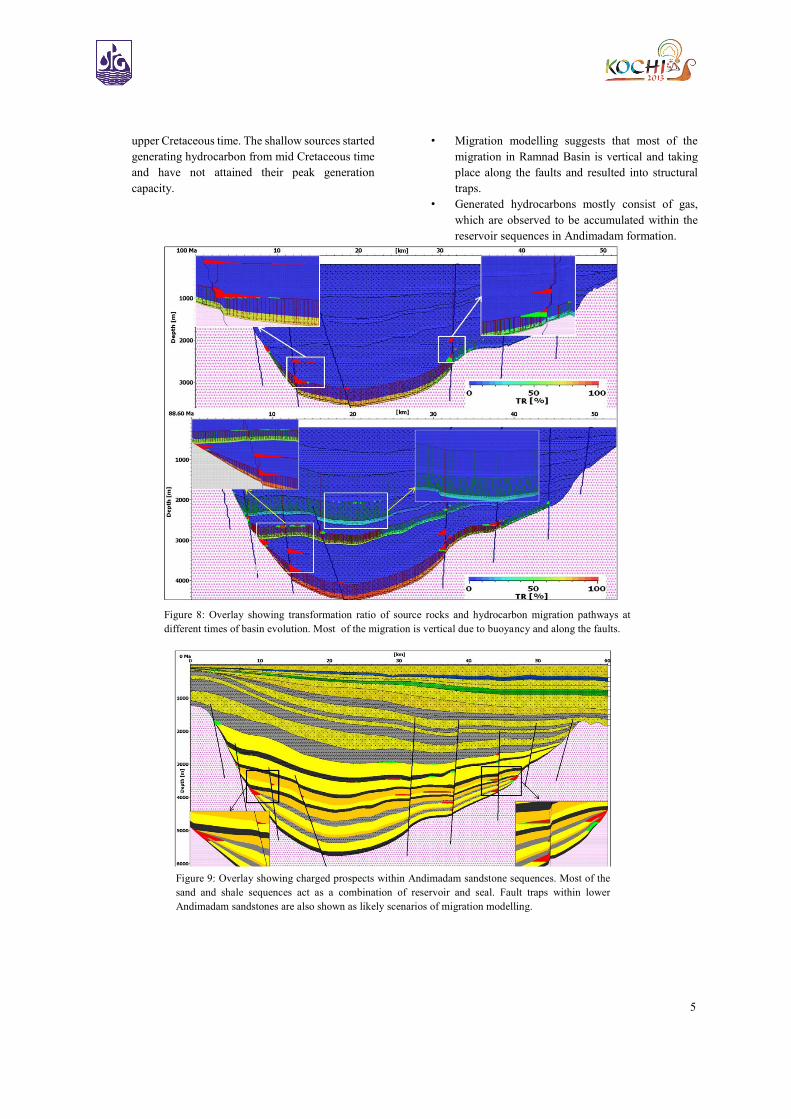
• Migration modelling suggests that most of the
migration in Ramnad Basin is vertical and taking
place along the faults and resulted into structural
traps.
• Generated hydrocarbons mostly consist of gas,
which are observed to be accumulated within the
reservoir sequences in Andimadam formation.
Figure 8: Overlay showing transformation ratio of source rocks and hydrocarbon migration pathways at
different times of basin evolution. Most of the migration is vertical due to buoyancy and along the faults.
Figure 9: Overlay showing charged prospects within Andimadam sandstone sequences. Most of the
sand and shale sequences act as a combination of reservoir and seal. Fault traps within lower
Andimadam sandstones are also shown as likely scenarios of migration modelling.

6
Acknowledgements
We sincerely thank Mr J.P. Dobriyal (ONGC- Cauvery
Basin) and other authors who have allowed us to use the
data for extending the work and our further research.
References
Chandra, S., Gideon, N.D., Chaturvedi, C., Rana, M.S.,
Basin Inversion and Hydrocarbon Entrapment in Ramnad
& Palk Bay Offshore of Cauvery Basin, India, 6th
International Conference & Exposition on Petroleum
Geophysics, Kolkata 2006.
Chaudhuri, A., Rao, M.V., Dobriyal, J.P., Saha, G.C.,
Chidambaram, L., Mehta, A.K., Lalam, V.R. and Murthy,
K.S., Prospectivity of Cauvery Basin in Deep Syn-rift
Sequences, SE India, AAPG Annual Convention and
Exhibition, Denver, Colorado, USA, June 7-10, 2009.
Pepper, A.S., Corvi, P.J., 1995, Simple Kinetic Models of
Petroleum Formation, Part I: Oil and Gas from Kerogene,
Journal of Marine and Petroleum Geology, Vol 12, No.3,
pp. 291-319.
Phaye, D.K., Nambiar, M.V. and Srivastava, D.K.,
Evaluation of Petroleum Systems of Ariyalur-Pondicherry
sub-basin (Bhuvangiri area) of Cauvery basin, India: A two
dimensional (2-D) basin modeling study, GEO-INDIA,
12th – 14th Jan, 2011.
Vasudevan, K., Silvester,J.M., Murthy, J.V.S.S.N.,
Rangachari, V. and Ananthanarayanan, P.N. (1998):
“Exploration for
Stratigraphic and Subtle Traps in Cauvery Basin : Lessons
Learnt and Future Perspective” in Proceedings of
Workshop on Integrated Exploration for Stratigraphic and
Subtle Traps, Dehra Dun, Bulletin of Oil and Natural Gas
Corporation, V.35, No.2 (Dec. 1998) p75-92.
Vasudevan, K., Ramana, L.V., Nagasudha, V., Borthakur,
A., Das, A.K., Petroleum System and Play Types of Synrift
Sequences, Ramand Sub-basin, Cauvery Basin, P-135,
SPG Hyderabad, 2008.
Waples, D.W., Kamata, H., Suizu, M., 1992, The Art of
Maturity Modelling. Part I: Alternative Models and
Sensitivity Analysis, AAPB Bulletin, Vol. 76, No.1, pp.
47-66.