understanding the circular flow of the macroeconomy · 2018-09-06 · the income firms pay to...
TRANSCRIPT

Advanced Placement Economics Macroeconomics: Student Resource Manual © Council for Economic Education, New York, N.Y. 57
2 Macroeconomics
Understanding the Circular Flow of the Macroeconomy
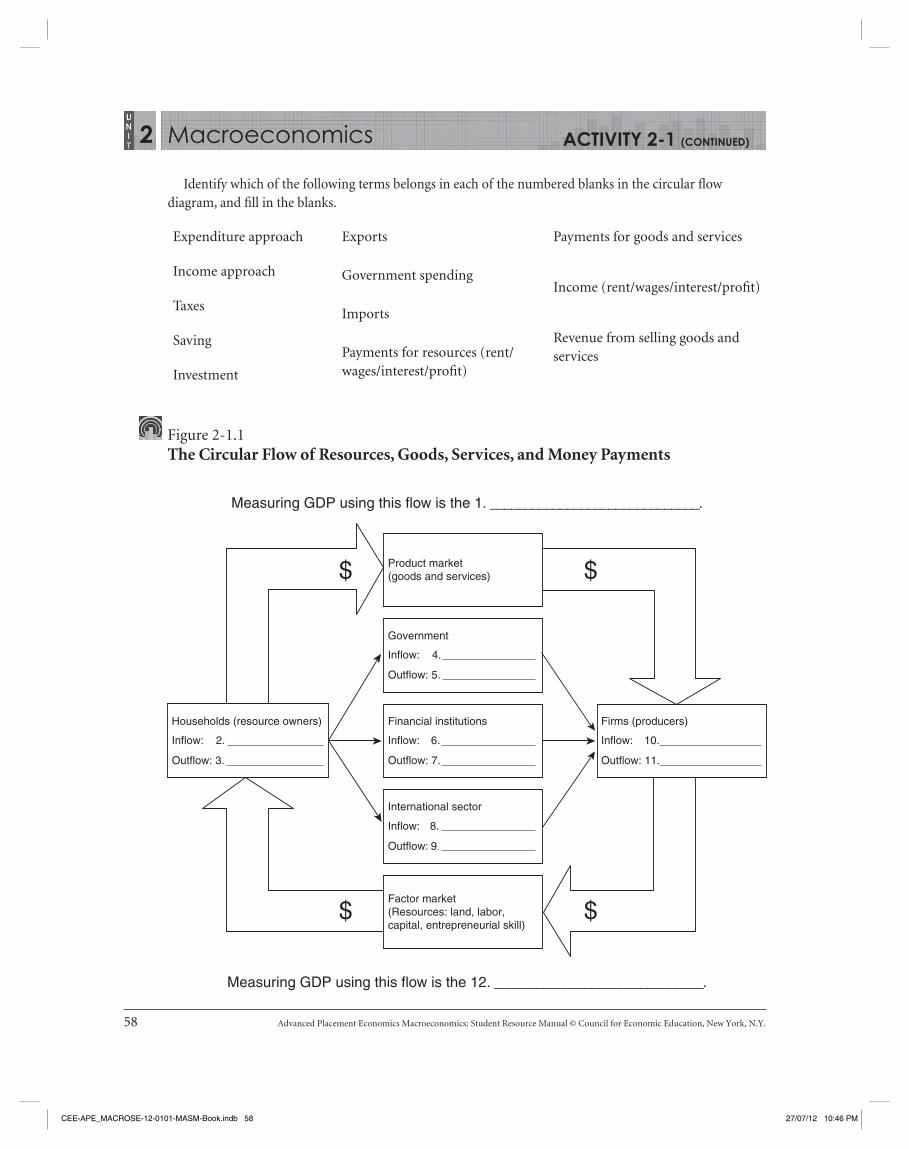
Firms provide goods and services to households through the product market. Households pay firms for these goods and services.
Households supply firms with the factors of production (also called resources) through the factor market. Firms pay households for resources (land, labor, capital, and entrepreneurial skill).
The income firms pay to households includes rent, wages, interest, and profits. It equals the dollar value of the output sold as shown in the circular flow diagram in Figure 2-1.1. The flow on the diagram that includes expenditures for goods and services produced and sold in the product market represents gross domestic product (GDP). The approach to measuring GDP using this flow is called the expenditures approach.
Student Alert: Using the expenditures approach,
GDP = C + I + G + Xn.
The details about this equation for GDP are developed in a later activity. For now, make sure you understand how the expenditures approach measures GDP, and that this equation forms the basis for models developed throughout the rest of the course.
The flow on the diagram that includes payments for the resources used to produce goods and services in the factor market is another way to represent GDP. The approach to measuring GDP using this flow is called the income approach.
In addition to the basic flow of economic activity illustrated by the flows between the product and factor markets shown on the outside of the diagram, there are leakages from the flow and injections into the flow that affect its size. The leakages and injections happen through the government, financial institutions (e.g., banks), and international trade. These are shown using the boxes in the center of the circular flow diagram.
ACTIVITY 2-1
CEE-APE_MACROSE-12-0101-MASM-Book.indb 57 27/07/12 10:46 PM
58 Advanced Placement Economics Macroeconomics: Student Resource Manual © Council for Economic Education, New York, N.Y.
2 Macroeconomics
Product market(goods and services)
Factor market(Resources: land, labor,capital, entrepreneurial skill)
$
$ $
$
Government
Inflow: 4.
Outflow: 5.
Financial institutions
Inflow: 6.
Households (resource owners)
Outflow: 3.
Inflow: 2.
Outflow: 7.
International sector
Inflow: 8.
Outflow: 9.
Firms (producers)
Inflow: 10.
Outflow: 11.
Figure 2-1.1The Circular Flow of Resources, Goods, Services, and Money Payments
ACTIVITY 2-1 (CONTINUED)
Measuring GDP using this flow is the 1. ______________________________.
Measuring GDP using this flow is the 12. ______________________________.
Expenditure approach
Income approach
Taxes
Saving
Investment
Exports
Government spending
Imports
Payments for resources (rent/ wages/interest/profit)
Payments for goods and services
Income (rent/wages/interest/profit)
Revenue from selling goods and services
Identify which of the following terms belongs in each of the numbered blanks in the circular flow diagram, and fill in the blanks.
CEE-APE_MACROSE-12-0101-MASM-Book.indb 58 27/07/12 10:46 PM

Advanced Placement Economics Macroeconomics: Student Resource Manual © Council for Economic Education, New York, N.Y. 59
2 Macroeconomics
Gross Domestic Product
Measuring Short-Run Economic Growth
Fluctuations in output are measured by increases or decreases in the quantity of goods and services produced in the economy over time. The gross domestic product, or GDP, is commonly used to measure economic growth. The GDP is the dollar value of all final goods and services produced in the economy during a stated period.
Final goods are goods intended for consumers. For example, gasoline is a final good purchased by consumers but crude oil, used to make gasoline, is not.
Note that GDP does not count the purchase of secondhand goods or stocks and bonds because these do not represent new production during the year. GDP also does not include items that are not exchanged in a legal market (e.g., mowing your own lawn, caring for your own children, or purchasing illegal goods).
Is This Counted as Part of GDP?
Determine if each of the following is included or excluded when calculating GDP. Briefly explain why.
1. A monthly check received by an economics student who has been granted a government scholarship
2. A farmer’s purchase of a new tractor
3. A plumber’s purchase of a two-year-old used truck
4. Cashing a U.S. government bond
5. The services of a barber cutting his own hair
6. A Social Security check from the government to a retired store clerk
7. Chevrolet’s purchase of tires to put on the cars they are producing
8. The government’s purchase of a new submarine for the Navy
9. A barber’s income from cutting hair
10. Income received from the sale of Nike stock
ACTIVITY 2-2
CEE-APE_MACROSE-12-0101-MASM-Book.indb 59 27/07/12 10:46 PM

60 Advanced Placement Economics Macroeconomics: Student Resource Manual © Council for Economic Education, New York, N.Y.
2 Macroeconomics
GDP: Is It Counted and Where?
For each of the following items, write one of the following in the space provided:
C if the item is counted as consumption spending.
I if the item is counted as investment spending.
G if the item is counted as government spending.
Xn if the item is counted as net exports.
NC if the item is not counted in GDP.
____11. You spend $10.00 to see a movie.
____12. A family pays a contractor $150,000 for a house he built for them this year.
____13. A family pays $75,000 for a house built three years ago.
____14. An accountant pays a tailor $175 to sew a suit for her.
____15. The government increases its defense expenditures by $1,000,000,000.
____16. The government makes a $300 Social Security payment to a retired person.
____17. You buy McDonald’s stock for $1,000 in the stock market.
____18. At the end of a year, a flour-milling firm finds that its inventories of grain and flour are $10,000 higher than its inventories at the beginning of the year.
____19. Parents work hard caring for their two children.
____20. Ford Motor Company buys new auto-making robots.
____21. You pay $800 a month to rent an apartment.
____22. Consumer electronics corporation Apple Inc. builds a new factory in the United States.
____23. R.J. Reynolds buys control of Nabisco.
____24. You buy a new Toyota that was made in Japan.
____25. You pay tuition to attend college.
ACTIVITY 2-2 (CONTINUED)
CEE-APE_MACROSE-12-0101-MASM-Book.indb 60 27/07/12 10:46 PM

Advanced Placement Economics Macroeconomics: Student Resource Manual © Council for Economic Education, New York, N.Y. 61
2 Macroeconomics
Inflation
Inflation is an overall increase in the price level in an economy. Deflation is the opposite of inflation. Deflation is an overall decrease in the price level. A change in the price of just one or a few goods does not constitute inflation or deflation. After the price level increases, a dollar will buy less than it would before. When there is going to be inflation, people are better off buying now, before prices go up. After the price level falls, a dollar will buy more than it would before. When there is going to be deflation, people are better off waiting to buy later, when prices go down.
If people anticipate inflation, they will build that expectation into their decisions. For example, workers will demand higher wages to keep their purchasing power the same if prices are expected to rise. Then, when inflation leads to higher prices, workers are not hurt or helped because their higher wages allow them to purchase the same amount of goods and services. However, when inflation is unanticipated, people do not build it into their decisions, and some people are hurt while others are helped. For example, when there is unanticipated inflation, borrowers are helped while lenders are hurt. People who borrow money receive a loan before prices rise, when the money will buy more. However, they pay the money back later, after prices rise, when the money won’t buy as much. With inflation, the borrower gains while the lender loses.
Student Alert: Inflation is an increase in the price level in the economy. It does not necessarily mean that the price of every good is going up!
Measuring Price Changes
A price index is used to measure price changes in the economy. Price indices combine the prices of a bundle of goods and services and track changes in the price of that bundle over time. The Consumer Price Index, or CPI, is the most familiar price index. It measures changes in the price of a bundle of goods and services commonly bought by consumers. The CPI is based on a market basket of more than 200 categories of goods and services weighted according to how much the average consumer spends on them. Two other price indices are the Producer Price Index (PPI) and the GDP deflator. The PPI measures the average change over time in the selling prices received by domestic producers for their output. The GDP price deflator is the most inclusive index because it takes into account the prices of all goods and services produced.
To construct any price index, economists select a year to serve as the base year (the year used for comparison). The prices of other periods are expressed as a percentage of the base period. The value of a price index in the base year is 100, because prices in the base year are 100 percent of prices in that year. Inflation will raise the price of the market basket, and the price index will rise. Deflation will decrease the price of the market basket, and the price index will fall.
For the CPI, the formula used to measure price change from the base period is
CPI = cost of market basket in current-year prices
× 100.cost of market basket in base-year prices
ACTIVITY 2-3
CEE-APE_MACROSE-12-0101-MASM-Book.indb 61 27/07/12 10:46 PM
62 Advanced Placement Economics Macroeconomics: Student Resource Manual © Council for Economic Education, New York, N.Y.
2 Macroeconomics
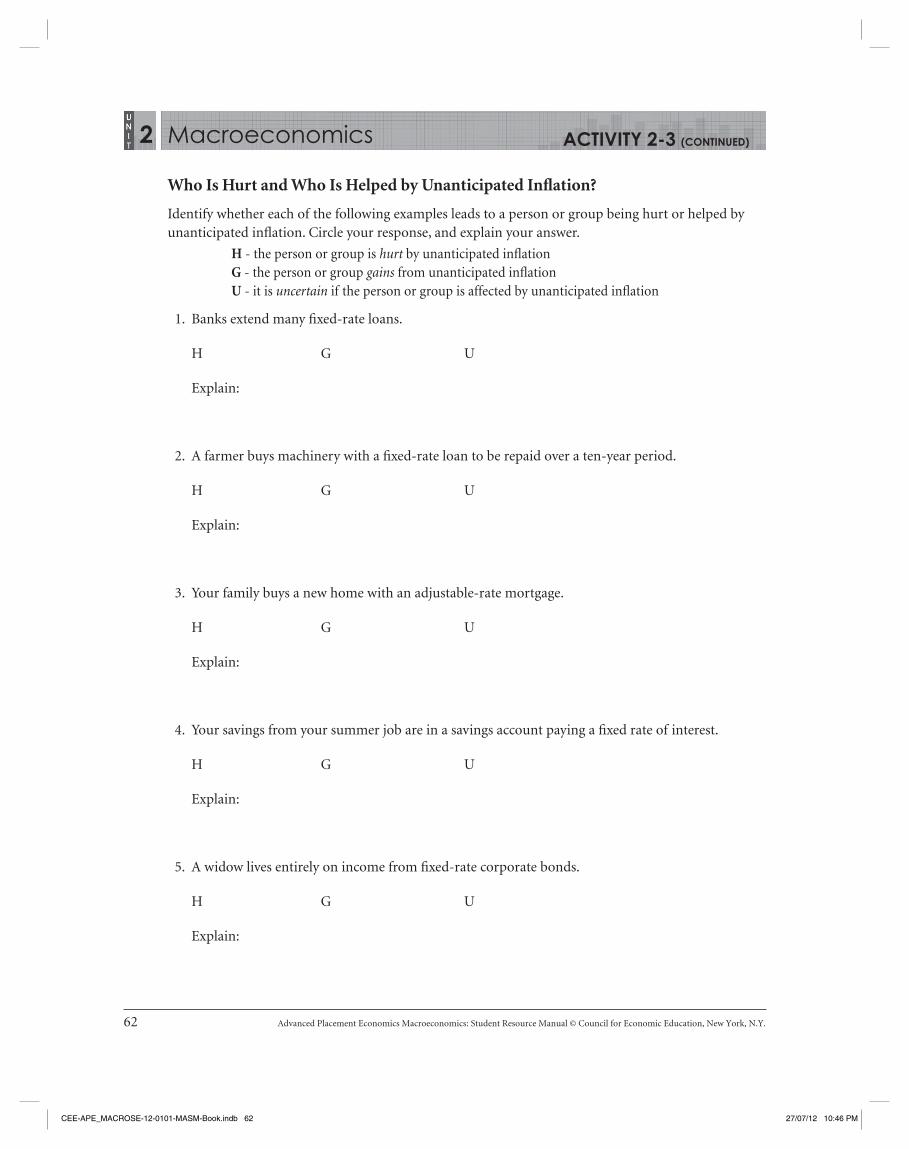
Who Is Hurt and Who Is Helped by Unanticipated Inflation?
Identify whether each of the following examples leads to a person or group being hurt or helped by unanticipated inflation. Circle your response, and explain your answer.
H - the person or group is hurt by unanticipated inflation G - the person or group gains from unanticipated inflationU - it is uncertain if the person or group is affected by unanticipated inflation
1. Banks extend many fixed-rate loans.
H G U
Explain:
2. A farmer buys machinery with a fixed-rate loan to be repaid over a ten-year period.
H G U
Explain:
3. Your family buys a new home with an adjustable-rate mortgage.
H G U
Explain:
4. Your savings from your summer job are in a savings account paying a fixed rate of interest.
H G U
Explain:
5. A widow lives entirely on income from fixed-rate corporate bonds.
H G U
Explain:
ACTIVITY 2-3 (CONTINUED)
CEE-APE_MACROSE-12-0101-MASM-Book.indb 62 27/07/12 10:46 PM

Advanced Placement Economics Macroeconomics: Student Resource Manual © Council for Economic Education, New York, N.Y. 63
2 Macroeconomics
6. A retired couple lives entirely on income from a fixed-rate pension the woman receives from her former employer.
H G U
Explain:
7. A retired man lines entirely on income from Social Security.
H G U
Explain:
8. A retired bank official lives entirely on income from stock dividends.
H G U
Explain:
9. The federal government has a $14 trillion debt.
H G U
Explain:
10. A firm signs a contract to provide maintenance services at a fixed rate for the next five years.
H G U
Explain:
11. A state government receives revenue mainly from an income tax.
H G U
Explain:
ACTIVITY 2-3 (CONTINUED)
CEE-APE_MACROSE-12-0101-MASM-Book.indb 63 27/07/12 10:46 PM

64 Advanced Placement Economics Macroeconomics: Student Resource Manual © Council for Economic Education, New York, N.Y.
2 Macroeconomics
12. A local government receives revenue mainly from fixed-rate license fees charged to businesses.
H G U
Explain:
13. Your friend rents an apartment with a three-year lease.
H G U
Explain:
14. A bank has loaned millions of dollars for home mortgages at a fixed rate of interest.
H G U
Explain:
15. Parents are putting savings for their child’s college education in a bank savings account.
H G U
Explain:
ACTIVITY 2-3 (CONTINUED)
CEE-APE_MACROSE-12-0101-MASM-Book.indb 64 27/07/12 10:46 PM

Advanced Placement Economics Macroeconomics: Student Resource Manual © Council for Economic Education, New York, N.Y. 65
2 Macroeconomics
Price Indices and Real versus Nominal Values
Real versus Nominal Values
Prices in an economy do not stay the same. Over time the price level changes (i.e., there is inflation or deflation). A change in the price level changes the value of economic measures denominated in dollars. Values that increase or decrease with the price level are called nominal values. Real values are adjusted for price changes. That is, they are calculated as though prices did not change from the base year. For example, gross domestic product (GDP) is used to measure fluctuations in output. However, since GDP is the dollar value of goods and services produced in the economy, it increases when prices increase. This means that nominal GDP increases with inflation and decreases with deflation. But when GDP is used as a measure of short-run economic growth, we are interested in measuring increases or decreases in output, not prices. That is why real GDP is a better measure of economic performance—real GDP takes out the effects of price changes and allows us to isolate changes in output. Price indices are used to adjust for price changes. They are used to convert nominal values into real values.
Calculating Price Indices
The first step in converting nominal values to real values is to create a price index. A price index compares the total cost of a fixed market basket of goods in different years. The total cost of the market basket is found by multiplying the price of each item in the basket by the quantity of the item in the basket and then summing the results for all items. The cost of the market basket in the current year is then divided by the cost of the basic market basket in the base year as shown below:
Price index = current-year cost
× 100.base-year cost
Multiplying by 100 allows comparison of the index in each year to the base-year index value of 100. The base year always has an index number of 100 since the current-year cost and the base-year cost of the market basket are the same in the base year.
The Consumer Price Index (CPI) is a commonly used price index that measures the price of a market basket of consumer goods. The following example shows how the CPI can be used to measure inflation.
ACTIVITY 2-4
CEE-APE_MACROSE-12-0101-MASM-Book.indb 65 27/07/12 10:46 PM

66 Advanced Placement Economics Macroeconomics: Student Resource Manual © Council for Economic Education, New York, N.Y.
2 Macroeconomics
Assume an average consumer buys only three items, as shown in Table 2-4.1.
Table 2-4.1Prices of Three Goods Compared with Base-Year Price
Quantity bought in base year
Unit price in base
year
Spending in base
year
Unit price in Year 1
Spending in Year 1
Unit price in Year 2
Spending in Year 2
Whole pizza 30 $5.00 $7.00 $9.00
Flash drive 40 $6.00 $5.00 $4.00
Six-pack of soda
60 $1.50 $2.00 $2.50
Total – – – –
Fill in the blanks in Table 2-4.1.
1. How much would $100 of goods and services purchased in the base year cost in Year 1?
2. What was the percentage increase in prices in this case? Show your calculations.
The rate of change in this index is determined by looking at the percentage change from one year to the next. If, for example, the CPI were 150 in one year and 165 the next, then the year-to-year percentage change is 10 percent. You can compute the change using this formula:
Price change = change in CPI
× 100.beginning CPI
3. What is the percentage increase in prices from the base year to Year 2?
Table 2-4.2Constructing a Price Index
Year 1 Year 2 Year 3
Basic market basket item
No. of units
Price per unit
Cost of market basket
Price per unit
Cost of market basket
Price per unit
Cost of market basket
Cheese 2 lbs. $1.75 $3.50 $1.50 $3.00 $1.50 $3.00
Blue jeans 2 pair $12.00 $24.00 $15.50 $20.00 $40.00
Gasoline 10 gals. $1.25 $12.50 $1.60 $16.00 $2.70
Total – – $40.00 – $50.00 –
ACTIVITY 2-4 (CONTINUED)
CEE-APE_MACROSE-12-0101-MASM-Book.indb 66 27/07/12 10:46 PM

Advanced Placement Economics Macroeconomics: Student Resource Manual © Council for Economic Education, New York, N.Y. 67
2 Macroeconomics
Fill in the blanks in Table 2-4.2.
4. If Year 1 is selected as the base year, calculate the price index for each year. Show your work.
(A) Year 1 = _____________
(B) Year 2 = _____________
(C) Year 3 = _____________
5. These price indices indicate that there was a 25 percent increase in prices between Year 1 and Year 2.
(A) What is the percentage increase between Year 1 and Year 3?_____________.
(B) What is the percentage increase between Year 2 and Year 3?_____________.
Converting Nominal GDP to Real GDP
To use GDP to measure output growth, it must be converted from nominal to real. Let’s say nominal GDP in Year 1 is $1,000 and in Year 2 it is $1,100. Does this mean the economy has grown 10 percent between Year 1 and Year 2? Not necessarily. If prices have risen, part of the increase in nominal GDP in Year 2 will represent the increase in prices. GDP that has been adjusted for price changes is called real GDP. If GDP isn’t adjusted for price changes, we call it nominal GDP.
To compute real GDP in a given year, use the following formula:
Real GDP = nominal GDP/(price index/100).
To compute real output growth in GDP from one year to another, subtract real GDP for Year 2 from real GDP in Year 1. Divide the answer (the change in real GDP from the previous year) by real GDP in Year 1. The result, multiplied by 100, is the percentage growth in real GDP from Year 1 to Year 2. (If real GDP declines from Year 1 to Year 2, the answer will be a negative percentage.) Here’s the formula:
Output growth = (real GDP in Year 2 – real GDP in Year 1)
× 100.real GDP in Year 1
For example, if real GDP in Year 1 = $1,000 and in Year 2 = $1,028, then the output growth rate from Year 1 to Year 2 is 2.8%: (1,028 – 1,000) / 1,000 = .028, which we multiply by 100 in order to express the result as a percentage.
To understand the impact of output changes, we usually look at real GDP per capita. To do so, we divide the real GDP of any period by a country’s average population during the same period. This procedure enables us to determine how much of the output growth of a country simply went to supply the increase in population and how much of the growth represented improvements in the standard of living of the entire population. In our example, let’s say the population in Year 1 was 100 and in Year 2 it was 110. What was real GDP per capita in Years 1 and 2?
ACTIVITY 2-4 (CONTINUED)
CEE-APE_MACROSE-12-0101-MASM-Book.indb 67 27/07/12 10:46 PM

68 Advanced Placement Economics Macroeconomics: Student Resource Manual © Council for Economic Education, New York, N.Y.
2 Macroeconomics
Year 1
Real GDP per capita = Year 1 real GDP
= $1,000
= $10.population in Year 1 100
Year 2
Real GDP per capita = $1,028
= $9.30.110
In this example, real GDP per capita fell even though output growth was positive. Developing countries with positive output growth but high rates of population growth often experience this condition.
Use the information in Table 2-4.3 to answer the following questions.
Table 2-4.3Nominal and Real GDP
Nominal GDP Price index PopulationYear 3 $5,000 125 11Year 4 $6,000 150 12
6. What is the real GDP in Year 3? _____________
7. What is the real GDP in Year 4? _____________
8. What is the real GDP per capita in Year 3? _____________
9. What is the real GDP per capita in Year 4? _____________
10. What is the rate of real output growth between Years 3 and 4? _____________
11. What is the rate of real output growth per capita between Years 3 and 4? _____________ (Hint: Use per capita data in the output growth rate formula.)
ACTIVITY 2-4 (CONTINUED)
CEE-APE_MACROSE-12-0101-MASM-Book.indb 68 27/07/12 10:46 PM

Advanced Placement Economics Macroeconomics: Student Resource Manual © Council for Economic Education, New York, N.Y. 69
2 Macroeconomics
The Costs of Inflation
Unanticipated inflation helps some people and hurts others. For example, borrowers are helped by unanticipated inflation while lenders are hurt. However, even anticipated inflation results in costs for the economy. There are three types of costs that result from inflation: shoe leather costs, menu costs, and unit of account costs.
Shoe leather costs: increased transaction costs caused by inflation.
The term shoe leather costs comes from the idea that inflation results in the need for more trips to the bank and store, wearing out peoples’ shoe leather. While technological advances have decreased the amount of walking required to conduct transactions, shoe leather costs still exist in the form of actions that people must take as a result of inflation. Shoe leather costs can be quite substantial in an economy with hyperinflation (very high inflation rates).
Menu costs: the cost of changing a listed price.
Inflation requires firms to incur a cost to change their prices. As a result of inflation, firms must change the tag on the product or shelf, the information attached to a UPC code in a computer, the sticker price on a car, or reprint a restaurant menu (the origin of the term). With hyperinflation, menu costs can cause consumers and merchants to abandon prices listed in their local currency. Menu costs can be substantial in times of high inflation.
Unit of account costs: the cost of having a less reliable unit of measurement.
One of the uses of money is as a unit of account. Prices are used to compare the value of goods and services. Inflation can decrease the usefulness of prices for comparisons because it changes the purchasing power of a currency over time.
1. For each situation, place an X in the box representing the cost of inflation that is best represented.
Situation
Shoe leather costs
Menu costs
Unit of account costs
(A) Your favorite local restaurant raises its prices and has to print new advertisements.
(B) Workers in Germany in 1922 are paid and shop three times a day due to hyperinflation.
(C) You have to change your automatic bill payment in your online banking account because the rent for your apartment went up.
(D) You remember when the price of gasoline was $1.25 per gallon.
(E) You work at your local grocery store and place new higher price stickers on the store’s shelves.
(F) Your weekly grocery bill increases, but the amount of groceries you purchase does not.
ACTIVITY 2-5
CEE-APE_MACROSE-12-0101-MASM-Book.indb 69 27/07/12 10:46 PM

Advanced Placement Economics Macroeconomics: Student Resource Manual © Council for Economic Education, New York, N.Y. 71
2 Macroeconomics
Unemployment
The level of employment is an important measure of economic performance. The unemployment rate measures how well we are achieving the goal of full employment. It is found using a national survey of about 60,000 households. Each month the federal government asks these households about the employment status of household members aged 16 and older (the adult population). The survey puts each person in one of three categories: employed, unemployed, and not in the labor force. People who are at work (the employed) plus those who are not working but are actively looking for work (the unemployed) make up the labor force. People who are not working and are not seeking a job are not in the labor force. The category “not in the labor force” includes individuals who are unable to work or choose not to work.
Measuring Unemployment
Only those people who are willing and able to work are considered part of the labor force. The size of the labor force as a percentage of the total population measures the labor resources available to produce in the economy. The labor force participation rate (LFPR) is defined as the percentage of the population that is considered part of the labor force.
LFPR = labor force
× 100.population
The unemployment rate (UR) is defined as the number of people who are unemployed as a percentage of the labor force.
UR = number of unemployed
× 100.labor force
Student Alert: A person must be actively seeking a job to be considered unemployed. The LFPR is the labor force as a percentage of the population. The UR is the number of people unemployed as a percentage of the labor force. Make sure to use the right denominator!
ACTIVITY 2-6
CEE-APE_MACROSE-12-0101-MASM-Book.indb 71 27/07/12 10:46 PM

72 Advanced Placement Economics Macroeconomics: Student Resource Manual © Council for Economic Education, New York, N.Y.
2 Macroeconomics
1. Fill in the last three columns of Table 2-6.1. All of the population and labor-force data are in millions.
Table 2-6.1Civilian Employment
Year
Civilian non-institutional
population age 16 and over UR LFPR
Civilian labor force
Employed Unemployed Total
1970 117 66 4
1980 137 79 4
1990 168 99 8
2000 188 117 7
2010 209 135 6
Types of Unemployment
The unemployment rate measures unemployment in the economy but it does not provide information about why people are unemployed. To better understand unemployment in the economy, unemployment is classified based on the reason people are willing and able to work but can’t find a job. There are three types of unemployment:
■ Frictional unemployment includes people who are temporarily between jobs. They may have quit one job to find another, or they could be trying to find the best opportunity after graduating from high school or college.
■ Cyclical unemployment includes people who are not working because firms do not need their labor due to a lack of demand or a downturn in the economy. Cyclical unemployment is due to the business cycle.
■ Structural unemployment involves mismatches between job seekers and job openings. Unemployed people who lack skills or do not have sufficient education for available jobs are structurally unemployed.
There will always be some frictional and structural unemployment in the economy because people are always moving and changing jobs and because the structure of the economy is always changing, for example, as technology changes. Cyclical unemployment will exist or not, depending on the phase of the business cycle the economy is experiencing.
ACTIVITY 2-6 (CONTINUED)
CEE-APE_MACROSE-12-0101-MASM-Book.indb 72 27/07/12 10:46 PM

Advanced Placement Economics Macroeconomics: Student Resource Manual © Council for Economic Education, New York, N.Y. 73
2 Macroeconomics
For each of the following situations, put the appropriate letter before the example.
F if it is an example of frictional unemployment.C if it is an example of cyclical unemployment.S if it is an example of structural unemployment.N if it is an example of someone who is not employed.
____ 2. A computer programmer is laid off because of a recession.
____ 3. A literary editor leaves her job in New York to look for a new job in San Francisco.
____ 4. An unemployed college graduate is looking for his first job.
____ 5. Advances in technology make the assembly-line worker’s job obsolete.
____ 6. Slumping sales lead to the cashier being laid off.
____ 7. An individual refuses to work for minimum wage.
____ 8. A high school graduate lacks the skills necessary for a particular job.
____ 9. Workers are laid off when the local manufacturing plant closes because the product made there isn’t selling during a recession.
____10. A skilled glass blower becomes unemployed when a new machine does her job faster.
____11. An individual has been laid off during a recession and has been looking for work unsuccessfully for so long that he has finally given up actively seeking a job. (Note: This person is known as a discouraged worker.)
____12. A college graduate works at a job that does not require a college education.
ACTIVITY 2-6 (CONTINUED)
CEE-APE_MACROSE-12-0101-MASM-Book.indb 73 27/07/12 10:46 PM