understanding the 2020 census disclosure avoidance system
TRANSCRIPT

2020CENSUS.GOV
Understanding the 2020 Census Disclosure Avoidance System:
Michael HawesSenior Advisor for Data Access and PrivacyAugust 10, 2021
Analysis of Production Settings for Redistricting and Voting Rights Act Use Cases

2020CENSUS.GOV
Acknowledgements
This presentation includes work by the Census Bureau’s 2020 Disclosure Avoidance System development team, Census Bureau colleagues, and our collaborators, from the following Census Bureau divisions and outside organizations: ADCOM, ADDC, ADRM, CED, CEDDA, CEDSCI, CES, CSRM, DCMD, DITD, ESMD, GEO, POP, TAB, CDF, Econometrica Inc., Galois, Knexus Research Corp, MITRE, NLT, TI, and Tumult Labs.
We also acknowledge and greatly appreciate the ongoing feedback we have received from external stakeholder groups that has contributed to the design and improvement of the Disclosure Avoidance System. For more information and technical details relating to the issues discussed in these slides, please contact the author at [email protected] opinions and viewpoints expressed in this presentation are the author’s own, and do not represent the opinions or viewpoints of the U.S. Census Bureau.
2020CENSUS.GOV
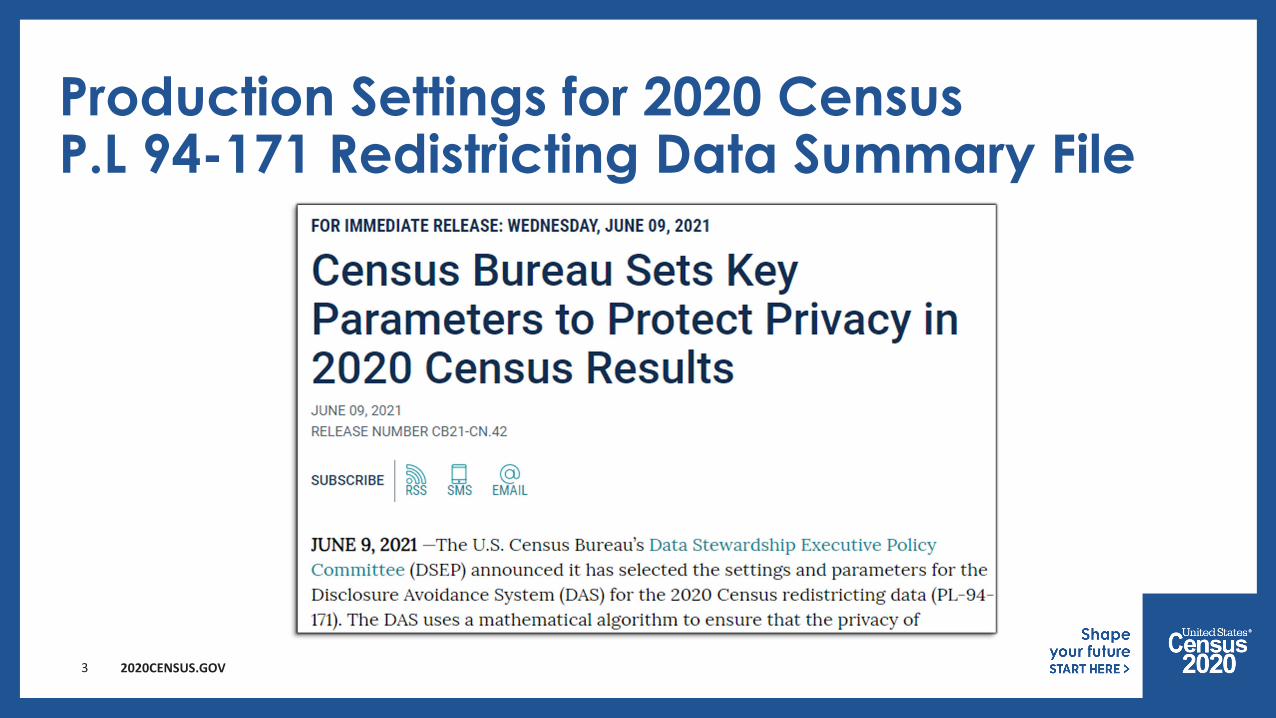
Production Settings for 2020 Census P.L 94-171 Redistricting Data Summary File
3

2020CENSUS.GOV
Stakeholder Feedback We received a substantial amount of invaluable feedback on the April 2021 Demonstration Data.
Major themes included:• Accuracy for American Indian and Alaska Native tribal areas and other “off-spine”
geographies• Accuracy for places, Minor Civil Divisions, and tract-level data• Bias (geographic and characteristic)• Race and Ethnicity statistics• Occupancy rates
4

2020CENSUS.GOV
Key Parameters and Improvements• Privacy-loss Budget (PLB):
ε= 17.14 for personsε= 2.47 for units
• Improvements to the optimized geographic post-processing hierarchy• Extra PLB allocated to Population counts• Extra PLB allocated to Race and Ethnicity statistics• Extra PLB allocated to occupancy rates at the block-group level and above
5

2020CENSUS.GOV
Privacy-loss Budget Allocations
https://www2.census.gov/programs-surveys/decennial/2020/program-management/data-product-planning/2010-demonstration-data-products/ProductionSettings20210608/2021-06-08-
privacy-loss_budgetallocation.pdf
6

2020CENSUS.GOV
Privacy-loss Budget Allocationsby geographic level
7
Global rho 1.05Global epsilon 10.3delta 10-10
rho Allocation by Geographic Level
US 51/1024State 153/1024County 78/1024Tract 51/1024Optimized Block Group* 172/1024Block 519/1024
April 2021 Demonstration Data:Global rho 2.56Global epsilon 17.14delta 10-10
rho Allocation by Geographic Level
US 104/4099State 1440/4099County 447/4099Tract 687/4099Optimized Block Group* 1256/4099Block 165/4099
Production Settings:

2020CENSUS.GOV
Privacy-loss Budget Allocationsby query
8
April 2021 Demonstration Data: Production Settings:
Query
Per Query rho Allocation by Geographic Level
US State County TractOptimized
Block Group* Block
TOTAL (1 cell) 678/1024** 342/1024 1/1024 572/1024 1/1024
CENRACE (63 cells) 2/1024 1/1024 1/1024 2/1024 1/1024 2/1024
HISPANIC (2 cells) 1/1024 1/1024 1/1024 1/1024 1/1024 1/1024
VOTINGAGE (2 cells) 1/1024 1/1024 1/1024 1/1024 1/1024 1/1024
HHINSTLEVELS (3 cells) 1/1024 1/1024 1/1024 1/1024 1/1024 1/1024
HHGQ (8 cells) 1/1024 1/1024 1/1024 1/1024 1/1024 1/1024
HISPANIC*CENRACE (126 cells) 5/1024 2/1024 3/1024 5/1024 3/1024 5/1024
VOTINGAGE*CENRACE (126 cells) 5/1024 2/1024 3/1024 5/1024 3/1024 5/1024
VOTINGAGE*HISPANIC (4 cells) 1/1024 1/1024 1/1024 1/1024 1/1024 1/1024
VOTINGAGE*HISPANIC*CENRACE (252 cells) 17/1024 6/1024 11/1024 17/1024 8/1024 17/1024
HHGQ*VOTINGAGE*HISPANIC*CENRACE (2,016 cells) 990/1024 330/1024 659/1024 989/1024 432/1024 989/1024
Query
Per Query rho Allocation by Geographic Level
US State County TractOptimized
Block Group* BlockTOTAL (1 cell) 3773/4097** 3126/4097 1567/4102 1705/4099 5/4097CENRACE (63 cells) 52/4097 6/4097 10/4097 4/2051 3/4099 9/4097HISPANIC (2 cells) 26/4097 6/4097 10/4097 5/4102 3/4099 5/4097VOTINGAGE (2 cells) 26/4097 6/4097 10/4097 5/4102 3/4099 5/4097HHINSTLEVELS (3 cells) 26/4097 6/4097 10/4097 5/4102 3/4099 5/4097HHGQ (8 cells) 26/4097 6/4097 10/4097 5/4102 3/4099 5/4097HISPANIC*CENRACE (126 cells) 130/4097 12/4097 28/4097 1933/4102 1055/4099 21/4097VOTINGAGE*CENRACE (126 cells) 130/4097 12/4097 28/4097 10/2051 9/4099 21/4097VOTINGAGE*HISPANIC (4 cells) 26/4097 6/4097 10/4097 5/4102 3/4099 5/4097
VOTINGAGE*HISPANIC*CENRACE (252 cells) 26/241 2/241 101/4097 67/4102 24/4099 71/4097
HHGQ*VOTINGAGE*HISPANIC*CENRACE (2,016 cells) 189/241 230/4097 754/4097 241/2051 1288/4099 3945/4097
*The Optimized Block Groups used within the TopDown Algorithm differ from tabulation block groups. These differences improve accuracy for "off-spine" geographies like places and minor civil divisions. The use of optimized block groups for measurement and post-processing within the TopDown Algorithm does not impact how the resulting data will be tabulated. All Census data products will be tabulated using the official tabulation block groups as defined by the Census Bureau's Geography Division.
**The TOTAL query (total population) is held invariant at the state level. This rho allocation assigned to TOTAL at the state level is the amount assigned to the state-level queries for the total population of all American Indian and Alaska Native (AIAN) tribal areas within the state and for the total population of the remainder of the state, for the 36 states that include AIAN tribal areas.
2020CENSUS.GOV
Public Release of the 2020 Census P.L. 94-171 Redistricting Data Summary FilesThe Census Bureau will release these data on its public FTP site on August 12, 2021. The Census Bureau will release the same data in easier-to-use formats by September 30, 2021.
For more information, visit the Census Bureau’s website at www.census.gov.

2020CENSUS.GOV
Production Settings 2010 Demonstration Data ReleaseIn parallel with the release of the 2020 Census P.L. 94-171 Redistricting Data Summary Files, the Census Bureau will also be releasing the final set of 2010 Census Demonstration Data reflecting the final production settings used by the 2020 Census Disclosure Avoidance System to protect the 2020 Census redistricting data.
These are the same data used to produce the Production Settings Detailed Summary Metrics released on July 1, 2021.https://www.census.gov/programs-surveys/decennial-census/decade/2020/planning-management/process/disclosure-avoidance/2020-das-development.html

2020CENSUS.GOV
Analyses of 2010 Census Demonstration Data for Redistricting and Voting Rights Act Use Cases• Empirical Study of Two Aspects of the Topdown Algorithm Output for Redistricting:
Reliability & VariabilityUpdated version of Wright and Irimata (2021) study.
• Analysis of the impact of DAS production settings on the identification of majority-minority districts

2020CENSUS.GOV
Comparisons to Published 2010 Census DataBoth sets of analyses discussed today involve comparisons of the 2010 Census Demonstration Data (protected with the differentially private 2020 Census Disclosure Avoidance System) to published 2010 Census tabulations.
The 2010 Census used a form of noise infusion known as data swapping, wherein households’ records were swapped across geographies to protect the confidentiality of individuals’ census responses.
For the 2010 Census, the number of individuals and the number of voting-age individuals in each household were held invariant (no noise was added), but individuals’ characteristics (e.g., race and Hispanic origin) were swapped across geographies.
Differences between the Demonstration Data and the published 2010 Census tabulations presented in the following analyses reflect both the noise from the 2020 Census Disclosure Avoidance System and impact of the 2010 Census swapping methodology on characteristics data.

2020CENSUS.GOV
Average Error in Total Population Counts by Geographic Level
Geographic LevelMean Absolute
Error (MAE) (# of persons)
Counties 1.75Minor Civil Divisions (MCD) 2.74Incorporated Places 3.55Tracts 1.93Blocks (Urban blocks) 4.22Blocks (Rural blocks) 1.61
Source: Production Settings Detailed Summary Metrics CBDRB-FY20-DSEP-001

2020CENSUS.GOV
Wright and Irimata (2021)
Available at: https://www.census.gov/library/working-papers/2021/adrm/SSS2021-02.html

2020CENSUS.GOV
Wright and Irimata (2021)
Research Questions:
(1) What is the minimum TOTAL population of a district to have reliable characteristics of various demographic groups for redistricting purposes?
Because districts cannot be defined ex ante, this portion of their analysis uses two existing geographic levels as proxies for districts:• Block Groups (“on spine”)• Places and Minor Civil Divisions (“off spine”)
(2) How variable are data protected using the 2020 Disclosure Avoidance System for districts in Rhode Island and for three additional jurisdictions?

2020CENSUS.GOV
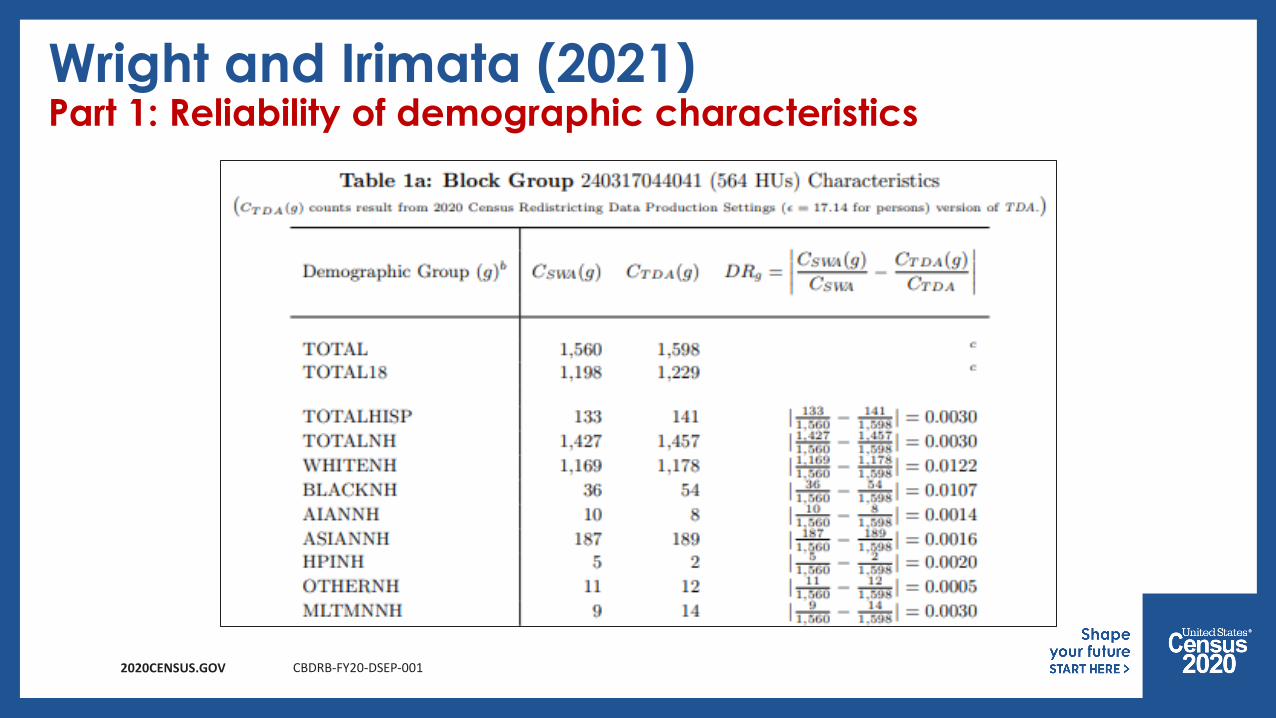
Wright and Irimata (2021)Part 1: Reliability of demographic characteristics
2020CENSUS.GOV CBDRB-FY20-DSEP-001
Wright and Irimata (2021)Part 1: Reliability of demographic characteristics

2020CENSUS.GOV CBDRB-FY20-DSEP-001
Wright and Irimata (2021)Part 1: Reliability of demographic characteristics
1,598 − 1,5601,560 = 0.024
1,229 − 1,1981,198 = 0.026

2020CENSUS.GOV BDRB-FY20-DSEP-001
2020CENSUS.GOV CBDRB-FY20-DSEP-001
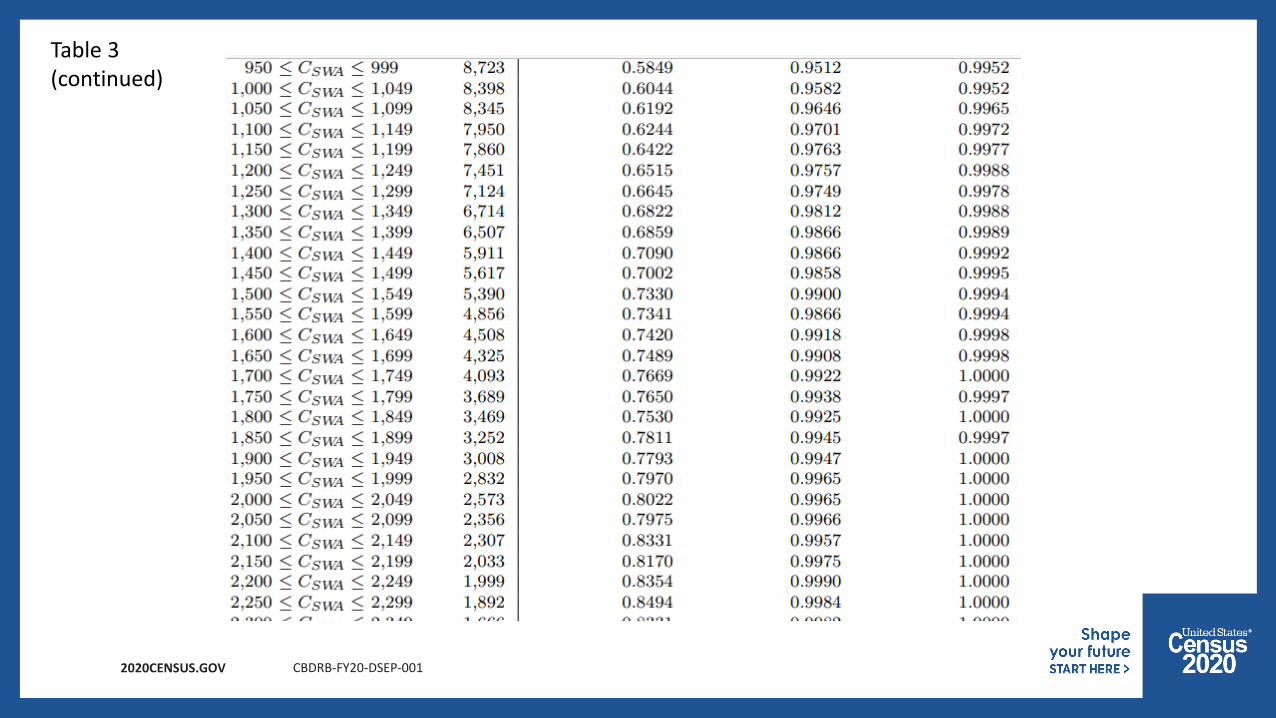
Table 3 (continued)

2020CENSUS.GOV CBDRB-FY20-DSEP-001

2020CENSUS.GOV CBDRB-FY20-DSEP-001

2020CENSUS.GOV CBDRB-FY20-DSEP-001
Table 4 (continued)
2020CENSUS.GOV CBDRB-FY20-DSEP-001

2020CENSUS.GOV CBDRB-FY20-DSEP-001

2020CENSUS.GOV
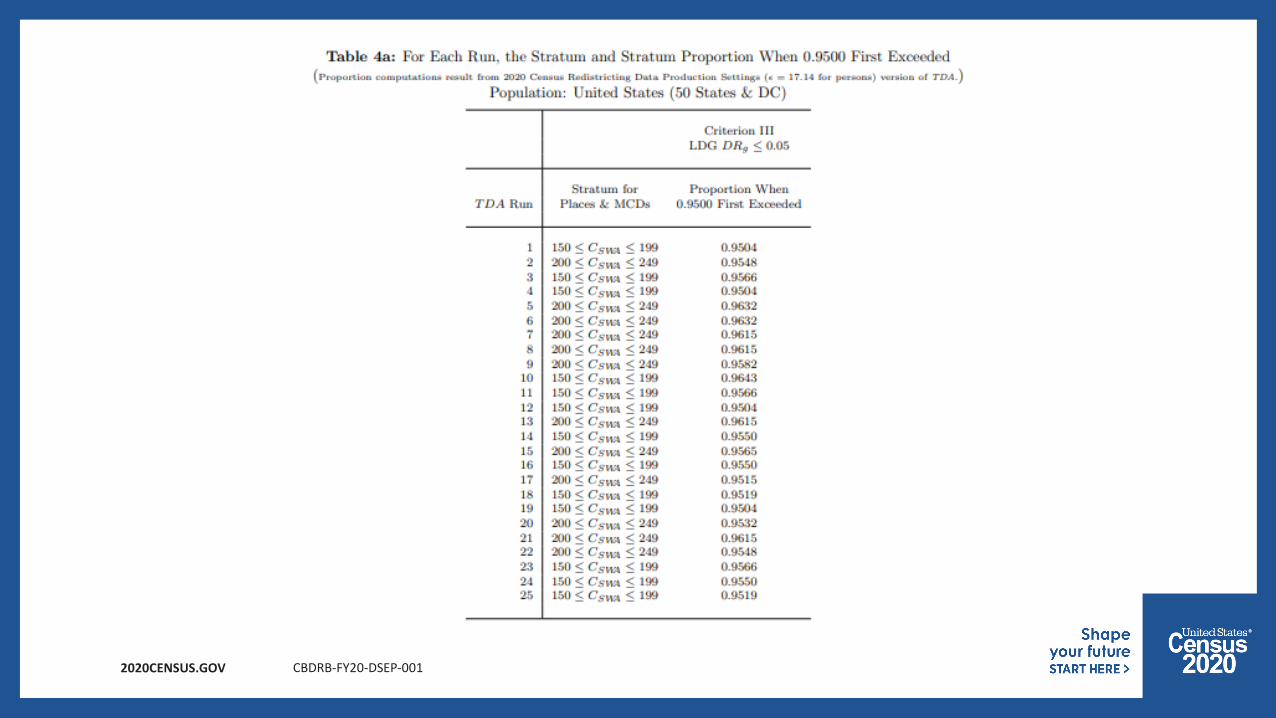
Wright and Irimata (2021)Part 2: Variability across DAS runs
Part 2 of their analysis examines 25 independent runs of 2010 Census data through the 2020 Census DAS using the same production settings to assess variability across runs.
The resulting data were then assessed for their variability against a range of redistricting use cases:• Rhode Island’s Congressional Districts (2)• Rhode Island’s State Upper Legislative Districts (38)• Rhode Island’s State Lower Legislative Districts (75)• DOJ-supplied jurisdictions
• Panola County, Mississippi (2,180 blocks)• Tate County (School District), Mississippi (784 blocks)• Tylertown (Walthall County), Mississippi (136 blocks)

2020CENSUS.GOV CBDRB-FY20-DSEP-001
Wright and Irimata (2021)Part 2: Variability across DAS runs

2020CENSUS.GOV CBDRB-FY20-DSEP-001
Wright and Irimata (2021)Part 2: Variability across DAS runs

2020CENSUS.GOV
Wright and Irimata (2021)Conclusions
The Key Empirical Message on Reliability:“for any block group with a TOTAL count between 450 and 499 people or larger, and for MCDs and places between 200 and 249 or larger, the difference between the TDA ratio of the largest demographic group (LDG) and the corresponding SWA ratio for the LDG is less than or equal to 5 percentage points at least 95% of the time”. No Congressional or state legislative district fails this test; that is, for these districts, the 5-percentage point criterion holds 100% of the time.”
The Key Empirical Message on Variability: “relative variability in the TDA [decreases] as we consider [larger] pieces of geography and population…At a high level, [the analysis] tends to show less relative variability using the 2020 Census redistricting data production settings version of the TDA than the 2021-04-28 version

2020CENSUS.GOV
Analysis of the impact of DAS production settings on the identification of majority-minority districts

2020CENSUS.GOV
Districts Examined:
Congressional Districts 436State Upper Legislative Districts (SLDU) 1,946State Lower Legislative Districts (SLDL) 4,785

2020CENSUS.GOV
Demographics Examined:P1/P8 Tables (Total Population by Race):• White Alone
• Black Alone
• AIAN Alone
• Asian Alone
• SOR Alone
• Black and Black+White
P2/P9 Tables (Total Hispanic/NH by Race):• Hispanic
• NH White Alone
• NH Black Alone
• NH AIAN Alone
• NH Asian Alone
• NH SOR Alone
• NH Black and Black+White
P3/P10 Tables (VAP by Race):• White Alone VAP
• Black Alone VAP
• AIAN Alone VAP
• Asian Alone VAP
• SOR Alone VAP
• Black and Black+White VAP
P4/P11 Tables (Hispanic/NH VAP by Race):• Hispanic VAP
• NH White Alone VAP
• NH Black Alone VAP
• NH AIAN Alone VAP
• NH Asian Alone VAP
• NH SOR Alone VAP
• NH Black and Black+White VAP
NH = Not Hispanic VAP = Voting Age Population

2020CENSUS.GOV
P1/P8 Tables (Total Population by Race)White Alone
Black Alone
State District DistrictType
SF1 Total DAS Total
SF1 White
DAS White
SF1 %White
DAS %White
27 062 Upper 79,225 79,289 39,665 39,639 50.01% 49.99%
6 46 Cong. 702,906 702,803 351,403 351,441 49.99% 50.01%
State District DistrictType
SF1 Total DAS Total
SF1 Black
DAS Black
SF1 %Black
DAS %Black
1 085 Lower 45,229 45,206 22,651 22,581 50.08% 49.95%
CBDRB-FY20-DSEP-001

2020CENSUS.GOV
P2/P9 Tables (Total Hispanic)Total Hispanic:
State District DistrictType
SF1 Total
DAS Total
SF1 Hispanic
DAS Hispanic
SF1 %Hispanic
DAS %Hispanic
32 014 Lower 64,054 63,906 31,975 31,964 49.92% 50.02%
CBDRB-FY20-DSEP-001

2020CENSUS.GOV
P2/P9 Tables (Total NH by Race)NH White Alone:
NH Black Alone:
NH AIAN Alone:
State District DistrictType
SF1 Total
DAS Total
SF1 NH White
DAS NH White
SF1 %NH White
DAS %NH White
51 050 Lower 80,677 80,712 40,353 40,353 50.02% 50.00%*
32 009 Upper 128,882 128,641 64,380 64,343 49.95% 50.02%
State District DistrictType
SF1 Total
DAS Total
SF1 NH Black
DAS NH Black
SF1 %NH Black
DAS %NH Black
37 043 Lower 79,233 79,025 39,545 39,551 49.91% 50.05%
State District DistrictType
SF1 Total
DAS Total
SF1 NH AIAN
DAS NH AIAN
SF1 %NH AIAN
DAS %NH AIAN
30 015 Lower 9,595 9,610 4,807 4,744 50.10% 49.37%
CBDRB-FY20-DSEP-001
2020CENSUS.GOV
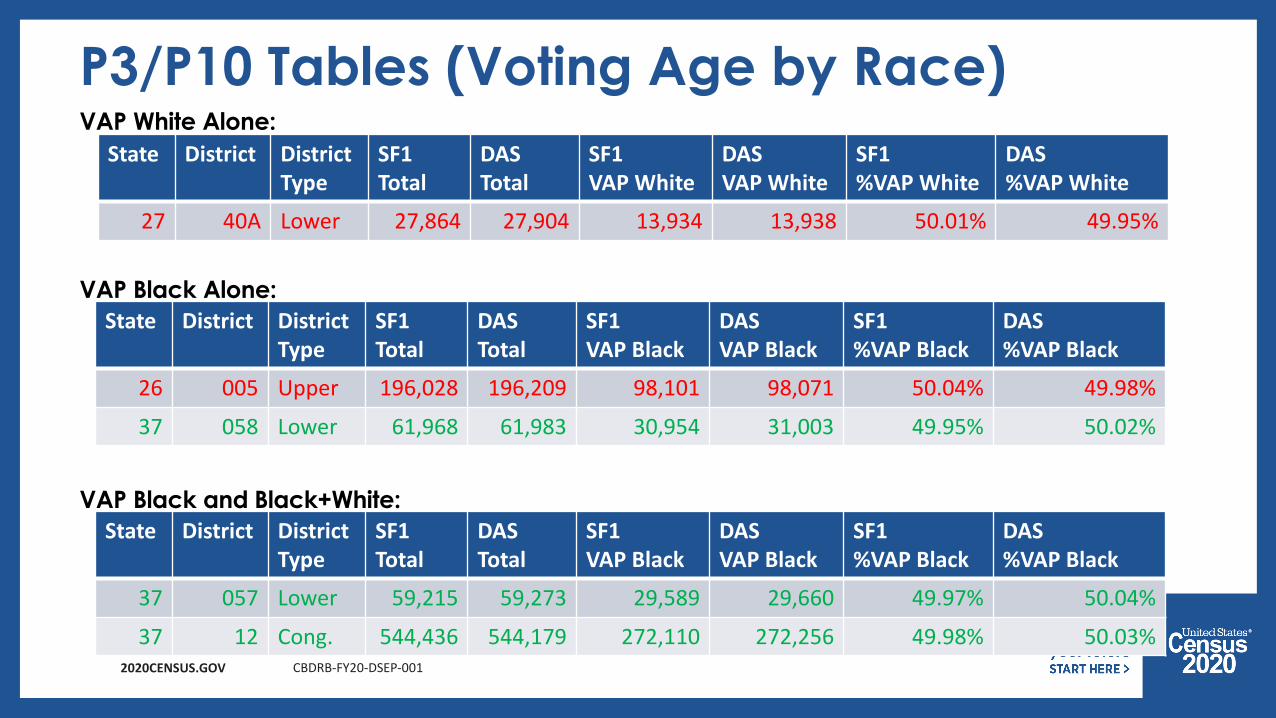
P3/P10 Tables (Voting Age by Race)VAP White Alone:
VAP Black Alone:
VAP Black and Black+White:
State District DistrictType
SF1 Total
DAS Total
SF1 VAP White
DAS VAP White
SF1 %VAP White
DAS %VAP White
27 40A Lower 27,864 27,904 13,934 13,938 50.01% 49.95%
State District DistrictType
SF1 Total
DAS Total
SF1 VAP Black
DAS VAP Black
SF1 %VAP Black
DAS %VAP Black
26 005 Upper 196,028 196,209 98,101 98,071 50.04% 49.98%
37 058 Lower 61,968 61,983 30,954 31,003 49.95% 50.02%
State District DistrictType
SF1 Total
DAS Total
SF1 VAP Black
DAS VAP Black
SF1 %VAP Black
DAS %VAP Black
37 057 Lower 59,215 59,273 29,589 29,660 49.97% 50.04%
37 12 Cong. 544,436 544,179 272,110 272,256 49.98% 50.03%CBDRB-FY20-DSEP-001

2020CENSUS.GOV
P4/P11 Tables (Hispanic VAP)Hispanic VAP:
State District DistrictType
SF1 Total
DAS Total
SF1 VAP Hisp.
DAS VAP Hisp.
SF1 %VAP Hisp.
DAS %VAP Hisp.
12 014 Upper 342,997 342,819 171,560 171,389 50.02% 49.99%
12 087 Lower 115,237 115,148 57,642 57,538 50.02% 49.97%
CBDRB-FY20-DSEP-001

2020CENSUS.GOV
P4/P11 Tables (Not Hispanic VAP by Race)VAP NH White:
VAP NH Black Alone:
State District DistrictType
SF1 Total
DAS Total
SF1 VAP NH White
DAS VAP NH White
SF1 %VAP NH White
DAS %VAP NH White
27 062 Upper 60,648 60,720 30,384 30,359 50.10% 50.00%*
State District DistrictType
SF1 Total
DAS Total
SF1 VAP NH Black
DAS VAP NH Black
SF1 %VAP NH Black
DAS %VAP NH Black
13 177 Lower 41,506 41,461 20,719 20,731 49.92% 50.00%
18 094 Lower 45,634 45,508 22,786 22,837 49.93% 50.18%
26 001 Upper 197,305 196,969 98,476 98,500 49.91% 50.01%
42 181 Lower 45,240 45,073 22,614 22,644 49.99% 50.24%
CBDRB-FY20-DSEP-001

2020CENSUS.GOV
P4/P11 Tables (Not Hispanic VAP by Race)VAP NH Black and Black+White:
State District DistrictType
SF1 Total
DAS Total
SF1 VAP NH Black
DAS VAP NH Black
SF1 %VAP NH Black
DAS %VAP NH Black
9 015 Lower 18,820 18,863 9,422 9,423 50.06% 49.95%
45 023 Lower 28,442 28,433 14,230 14,202 50.03% 49.95%
24 37A Lower 30,391 30,391 15,118 15,199 49.74% 50.01%
36 05 Cong. 545,319 545,308 272,480 272,949 49.97% 50.05%
37 043 Lower 59,130 59,881 29,480 29,446 49.86% 50.01%
CBDRB-FY20-DSEP-001

2020CENSUS.GOV
Conclusions
Comparison of the Production Settings Demonstration Data to the published 2010 Census tabulations identified 25 districts out of 7,167 (0.3%) where a demographic group could be considered to flip from majority to minority or vice-versa.Flips occurred in both directions (11 groups went from majority to minority, 14 went from minority to majority).No flips involved both a racial or ethnic group’s total population and voting age population. (That is, districts drawn to have majorities of both total population and voting age population are more stable.)All flips involved very small numbers of individuals in districts that were tightly drawn (usually within a few hundredths of a percent of the 50% mark) using the published 2010 Census tabulations (a level of precision that would be greatly impacted by the noise injected by the 2010 Census swapping algorithms).
CBDRB-FY20-DSEP-001

2020CENSUS.GOV41
Stay Informed: Subscribe to the 2020 Census Data Products Newsletters
*Search “Disclosure Avoidance” at www.census.gov

2020CENSUS.GOV42
Stay Informed: Visit Our Website
*Search “Disclosure Avoidance” at www.census.gov

2020CENSUS.GOV43
** New Video **
Protecting Privacy in Census Bureau Statistics
*Find it on our website and YouTube Page
Search “Disclosure Avoidance” at www.census.gov

2020CENSUS.GOV
Questions?
44