understanding pfas fate and transport · and transport dave woodward, aecom erika houtz, phd,...
TRANSCRIPT

11/30/2016
1
Understanding PFAS Fate
and Transport
Dave Woodward, AECOM
Erika Houtz, PhD, Arcadis
Jeffrey Burdick, Arcadis
November 30, 2016
22
• Background and Characteristics
• Regulatory Updates
• Atmospheric and Subsurface Fate & Transport
• PFAS F&T Case Studies:
• PFAS manufacturing facility
• Site model for multiple AFFF releases
• Land application of industrial sludge
• Fate of AFFF in a WWTP
• Conclusions
Agenda
11/30/2016
2
33
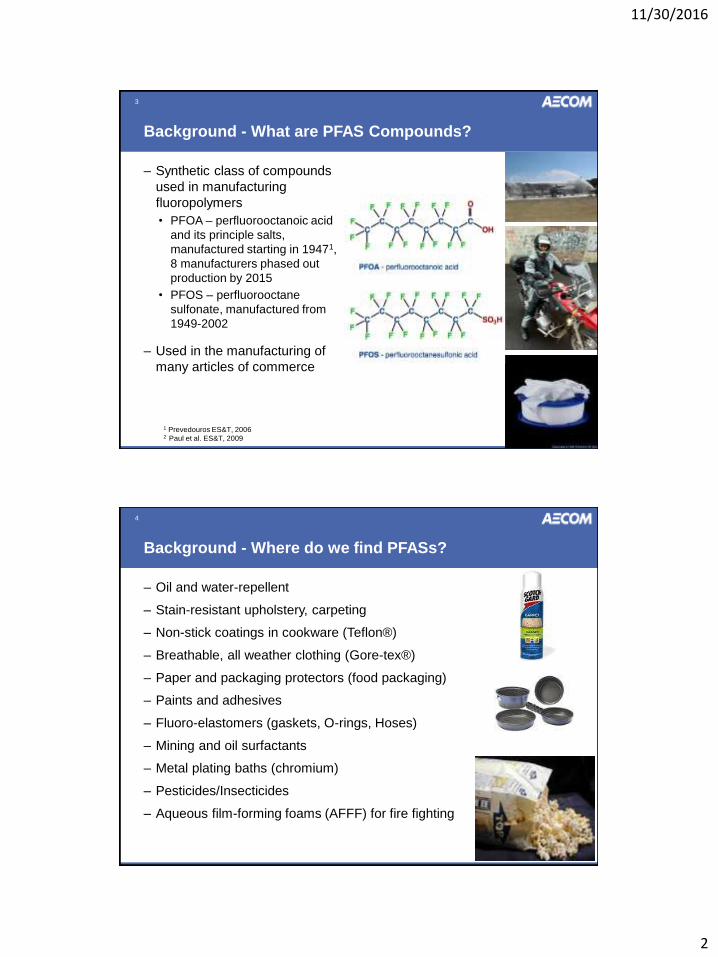
– Synthetic class of compounds
used in manufacturing
fluoropolymers
• PFOA – perfluorooctanoic acid
and its principle salts,
manufactured starting in 19471,
8 manufacturers phased out
production by 2015
• PFOS – perfluorooctane
sulfonate, manufactured from
1949-2002
– Used in the manufacturing of
many articles of commerce
Background - What are PFAS Compounds?
1 Prevedouros ES&T, 20062 Paul et al. ES&T, 2009
44
– Oil and water-repellent
– Stain-resistant upholstery, carpeting
– Non-stick coatings in cookware (Teflon®)
– Breathable, all weather clothing (Gore-tex®)
– Paper and packaging protectors (food packaging)
– Paints and adhesives
– Fluoro-elastomers (gaskets, O-rings, Hoses)
– Mining and oil surfactants
– Metal plating baths (chromium)
– Pesticides/Insecticides
– Aqueous film-forming foams (AFFF) for fire fighting
Background - Where do we find PFASs?

11/30/2016
3
55
– Developed by the Navy in 1960s
– PFASs are used in AFFFs that were routinely used for fire fighter
training at municipal and military fire training areas
– Used for Class B fires (highly flammable or combustible liquid fires,
including jet fuels, gas tankers & refineries)
– AFFFs have the ability to spread over the surface of hydrocarbon-
based liquids (i.e., create a film)
– AFFF blankets fuel, cools the fuel surface, prevents re-ignition by
suppressing release of flammable vapors
Aqueous Film Forming Foams (AFFF)
Hydrocarbon Phase
Air
Soil
Aqueous Phase
FluorinatedSurfactant
Hydrocarbon
Surfactant
66
– C-F bond is one of the shortest and strongest bonds
– Few degradation processes: too much energy to break bonds
• stable in acids, bases, oxidants, heat
• microorganisms cannot gain energy from breaking the bond
Characteristics - Unique Chemistry
• Perfluorinated = all carbon atoms fully
fluorinated (no hydrogen atoms)
• Polyfluorinated = some carbons are not
fully fluorinated (have H)
PFOA (perfluorooctanoate)
Air
Water
(Poly)fluorotelomer sulfonate (FtS)
11/30/2016
4
77
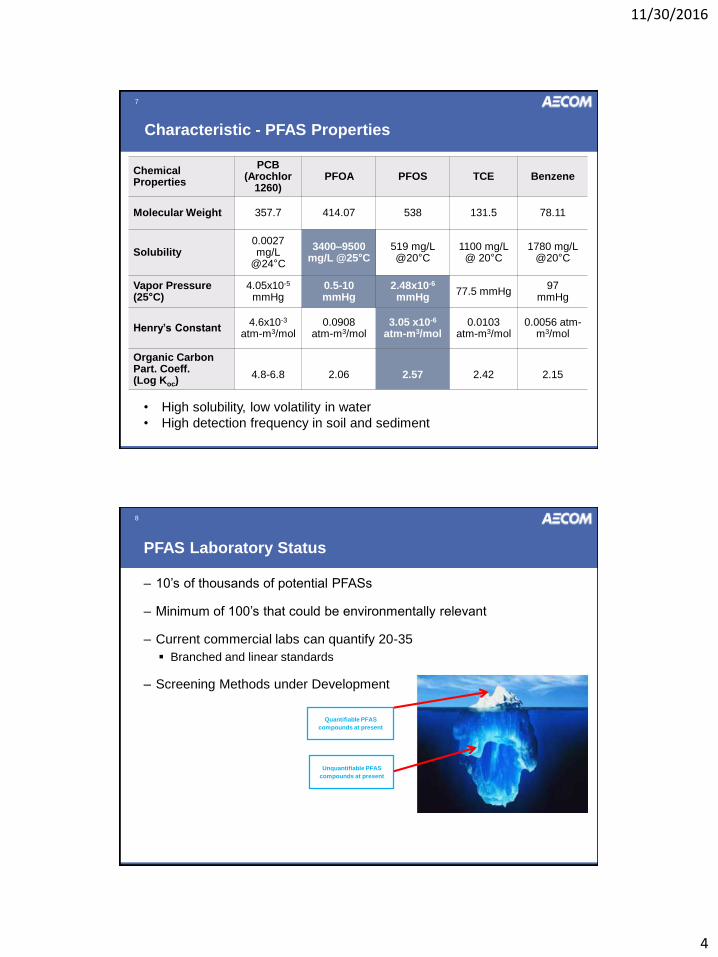
Characteristic - PFAS Properties
Chemical Properties
PCB (Arochlor
1260)PFOA PFOS TCE Benzene
Molecular Weight 357.7 414.07 538 131.5 78.11
Solubility0.0027 mg/L
@24°C
3400–9500 mg/L @25°C
519 mg/L @20°C
1100 mg/L @ 20°C
1780 mg/L@20°C
Vapor Pressure (25°C)
4.05x10⁻⁵
mmHg0.5-10 mmHg
2.48x10⁻⁶
mmHg77.5 mmHg
97mmHg
Henry’s Constant4.6x10-3
atm-m3/mol0.0908
atm-m3/mol3.05 x10-6
atm-m3/mol0.0103
atm-m3/mol0.0056 atm-
m3/mol
Organic Carbon Part. Coeff.(Log Koc)
4.8-6.8 2.06 2.57 2.42 2.15
• High solubility, low volatility in water
• High detection frequency in soil and sediment
88
– 10’s of thousands of potential PFASs
– Minimum of 100’s that could be environmentally relevant
– Current commercial labs can quantify 20-35
Branched and linear standards
– Screening Methods under Development
PFAS Laboratory Status
Quantifiable PFAS
compounds at present
Unquantifiable PFAS
compounds at present
11/30/2016
5
99
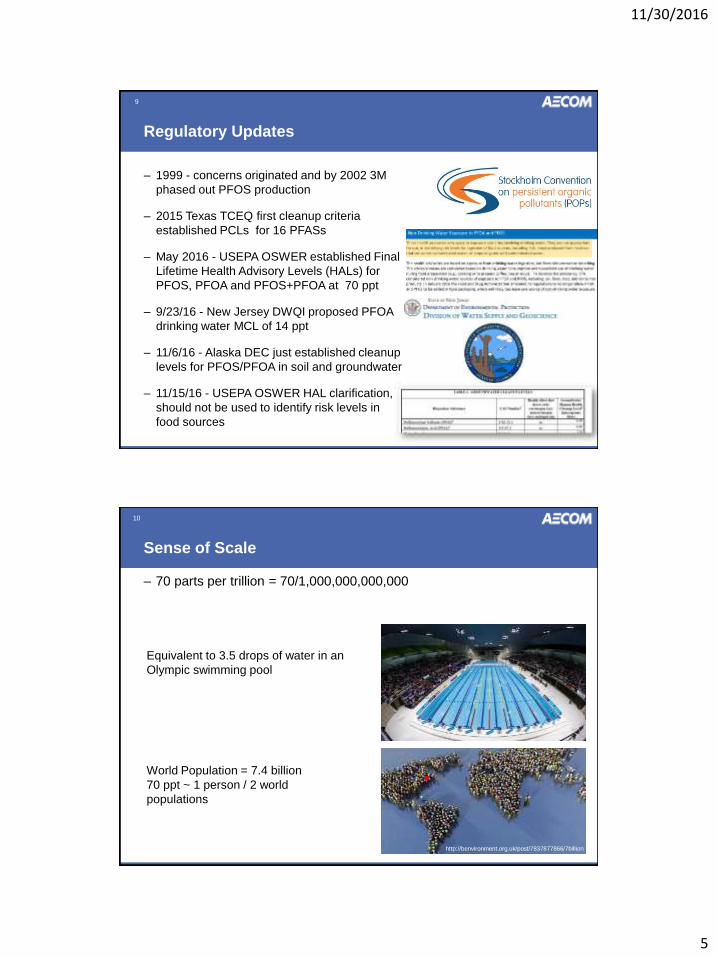
– 1999 - concerns originated and by 2002 3M
phased out PFOS production
– 2015 Texas TCEQ first cleanup criteria
established PCLs for 16 PFASs
– May 2016 - USEPA OSWER established Final
Lifetime Health Advisory Levels (HALs) for
PFOS, PFOA and PFOS+PFOA at 70 ppt
– 9/23/16 - New Jersey DWQI proposed PFOA
drinking water MCL of 14 ppt
– 11/6/16 - Alaska DEC just established cleanup
levels for PFOS/PFOA in soil and groundwater
– 11/15/16 - USEPA OSWER HAL clarification,
should not be used to identify risk levels in
food sources
Regulatory Updates
1010
– 70 parts per trillion = 70/1,000,000,000,000
Sense of Scale
http://benvironment.org.uk/post/7837877866/7billion
Equivalent to 3.5 drops of water in an
Olympic swimming pool
World Population = 7.4 billion
70 ppt ~ 1 person / 2 world
populations
11/30/2016
6
1111
PFAS Atmospheric Fate & Transport
Vapor Phase Transport -Mainly neutral precursors
Longer transport potential~20 days atmospheric lifetime (8:2 FtOH)
Atmospheric transformation of precursors to other PFAS by reaction with:NOx, OH•, O3, O2
Particle phase/ Aerosol transport –PFAAs and Precursors
Wet Deposition of Vapor-
Phase PFASDry Deposition of Particle –Associated
PFAS
Wet Deposition of Particle –Associated
PFAS
Shorter transport potential~3-5 days atmospheric lifetime (PM2.5)
PFOA associated with small particles (<0.14 mm)PFOS associated with larger particles (1.38 to 3.81 mm)A. Dreyer et al. Chemosphere 2015
1212
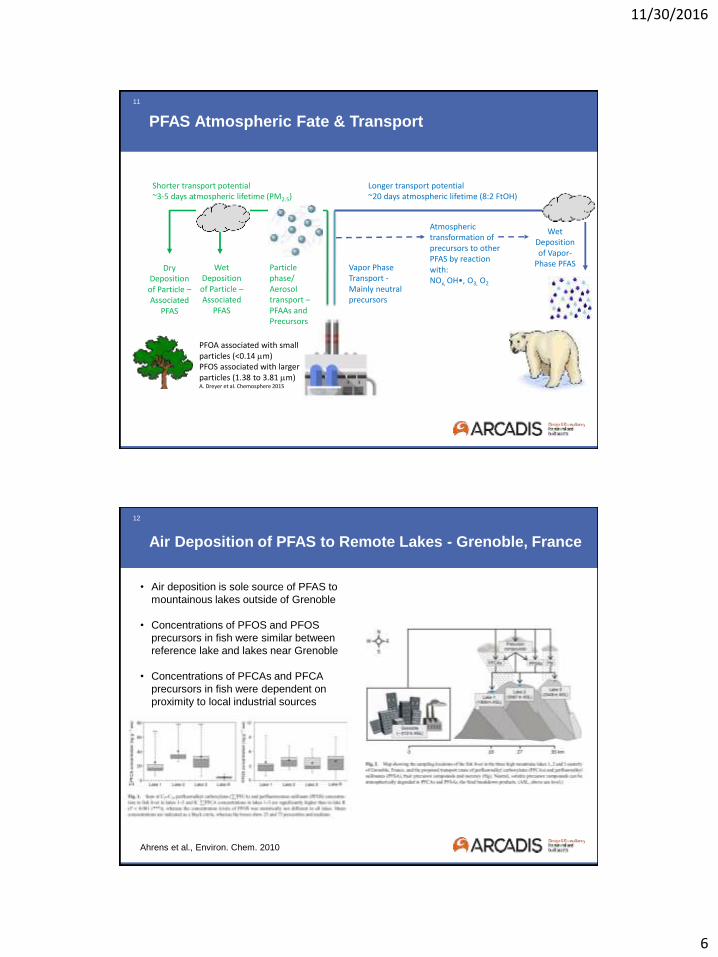
Ahrens et al., Environ. Chem. 2010
• Air deposition is sole source of PFAS to
mountainous lakes outside of Grenoble
• Concentrations of PFOS and PFOS
precursors in fish were similar between
reference lake and lakes near Grenoble
• Concentrations of PFCAs and PFCA
precursors in fish were dependent on
proximity to local industrial sources
Air Deposition of PFAS to Remote Lakes - Grenoble, France

11/30/2016
7
1313
PFAS Groundwater Fate & Transport: Chemical Properties
and Implications
Persistence and mobility can lead to large plumes
PFAA plumes are generally longer
• High solubility
• Low log KOC
• Recalcitrant
• Mostly anionic
• PFAA sorption increases with perfluorinated
chain length, e.g. PFOS (C8) is more sorptive
than PFBS (C4)
Chemical
Properties
PCB
(Arochlor
1260)
PFOA PFOS TCE Benzene
Molecular
Weight358 414 500 132 78
Solubility
(@20-25°C),
mg/L
0.00273400 –
9500 519 1100 1780
Vapor
Pressure
(@25°C),
mmHg
4.1x10⁻⁵ 0.5-10 2.5x10⁻⁶ 78 97
Log Koc 5 – 7 2.06 2.57 2.47 2.13
1414
Polyfluorinated Compounds – PFAA Precursors
• Thousands of polyfluorinated precursors to PFAAs
have been commercially synthesized
• The common feature of the precursors is that they
will biotransform to make PFAAs as persistent
“dead end” daughter products
• Neither PFAAs nor their PFAAs biodegrade, i.e.
mineralize
• Some precursors are fluorotelomers
• Some are cationic (positively charged) or
zwitterionic (mixed charges) –this influences their
fate and transport in the environment
• Cationic / zwitterionic PFAS tend to be less mobile
than anionic PFAAs and so can potentially be
retained longer in “source zones”
• Environmental fate and transport of precursors is
complex and structure dependent
PFOA
11/30/2016
8
1515
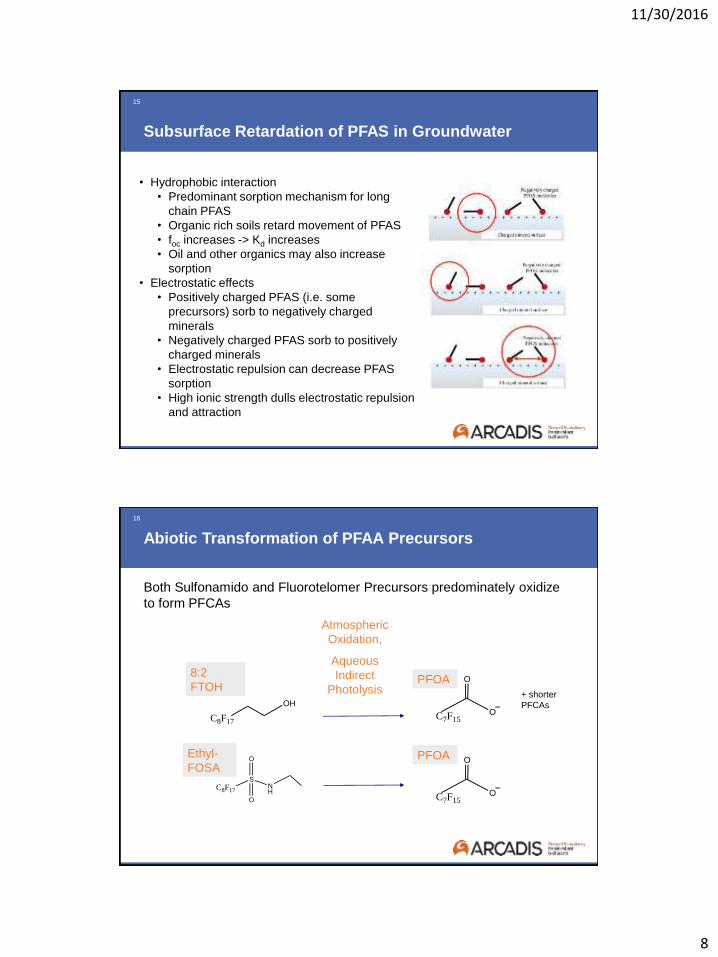
Subsurface Retardation of PFAS in Groundwater
• Hydrophobic interaction
• Predominant sorption mechanism for long
chain PFAS
• Organic rich soils retard movement of PFAS
• foc increases -> Kd increases
• Oil and other organics may also increase
sorption
• Electrostatic effects
• Positively charged PFAS (i.e. some
precursors) sorb to negatively charged
minerals
• Negatively charged PFAS sorb to positively
charged minerals
• Electrostatic repulsion can decrease PFAS
sorption
• High ionic strength dulls electrostatic repulsion
and attraction
1616
Both Sulfonamido and Fluorotelomer Precursors predominately oxidize
to form PFCAs
Abiotic Transformation of PFAA Precursors
8:2
FTOHPFOA
Ethyl-
FOSA
Atmospheric
Oxidation,
Aqueous
Indirect
Photolysis
C8F17
SNH
O
O
C7F15
O
OC8F17
OH
PFOA
C7F15
O
O
+ shorter
PFCAs

11/30/2016
9
1717
Aerobic Biotransformation of Fluorotelomer Precursors
Forms PFCAs
0
10
20
30
40
50
0 10 20 30 40 50 60
[6:2
FtT
AoS
] m
M
Day
Live
Autoclaved
AFFF AFFF Carbon addition
0
0.1
0.2
0.3
0.4
0 10 20 30 40 50 60
[FtCA]mM
Day
5:3FtCA-Live6:2FtUCA-Live5:3FtCA-Autoclaved6:2FtUCA-Autoclaved
0
0.1
0.2
0.3
0.4
0 10 20 30 40 50 60
[PFCA]µM
Day
PFBA-LivePFPeA-LivePFHxA-LivePFBA-AutoclavedPFPeA-AutoclavedPFHxA-Autoclaved
6:2 FtUCA
5:3 FtCA
PFHxA
PFPeA
PFBA
Similar results with fluorotelomer compounds seen in:
Dinglasan et al. 2004, Wang et al. 2005, Lee et al. 2010, Liu
et al 2010, Dasu et al. 2012, Zhang et al. 2013
Example of Soil Microcosms with Ansul AFFF
(Harding-Marjanovic et al. ES&T 2015)
1818
Aerobic Soil Microcosms from Mejia-Avendano et al. ES&T 2016
Slow Transformation of Sulfonamido Precursors to PFOS

11/30/2016
10
1919
Biotransformation of Fluorotelomer Precursor under
Sulfate-Reducing Conditions: No PFCAs observed
24% 30%
36% 30%
6:2 FtTAoS
6:2 FtTPA
Related study - Zhang et al. 2016, Chemosphere: no transformation of 6:2 fluorotelomer sulfonate observed in anaerobic sediment, transformation of 6:2 FtOH did not yield significant PFCA products
Shan Yi – American Chemical Society Philadelphia 2016
20
-300mV -200mVREDOX
ZONATION-100mV 0mV
Increasing mobility of shorter perfluoroalkyl chain PFAS
C6 C4 C5 C3?
C2
?
C8 C7 C6 C4 C5 C3?
C2
?
Anionic PFAA dead
end daughters
Hidden anionic mobilePFAA
precursors -“DarkMatter”
Anionic precursor biotransformation
increases as aerobic conditions develop
Direction of groundwaterflow
0 C8
C
7
C8F17 S 0 0
0
0
C F S
08 17
0
00H3C 0
C 4H 9
0
C8F17 S 0
0
0
00H3C 0
C 4H 9
0
0
S 0C 8F17
C F
0
0
S 08 17
0
0
C 6F13
S 0
0
0
C 8F17
0
0
S 0S 0 C 8F17
0
0
S 0C 8F17
0
S 0C 8F17
0
0
S 0C 6F13
0
C 6F13
0 0
0
S 0S 0
0 C6F13
Source Zone - Hidden Cationic and Zwitterionic “Dark Matter”
Cationic and zwitterionic PFAS are bound via ion exchange to negatively
charged soils (e.g. silts & clays) in the source zone.
Precursor biotransformation is slow under anaerobic source conditions.
Hydrocarbon LNAPL
F
N+
0
0H
0
00
C1H9
C F
H3C 0
0
0
S 08 17
0
0
S
N HC 8F17
NH+
F
F Cn
0
0 0H
NS
F
F C
F n0
0
H3C 0
0 C 4H 9
0
0H
0
N+F
F
F C
F
C 6F13
0
0
S 0 N
NN
S
0 H
0
F
F C
F n
0
0-C 5F11
0
H3C 0
0
00H3C 0
C 4H 9
0 C 4H 9
0 0
C6F17 S 0
0
AFFF
CH
CH
CH
CHCH
CH
CH
CH3
CH3
CH3
CH3
CH3
Short hydrocarbonplume
100mV 200mV
Conceptual Site Model of a Fire Training Area
20

11/30/2016
11
2121
– PFOA used since the 1950s
– In 2000 PFOA found in a nearby Public Water Supply
– Investigation of the presence of PFOA in environmental media
– Site sources – air emissions, water discharges, on-site landfill
Case Study 1: SCM for a Fluoropolymer Manufacturing Facility
2222
SCM for a Fluoropolymer Manufacturing Facility
Public and Private Well
Sampling
– Surveying and Sampling
Program
– ~110 samples collected and
analyzed
– Concentrations decreased
with increasing distance
from the site
– PFOA in cistern samples
– Concentrations higher in
primary wind flow direction
Facility
11/30/2016
12
2323
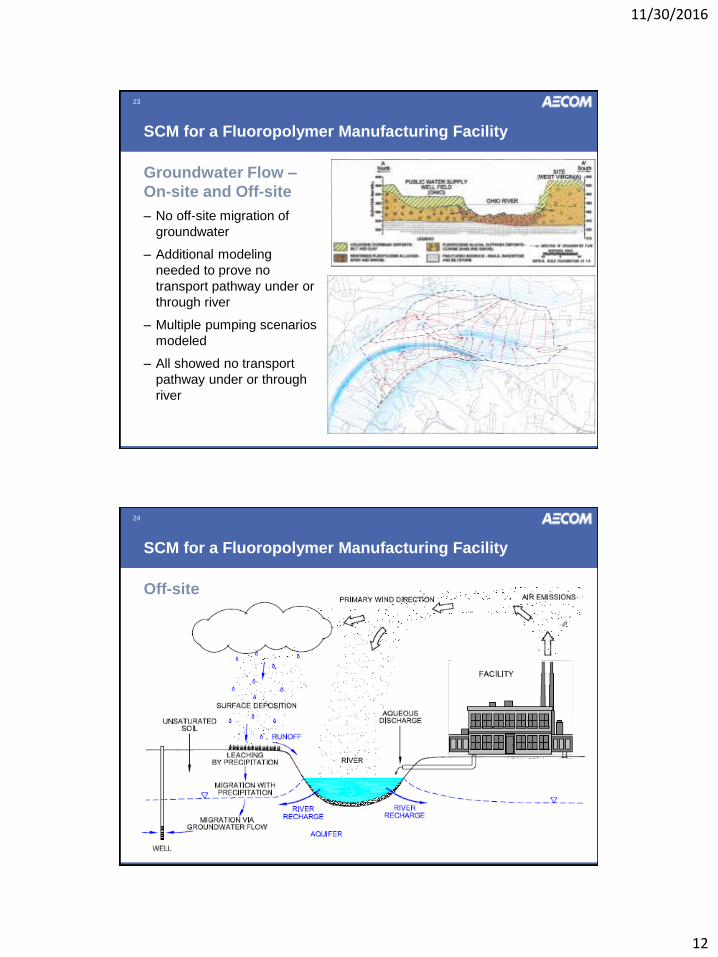
SCM for a Fluoropolymer Manufacturing Facility
Groundwater Flow –
On-site and Off-site
– No off-site migration of
groundwater
– Additional modeling
needed to prove no
transport pathway under or
through river
– Multiple pumping scenarios
modeled
– All showed no transport
pathway under or through
river
2424
SCM for a Fluoropolymer Manufacturing Facility
Off-site
11/30/2016
13
2525
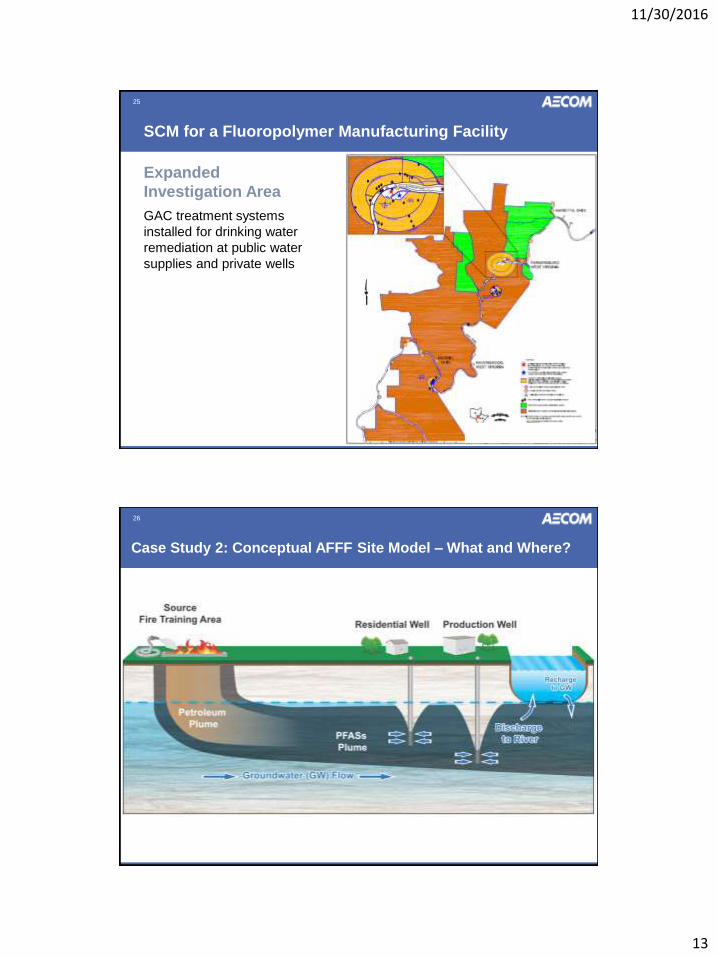
SCM for a Fluoropolymer Manufacturing Facility
Expanded
Investigation Area
GAC treatment systems
installed for drinking water
remediation at public water
supplies and private wells
2626
Case Study 2: Conceptual AFFF Site Model – What and Where?

11/30/2016
14
27
Site and Region Hydrogeological Setting
2828
2011-2012
Site Boundary
2013
2014
GW Flow
SW Flow
SCM AFFF Site – Characterization and F&T Evolution
11/30/2016
15
2929
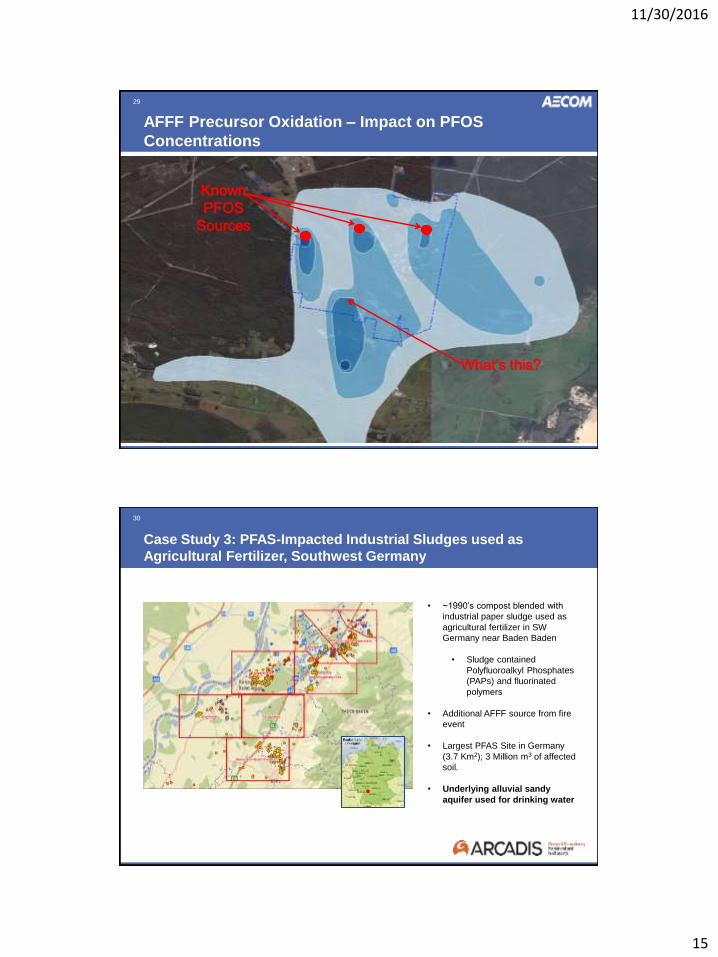
Known
PFOS
Sources
What’s this?
AFFF Precursor Oxidation – Impact on PFOS
Concentrations
3030
• ~1990’s compost blended with
industrial paper sludge used as
agricultural fertilizer in SW
Germany near Baden Baden
• Sludge contained
Polyfluoroalkyl Phosphates
(PAPs) and fluorinated
polymers
• Additional AFFF source from fire
event
• Largest PFAS Site in Germany
(3.7 Km2); 3 Million m3 of affected
soil.
• Underlying alluvial sandy
aquifer used for drinking water
Case Study 3: PFAS-Impacted Industrial Sludges used as
Agricultural Fertilizer, Southwest Germany

11/30/2016
16
3131
PFAS Fingerprint: Average Concentrations
• > 100 individual samples
of soil and groundwater
• Soil fingerprint dominated
by longer chain
compounds; groundwater
shows predominance of
shorter chain compounds
& PFOA – possibly
reflective of a mixture of
sources
• Lab scale KD
determinations
(compounds with arrows)
to evaluate adsorption
• Possible Influencing
Factors: foc, carbon chain
length, functional groups,
anion exchange capacity,
pH, ionic strength, PFAS
concentration
C8
3232
Adsorption strongly correlated with foc
KD did not show strong relationship to
• Anion Exchange Capacity
• pH
• Grain size
• Clay content
KD did show strong relationship to
• Total organic carbon (TOC)
• PFAS chain length

11/30/2016
17
3333
Precursor Analysis via TOP Assay: Most
precursors found on soils
TOP Assay on groundwater:
~5-10% increase in PFAAs
Minimal evidence of precursors
TOP Assay on soils:
~30-70% increase in PFAAs
C4 to C9 increases observed
Soil 1 Soil 1
Pre TOP Post TOPSoil 2 Soil 2
Pre TOP Post TOP
Soil 3 Soil 3
Pre TOP Post TOPSoil 4 Soil 4
Pre TOP Post
TOP
GW 1 GW 1
Pre TOP Post TOPGW 2 GW 2
Pre TOP Post TOP
GW 3 GW 3
Pre TOP Post TOP
GW 4 GW 4
Pre TOP Post
TOP
3434
PFAAs sorbed better to anionic exchange resins (AIX)
PFAA Precursors sorbed better to GAC
Faster breakthrough of
PFAAs with GAC than
AIX
Total organofluorine
(i.e. PFAAs + PFAA
precursors) show that
total PFAS has faster
breakthrough with AIX
Inflow Effluent – Post
GACEffluent – Post Re-
activated GACEffluent – Post
AIX
Inflow Effluent – Post
GACEffluent – Post Re-
activated GAC
Effluent – Post
AIX
t1 ~ 2 weeks
t2 ~ 4 weeks

11/30/2016
18
3535
Case study 4: Fate of AFFF in a Wastewater Treatment Plant
during Annual AFFF Testing
11/19First AFFF Addition
11/25End of 1st
Round of AFFF
12/1More AFFF
12/3End of AFFF
11/19
11/20
11/2311/25 11/30 12/2 12/6 12/9 12/14
12/1512/3
Sample collectedAnalyzed by LC-MS/MS for PFAS Suite
Analyzed by TOP AssayAnalyzed by LC-QTOF-MS
~ 15 days of testing performance of AFFF equipment and AFFF specs
AFFF waters conveyed via wash racks to industrial treatment system
Project undertaken by California DTSC Environmental Chemistry Lab
0
3
6
9
12
11/19/2015 11/24/2015 11/29/2015 12/4/2015 12/9/2015 12/14/2015
Concentr
ation µ
g/L
6:2 FtS
PFOS
3636
Schematic of SFO Industrial Treatment Plant
Wash water
Stormwater, Detention basins<50%, dry weather
>50%, dry weatherEqualization Tank
Rapid Mix Basin 1
Flocculation Tank
Influent Sample
Dissolved Air Flotation Tanks
Rapid Mix Basin 2
Trickling Filter
Midpoint Sample
Clarifiers
Disinfection/Dechlor
Effluent Sample
Discharge to SF Bay
AFFF
~0.5-.6 MGD<3 hrs residence
time

11/30/2016
19
3737
Directly Measured Analytes vs. Post-TOP Assay Total
PFAS Mass
~95-98% of PFAS mass is not directly measured by target analyte list
0
100
200
300
400
500
600
700
Sum PFASPost-TOP
Co
nce
ntr
atio
n,
µg
/L
0
1
2
3
4
5
6
74
2 Ft
S
62
FtS
82
FtS
PFB
A
PFP
eA
PFH
xA
PFH
pA
PFO
A
PFN
A
PFD
A
PFB
S
PFH
xS
PFO
S
PFH
xPA
Co
nce
ntr
atio
n,
µg
/L
12-2-15 Composite Influent
12-2-15 Composite Midpoint
12-2-15 Composite Effluent
3838
Influent to Effluent:
>99% loss of 6:2 FTSAoS, ~50% loss of Total PFAS
0
100
200
300
400
500
600
700
Sum PFAS Post-TOP
Co
nce
ntr
atio
n,
µg
/L
38
0.00E+00
4.00E+07
8.00E+07
1.20E+08
1.60E+08
2.00E+08
2.40E+08
FTAB FTSAS
QTO
F In
st. R
esp
on
se
Influent 12/3/15
Midpoint 12/3/15
Effluent 12/3/15
6
Substantial
disappearance after
trickling filter –
sorption or
transformation?
Minimal
effect of
treatment
processes

11/30/2016
20
3939
Biotransformation Pathway in WWTP Resembles Aerobic Soil Microcosm Pathway
Biotransformation of Ansul 6:2
FtTAoS in Aerobic Soil
Microcosms
(Harding-Marjanovic et al.
2015)
PFHpA
This WWTP
4040
Plant Clearance of PFAS
11/30/2016
21
4141
Conclusions
− Transport depends on chemical structure:• Precursors have many different kinds of functional groups
• PFAAs are generally non-volatile and mobile in groundwater
– PFAAs are non-reactive
– PFAA precursors biotransform more rapidly under aerobic than
anaerobic conditions• Similar transformation pathways seen in lab studies and full-scale
wastewater treatment plants
4242
Conclusions
− Atmospheric deposition of PFAS can occur tens of miles away from
the release location
− Long chain PFAA retardation in subsurface is dominated by
hydrophobic sorption• Electrostatic effects may be more significant for cationic precursors
and short chain PFAAs
– Multiple sources and local hydrogeology contribute to PFAS
distribution at specific sites
– Subsurface fate and transport concepts have implications on
performance of GAC, AIX, and other sorptive treatment
technologies

11/30/2016
22
Erika Houtz, PhD
Environmental Engineer
ARCADIS
Questions?
Jeffrey Burdick
Senior Vice President and
Technical Director
ARCADIS
Dave Woodward
VP. Director of
Remediation Technology
AECOM
43