understanding our local reality
TRANSCRIPT

UNDERSTANDING OUR LOCAL REALITY LOCAL IMMIGRATION FORUM, 2014
• The Algoma Workforce Investment Corporation
(AWiC) is one of 25 Workforce Planning
Boards across Ontario.
• AWIC’s mission is to identify workforce issues that affect communities in the Algoma region through research and provide solutions to these issues by engaging local stakeholders and partners.
Who is AWiC?

The People behind AWiC Andrew Ross Sault Ste. Marie EDC Anita Vaillancourt Algoma University Annie Austin North Shore Tribal Council Dan Friyia Superior East CFDC Dan Morgan Canadian Mental Health Association Dawna Kinnunen YesYouCan Employment Congress Gary Premo Canadian Steel Trade Employment Congress Jim Baraniuk Algoma Anchor Agency (NE LHIN) Karol Rains Sault Community Career Centre Larry Little CDC of Sault Ste. Marie
Linda Ryan Employment Solutions Mike Delfre Canadian Bush Plane Museum Mike Pratt BioForest Technologies Ralph Medaglia Essar Steel Algoma Rick Thomas Sault Ste. Marie Construction Association Russell Reid Regional Employment Help Centre Shawn Heard East Algoma Community Futures Dev. Corp. Stoney Burton Blind River Development Corp. Ted Newbury Sault College Tracey Seabrook Algoma District Services Admin Board

Community Partners

Sault Ste. Marie Labour Market Demand Side
(Where the jobs are…)

SSM Labour Market by the Numbers
The SSM Labour Market Employs Approximately
35,870 People
About ½ are Male
17,725 About ½ are Female
18,140
So – Where do these people work?


Can you Name One of the Top 10 Sectors/Industries for Employment in
Sault Ste. Marie?

Top Employers in SSM by Industry
?
?
?
?
?
?
?
?
?
?
And a few other Industries that each represent less than 3% of total employment

Top Employers in SSM by Industry
Health Care & Social Services 14%
Retail Trade 13%
Manufacturing 12%
Public Administration 9%
Education 8%
Accommodation and Food 7%
Construction 7%
Transportation 3%
Other Services 5%
Administrative and Support 6%
And a few other Industries that each represent less than 3% of total employment

Can you name a sector/industry that has grown in terms of employment since 2006?

Growth/Decline by Industry – 2006 to 2011 Sault Ste. Marie
Health Care & Social Services + 7%
Construction + 26%
Source: 2011 National Household Survey
Public Administration + 9%
+

Can you name a sector/industry that has decreased since 2006
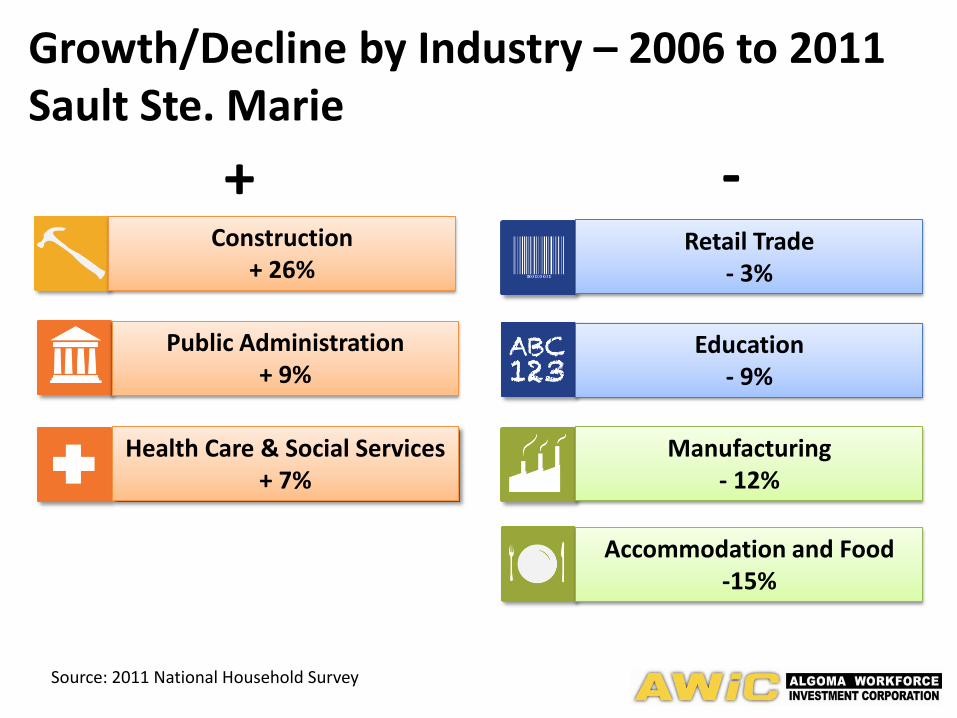
Growth/Decline by Industry – 2006 to 2011 Sault Ste. Marie
Health Care & Social Services + 7%
Retail Trade - 3%
Manufacturing - 12%
Education - 9%
Construction + 26%
Source: 2011 National Household Survey
Public Administration + 9%
Accommodation and Food -15%
+ -

Can you name a sector/industry that female dominated?

Sectors by Gender
Health Care & Social Services 87%
Education 75%
Accommodation and Food 70%

Can you name a sector/industry that male dominated?

Sectors by Gender
Health Care & Social Services 87%
Manufacturing 87%
Education 75%
Accommodation and Food 70%
Construction 91%
Transportation 77%

Big vs.
Small Employers
What % of Employers in Sault Ste. Marie have less that 10 Employees?
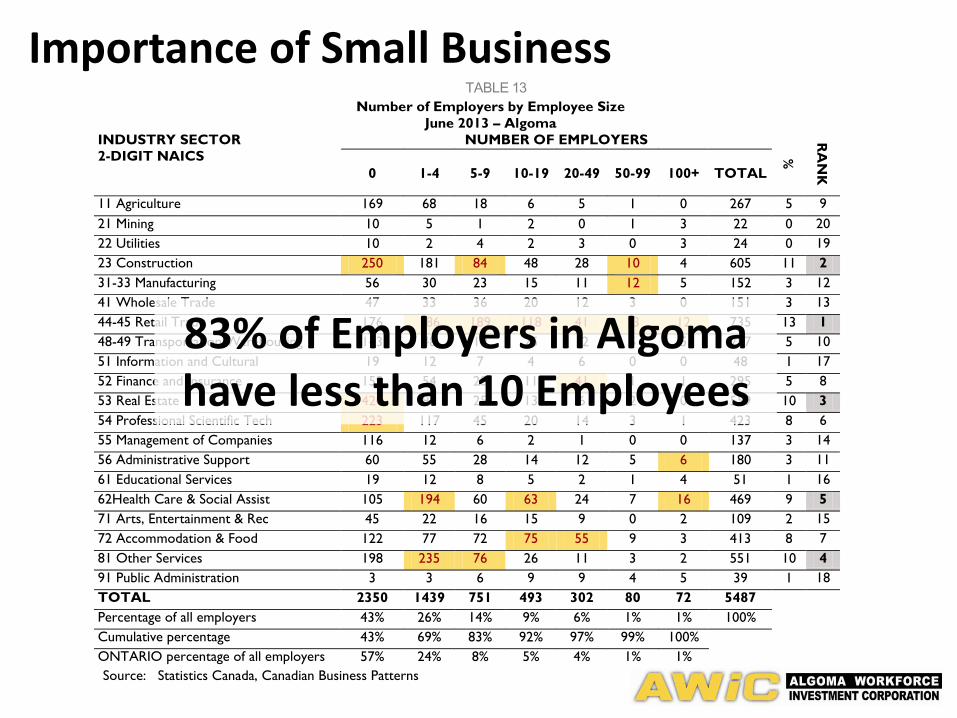
Importance of Small Business TABLE 13
Number of Employers by Employee Size
June 2013 – Algoma
INDUSTRY SECTOR
2-DIGIT NAICS
NUMBER OF EMPLOYERS
%
RA
NK
0
1-4
5-9
10-19
20-49
50-99
100+
TOTAL
11 Agriculture 169 68 18 6 5 1 0 267 5 9
21 Mining 10 5 1 2 0 1 3 22 0 20
22 Utilities 10 2 4 2 3 0 3 24 0 19
23 Construction 250 181 84 48 28 10 4 605 11 2
31-33 Manufacturing 56 30 23 15 11 12 5 152 3 12
41 Wholesale Trade 47 33 36 20 12 3 0 151 3 13
44-45 Retail Trade 176 186 189 118 41 13 12 735 13 1
48-49 Transportation/Warehousing 143 48 19 25 12 5 5 257 5 10
51 Information and Cultural 19 12 7 4 6 0 0 48 1 17
52 Finance and Insurance 159 54 28 11 41 1 1 295 5 8
53 Real Estate 420 93 25 13 6 2 0 559 10 3
54 Professional Scientific Tech 223 117 45 20 14 3 1 423 8 6
55 Management of Companies 116 12 6 2 1 0 0 137 3 14
56 Administrative Support 60 55 28 14 12 5 6 180 3 11
61 Educational Services 19 12 8 5 2 1 4 51 1 16
62Health Care & Social Assist 105 194 60 63 24 7 16 469 9 5
71 Arts, Entertainment & Rec 45 22 16 15 9 0 2 109 2 15
72 Accommodation & Food 122 77 72 75 55 9 3 413 8 7
81 Other Services 198 235 76 26 11 3 2 551 10 4
91 Public Administration 3 3 6 9 9 4 5 39 1 18
TOTAL 2350 1439 751 493 302 80 72 5487
Percentage of all employers 43% 26% 14% 9% 6% 1% 1% 100%
Cumulative percentage 43% 69% 83% 92% 97% 99% 100%
ONTARIO percentage of all employers 57% 24% 8% 5% 4% 1% 1%
Source: Statistics Canada, Canadian Business Patterns
83% of Employers in Algoma have less than 10 Employees
NAICS Total (A)0 1 - 4 5 - 9 10 -1 9 20-49 50-99 100+
Total 3345 1367 838 500 314 209 59 58
11 Agriculture 60 33 19 3 2 2 1 0
21 Mining 6 4 1 0 0 0 1 0
22 Utilities 11 5 0 2 0 1 0 3
23 Constructions 356 137 102 50 31 24 8 4
31-33 Manufacturing 84 26 17 15 8 6 7 5
41 Wholesale Trade 101 28 16 30 16 9 2 0
44-45 Retail Trade 457 100 99 137 71 28 11 11
48-49 Transportation/Warehousing 120 57 21 11 13 9 5 4
51 Information and Culture 23 10 4 0 3 6 0 0
52 Finance and Insurance 214 117 44 21 6 24 1 1
53 Real Estate 390 300 56 20 9 4 1 0
54 Professional, Scientific and Technical Services 305 149 86 36 19 12 2 1
55 Management of companies and enterprises 101 85 9 5 1 1 0 0
56 Administrative Support Services 113 33 29 18 11 11 5 6
61 Educational services 35 14 8 4 4 0 1 4
62 Health Care & Scial Assistance 338 78 139 49 48 11 2 11
71 Arts, Entertainment and Recreation 56 21 13 7 6 8 0 1
72 Accomodations and Food 212 48 33 33 43 43 9 3
81 Other Services 355 121 142 56 22 9 3 2
91 Public Administration 8 1 0 3 1 1 0 2
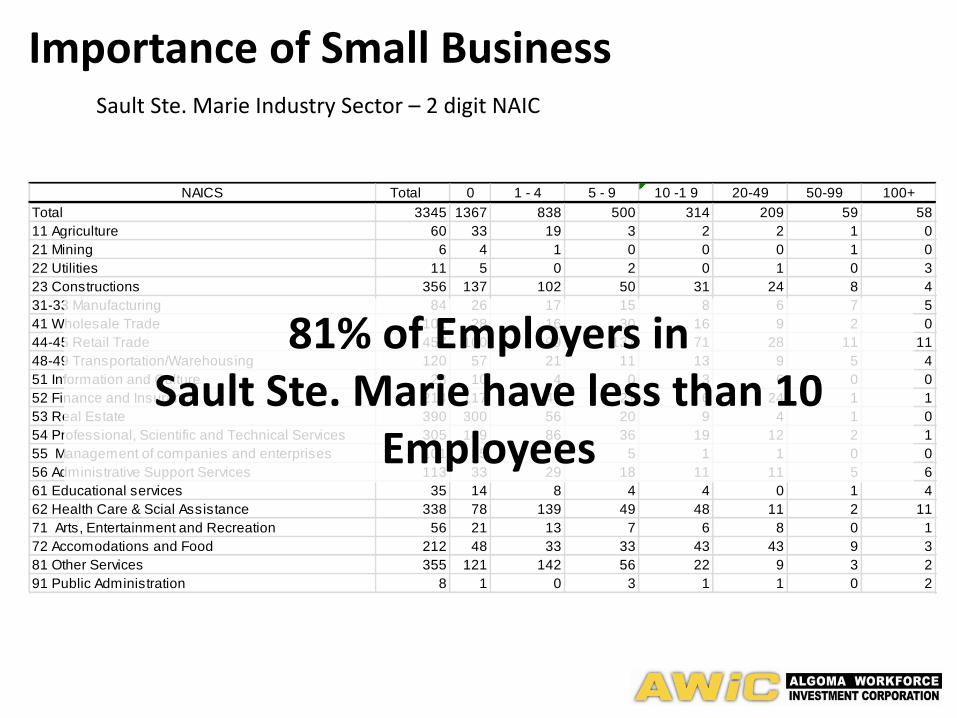
Importance of Small Business
81% of Employers in Sault Ste. Marie have less than 10
Employees
Sault Ste. Marie Industry Sector – 2 digit NAIC

Importance of Small Business
Canada wide, small businesses are responsible for creating 77.7 percent of all private jobs from 2002 to 2012.
Source: Statistics Canada, Labour Force Survey (LFS), 2012,
and calculations by Industry Canada.

Sault Ste. Marie Labour Market
Supply Side (Who is available to do
the work…)

Population
Source: 2011 National Household Survey & 2006 Census
Geography Population
2011 Population
2006 %
Change
Algoma 115,870 117,461 -1.4%
Blind River 3,549 3,780 -6.1%
Dubreuilville 635 773 -17.9%
Elliot Lake 11,348 11,549 -1.7%
Michipicoten 2,975 3,204 -7.1%
Sault Ste. Marie 75,141 74,948 0.3%
Spanish 698 728 -4.4%
Thessalon 1,279 1,312 -2.5%
White River 607 841 -27.8%
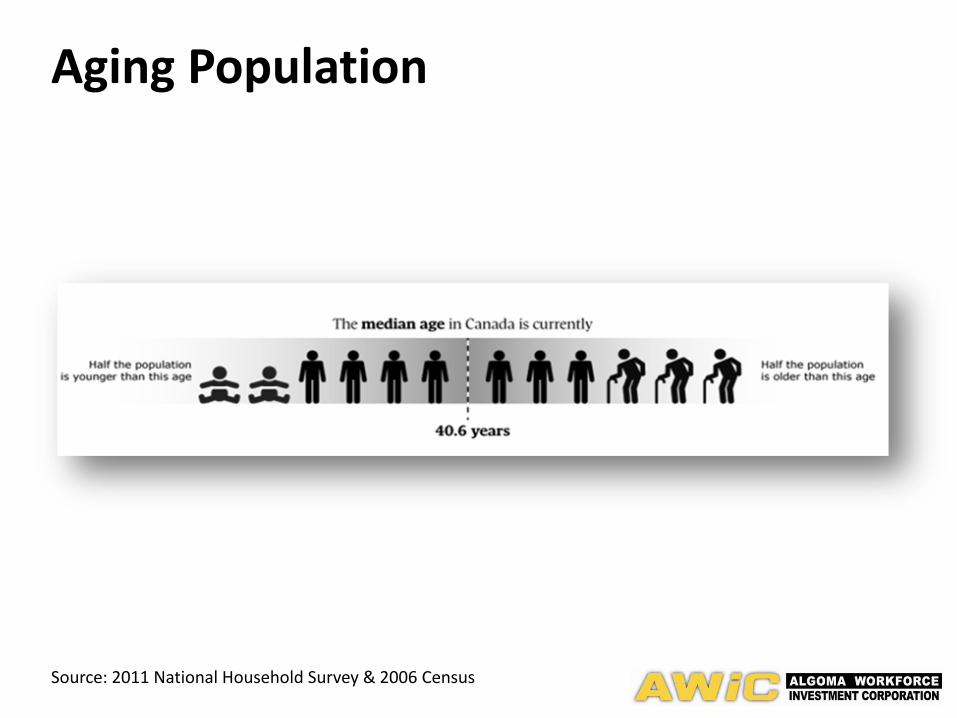
Aging Population
Source: 2011 National Household Survey & 2006 Census

Is Algoma’s Medium Age Higher or Lower than Canada’s?

Aging Population
Source: 2011 National Household Survey & 2006 Census
Median Age
2006 2011
Canada 39.5 40.6
Ontario 39.0 40.4
Algoma 45.0 47.2

What is the Oldest Community in Algoma?

Aging Population
Source: 2011 National Household Survey & 2006 Census
Community
Median Age
2006 2011
Blind River 46.1 48.7
Dubreuilville 35.4 36.8
Elliot Lake 54.8 57.1
Sault Ste. Marie 43.9 45.6
Wawa 40.6 44.1
White River 42.4 46.9

Out Migration of Youth 2007 – 2012 (Algoma)
Age Group In-migrants Out-migrants Net-migrants
0-17 2,883 2,654 229
18-24 1,601 2,761 -1,160
25-44 4,370 5,239 -869
45-64 3,040 2,548 492
65+ 1,266 1,754 -488
Total 13,160 14,956 -1,796
Source: 2011 National Household Survey

Algoma has an Aging Population Media Age is 47.2 years (Canada is 40.6 years)
+ Out migration of youth
Net out-migration of 1,200 people aged 18-25 between 2006 and 2011 (2,800 in total)
Low Immigration rates
An aging Local Workforce
+
=
Issue/Opportunity – Aging Workforce

In Sault Ste. Marie, more than half of the labour force (population 15 and over) is 40+.
Based on the assumption that almost all of these people will retire by the age of 65, this means that 42,735 of the people who are in the 40+ category are projected to exit the labour force over the next 20 years and be replaced by the 32,415 people who are under the age of 40.
33
Issue/Opportunity – Aging Workforce

Accounting Bookkeepers 78%
Forestry Professionals 75%
HR Professionals 74%
Manufacturing Managers 73%
Metal Working Machinists 70%
Truck Drivers 68%
Heavy Equipment Operators 68%
Brick Layers 65%
Admin Assistants 65%
Personal Support Workers 63%
Elementary and Secondary School TA’s 60%
Heavy Equipment Mechanics 58%
Registered Nurses 47%
Issue/Opportunity – Aging Workforce
Who will replace these people in the
Labour Force?
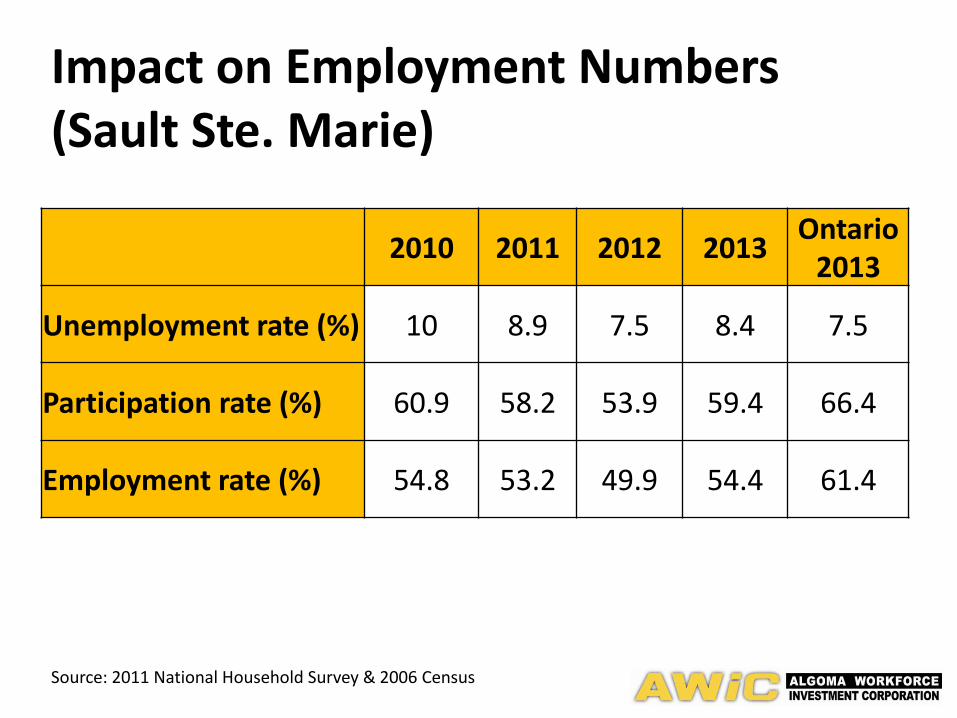
Impact on Employment Numbers (Sault Ste. Marie)
Source: 2011 National Household Survey & 2006 Census
2010 2011 2012 2013 Ontario
2013
Unemployment rate (%) 10 8.9 7.5 8.4 7.5
Participation rate (%) 60.9 58.2 53.9 59.4 66.4
Employment rate (%) 54.8 53.2 49.9 54.4 61.4

Key takeaways I hope you got out of this presentation:
Major Industries in Sault Ste. Marie
Which Industries/Sectors are Growing
Sault Ste. Marie has a number of large employers but the majority are Small Businesses
Sault Ste Marie has an aging population This has an impact on the economy This will have a huge impact on the Workforce
Some Occupations are ‘Aging’ more rapidly than others.

For More Labour Market Updates…
www.awic.ca