understanding organic prices: an analysis of organic price ... · understanding organic prices: an...
TRANSCRIPT

Understanding Organic Prices: An Analysis of Organic Price Risk and Premiums
Sarah Michele McKay
Thesis submitted to the faculty of the Virginia Polytechnic Institute and State
University in partial fulfillment of the requirements for the degree of
Master of Science
In
Agricultural and Applied Economics
Kimberly L. Morgan
Olga Isengildina Massa
Gustavo F.C. Ferreira
April 22, 2016
Blacksburg, Virginia
Keywords: organic, premiums, risk, volatility, price, grains, commodity, oilseed

Understanding Organic Prices: An Analysis of Organic Price Risk and Premiums
Sarah Michele McKay
SCHOLARLY ABSTRACT
The organic food sector has been growing rapidly over the past several decades. Traditionally,
this growth has taken place in the produce category, but as consumers demand more organic
products, the organic grain and meat sectors have been emerging. Currently, there is a shortage
of organic grains, specifically corn, soybeans, wheat, oats and barley, to feed organic livestock.
In addition, there is limited studies and understanding of organic price premiums. Therefore, the
purpose of this study is to extend existing literature on organic price behavior and factors
affecting the organic premium.
The agriculture and food industry has undergone many changes over the past several
decades as consumers continue to demand increased transparency and sustainability from the
U.S. food system; most notably, the rise of organic food consumption. Food processors and
retailers have contributed to this growth as they expand their number and variety of organic
product offerings, and have contributed to the increased demand for organic grains, soybeans,
milk and meats. Within the last year, major food companies, such as Kroger, Target,
McDonald’s and Wal-Mart have made commitments to sell more organic food—including
grains, milk, and meat. Domestic organic food production increased by 240 percent from 2002-
2011 versus three percent in non-organic food. In 2015, there were 21,781 USDA certified
organic operations in the United States, representing an increase of 250 percent from 2002.
Despite increases in organic production, there are still major shortages on the supply side of
organic feed grains and soybeans. This has resulted in increased imports of organic grain from
Canada, Eastern Europe and South Africa in response to the organic grain and soybean demand
from the animal feed markets. Under these market conditions, there is room for expansion in the
organic grain and oilseed markets, yet low levels of adoption of organic production among U.S.
field crop producers persist.
Part I of this study provides new insight into the price risk exposure of organic grain and
oilseed commodities as compared to their conventional counterparts by analyzing price levels
and volatility over time. Organic corn, soybeans, and oat market prices were less volatile during
the 2007-15 time period, whereas organic wheat and barley market prices were more volatile
than their conventional counterparts. Organic prices collapsed during the recession and remained
low one year following the recession. The volatility of organic and conventional prices was
significantly different pre-, during, and post-recession for all commodities except soybeans and
wheat pre-recession.
In Part II, organic price premiums are explored through identification of key variables
expected to influence production and market conditions for corn, soybeans, wheat, barley, and
oats. Using an OLS model, lagged premiums were significant for corn, soybeans, and oats, but at
varying lags and levels. Oil price was positively significant for all commodities except barley
premiums and personal income was only significant for corn, soybeans, and oats. The model was
re-estimated using first differences and run with the stationary data, revealing significant
variables including lagged premiums, oil price, and the FAO Cereal Index.
Study findings are expected to benefit organic and conventional farmers by providing
new information useful for planting decisions. Results are also expected to better inform

consumers of these organic commodities, such as livestock producers and food manufacturing
firms, who seek to more fully understand the price risk exposure of their organic commodity
inputs. Lastly, policy makers and the USDA can help organic producers by collecting more
accurate and frequent data on organics, especially with regards to planted and harvested acreage,
yields, stocks, imports, exports, and use.

Understanding Organic Prices: An Analysis of Organic Price Risk and Premiums
Sarah Michele McKay
GENERAL AUDIENCE ABSTRACT
Organic food products are produced without synthetic chemicals, including herbicides,
pesticides, and fertilizers. Food grown in organic systems that are certified organic by the United
States Department of Agriculture command a price premium, whether it is direct to consumer via
farmers markets or in conventional grocery stores. Organic food and food products are
representing a relatively larger portion of overall food sales in recent years, and the demand for
organic meat has also increased. However, there is a lack of available U.S.-grown organic grains
and soybeans to feed the growing number of organic certified livestock to produce organic meat
to meet this demand. This shortage results from many factors, yet is primarily due to organic
production requirements for significantly more land and operating capital when compared to
conventionally grown counterparts. There is a lack of information detailing the relative costs and
returns of organic grain production, and, limited understanding of organic premiums. The overall
goal of this study is to examine differences in price levels between organic and conventional
corn, soybeans, wheat, oats, and barley between 2007 and 2015, as well as factors that may
affect the organic premium. For organic grain and soybean producers, study findings reveal that
the least risky organic commodities to grow include corn and soybeans, especially if sold in the
cash market. However, the author suggests that growers may consider growing wheat, barley,
and oats if they have a buyer willing to contract in advance to ensure a premium and reduce price
risk. For purchasers of organic grains and soybeans, including major food companies as well as
livestock producers, it is recommended they continue to study developments in organic grain
supplies as producers continue to consider adoption of organic production methods.

v
Table of Contents
Introduction…………………………………………………………………………………..1
Project Objectives……………………………………………………………………………13
Literature Review……………………………………………………………………………14
Examining Organic Versus Conventional Volatility………………………………...14
Key Factors Affecting Organic Premiums…………………………………………...19
Part I: Differences in Organic and Conventional Price Levels and Volatility……………….23
Description of Data and Methods…………………………………………………….24
Discussion of Results…………………………………………………………………25
Part II: Understanding Organic Price Premiums……………………………………………..35
Model Development and Data………………………………………………………..35
Description of Data…………………………………………………………………...40
Results………………………………………………………………………………...47
Conclusions…………………………………………………………………………………...54
References…………………………………………………………………………………….56

1
Introduction
The agriculture and food industry has undergone many changes over the past several
decades as consumers continue to demand increased transparency and sustainability from the
U.S. food system. One of these changes has been most noticeable in the rise of organic food
consumption.
In the United States, organic food sales have increased from $11 billion to $35.9 billion
between 2004 and 2014 (OTA, 2015). As of 2014, these sales accounted for more than five
percent of the total U.S. food sales (Organic Industry Survey, 2015). From 2013 to 2014, organic
food expenditures increased by 11 percent, and demand for organic food at retail sales outlets is
expected to continue to grow at a compound annual growth rate of 14 percent between 2013 and
2018 (Daniells, 2014). SPINS, a consumer insights group focused on natural and organic food
trends, argues that this growth could be even more substantial. In 2014, 18 percent of consumers
accounted for 50 percent of all natural/organic food category sales, which leaves 82 percent of
consumers who have not yet reached their full buying potential in this category (Daniells, 2014).
Figure 1:
Source: USDA, Economic Research Service using data from Nutrition Business Journal (Public Domain)
As of 2014, organic food products could be found in nearly 20,000 natural food stores
and in three out of four conventional grocery stores in the United States. Consumers have access

2
to organic food through three main venues: conventional grocery stores; natural food stores; and
direct-to-consumer markets, such as farmer’s markets (Greene, 2014). The Organic Trade
Association also reported 81 percent of Americans purchased organic at least a few times in
2012.
Since 2005, produce items have accounted for the highest percentage of organic food
sales volume. This has provided opportunities for small and beginning farmers who have been
able to capitalize on this niche market. However, there has also been more recent growth in
dairy, beverages, and packaged food, as well as meats, breads and grains (Figure 2) (Greene,
2014).
Figure 2:
Source: USDA, Economic Research Service using data from Nutrition Business Journal (Public Domain)
Food processors and retailers have contributed to this growth as they expand their
number and variety of organic product offerings, and have contributed to the increased demand
for organic grains, soybeans, milk and meats. Within the last year, major food companies, such
as Kroger, Target, McDonald’s and Wal-Mart have made commitments to sell more organic
food—including grains, milk, and meat. In the case of General Mills, the food company has set
goals to double their organic product sales by 2020 (General Mills, 2016).
3
In this context of growing demand for organic products, domestic organic food
production increased by 240 percent from 2002-2011 versus three percent in non-organic food.
In 2015, there were 21,781 USDA certified organic operations in the United States, representing
an increase of 250 percent from 2002. In 2015, the number of certified organic operations
worldwide increased to 31,160 operations in over 120 countries (USDA, 2016). As of 2011, the
total certified organic acreage was just over 5 million acres, or 0.6 percent of all U.S. cropland,
as seen in Figure 3. Of all U.S. farmland dedicated to commercial vegetable and fruit production,
5.7 percent and 3.4 percent of planted acreage was grown using organic production methods,
respectively, compared to just 0.3% of corn acreage and 0.2% of soybean acreage in 2011
(Greene, 2011). Despite increases in organic production, there are still major shortages on the
supply side of organic feed grains and soybeans.
Figure 3:
Source: USDA, Economic Research Service, and Natural Foods Merchandiser and Nutrition Business
Journal (Public Domain)

4
In addition to relatively slow increases in growth of organic acreage plantings, uneven
growth in the organic field crop acreage has occurred (Figure 4).
Figure 4:
Source: USDA, Economic Research Service, Organic Data Page, based on data from organic certifiers.
Certifier data were not compiled for 1996, 1998, 1999, 2009, and after 2011 (Public Domain)
As more and more consumers desire organic food products, growth in demand has
rapidly outpaced the growth in supply. This has led to significant supply chain problems and
increases in organic food prices. Many conventional farmers also remain hesitant to explore
organic production (Reaves, 2015).
Organic livestock production in the United States has expanded rapidly as a response to a
growing demand for organic meats. Consequently, organic livestock are experiencing the
difficulties in procuring organic feed grains to feed an increasing number of certified organic
livestock. In 1992, the total number of certified organic livestock was 11,647 head versus 56,028
head in 2000 and 196,506 head in 2005. By 2011, the number of certified organic livestock had
increased 40 fold to 492,353 head. While organic demand has been increasing, the supply,
5
especially for grains used as animal feed, lag. This has resulted in increased imports of organic
grain from Canada, Eastern Europe and South Africa (Roseboro, 2015). According to Mercaris,
a market data service and trading platform for organic and non-GMO agricultural commodities,
as of February 2015, imports of organic corn reached 5.2 million bushels, an increase of 752
percent from 2014. Most of these imports are in response to the organic grain and soybean
demand from the animal feed markets (Reaves, 2015).
Under these market conditions, there is room for expansion in the organic grain and
oilseed markets, as organic crops account for a very small share of U.S. cropland. One possible
explanation for the low amount of cropland and uneven growth between grains and oilseed
acreage, is the fact that it takes three years for a farm to become certified organic when
transitioning from conventional production practices. According to USDA Certified Organic
Standards, any land used to produce organic commodities may not have had prohibited
substances applied to it for the past three years. This results in a transition period for farmers,
where they must produce according to the organic standards but may not sell, label, or represent
their commodity as organic or use the USDA organic seal. Thus, they cannot acquire the organic
premium for their commodity and are ultimately producing at a lower profit level during the 36-
month transition period (USDA, 2012). This becomes a challenge for grain and soybean farmers
who have to operate at maximum efficiency using conventional methods to achieve a sustainable
income. While they may receive a premium for their organically produced commodity, this
premium will not be realized for three seasons.
Aside from this transition period, McBride and Greene (2015) argue that the low level of
adoption of organic production among U.S. field crop producers may be the result of a lack of
information about the relative costs and returns of organic and conventional production systems

6
on commercial farms. The main factors affecting organic profitability are labor and total costs,
price premiums, reduced income during the transition period and crop yields. One meta-analysis
analyzed the financials of organic production using 40 years of studies on 55 crops grown around
the world. This study found that organic agriculture had between 22 to 35 percent higher
profitability, but 20 to 24 percent higher benefit/cost ratios as compared to conventional.
However, when the premium was taken away, organic had -27 to -23 percent lower percent
profitability and -8to -7% lower benefit/cost ratios as compared to organic suggesting that the
higher costs and lower yields have a significant impact on organic production profitability
(Reganold and Wachter, 2016). Research has noted that organic yields tend to be lower than
conventional (Figure 5), and producers have reported that achieving yields was one of the
biggest challenges in organic production (McBride and Greene, 2015). Other meta-analysis
studies comparing yields between systems showed that organic average yield are 8 to 25 percent
lower than conventional (Stanhill 1990; Badgley et al 2012; de Ponti, Riik, and van Ittersum,
2012; Seufert, Ramankutty, and Foley, 2012; Ponisio et al, 2015.). These difference are likely
due to the fact that certified organic production may not include synthetic fertilizers as well as
pesticides and herbicides, making the yield more variable. Nevertheless, yield discrepancies are
not uniform across different crops. For instance, the best yielding organic crops such as rice,
soybeans, corn, and grass-glover tend to yield 6 to 1 percent less than their conventional
counterparts. On the other hand, lower yielding organic crops like fruits and wheat normally
yield 28 and 27 percent less, respectively (de Ponti, Riik, and van Ittersum, 2012). Thus, because
organic production involves additional risks, such as lower yields, organic price premiums are
expected (Klonsky and Greene 2005).

7
Figure 5:
Source: USDA, Economic Research Service calculations from USDA, National Agricultural Statistics
Service’s 2011 Certified Organic Production Survey and Crop Production 2011 Summary. (Public Domain)
There are also differences in input costs per acre between organic and conventional
production (Figure 6). Organic production is characterized by higher labor, fuel, and capital costs
per acre, adding in more variability as skilled and reliable labor is hard to come by and fuel
prices have varied significantly in recent years (Green, 2011). For instance, as of April 2016,
organic dairy farmers have struggled keeping up with the market as they faced high feed and fuel
prices (Associated Press, 2016).

8
Figure 6:
Source: USDA, Economic Research Service calculations from USDA, National Agricultural Statistics
Service’s 2011 Certified Organic Production Survey and Crop Production 2011 Summary. (Public Domain)
While there is obvious demand for organic commodities, farmers need to know how
much demand there is and at what specifications. While this clarity on demand is needed, so is
technical assistance when it comes to organic production, profitable rotations, and marketing
avenues (Reaves, 2015). This has led to the development of the US Organic Grain Collaboration,
which consists of various companies seeking to grow the organic grain supply and address
barriers including “access to resources, knowledge, equipment, and services for transitioning to
organic production; and lack of organic market information and resources that conventional
farmers have” (Roseboro, 2015). Because grain and oilseed production requires more capital and
land, noticeable increases in organic production that capitalize on the growing organic market
have not occurred. Therefore, an opportunity exists for farmer investment in organic grain and
oilseed production to meet expected increases in demand. However, the price analysis and risk

9
management tools used by traditional commodity producers are not widely available to organic
producers.
Producers of conventional agricultural commodities have benefited from well recorded
and widely available price series maintained by the United States Department of Agriculture
(USDA), National Agricultural Statistical Service (NASS), and futures markets, as well as a
large body of literature that had analyzed patterns in conventional prices. Such wealth of
information allows farmers and firms to plan ahead and make profit-maximizing decisions and at
the same time mitigate the negative effects volatility in the markets. On the other hand,
consistent price reporting and studies on organic commodities are much scarcer, since most
organic products are sold via a specialty broker rather than a terminal market. (Dimitri & Greene,
2000). This is reflective of the fact that buyers of organic grains and soybeans are not highly
concentrated like those of their conventional counterparts and buyers often form long-term
contractual relationships with producers who offer consistency and quality (Born 2005;
Singerman, Lence, and Kimble-Evans, 2014). Thus, there is little insight on organic price
volatility and understanding of the organic price premiums, particularly for grains and soybeans.
There have been a few steps taken by the USDA to provide more risk management tools
to organic producers. In 1990, Congress passed the Organic Foods Production Act of 1990 to
establish nation-wide organic standards to help in labeling accuracy and consumer confidence,
all while ensuring a consistent product quality. In 2000, the USDA created the National Organic
Program to carry out this legislation and the USDA Organic label was finally implemented in
2002. The 2014 Farm Act further expanded organic regulation by including several new
provisions to improve enforcement of organic labeling as well as funding for the National
Organic Program (ERS, 2014).

10
Nowadays, there are a series of USDA programs that provide support to organic
agricultural producers. The USDA has made efforts to make organic certification more
accessible, attainable, and affordable by implementing a Sound and Sensible approach which
includes identifying and removing barriers to certification, streamlining the certification process,
focusing enforcement, and working with farmers to address issues in a quick and efficient
manner. They also launched the Organic Literacy Initiative to help USDA’s employees better
serve organic producers (ERS, 2014).
There have also been new and expanded efforts to connect organic farmers and
businesses with resources they need to grow, including access to information on organic
programs and technical and financial resources. In order to assist organic operations in defraying
certification costs, the USDA developed the Organic Certification Share Program. This program
involves producers receiving partial reimbursement for the organic certification cots. Market and
pricing information is also available free of charge for nearly 250 organic products through
USDA Market News (USDA, 2015).
In addition, over the past six years, there have been over $220 million in funding to internal
and university researchers to improve productivity and success of organic agriculture as well as
steps to provide effective insurance coverage for organic crops and risk management tools for
organic producers (USDA, 2015). Nevertheless, in the past, Federal crop insurance was less
attractive to organic producers as compared to traditional producers. In general, regulations
governing the insurability of organic and transitional practices are the same as for conventional
practices. However, the program’s coverage generally did not account for the higher prices that
organic farmers received for their crops. Typically, producers choose a percentage of the

11
maximum price set by USDA's Risk Management Agency (Risk Management Agency, 2016)
for their commodity, which is then used to determine the value of insurance coverage. For
many commodities, the maximum price election did not reflect the price premium that growers
receive for their organic production. As of 2014, a contract pricing option and a rule was added
in the Federal Register that allows separate average market prices to be established for organic
crops for the Noninsured Crop Disaster Assistance Program. Today, insurance is provided for
any crop grown using organic farming practices when a premium rate for an organic practice is
specified in the actuarial documents or there is an approved written agreement. However, many
organic farmers sell their harvested crops in the “spot market,” where commodities are bought
and sold in open market transactions for immediate delivery, rather than producing their crops
under contract for a specified price (ERS, 2014). Lastly, changes made to provide coverage for
transitional acreage has eased the transition burden, as transitioning farms will now be covered
as if they were already certified farms (RMA, 2016).
Despite the progress described above, there is still a need for a better understanding of
organic price levels and the associated risks. There is also a need to better inform potential
organic producers. The purpose of this study is to provide new insight into the price risk
exposure of organic grain and oilseed commodities as compared to their conventional
counterparts. This price risk is analyzed by understanding price levels and then, price volatility
over time. Secondly, this study seeks to explain organic price premiums through key variables
which are expected to influence production and market conditions for corn, soybeans, wheat,
barley, and oats. These explanatory variables include historical grain prices, oil prices, time,
personal income, and the FAO world cereal index. There is also a case study on the effects of
organic imports. This study will be beneficial for organic and conventional farmers, because it

12
will provide them with new information for their planting decisions. Results are also expected to
better inform consumers of these organic commodities, such as livestock producers and food
manufacturing firms, who seek to more fully understand the price risk exposure of their organic
commodity inputs.

13
Project Objectives
In part I of our study, we seek to address existing gaps in the literature by examining the
difference in price risk as a result of volatility in organic and conventional corn, soybeans, wheat,
oats, and barley market prices. This is important to understand, as organic crop producers’ profits
are influenced by the mean difference between organic and conventional prices and the risk
associated with volatile prices. In part II of this study, we seek to explore those factors that affect
the organic price premium, including lagged premiums, oil prices, personal income, time, the
FAO cereal index and in a case study, organic imports.

14
Literature Review
Examining Organic Versus Conventional Volatility
In existing literature on agricultural commodity prices, it is clear that price volatility has
long run impacts on the incomes of producers and also creates difficulties in planning
agricultural production. Since 1962, agricultural commodities have experienced increasing price
volatility, and volatility is affecting modern agricultural markets (Balcombe, 2009). Volatility
can be interpreted as a series’ tendency to have values far from the series’ mean as well as the
tendency of the series to have large changes in its values from period to period (Balcombe,
2009). Historical volatility measurements have been based on price levels and have been
measured with the standard deviation of prices or by estimating the coefficient of variation. The
coefficient of variation expresses the standard deviation as a percentage of the sample mean. The
benefit to this measurement is that it does not depend on unit of measurement (Huchet-Bourdon,
2011).
These fluctuations in commodity prices can be explained by various factors. Balcombe
(2009) argues that volatility is the result of production levels that are influenced by unpredictable
events, such as weather and pests, as well a result of the connectedness with other markets (e.g.
energy). Because these energy markets also experience volatility and are a major input for
agricultural production, they influence and translate into agricultural commodity volatility. It has
also been argued by Gilbert (2006) that agricultural prices are volatile because short run supply
and demand elasticities are low. Thus price changes are likely influenced as supply and demand
conditions change. Moledina, Roe, and Shane (2004) point out that the classic microeconomic
argument for increasing volatility is a result of mismatched supply and demand. They also point
out macroeconomic policy, terms of trade shocks, exchange rates, and government interventions

15
as volatility influencers. The same study also examines the relationship between measures of
volatility and farmer expectations. They hypothesized that producers are rational in that their
expectation of future prices are a reflection of past realizations.
Other volatility factors are explained by Wescott and Hoffman (1999), who analyzed
market factors and government programs that determine corn and wheat prices in the U.S. They
note that prices are determined by the interaction of supply and demand functions, which
historically were influenced by government agricultural policies. On the supply side, they
evaluated beginning stocks, imports, and production. Beginning stocks are the carryover stocks
from the previous year and large stocks typically result in lower prices. At the time of this study,
imports were noted as fairly insignificant on domestic supply, but are still a supply shifter.
Production is crucial in determining price and is determined by the amount of acreage harvested
and yield per acre. Demand factors include food, seed, and industrial use, feed and residual, and
exports. Wescott and Hoffman (1999) used these factors in their model to estimate corn and
wheat prices between 1975 and 1996. They then measured mean absolute error and mean
absolute percentage error for two time periods using their model and found that their models
were good performers and provide an analytical framework that is useful in price-forecasting
applications.
Trostle (2008) evaluated factors that contributed to the increase in food commodity prices
between 2006 and 2008 as well as long term factors from 1970-2008. Long term demand factors
included strong growth in demand as a result of increasing population, rapid economic growth
and rising per capita meat consumption, whereas long term supply factors included slowing
growth in agricultural production. Short term demand factors include declining demand for
stocks of food commodities, rapid expansion of biofuels production, dollar devaluation large

16
foreign exchange reserves, aggressive purchases by importers, and importer policies. Short term
supply factors include escalating crude oil prices, rising farm production costs, adverse weather
and exporter policies.
The first objective of this paper is to examine the differences in mean and variance price
levels of organic and conventional corn, soybeans, wheat, oats, and barley, and how price
volatility has changed over time. The difference in mean price for organic and conventional
commodities that the farmer receives represents the premium organic agricultural producers can
expect from growing organic commodities. The difference in variance reflects relative price risk
for organic versus conventional commodity producers. It is expected that if the organic premium
is large enough, producers would be compensated for relatively higher production risk levels and
thus will consider organic production. However, if there is significant price risk associated with
organic crops, it may deter investment in organic production methods.
Three key existing studies that measure differences between organic and conventional
commodity prices were reviewed to provide guidance for our study approach. Bertramsen and
Dobbs (2009) compared prices for organic and conventional grains and soybeans in the Northern
Great Plains and Upper Midwest from 1995 to 2000. The data used in their study was retrieved
from the Organic Food Business News Commodity Fax Service and NASS. Price comparisons
were based on monthly figures and were presented using line charts and ratios. Their study found
that organic price premiums for soybeans were higher on a percentage basis than that of corn,
wheat, and oats over those six years. Organic soybean premium was 217 percent of the
conventional soybean price in 1999, but they found that organic soybeans prices fell by 27
percent versus a 22-23 percent decline in conventional prices between 1998 and 2000.
Bertramsen and Dobbs (2009) found that the ratios of organic to conventional corn prices rose

17
continuously through 1999. Organic to conventional ratios of wheat prices increased almost
every year between 1995 and 2000 as organic prices declined at a slower rate than that of
conventional prices. The authors found that, on average, organic wheat prices were $2.60/bushel
and $2.90/bushel higher than conventional in 1999 and 2000, respectively. For oats, there was a
consistent price premium from 1995-1998, but a lower premium in 1999 and 2000 as organic oat
prices declined proportionally more than conventional. Despite this decline in organic prices, the
authors found that organic oat prices were 71 percent higher than the conventional price in 2000.
Lastly, this study concluded that price variation is likely to be greater for organic farmers.
A second study by Su et al. (2013) looked at the price differences and variation between
organic and conventionally produced milk. The authors found that organic milk prices were more
stable year round and increased every year as compared to conventional milk prices, which
varied within the year and between years. The same study analyzed annual percentage price
change from the previous year between 1990 and 2012, and concluded that organic price
increased less than 10 percent each year whereas conventional milk price change was from -20 to
51 percent. The range for organic milk annual price change was between negative four percent to
10 percent, versus a range of negative 23 percent to 52 percent change for conventional milk
prices. Similarly, the price changes for 2004 to 2012 were broader for conventional milk,
ranging from negative 14 to 16 percent as compared to organic milk, ranging from negative 10 to
12 percent. Volatility in milk prices was also estimated with coefficients of variation (CV) using
data from Gilbert and Morgan (2011). Their estimations show that the overall CV from 2004 to
2012 was 11 percent for organic milk versus 18 percent for conventional milk. Furthermore,
annual CV ranged between two and six percent for organic as compared to three and 16 percent
for conventional milk, suggesting that organic milk prices were more stable. Premiums for

18
organic milk were present most of the time, and were cited as a result of higher costs of
production, increasing demand of organic milk and organic milk consumers’ higher willingness
to pay. Seasonality patterns, although similar between organic and conventional milk production,
were also analyzed as key determinants of the organic premium in their paper.
Singerman, Lence and Kimble-Evans (2013), sought to understand the price relationships
between organic and conventional corn and soybeans. Their research was a follow up to a study
by Born (2005) that found that prices for organic grains and oilseeds were double that of
conventional prices between 1995 and 2003, a commonly held belief in organic agriculture
today. Singerman, Lence, and Kimble-Evans (2013) argue organic prices are expected to follow
the conventional market because of the thinness of the organic markets as well as the low share
of organic cropland. In their analysis, they looked at weekly organic and conventional corn and
soybean prices in six different markets between 2003 and 2009 from the Rodale Institute. Their
findings show that the average ratios for corn were above the doubling threshold, whereas
soybean ratios were more closely aligned with the doubling threshold. The authors argue that
consumers’ preferences, additional risks and higher costs associated with organic agriculture are
likely behind the premiums found. Their results suggested that prices of organic corn and
soybeans are just as volatile as that of their conventional counterparts, with no significant
difference between the coefficients of variation. Part I of this study will expand and update this
literature by examining the mean, standard deviation, and coefficient of variation of prices of
organic and conventional corn, soybeans, wheat, oats, and barley in the United States. This will
also include analyzing how the volatility has varied between 2007 and 2015. Part II of this study
seeks to identify major factors that influence the organic premiums.

19
Key Factors Affecting Organic Premiums
A review of existing research on the organic market reveals many studies focused on
consumer demand and willingness to pay for organic food products. This body of literature
includes purchasing behavior and consumer preferences that contributed to the growth of the
organic market and higher organic price levels. Many of these studies included hedonic pricing
models, where an organic claim was treated as a product attribute. For example, Lin et al (2008)
used hedonic models to estimate premiums for five fresh fruits and five fresh vegetables. They
used 2005 Homescan data and found varying retail premiums from 15 percent for organic carrots
to 60 percent for organic potatoes.
On the farm and wholesale level, Oberholtzer, Dimitri, and Greene (2005) evaluated
prices for broccoli, carrots, and mesclun mix between 2000 and 2004. They found retail
premiums for organic broccoli to be around 223 percent and 202 percent for organic carrots at
their highest. There have also been some studies that undertake a second-stage analysis to
explain these premiums. For example, Jaenicke and Carlson (2015), evaluated a series of factors
impacting the retail premiums for soup, coffee, milk, and bagged carrots. The analyzed factors
include marketing costs, producer electricity cost, agricultural chemicals producer price index,
U.S. population, category sales, yearly time trend, and expenditure share. They found that the
organic prices were less sensitive to marketing and electricity costs than nonorganic prices. The
agricultural chemical producer price index, U.S. population, category sales, yearly time trend,
and expenditure share variables were found to not be significant.
Previous literature focused on explaining the growth of the organic market as a function
of consumer preferences and income. Fromartz (2006) noted that organic purchases were not
significantly influenced by income, as people place more value on attributes of organic foods
20
such as pesticide free and environmentally friendly. However, a study by Smith et al (2009)
found a positive income effect for organic fresh fruits and vegetables. Therefore, it is
hypothesized that while income may have an effect on consumption, there may be other
variables that account for these differences in the organic food categories. These variables are
likely outside of the context of consumer preferences and willingness to pay, as we see that
grains, milk, and meat have been graining interest and traction; yet, these markets are yet to be
fully served by organic producers (Greene, 2013).
Park and Lohr (1996) evaluated supply and demand factors for organic fresh produce.
They estimated a system of reduced form equations to evaluate supply and demand factors that
influence the farm price and quantity in wholesale markets for organic broccoli, carrots, and
lettuce. Supply effects included conventional farm price, seasonal effects, and weather. On the
other hand, the selected demand effects were wholesaling costs, whether or not the product was a
part of the NutriClean program, personal income, and wholesale price margin. They found that
personal income had a positive and significant effect for quantity of broccoli and lettuce at
equilibrium. The conventional farm price had a negative and significant effect for all three
organic products, and the wholesale margin had positive and significant effects on organic
broccoli and organic carrot equilibrium quantities. On the price side, conventional farm price had
a positive and significant effect on organic broccoli prices, whereas wholesaling costs had a
negative and significant effect on all three product prices.
A study by Lakner, Ihle, and Wurriehausen (2015) evaluated the producer price
relationships between organic and conventional wheat in Germany. They evaluated several
fundamental changes that affect this relationship, including the strong growth of the organic
market, the increasing marketing of organics by supermarket chains, and the international food

21
price crisis. They note that the interlinkages in production and marketing of organic and
conventional food sectors are not symmetric because of the institutional frameworks that protect
the organic market. They utilized a novel asymmetric Markov-switching VECM to quantify
changes of market dynamics and asymmetric price changes. Their results show that both prices
are pushed downward if the organic premium over conventional is too high. They also found that
the disequilibria during fundamental changes are twice as strong on organic prices as they are on
conventional ones. Therefore, they conclude that asymmetry is important in the interactions of
the prices of organic and conventional prices.
They also note that post 2006, world market prices, as measured by the FAO food price
index were transmitted to the organic wheat price in Germany since it is closely related to
conventional wheat prices. This suggests that world market events are more strongly transmitted
to domestic organic prices since they are not as integrated worldwide as conventional wheat
prices. They concluded that the growth of the organic market and its price effects will induce
downward pressure on organic prices, which will increase consumption, and further intensify its
interaction with conventional wheat prices.
Organic and conventional corn and soybeans are grown in similar regions, and thus
confront similar production shocks, but the demand side fluctuations can be different, given the
different market outlets for organic versus conventional commodities (Wurriehausen, Ihle, and
Lakner, 2015; Adjemian, Saitone, and Sexton, 2016). In a recent study, Ajemian, Saitone, and
Sexton (2016) noted that organic and conventional prices can fluctuate independently but organic
prices will have a lower bound equal to that of the conventional commodities and can be sold in
the conventional market. They noted fluctuations away from this lower bound were due to
unique demand shocks and producers’ inability to arbitrage due to the transition period of

22
organic production. They also noted producers’ lack of incentive to arbitrage as long as there is a
positive organic premium. In addition, the authors suggested that a consistent organic premium
would be an indicator of a modern agricultural market where producers are compensated for the
higher costs, lower yields, and higher risks that typically characterize organic production.
However, because the organic markets are still thinly traded, this organic premium fluctuated
and did not appear to reward producers for accepting higher risk production practices.
To explain the fluctuations in premiums, Ajemian, Saitone, and Sexton (2016) suggested
that organic soybeans are not as easily substituted in usage as they are a major source of protein
for livestock producers, therefore organic soybeans is closer to transitioning to a modern
agricultural market status with a consistent premium. For corn, they note the premium may not
be as consistent because corn acts a carbohydrate, and is more easily substituted with wheat or
barley. Therefore, organic corn farmers are more subject to fluctuation in the prices they receive
as a result of changing organic premiums based on changing supply conditions and competing
products within this thin-market, where there a limited number of buyers and sellers.
Therefore, organic grain and oilseed price premiums may act as an incentive in
encouraging conventional producers to switch to organic production, as they face increased costs
in certain inputs and a transition period where they are operating as organic, but without earning
the premiums. Previous literature on organic product premiums shows that premiums may be
affected by the following: consumer preferences, organic labels, marketing costs, producer
electricity costs, personal income, conventional farm prices, seasonal effects, weather, wholesale
price margin, wholesale costs, and the FAO cereal index. Therefore, Part II of this paper will
explain patterns and factors that affect changes in organic grain and oilseed price premiums.

23
Part I.
Differences in Organic and Conventional Price Levels and Volatility
In Part I, we seek to address the following two hypotheses:
1) H10: �̅�𝑜 = �̅�𝑐 H1A: �̅�𝑜 ≠ �̅�𝑐
Previous literature has compared the means of organic and conventional prices in order to
determine if there is a premium received for organic commodities. Therefore, we
hypothesize that the mean organic price is different than the mean conventional price.
2) H20: 𝜎𝑜 = 𝜎𝑐 H2A: 𝜎𝑜 ≠ 𝜎𝑐
Previous literature has also compared standard deviations of organic and conventional
prices to determine if the volatility in prices is the same. Therefore, we hypothesize that
the standard deviation in prices for organic commodities are different than that of
conventional, and thus are more or less volatile than conventional prices.

24
Description of Data and Methods
Organic and conventional price data for corn, soybeans, wheat, oats, and barley used in
this analysis were obtained from four main sources: Mercaris, a market data service and online
trading platform for organic, non-GMO, and certified agricultural commodities; USDA
Agricultural Marketing Service Custom Search; USDA National Organic Grain and Feedstuffs
Biweekly Reports; and the USDA Economic Research Service Yearbook Tables. Mercaris’
organic feed corn, soybean, and wheat prices are national average farm-gate prices provided by
the USDA. Conventional corn and soybean prices are Chicago Board of Trade corn and soybean
futures prices recorded by Mercaris. Organic wheat, oats, and barley prices were obtained from
the USDA Market News National Organic Grain and Feedstuffs Biweekly Report, which report
negotiated spot market prices, FOB farm. Conventional wheat, oat, and barley prices were
obtained through the USDA ERS Feed Grains Yearbook Tables Database and were reported as
monthly feed grade FOB prices.
Biweekly data for corn and soybeans were available from 4/14/2007 through 12/26/2015,
whereas biweekly wheat data was available through 10/03/2015. Barley and oats had the least
availability of monthly prices with barley data from 08/01/2008 through 08/31/2015, and oat data
from 03/01/2008 through 09/30/2015. Because barley and oats were only available on a monthly
frequency, biweekly prices for corn, soybeans, and wheat were averaged into monthly
observations. To correct for any missing observations within the above time periods, an estimate
was generated by averaging the price in the month before and a month after the missing
observation. This was done for two, one, nine, eleven, and twelve observations in the corn,
soybean, wheat, barley, and oat data sets, respectively. When there were consecutive months
missing, in the case of wheat, those monthly observations were not included.

25
Descriptive statistics, including standard deviation, mean, median, minimum, and
maximum values, were calculated for each of the five commodities and their organic
counterparts to understand how prices of organic and conventional corn, soybeans, wheat, oats,
and barley have varied from 2007 through 2015. Then, the coefficient of variation was calculated
by dividing the standard deviation by the mean, as shown in Equation 1.
(1)
𝐶𝑉 =𝑠𝑡𝑎𝑛𝑑𝑎𝑟𝑑 𝑑𝑒𝑣𝑖𝑎𝑡𝑖𝑜𝑛
𝑚𝑒𝑎𝑛=
√∑ (𝑃𝑖 − �̅�)2𝑛
𝑖=1
𝑛
�̅�
Additionally, the corrected coefficient of variation was calculated where R2 comes from a
regression of the price on a linear trend, as seen in Equation 2.
(2)
𝑪𝑪𝑽 = 𝑪𝑽√(𝟏 − 𝑹𝟐)
The coefficient of variation was chosen as the measure to compare price volatility since
organic and conventional commodities have different price levels and thus different means. The
coefficient of variation can be interpreted as the relative dispersion of prices from the mean and
is more representative than comparing the standard deviation (Brown, 1998). Therefore, a higher
value is interpreted as a higher volatility, in percentage terms.
Discussion of Results
The price level differences are easily seen when historical prices are plotted graphically,
as illustrated in Figures 7-11 below. Organic price levels were substantially higher than
conventional price levels in most years for all grains. For the entire time period, organic corn and
soybeans had an average premium ratio of 2.09 and 1.85, respectively, as compared to

26
conventional. Organic wheat, barley, and oats had an average premium ratio of 1.54, 1.55, and
1.63 respectively, as compared to their conventional counterparts.
Figure 7. U.S. Organic and Conventional Corn Prices ($/bushel) 2007-2015
Source: Mercaris & USDA
Figure 8. U.S. Organic and Conventional Soybean Prices ($/bushel) 2007-2015
Source: Mecaris & USDA
0
5
10
15
20
4/1/
2007
8/1/
2007
12/1
/200
7
4/1/
2008
8/1/
2008
12/1
/200
8
4/1/
2009
8/1/
2009
12/1
/200
9
4/1/
2010
8/1/
2010
12/1
/201
0
4/1/
2011
8/1/
2011
12/1
/201
1
4/1/
2012
8/1/
2012
12/1
/201
2
4/1/
2013
8/1/
2013
12/1
/201
3
4/1/
2014
8/1/
2014
12/1
/201
4
4/1/
2015
8/1/
2015
12/1
/201
5
Corn Prices per Bushel $
Organic $ Conventional $
05
101520253035
4/1/
2007
8/1/
2007
12/1
/20
07
4/1/
2008
8/1/
2008
12/1
/20
08
4/1/
2009
8/1/
2009
12/1
/20
09
4/1/
2010
8/1/
2010
12/1
/201
0
4/1/
2011
8/1/
2011
12/1
/20
11
4/1/
2012
8/1/
2012
12/1
/20
12
4/1/
2013
8/1/
2013
12/1
/20
13
4/1/
2014
8/1/
2014
12/1
/20
14
4/1/
2015
8/1/
2015
12/1
/20
15
Soybean Prices per Bushel $
Organic Conventional

27
Figure 9. U.S. Organic and Conventional Wheat Prices ($/bushel) 2007-2015
Source: Mercaris & USDA
Figure 10. U.S. Organic and Conventional Corn Prices ($/bushel) 2008-2015
Source: Mercaris & USDA
0
5
10
15
20
25
4/1/
2007
8/1/
2007
12/1
/200
7
4/1/
2008
8/1/
2008
12/1
/200
8
4/1/
2009
8/1/
2009
12/1
/200
9
4/1/
2010
8/1/
2010
12/1
/201
0
4/1/
2011
8/1/
2011
12/1
/201
1
4/1/
2012
8/1/
2012
12/1
/201
2
4/1/
2013
8/1/
2013
12/1
/201
3
4/1/
2014
8/1/
2014
12/1
/201
4
4/1/
2015
8/1/
2015
Wheat Prices per Bushel $
Organic Conventional
0
1
2
3
4
5
6
7
8
Mar
-08
Jun
-08
Sep
-08
De
c-0
8
Mar
-09
Jun
-09
Sep
-09
De
c-0
9
Mar
-10
Jun-
10
Sep
-10
Dec
-10
Mar
-11
Jun-
11
Sep
-11
De
c-1
1
Mar
-12
Jun
-12
Sep
-12
De
c-1
2
Mar
-13
Jun
-13
Sep
-13
De
c-1
3
Mar
-14
Jun
-14
Sep
-14
De
c-1
4
Mar
-15
Jun
-15
Sep
-15
Oat Prices per Bushel $
Conventional Organic

28
Figure 11. U.S. Organic and Conventional Barley Prices ($/bushel) 2008-2015
Source: Mercaris & USDA
The calculated mean, standard deviation, median, range, coefficient of variation and
corrected coefficient of variation for organic and conventional corn, soybeans, wheat, barley and
oats are shown in Table 1. Between 2007 and 2015, the average price of organic corn was $10.42
with a range of prices between $4.70 and $16.33 a bushel. These prices are significantly higher
relative to conventional corn, which averaged $4.96 a bushel and had a minimum price of $3.25
and maximum price of $8.01 a bushel. Soybean price levels were similar in proportion to that of
corn. Average organic soybean price is $21.97 per bushel with a range between $14.40 and
$30.38 a bushel as compared to the average conventional soybean price of $11.86 a bushel and
minimum price of $7.31 and maximum price of $17.23 a bushel.
Organic and conventional prices for wheat, oats, and barley were closer in proportion.
Organic wheat prices averaged at $9.93 with a range of $4.83 and $21.53 a bushel versus
conventional wheat prices at an average of $6.47 with a range between $4.35 and $10.74 a
bushel. Organic barley had a mean price of $8.12 a bushel and a range of prices between $3.47
and $12.66, whereas conventional barley had a mean price of $5.26 a bushel and minimum price
close to that of organic barley at $3.61 but a maximum price only at $6.54. Lastly, organic oats
0
5
10
15
Au
g-0
8
No
v-08
Feb
-09
May
-09
Au
g-0
9
No
v-09
Feb
-10
May
-10
Au
g-1
0
No
v-10
Feb
-11
May
-11
Au
g-1
1
No
v-11
Feb
-12
May
-12
Au
g-1
2
No
v-12
Feb
-13
May
-13
Au
g-1
3
No
v-13
Feb
-14
May
-14
Au
g-1
4
No
v-14
Feb
-15
May
-15
Au
g-1
5
Barley Prices per Bushel $
Conventional Organic

29
had a mean price of $5.18 with a range of prices between $2.84 and $7.25 a bushel.
Conventional oats, on the other hand, had a lower mean at $3.18 a bushel and a smaller range of
prices with a minimum price of $1.82 and maximum price of $4.45 a bushel.
During the periods of analysis, organic corn, soybean, and oat prices appear to be less
volatile than their conventional counterparts with the corrected coefficients of variation at 24, 16
and 18 percent versus 29, 19 and 20 percent, respectively. Similar to the Ajemian, Saitone, and
Sexton (2016) study, we found that organic corn premiums were more subject to price
fluctuations than organic soybean premiums. However, for wheat and barley, the organic prices
appear to be substantially more volatile than the conventional prices at 30 and 26 percent versus
21 and 13 percent, respectively. On average, organic prices were approximately double the
conventional prices for corn and soybeans and 53, 54, and 62 percent higher for wheat, oats, and
barley, respectively.
Table 1: Descriptive statistics of U.S. organic and conventional feed commodity farm gate
prices ($/bushel) 2007-2015 N Mean Standard
Deviation
Median Min Max Coefficient
of Variation*
Corrected Coefficient
of Variation*
Corn Organic 105 10.410 2.899 10.705 4.700 16.330 0.278 0.239
Conventional 105 4.961 1.430 4.305 3.240 8.010 0.288 0.287
Soybeans Organic 105 21.967 4.308 21.995 14.400 30.380 0.196 0.163
Conventional 105 11.855 2.327 11.923 7.305 17.230 0.196 0.192
Wheat Organic 103 9.925 3.088 9.885 4.830 21.530 0.311 0.295
Conventional 103 6.465 1.371 6.335 4.350 10.740 0.212 0.208
Barley Organic 85 8.118 2.349 8.695 3.470 12.660 0.289 0.259
Conventional 85 5.256 0.826 5.340 3.610 6.540 0.157 0.128
Oats Organic 91 5.176 1.139 5.470 2.840 7.250 0.220 0.181
Conventional 91 3.181 0.675 3.280 1.820 4.450 0.212 0.200
Note: The coefficient of variation was calculated by dividing the standard deviation by the mean,
and the corrected coefficient of variation was calculated by multiplying the coefficient of
variation by the square root of one minus the R2 of a regression of the prices against a time trend.

30
However, these organic price premiums appear to have diminished and even disappeared
during 2008-2010 period. This collapse in organic price premiums coincided with the economic
recession that took place between December 2007 and July 2009, according to the National
Bureau of Economic Research (2010). The impact of the recession on organic price premiums
tended to linger for approximately one year, according to the insight provided by USDA, ERS
(Greene, 2015). Due to these factors, the sample was divided into several different subsamples:
pre-recession between 4/2007 and 11/2007, recession from 12/2007 through 7/2010, and post-
recession 8/2010 through 12/2015. These time subsamples were used to analyze differences in
mean and variance of organic and conventional price levels for corn, soybeans, and wheat. For
oats and barley, two subsamples were used: 3/2008 through 7/2010 and 8/2010 through 8/2015
due to data availability limitations. The subsamples are indicated in Figures 7-11 with blue lines.
To test equality of means, the Welch F-test was used. When the homogeneity of
variances assumption is not held, the Welch F-test is recommended to compare the means of
different populations (Welch, 1951). For this test, the null hypothesis is that organic and
conventional prices have equal variances. When the probability is significant at 0.05 or less, then
we reject the null hypothesis and accept the alternative that the means are significantly different.
The Brown-Forsythe Test was used as the primary test of equality in variance. This test of
homogeneity does not assume that all populations are normally distributed and tests whether two
or more populations with different means, in this case organic and conventional prices, have
equal standard deviations (Brown and Forsythe, 1974). The null hypothesis is that organic and
conventional prices have equal variances. Thus, if the p-value is significant at 0.05 or less, we
reject the null hypothesis and the alternative hypothesis is true, where the organic and
conventional prices have different variances. The Brown-Forsythe and Welch tests were chosen

31
as they are recommended to be used together and are extensions of previous statistical tests
(Tabachnick and Fidell, 2007).
As highlighted in Table 2 below, we reject the null hypothesis for all commodities in all
subsamples. This means that the conventional mean prices are significantly different that the
organic mean prices. Pre-recession, organic corn had the largest difference in mean, with an
average premium of 162 percent as compared to the conventional price. Organic soybeans and
wheat had the lowest premium pre-recession at 73 and 22 percent higher than the mean
conventional soybean and wheat price. During the recession, corn only commanded an 86
percent premium whereas soybeans had an 87 percent premium. Wheat, oats, and barley had
organic premiums of 54, 22 and 67 percent, respectively, during the recession. Post-recession,
organic corn had a higher premium than during the recession at 115 percent. Organic soybean
premium remained similar to during the recession at 86 percent and wheat premium increased to
61 percent post-recession. One reason the organic soybean premium did not collapse may be
because there are no clear substitutes for organic soybeans as a source of protein in livestock
feed. Lastly, organic barley premium increased dramatically to 66 percent post-recession and
oats dropped slightly to 61 percent.

32
Table 2. Test for Equality of Mean between Conventional and Organic
Commodity Date Conventional Mean
Organic Mean
Percentage Difference
Welch F-Test
Statistic
P-value
Corn 4/2007-11/2007 3.569 9.381 1.628 110.791 0.000***
12/2007-7/2010 4.291 8.006 0.865 81.346 0.000***
8/2010-12/2015 5.463 11.721 1.145 296.073 0.000***
Soybeans 4/2007-11/2007 8.740 15.119 0.729 189.548 0.000***
12/2007-7/2010 11.011 20.574 0.868 150.499 0.000***
8/2010-12/2015 12.655 23.497 0.856 425.946 0.000***
Wheat 4/2007-11/2007 6.600 8.037 0.217 3.379 0.090*
12/2007-7/2010 6.285 9.666 0.537 16.183 0.002***
8/2010-10/2015 6.541 10.557 0.613 132.394 0.000***
Barley 8/2008-7/2010 4.801 5.836 0.215 8.590 0.009***
8/2010-8/2015 5.436 9.016 0.658 173.048 0.000***
Oats 3/2008-7/2010 2.634 4.390 0.666 66.859 0.000***
8/2010-9/2015 3.438 5.545 0.612 206.534 0.000***
Note: Significance levels of 10, 5, and 1 percent are noted by *, **, and ***, respectively.
As highlighted in Table 3 below, we fail to reject the null hypothesis for soybeans and
wheat in the first subsample, as the Brown-Forsythe test returns p-values of 0.1827 and 0.9449,
respectively. However, in comparing the significance of the Brown-Forsythe test with the
calculated coefficient of variation for this first subsample, there are conflicting results as the CV
for conventional and organic soybeans and wheat are largely different at 13 versus 4 percent and
25 versus 21 percent, respectively. Based on these results, caution should be exerted when
comparing price volatility for soybeans and wheat during the pre-recession period. For all other
commodities and time subsamples, the Brown-Forsythe test indicates that the prices of all
organic commodities and their conventional counterpart had significantly different variances at
the one ad five percent levels.
Using the reported standard deviations and means calculated for each commodity and
their counterparts from the tests of variance, the CV was calculated for each subsample to
compare how the price variation of organic and conventional commodities changed over time.

33
Before the recession, conventional corn was significantly less volatile than organic corn, with a
CV of 6 versus 16 percent. During the recession, all organic crop prices were more volatile, and
a collapse in organic premiums was evident. This is evidenced by the slightly lower CV of
conventional corn, soybeans, and oats at 24, 18, and 22 percent, respectively, relative to organic
corn, soybeans, and oats CV values of 26, 20 and 23 percent, respectively, during 2007-2010.
Conventional wheat and barley had CV of 29 and 12 percent, respectively, while organic wheat
and barley demonstrated much greater CV of 45 and 28 percent, respectively. During the post-
recession period, organic corn and soybeans were significantly less volatile with coefficients of
variation at 22 and 16 percent, respectively, whereas organic wheat, barley, and oats remain
more volatile than their conventional counterparts, but at a much smaller difference than
experienced during the recession, with CV of 23, 22 and 18 percent respectively.
Table 3. Tests for Equality of Variance between Conventional and Organic
Commodity Date Conventional Standard Deviation
Organic Standard Deviation
Percentage Difference
Brown-Forsythe
Test Statistic
Probability Conventional Coefficient
of Variation
Organic Coefficient of
Variation
Corn 4/2007-11/2007 0.224 1.546 5.901 7.978 0.014** 0.062 0.164
12/2007-7/2010 1.031 2.089 1.026 25.702 0.000*** 0.240 0.260
8/2010-12/2015 1.443 2.552 0.768 5.748 0.018** 0.264 0.217
Soybeans 4/2007-11/2007 1.410 0.645 -0.542 1.966 0.182 0.130 0.042
12/2007-7/2010 1.959 3.950 1.016 7.843 0.006*** 0.177 0.198
8/2010-12/2015 2.141 3.654 0.706 9.49 0.002*** 0.169 0.155
Wheat 4/2007-11/2007 1.473 1.649 0.119 0.005 0.944 0.245 0.205
12/2007-7/2010 1.812 4.396 1.426 9.93 0.002*** 0.288 0.454
8/2010-10/2015 1.088 2.402 1.207 24.971 0.000*** 0.166 0.227
Barley 8/2008-7/2010 0.596 1.624 1.724 40.444 0.000*** 0.124 0.278
8/2010-8/2015 0.839 1.953 1.327 16.379 0.000*** 0.154 0.216
Oats 3/2008-7/2010 0.577 1.002 0.736 13.776 0.001*** 0.219 0.228
8/2010-9/2015 0.557 1.011 0.815 7.643 0.007*** 0.162 0.182
Note: Significance levels of 10, 5, and 1 percent are noted by *, **, and ***, respectively.

34
In conclusion, we have documented that there are significant differences in means and
variances for all the commodities in a majority of all subsamples. Specifically, we see a
narrowing of mean prices between organic and conventional commodities during the recession
subsample. Therefore, it appears that organic prices are sensitive to US macroeconomic
conditions. Furthermore, we conclude that organic corn and soybeans are actually less volatile
post-recession, which may explain why more producers have entered into corn and soybean
production over oats, barley and wheat.

35
Part II.
Understanding Organic Price Premiums
Based on the findings in Part I, further analysis was conducted to better understand and
explain factors that may influence organic commodity price premiums. This section begins with
a discussion of the key variables followed by the descriptive statistics of those variables, a
description of the model and relevant tests, and finally, its estimation and a discussion of
empirical results.
Model Development and Data
In reviewing the literature, previous studies on the organic premiums suggest, and in
some cases found, that premiums are affected by the following: consumer preferences, organic
labels, marketing costs, producer electricity costs, personal income, wholesale margin
conventional farm prices, seasonal effects, weather, time, conventional prices, and the FAO
cereal index. Therefore, Part II of this paper will utilize these variables as well as expand upon
them to seek to explain patterns and factors that affect changes in organic grain and oilseed price
premiums.
Our dependent variable, the organic premium, is the dollar difference between organic
and conventional price. While consumer preferences have been a valuable factor in explaining
organic premiums, this study seeks to explain the premium that raw commodity producers
receive when selling their crops as inputs rather than retail goods. Therefore, the consumer
preferences variables and marketing costs are unobserved and not included in our model.
Organic labels are often included as a dummy variable in previous models. However,
since our study focuses on grain and oilseed commodities, sold to livestock producers or food

36
processors, the label does not directly apply, but rather the organic certification. The value of
certified organic is captured in this study due to the nature of our organic price data, which is for
USDA organic certified corn, soybeans, wheat, oats, and barley only.
Also due to the nature of the organic certification and the previously discussed transition
period from conventional to organic, we include lagged premiums. The premium of organic
prices over conventional were lagged 1, 2, and 3 years respectively and included as independent
variables to measure the relationship between previous year’s prices and production decisions by
farmers. This was important to consider as organic production takes 3 years to transition and new
organic acreage will enter into the market each year as they become certified. Furthermore, the
lagged premiums stand in somewhat similar the wholesale margin variable included in other
studies. It is hypothesized that the lagged premiums will have a negative effect on the current
premium, as more producers enter the market to capture the premium, more supply is available,
thus decreasing organic prices and organic premiums, respectively.
Previous studies included producer electricity costs. This was due to the fact that those
studies evaluated organic premiums for fruit and vegetables, which can be grown in greenhouses.
However, because our study is looking at grains and soybeans, which require much more land
and fuel, we include monthly oil prices as a reflection of producer cost. As described in the
introduction, organic production is shown to have higher fuel input costs, which is affected by
the price of oil. Thus it is hypothesized that an increase in the price of oil will have a positive
effect on the premium. However, this effect may be minimized by the effect of higher oil prices
on conventional producers, because conventional producers use petroleum-based chemical
fertilizers and pesticides. Thus increased oil prices will result in increased conventional crop
prices, thus reducing the organic premium. Lastly, oil prices and ethanol production are related

37
for corn, as the need for corn to produce much larger quantities of ethanol has inflated
conventional corn prices (Luchansky and Monks, 2009). When oil prices are higher, more corn
will go to ethanol production, resulting in higher conventional corn prices, again narrowing the
gap between organic and conventional prices. Oil prices used in the model are historical monthly
crude oil spot prices reported by the U.S. Energy Information Administration. Monthly oil prices
were also lagged six months to account for the grain production time. Therefore, oil prices are
expected to have either a positive or negative effect on organic premiums, depending on if
organic input costs, or conventional costs and demand for ethanol are demonstrated to have a
greater effect.
Other studies included personal income and found mixed results with either income
having no significant effect on organic premiums, or a positive effect, suggesting that as income
increases, so does the willingness to pay a premium for organic foods. Further, as analyzed in
Part I, the recession appears to have had an effect on organic prices, and thus our model includes
personal income as an independent variable to examine if economic conditions have an effect on
organic premiums for corn, soybeans, wheat, oats, and barley. Monthly personal income data
was obtained from the Bureau of Economic Insights and is measured in billions of dollars and
months are seasonally adjusted at annual rates. This was important to include in order to test
whether there is a relationship between income and higher organic prices, since organic goods
historically are more expensive than conventional. Personal income values were lagged one
month to allow for changes in income to be reflected the following month within the markets.
While seasonality and weather were proposed variables in previous studies, we found in
preliminary analysis seasonality demonstrated little significance in influencing organic
premiums. This is likely due to the fact that both organic and conventional crops face similar
38
production and harvest cycles and would be impacted by weather the same, as they are usually
grown in the same regions. A time trend, however, is included via a dummy variable to help
interpret how the premium has changed over time. Furthermore, including the time trend variable
will help explain results in Part I.
Because this part of the study seeks to explain the organic premium, and not just price
levels, we do not include conventional price as another study did, because of the issue of
endogeneity. Endogeneity is the result of a correlation between an independent variable and the
error term (Sorensen, 2012). This becomes an issue because we choose to use an OLS regression
and a major assumption of this technique is that the independent variables are uncorrelated with
the error terms (Aaron, 2005). Therefore, it is expected that because our dependent variable, the
organic premium, and conventional price are jointly determined, there would be an endogeneity
issue, resulting in correlation with the error term if we were to use conventional price as an
explanatory variable. Instead, we use the world cereal index, as recorded by the Food and
Agriculture Organization (FAO), as an instrument for the conventional price. This cereal index is
a proxy of price developments of international grain markets, which would influence the
conventional grain price, given its interconnectedness with the global markets, a characteristic
that organic grains do not have at this time. The FAO cereals price index was included as a
monthly variable and is reported as a percentage with the base years of 2002-2004 equal to 100.
We expect that a one percent increase in the FAO world cereal price index will result in a
decrease in organic premium, as the conventional grain price will increase, narrowing the gap
between organic and conventional, since organic prices do not appear to be directly influenced
by global markets because of limited trade of organic grains and soybeans, as compared to
conventional.

39
The resulting model used to estimate the organic premium is illustrated in
Equation 3 below and was estimated using an OLS method.
(3)
𝑃𝑜𝑡− 𝑃𝑐𝑡
= 𝛼0 + 𝛼1(𝑃𝑜𝑡−12− 𝑃𝑐𝑡−12
) + 𝛼2(𝑃𝑜𝑡−24− 𝑃𝑐𝑡−24
) + 𝛼3(𝑃𝑜𝑡−36− 𝑃𝑐𝑡−36
) + 𝑎4(𝑇𝑖𝑚𝑒)
+ 𝛼5(𝑃𝑟𝑖𝑐𝑒 𝑜𝑓 𝑂𝑖𝑙𝑡−6) + 𝑎6(𝑃𝑒𝑟𝑠𝑜𝑛𝑎𝑙 𝐼𝑛𝑐𝑜𝑚𝑒𝑡−1) + 𝛼7(𝐹𝐴𝑂 𝐶𝑒𝑟𝑒𝑎𝑙 𝐼𝑛𝑑𝑒𝑥)
Lastly, as mentioned in the introduction, there have been increasing numbers of organic
imports because of the slow growth in domestic supply of organic grains. Since 2011, the
Foreign Agricultural Service has reported organic imports for soybeans and wheat and since
2013, has reported organic imports for corn. Due to the data limitations, we decided to estimate
our model again, but as a case study for soybeans and wheat between January 2011 and
December 2015 and corn between July 2013 and December 2015. Organic imports were
included as a monthly variable and as a proportion of total imports, both organic and
conventional, for each commodity. We expect that as organic imports increase in volume, the
U.S. organic premium will decrease.

40
Description of Data
Descriptive statistics were calculated for the premiums of each of the five commodities as
well as independent variables, personal income and oil (Table 4).
Table 4. Descriptive Statistics of Dependent and Independent Variables
Mean Standard
Deviation
Median Min Max Coefficient
of Variation
Corrected
Coefficient
of Variation
Corn Premium 5.448 2.481 5.996 -0.155 10.140 0.455 0.381
Soybean Premium 10.112 3.481 10.700 3.043 16.900 0.344 0.285
Wheat Premium 3.513 2.764 3.477 -1.500 13.815 0.787 0.703
Barley Premium 2.861 1.727 2.995 -0.530 7.220 0.603 0.499
Oat Premium 1.995 0.824 1.980 -0.020 3.550 0.413 0.354
Oil Price 83.118 21.341 86.186 37.186 133.880 0.257 0.255
Personal Income
(Billions)
13418.420 1137.449 13345.90 11925.50 15648.00 0.085 0.0264
FAO Cereal Index 201.089 36.445 195.040 141.021 267.690 0.181 0.181
On average, corn premiums were $5.44 a bushel as compared to $10.11 a bushel for
soybeans, $3.51 a bushel for wheat, $2.86 a bushel for barley, and $1.99 a bushel for oats. These
premiums had a wide range and were even negative, with conventional commending a higher
price than organic for corn, wheat, and oats, for at least one month, most likely during the
recession. Organic premiums for the five commodities are highly variable at 38 percent for corn,
28 percent for soybeans, 70 percent for wheat, 50 percent for barley, and 35 percent for oats.
Two of the key independent variables used to explain this variation include oil price, which has a
CV of 26 percent and personal income, with a CV of 3 percent.
In looking at graphs of our variables, as seen in Figures 12-19 below, it appears that the
data is not stationary. A stationary time series would consist of a constant mean and variance,
over time, and this is important to have, because stationaries series are more easily interpreted
and provide more meaningful insight (Nau, 2016).

41
Figure 12: U.S. Organic Corn Premium ($/bushel) 2007-2015
Source: Mercaris & USDA
Figure 13: U.S. Organic Soybean Premium ($/bushel) 2007-2015
Source: Mercaris & USDA
-2
0
2
4
6
8
10
12D
ate
6/1/
2007
9/1/
2007
12
/1/2
00
7
3/1/
2008
6/1/
2008
9/1/
2008
12
/1/2
00
8
3/1/
2009
6/1/
2009
9/1/
2009
12
/1/2
00
9
3/1/
2010
6/1/
2010
9/1/
2010
12
/1/2
01
0
3/1/
2011
6/1/
2011
9/1/
2011
12
/1/2
01
1
3/1/
2012
6/1/
2012
9/1/
2012
12
/1/2
01
2
3/1/
2013
6/1/
2013
9/1/
2013
12
/1/2
01
3
3/1/
2014
6/1/
2014
9/1/
2014
12
/1/2
01
4
3/1/
2015
6/1/
2015
9/1/
2015
Corn Premium
02468
1012141618
Dat
e
6/1/
200
7
9/1/
200
7
12/1
/200
7
3/1/
2008
6/1/
200
8
9/1/
200
8
12/1
/200
8
3/1/
2009
6/1/
200
9
9/1/
200
9
12/1
/200
9
3/1/
201
0
6/1/
201
0
9/1/
201
0
12/1
/201
0
3/1/
201
1
6/1/
201
1
9/1/
201
1
12/1
/201
1
3/1/
201
2
6/1/
201
2
9/1/
201
2
12/1
/201
2
3/1/
201
3
6/1/
201
3
9/1/
201
3
12/1
/201
3
3/1/
201
4
6/1/
201
4
9/1/
201
4
12/1
/201
4
3/1/
201
5
6/1/
201
5
9/1/
201
5
Soybeans Premium

42
Figure 14: U.S. Organic Wheat Premium ($/bushel) 2007-2015
Source: Mercaris & USDA
Figure 15: U.S. Organic Oat Premium ($/bushel) 2008-2015
Source: Mercaris & USDA
-5
0
5
10
15
Dat
e
6/1/
2007
9/1/
2007
12/1
/200
7
3/1/
2008
6/1/
2008
9/1/
2008
12/1
/200
8
3/1/
2009
6/1/
2009
9/1/
2009
12/1
/200
9
3/1/
2010
6/1/
2010
9/1/
2010
12/1
/201
0
3/1/
2011
6/1/
2011
9/1/
2011
12/1
/201
1
3/1/
2012
6/1/
2012
9/1/
2012
12/1
/201
2
3/1/
2013
6/1/
2013
9/1/
2013
12/1
/201
3
3/1/
2014
6/1/
2014
9/1/
2014
12/1
/201
4
3/1/
2015
6/1/
2015
9/1/
2015
Wheat Premium
-0.50
0.51
1.52
2.53
3.54
Dat
e
6/1/
2007
9/1
/200
7
12/1
/200
7
3/1
/200
8
6/1
/200
8
9/1
/200
8
12/1
/200
8
3/1
/200
9
6/1
/200
9
9/1
/200
9
12/1
/200
9
3/1
/201
0
6/1
/201
0
9/1
/201
0
12/1
/201
0
3/1
/201
1
6/1
/201
1
9/1
/201
1
12/1
/201
1
3/1/
2012
6/1
/201
2
9/1
/201
2
12/1
/201
2
3/1
/201
3
6/1
/201
3
9/1
/201
3
12/1
/201
3
3/1
/201
4
6/1/
2014
9/1/
2014
12/1
/201
4
3/1
/201
5
6/1
/201
5
Oat Premium

43
Figure 16: U.S. Organic Barley Premium ($/bushel) 2008-2015
Source: Mercaris & USDA
Figure 17: U.S. Personal Income in Billons of Dollars 2007-2015
Source: Mercaris & USDA
-10
123456
78
Dat
e
6/1/
2007
9/1/
2007
12
/1/2
00
7
3/1/
2008
6/1/
2008
9/1/
2008
12
/1/2
00
8
3/1/
2009
6/1/
2009
9/1/
2009
12
/1/2
00
9
3/1/
2010
6/1/
2010
9/1/
2010
12
/1/2
01
0
3/1/
2011
6/1/
2011
9/1/
2011
12
/1/2
01
1
3/1/
2012
6/1/
2012
9/1/
2012
12
/1/2
01
2
3/1/
2013
6/1/
2013
9/1/
2013
12
/1/2
01
3
3/1/
2014
6/1/
2014
9/1/
2014
12
/1/2
01
4
3/1/
2015
6/1/
2015
Barley Premium
10000
12000
14000
16000
Dat
e
6/1/
2007
9/1/
2007
12/1
/200
7
3/1/
2008
6/1/
2008
9/1/
2008
12/1
/200
8
3/1/
2009
6/1/
2009
9/1/
2009
12/1
/200
9
3/1/
2010
6/1/
2010
9/1/
2010
12/1
/201
0
3/1/
2011
6/1/
2011
9/1/
2011
12/1
/201
1
3/1/
2012
6/1/
2012
9/1/
2012
12/1
/201
2
3/1/
2013
6/1/
2013
9/1/
2013
12/1
/201
3
3/1/
2014
6/1/
2014
9/1/
2014
12/1
/201
4
3/1/
2015
6/1/
2015
9/1/
2015
Personal Income, Billions of Dollars

44
Figure 18: Monthly Crude Oil Spot Prices as Reported by the U.S. Energy
Information Administration, 2007-2015.
Source: Mercaris & USDA
Figure 19: FAO World Cereal Index with 2002-2004=100
Source: Mercaris & USDA
0
20
40
60
80
100
120
140
160D
ate
6/1/
2007
9/1/
2007
12/1
/200
7
3/1/
2008
6/1/
2008
9/1/
2008
12/1
/200
8
3/1/
2009
6/1/
2009
9/1/
2009
12/1
/200
9
3/1/
2010
6/1/
2010
9/1/
2010
12/1
/201
0
3/1/
2011
6/1/
2011
9/1/
2011
12/1
/201
1
3/1/
2012
6/1/
2012
9/1/
2012
12/1
/201
2
3/1/
2013
6/1/
2013
9/1/
2013
12/1
/201
3
3/1/
2014
6/1/
2014
9/1/
2014
12/1
/201
4
3/1/
2015
6/1/
2015
9/1/
2015
Oil $
0
50
100
150
200
250
300
Dat
e
6/1/
2007
9/1/
2007
12/1
/200
7
3/1/
2008
6/1/
2008
9/1/
2008
12/1
/200
8
3/1/
2009
6/1/
2009
9/1/
2009
12/1
/200
9
3/1/
2010
6/1/
2010
9/1/
2010
12/1
/201
0
3/1/
2011
6/1/
2011
9/1/
2011
12/1
/201
1
3/1/
2012
6/1/
2012
9/1/
2012
12/1
/201
2
3/1/
2013
6/1/
2013
9/1/
2013
12/1
/201
3
3/1/
2014
6/1/
2014
9/1/
2014
12/1
/201
4
3/1/
2015
6/1/
2015
9/1/
2015
FAO Cereal Index

45
In order to determine if our data is in fact nonstationary, unit root tests were applied after
running the initial OLS model to identify the stationarity of the data. The null hypothesis for the
Dickey Fuller unit root test is that the statistic for the series does not follow the t-distribution.
However, this test is only valid if the series is an AR(1) process and if the series is correlated at
higher order lags, the Augmented Dickey-Fuller (ADF) test should be used, which was done for
this study (Said and Dickey, 1984). In the ADF test, the null hypothesis that the series has a unit
root and this null hypothesis is rejected if the p-value is less than 0.05. However, if the p-value is
greater than 0.05, then we fail to reject the null hypothesis and the series does indeed have a unit
root and is not stationary. The Phillips-Perron unit root test was also used to test the stationarity.
The Phillips-Perron (PP) test modifies the ADF test statistics by correcting any serial correlation
and heteroscedasticity in the errors (Phillips and Perron, 1988). To transform the data into a
stationary series, the first differences of the data are taken and ADF and PP tests applied again to
test whether the null hypothesis can be rejected. The ADF and PP test statistics for the levels and
first differences of all variables used in the model are reported in Table 5. The results from the
ADF and PP tests indicate that the null hypothesis cannot be rejected for all variables in levels,
but may be rejected when variables are reported using first differences. Therefore, first
differences were used in the model to ensure stationary data and robust results.

46
Table 5: Results of Stationarity Tests using the Augmented Dickey-Fuller (ADF) and
Phillips-Perron (PP) Unit Root Tests both in levels and first differences
ADF Unit Root Test
Results
ADF Unit Root Test
Results for First
Difference
PP Unit Root Test Results PP Unit Root Test
Results for First
Difference
t-statistic p-value t-statistic p-value t-statistic p-value t-statistic p-value
Corn
Premium
-1.957 0.305 -7.609 0.000 -1.693 0.431 -7.525 0.000
Soybean
Premium
-1.519 0.520 -11.698 0.000 -1.807 0.376 -11.584 0.000
Wheat
Premium
-2.697 0.078 -7.658 0.000 -2.767 0.067 -8.935 0.000
Barley
Premium
-1.328 0.612 -9.839 0.000 -2.238 0.195 -13.401 0.000
Oat
Premium
-2.218 0.201 -10.775 0.000 -2.102 0.244 -11.175 0.000
Personal
Income
0.449 0.984 -11.559 0.000 0.698 0.992 -11.599 0.000
Oil -2.542 0.108 -6.089 0.000 -2.137 0.231 -6.089 0.000
FAO
Cereal
Index
-2.332 0.164 -6.491 0.000 -2.359 0.156 -6.673 0.000

47
Results
The results of our model with the coefficient listed first and the p-value below in
parentheses are presented in Table 6.
Table 6: Results from OLS Regression Using Levels
Variable Corn Premium Soybean Premium Wheat Premium Barley Premium Oat Premium
Constant -33.870
(.000)
-31.966
(.002)
-17.465
(.266)
-2.195
(.827)
-10.723
(.056)
Premium Lagged 1 Year
0.061
(.532)
-0.221**
(.042)
0.116
(.549)
-0.101
(.540)
-0.194
(.131)
Premium Lagged 2 Years
-0.387***
(.000)
-0.353***
(.000)
0.155
(.412)
-0.106
(.508)
0.229*
(.069)
Premium Lagged 3 Years
0.107
(.256)
-0.222***
(.006)
-0.028
(.763)
0.077
(.635)
-0.229
(.033)
Time 0.158
(.702)
-0.369
(.479)
1.347*
(.056)
0.322
(.510)
-0.380**
(.036)
Oil Price 0.076***
(.000)
0.033*
(.056)
0.076***
(.001)
-.006
(.672)
0.014**
(.015)
Personal Income 0.002***
(.001)
0.004***
(.000)
0.000
(.884)
0.000
(.969)
0.001***
(.004)
FAO Cereal Index -0.004 -0.046*** 0.014 0.021* -0.0115**
(0.563) (.000) (0.335) (0.057) (.012)
R2 0.863 0.863 0.718 0.166 0.674
Note: Significance levels of 10, 5, and 1 percent are noted by *, **, and ***, respectively.
The OLS model is most useful for explaining corn, soybean, and wheat premiums, with
R2 of 0.86, 0.86, and 0.72, respectively. The model does not work as well for oats and barley, as
it only explains 67 percent of the oat premium variability and 17 percent of the barley premium
variability. As illustrated by the coefficients of the lagged premiums, previous years’ prices have
a negative effect on current premiums for corn and soybeans. This may be explained by more
producers being incentivized to get into production based on previous prices, resulting in more
organic supply in the market, thus driving the premium down. Wheat and barley organic

48
premiums are unaffected by previous year’s prices and organic oat premiums are positively
affected by prices two years ago and negatively affected by prices three years ago. Significant
time trends are present for wheat, with an increase in premiums by $1.34/bushel a year and a
yearly decrease in organic oat premiums by $0.380 per bushel.
With regards to the oil price variable, premiums responded as expected—as the price of
oil used as a production input goes up by $1.00 a barrel, the organic premium increases for corn,
soybeans, wheat, and oats by $0.076, $0.033, $0.076 and $0.014 per bushel, respectively.
Personal income is significant for corn, soybeans, and oats, which is consistent with
previous studies as outlined in the literature review. However, the impact is very minimal, in that
for every one billion dollar increase in national personal income, organic corn, soybeans, and oat
premiums increase by $0.002, 0.004, and 0.001 per bushel, respectively. Wheat and barley
organic premiums do not appear to be significantly affected by personal income. An explanation
for this finding may be due to earlier findings that revealed organic demand is influenced more
heavily by consumer preferences than income levels.
The FAO World Cereal Index has an expected effect on soybean and oat premiums,
decreasing the organic premium by $0.046 and 0.012 per bushel, respectively for every one
percent increase in the world cereal index as compared to the base year of 2002. This is consisted
with what we expected, as the conventional price is likely to increase when the world cereal
index increases, narrowing the gap between organic and conventional prices, thus decreasing the
organic premium.
Based on the unit root test results, the model was recalculated using the first differences
of the premium, lagged premiums, oil prices, and personal income variables. The results are
detailed below in Table 7.
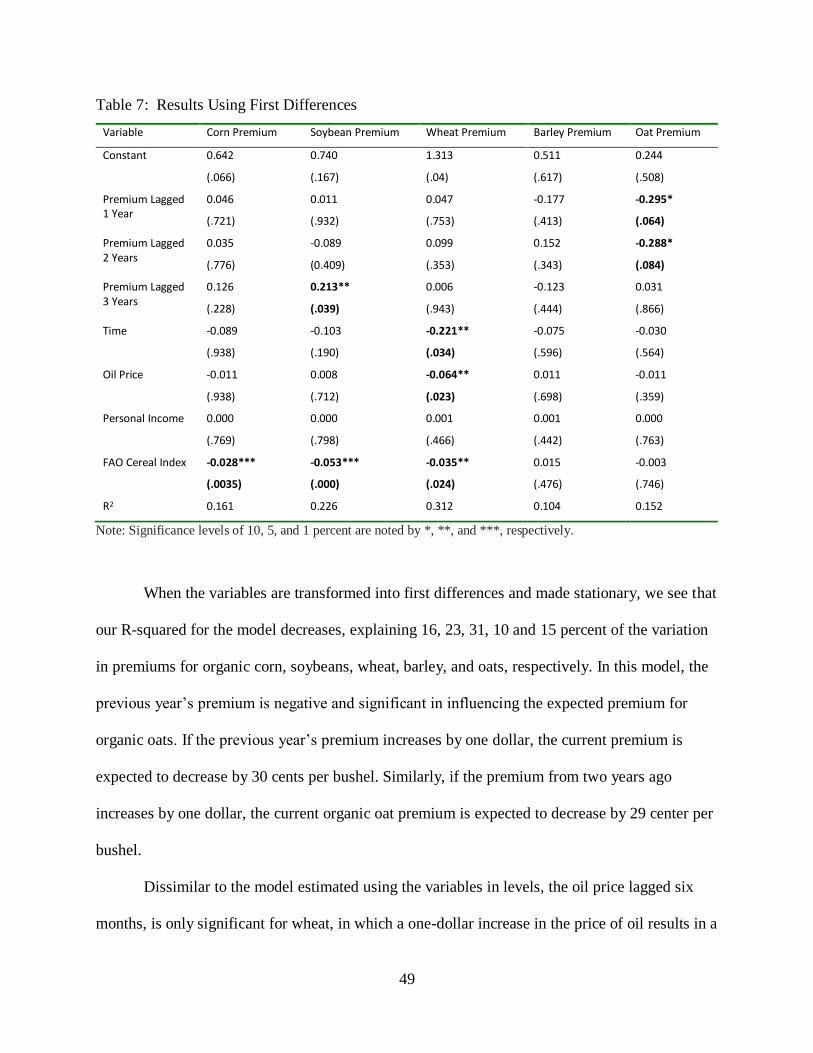
49
Table 7: Results Using First Differences
Variable Corn Premium Soybean Premium Wheat Premium Barley Premium Oat Premium
Constant 0.642
(.066)
0.740
(.167)
1.313
(.04)
0.511
(.617)
0.244
(.508)
Premium Lagged 1 Year
0.046
(.721)
0.011
(.932)
0.047
(.753)
-0.177
(.413)
-0.295*
(.064)
Premium Lagged 2 Years
0.035
(.776)
-0.089
(0.409)
0.099
(.353)
0.152
(.343)
-0.288*
(.084)
Premium Lagged 3 Years
0.126
(.228)
0.213**
(.039)
0.006
(.943)
-0.123
(.444)
0.031
(.866)
Time -0.089
(.938)
-0.103
(.190)
-0.221**
(.034)
-0.075
(.596)
-0.030
(.564)
Oil Price -0.011
(.938)
0.008
(.712)
-0.064**
(.023)
0.011
(.698)
-0.011
(.359)
Personal Income 0.000
(.769)
0.000
(.798)
0.001
(.466)
0.001
(.442)
0.000
(.763)
FAO Cereal Index -0.028***
(.0035)
-0.053***
(.000)
-0.035**
(.024)
0.015
(.476)
-0.003
(.746)
R2 0.161 0.226 0.312 0.104 0.152
Note: Significance levels of 10, 5, and 1 percent are noted by *, **, and ***, respectively.
When the variables are transformed into first differences and made stationary, we see that
our R-squared for the model decreases, explaining 16, 23, 31, 10 and 15 percent of the variation
in premiums for organic corn, soybeans, wheat, barley, and oats, respectively. In this model, the
previous year’s premium is negative and significant in influencing the expected premium for
organic oats. If the previous year’s premium increases by one dollar, the current premium is
expected to decrease by 30 cents per bushel. Similarly, if the premium from two years ago
increases by one dollar, the current organic oat premium is expected to decrease by 29 center per
bushel.
Dissimilar to the model estimated using the variables in levels, the oil price lagged six
months, is only significant for wheat, in which a one-dollar increase in the price of oil results in a

50
decrease in the organic wheat premium by six cents. Personal income is not significant for any of
the commodity premiums. The only significant time trend is for wheat, in which the organic
wheat premium appears to decreasing yearly by 22 cents per bushel.
Because of the low R-squared values and low number of significant variables, it is
hypothesized that the premium may be better explained by factors that are outside the scope of
this study. These factors include production of the organic crops and demand from livestock
producers, however, due to data limitations, these were not able to be included in this study.
Other factors that may explain the organic premium include import and exports. In 2011,
the USDA Foreign Agricultural Service began collecting data on organic imports in their GATS
database. While the number of observations is limited, we decided to run a case study using
available import data for organic and conventional corn, soybeans, wheat, barley, and oats and
export data for conventional corn, soybeans, wheat, barley, and oats, as the export volume of
these organic commodities is negligible. Below are the results from this case study, which
included 30 observations for corn, 60 for soybeans, and 44 for wheat. The organic imports are
included as a proportion of all imports, both conventional and organic, as measured in metric
tons.

51
Table 8: Regression Results in Levels Including Organic Imports
Variable Corn Premium Soybean Premium Wheat Premium
Constant 101.573
(.000)
-41.222
(.002)
-4.245
(.817)
Premium Lagged 1 Year
-0.306
(.133)
-0.234**
(.035)
-0.371
(.141)
Premium Lagged 2 Years
0.433**
(.014)
-0.364***
(0.000)
-0.035
(.881)
Premium Lagged 3 Years
0.652***
(.000)
-0.216**
(.019)
0.097
(.344)
Time 0.983***
(.009)
0.227
(.683)
2.610***
(.003)
Oil Price -0.016
(.343)
0.044**
(.019)
0.054***
(.010)
Personal Income -0.001
(.344)
0.004***
(.000)
-0.001
(.395)
FAO Cereal Index -0.038***
(.006)
-0.021
(.113)
0.011
(.536)
Organic Imports 1.808
(.276)
6.274*
(.069)
132.743
(0.007)
R2 0.877 0.852 0.685
Note: Significance levels of 10, 5, and 1 percent are noted by *, **, and ***, respectively.
When organic imports are included in the model using variables in levels, we see that the
premium lagged one, two, and three years is significant and has a negative effect on organic
soybean premium, as we expected. Different than the model estimated without organic imports,
we see that the time trend is actually positive for wheat and corn. Oil price has a positive and
significant effect on soybeans and wheat, where for every one-dollar increase in the price for a
barrel of oil results in an increase of approximately four cents and five cents per bushel for
organic soybeans and wheat, respectively. Income has a positive and significant influence on
soybeans, where for every one-billion-dollar increase in national personal income, the premium
for organic soybeans increases by $0.004. The FAO cereal index variable is also as we expected

52
for corn with for every one percent increase in the index, the organic corn premium drops by
$0.038. Lastly we see that the proportion of organic imports does not have a significant effect
that makes economic sense.
To be consistent with the first set of results, we also estimate the model including organic
imports, but with all variables first-differenced. These results are illustrated in Table 9 below.
Table 9: OLS Regression Results with Organic Imports Using First Differences
Variable Corn Premium Soybean Premium Wheat Premium
Constant -0.536
(.69)
1.174
(.081)
2.304
(.008)
Premium Lagged 1 Year
-0.183
(.493)
0.016
(.913)
-0.134
(.449)
Premium Lagged 2 Years
0.088
(.670)
-0.033
(0.827)
0.249
(.181)
Premium Lagged 3 Years
0.381**
(.037)
0.249**
(.021)
0.069
(.471)
Time 0.013
(.936)
-0.163*
(.084)
-0.358***
(.007)
Oil Price -0.005
(.829)
0.007
(.777)
-0.065**
(.034)
Personal Income 0.004
(.437)
0.000
(.729)
0.000
(.737)
FAO Cereal Index -0.058**
(.015)
-0.053***
(.002)
-0.025
(.173)
Organic Imports 1.134
(.392)
6.124**
(.014)
16.227
(0.561)
R2 0.416 0.331 0.389
Note: Significance levels of 10, 5, and 1 percent are noted by *, **, and ***, respectively.
When we include organic imports in the model and use first differences to make the data
stationary, we see that the three year lagged premium has the opposite effect than what we
expected, with positive and significant coefficients for organic corn and soybean premiums. We
see that time has a negative effect for soybean and wheat, in that each year, the organic premium

53
is expected to decrease by $0.163 and 0.358, respectively. The significant variable for wheat
makes economic sense in that for every dollar increase in oil price, the premium will decrease by
$0.065, perhaps due to the higher cost of fertilizers and pesticides. The FAO Cereal Index has
the effect we would expect as it is negative, suggesting that as world corn and soybean prices
increase, so does conventional domestic corn and soybean prices, narrowing the gap between
organic and conventional prices, and thus decreasing the organic premium by $0.058 and 0.053
respectively. Similar to the model including imports in levels, we see that organic imports do not
have a significant value that makes economic sense.

54
Conclusions
In part I of this study, we illustrated that there are indeed differences in volatility between
organic and conventional corn, soybeans, wheat, barley, and oats. For years 2007-2015, organic
corn, soybeans, and oat market prices were less volatile, whereas organic wheat and barley
market prices were more volatile than their conventional counterparts. Organic prices collapsed
during the recession and remained low one year following the recession. The volatility of organic
and conventional prices was significantly different pre-, during, and post-recession for all
commodities except soybeans and wheat pre-recession.
In part II of this study, we explored key factors that influence the premium received by
organic corn, soybeans, wheat, barley, and oats using an OLS model with those variables both in
levels and first differences. Using levels of the variables, we found that lagged premiums were
significant for corn, soybeans, and oats, but at varying lags and levels. Oil price was positively
significant for all commodities except barley premiums and personal income was only significant
for corn, soybeans, and oats. There is a significant time trend for wheat and oats. Unit roots were
found for all of the non-dummy variables, so the model was re-estimated using first differences.
When the model was run with the stationary data, significant variables included lagged
premiums, oil price, and the FAO Cereal Index.
Data frequency and availability limited this study and a case study was conducted using
organic imports as an additional variable. However, it was found to be insignificant. This study
could be further improved on as more organic agriculture data becomes available. Specifically,
comprehensive organic crop production data as well as organic livestock monthly and annual
numbers would be of value in expanding the depth of this study. More months of organic import

55
data would also provide more insights into how premiums change for organic corn, soybeans,
wheat, barley, and oats.
For organic grain and soybean producers, this paper demonstrates that of the five
commodities, the least risky organic commodities to grow include corn and soybeans, especially
if they plan to sell in the spot market. However, it is suggested that growers may want to
consider growing wheat, barley, and oats if they have a buyer willing to contract in advance, in
order to ensure a premium and reduce price risk. For purchasers of organic grains and soybeans,
including major food companies as well as livestock producers, it is recommended to continue to
follow these organic markets, especially as they become modernized and no longer “thin.”
Lastly, policy makers and the USDA can help organic producers by collecting more
accurate and frequent data on organics, especially with regards to planted and harvested acreage,
yields, stocks, imports, exports, and use. This will provide the opportunity for premiums to be
better explained by key supply and demand factors as compared to conventional commodities.

56
References
Adjemian, M. K., Saitone, T. L., & Sexton, R. J. (2016). A framework to analyze the
performance of thinly traded agricultural commodity markets. American Journal of
Agricultural Economics, 98(2), 581.
Associated Press. (2016). Organic milk low as demand up and farmers struggle.” Terra.
Retrieved from http://en.terra.com/news/news/organic_milk_low_as_demand_up_
and_farmers_ struggle/act459966.
Badgley, C., Moghtader, J., Quinterom, E., Zakem, E., Chappell, M. J., Avilés-Vázquez, K.,
Samulon, A., and Perfecto, I. (2007). Organic agriculture and the global food supply.
Renew. Agr. Food Syst. 22, 86–108.
Balcombe, K. (2010). The nature and determinants of volatility in agricultural prices: An
empirical study from 1962-2008.Commodity Market Review, , 2.
Bertramsen, S.K., & Dobbs, T.L.(2001). “Comparison of Prices for ‘Organic’ and
‘Conventional’ Grains and Soybeans in the Northern Great Plains and Upper Midwest:
1995 to 2000. Econ Pamphlet 2001-1. South Dakota State University.
Bertramsen, S. K., & Dobbs, T.L. “An Update on Prices of Organic Crops in Comparison to
Conventional Crops.” Economics Commentator. February 22, 2002. South Dakota State
University
Brown, M. B., & Forsythe, A. B. (1974). Robust tests for the equality of variances. .Journal of
the American Statistical Association,69(346), 364-367.
Born, H. (2005). Marketing Organic Grains. National Sustainable Agriculture Information
Service.
Daniells, S. (2014). US organic food market to grow 14% from 2012-2018. Food Navigator.
Retrieved from http://www.foodnavigator-usa.com/Markets/US-organic-food-market-to-
grow-14-from-2013-18
de Ponti, T., Rijk, B. & van Ittersum, M. K. (2012). The crop yield gap between organic and
conventional agriculture. Agr. Syst. 108, 1–9.
Dimitri, C., and Greene, C. (2000). Recent growth patterns in the US organic foods market. US
Department of Agriculture, Economic Research Service, Agricultural Information
Bulletin 777
ERS. (2014). Support for the organic sector expands in the 2014 farm act. Amber Waves.
Retrieved from http://www.ers.usda.gov/amber-waves/2014-july/support-for-the-organic-
sector- expands-in-the-2014-farm-act.aspx#.VfYjWBFVikr

57
Fromartz, S. (2006). Organic, Inc.: Natural Foods and How They Grow. New York: Harcourt
Trade Publishers.
General Mills. (2016). General Mills to double organic acreage sourcing to meet growing
demand for natural and organic foods. Retrieved from http://www.generalmills.com/
en/News/NewsReleases/Library/2016/March/organicacreage3-9/c336c600-8b39-461d-
90d0-b69f5c3bb99a
Gilbert, C. L. & Morgan, W. (2011). Food Price Volatility. Methods to analyse agricultural
commodity price volatility. I. Piot-Lepetit and R. M'Barek. New York, Springer: 45-61.
Gilbert C.L. (2006). Trends and volatility in agricultural commodity prices. In A. Sarris
and D. Hallam eds, Agricultural Commodity Markets and trade, Cheltenham,
Edward Elgar.
Greene, C. (2013). Consumer Demand Drives Growth in the Organic Food Sector.
Retrieved June 13, 2015 from http://www.ers.usda.gov/data-products/chart-
gallery/detail.aspx?chartId=35003.
Greene, C. (2014). Organic Market Overview. Retrieved from
http://www.ers.usda.gov/topics/natural-resources-environment/organic-
agriculture/organic-market-overview.aspx
Huchet-Bourdon, M. (2011). Agricultural Commodity Price Volatility: An Overview. OECD
Food, Agriculture and Fisheries Papers, No. 52, OECD Publishing. Retrieved from
http://dx.doi.org/10.1787/5kg0t00nrthc-en
Jaenicke, E. C., & Carlson, A. C. (2015). Estimating and investigating organic premiums for
retail-level food products: ESTIMATING AND INVESTIGATING ORGANIC
PREMIUMS.Agribusiness, 31(4), 453-471. doi:10.1002/agr.21413
Klonsky, K.& Greene,C. (2005). Widespread adoption of organic agriculture in the US: are
market-driven policies enough?” Selected Paper presented at the American Agricultural
Economics Association Annual Meeting, Providence, Rhode Island, July 24–27
Lakner, S., Ihle, R., & Würriehausen, N. (2015). Price relationships between qualitatively
differentiated agricultural products: Organic and conventional wheat in
Germany. Agricultural Economics, 46(2), 195-209. doi:10.1111/agec.12151
Lin, B.-H., Smith, T., & Huang, C.L. (2008). Organic premiums of US fresh produce.
Renewable Agriculture and Food Systems 23(2008):208–16.
McBride, W. & C. Greene (2015). Despite Profit Potential, Organic Field Crop Acreage
Remains Low. From http://www.ers.usda.gov/amber-waves/2015-november/despite-
profit-potential,-organic-field-crop-acreage-remains-low.aspx#.Vm14N0orLIW

58
Moledina, A.A.; Roe, T.L; & Shane, M. (2004). Measuring commodity price volatility and the
welfare consequences of eliminating volatility. Retrieved from
http://purl.umn.edu/19963
National Bureau of Economic Research. (2010). US business cycle expansions and
contractions. http://www.nber.org/cycles.html
Nau, R. (2016). Statistical forecasting: notes on regression and time series analysis. Duke
University. Retrieved from http://people.duke.edu/~rnau/411diff.htm
Oberholtzer, L.; Dimitri, C; and Greene, C. (2005). Price premiums hold on as U.S. organic
produce market expands. USDA ERS.
Organic Trade Association. (2015). Organic Industry Survey. From
https://www.ota.com/resources/organic-industry-survey
Organic Trade Association [OTA].(2015). State of the Industry Fact Sheet. From
http://ota.com/sites/default/files/indexed_files/StateOfOrganicIndustry_0.pdf
Park, T. A., & Lohr, L. (1996). Supply and demand factors for organic produce. American
Journal of Agricultural Economics,78(3), 647-655. doi:10.2307/1243282
Ponisio, L. C., M’Gonigle, L. K., Mace, K. C., Palomino, J., Valpine, P., and Kremen, C. (2012).
Diversification practices reduce organic to conventional yield gap. Proc. R. Soc. B 282,
20141396.
Reaves, E. (2015). US food companies collaborate to increase supply of organic grain.
From http://www.sustainablefoodlab.org/all-news-articles/293-newsletter-winter-2015.
Reganold, J.P. and Wachter, J.M. (2016). Organic agriculture in the twenty-first century. Nature
Plants. Doi:10.1038/nplants.2015.221
Risk Management Association (2016). Organic crops. From
http://www.rma.usda.gov/news/currentissues/organics/
Roseboro, K. (2015). Organic food companies collaborating to increase organic supply. From
http://www.non-gmoreport.com/articles/april-2015/organic-food-companies-
collaborating-to-increase-organic-grain-supply.php
Seufert, V., Ramankutty, N. & Foley, J. A. (2012). Comparing the yields of organic and
conventional agriculture. Nature 485, 229–232.
Singerman, A., Hart, C.E., & Lence, S.H. (2011). Price analysis, risk assessment, and insurance
for organic crops. Retrieved from
http://www.card.iastate.edu/policy_briefs/display.aspx?id=1163.

59
Singerman, A., Lence, S.H., & KimbleEvans, A. (2014). How related are the prices of organic
and conventional soybean? Agribusiness 30 (3): 309–30.
Smith, T. A., Huang, C. L., & Lin, B. (2009). Does price or income affect organic choice?
analysis of U.S. fresh produce users. Journal of Agricultural and Applied
Economics, 41(3), 731.
Stanhill, G. (1990). The comparative productivity of organic agriculture. Agr. Ecosyst.Environ.
30, 1–26.
Su et al. (2013. August). Stability in Organic Milk Farm Prices: A Comparative Study. Retrieved
from http://ageconsearch.umn.edu/bitstream/150735/2/Stability%20in%20Organic
%20Milk%20Farm%20Prices%20A%20Comparative%20Stud%20AAEA%203180.pdf
USDA. (2012) Becoming a Certified Operation. Retrieved from
https://www.ams.usda.gov/services/organic-certification/faq-becoming-certified
USDA Organic Agriculture. (2015). Retrieved from
http://www.usda.gov/wps/portal/usda/usdahome?contentidonly=true&contentid=usda-
results-organic-agriculture.html
USDA. (2016). USDA reports record growth in U.S. organic producers.
http://www.usda.gov/wps/portal/usda/usdahome?contentid=2016/04/0084.xml&navid=N
EWS_RELEASE&navtype=RT&parentnav=LATEST_RELEASES&edeployment_actio
n=retrievecontent
Phillips, P. C. B., & Perron, P. (1988). Testing for a unit root in time series
regression.Biometrika, 75(2), 335. doi:10.2307/2336182
Said, S.E and Dickey, D. A. (1984). Testing for unit roots in autoregressive-moving average
models of unknown order. Biometrika. 71(3), 599-607.
Tabachnick, B.G., & Fidell, L.S.(2007). Using Multivariate Statistics (5th ed.). Needham
Heights, MA: Allyn & Bacon.
Welch, B. L. (1951). On the comparison of several mean values: An alternative
approach. Biometrika, 38(3/4), 330-336. doi:10.1093/biomet/38.3-4.330