understanding oregon’s economic situation: what lies ahead for the future workforce oavsnp winter...
TRANSCRIPT
Understanding Oregon’s Economic Situation:
What Lies Ahead for the Future Workforce
OAVSNP
Winter 2009 Conference
February 20, 2009

Overview
• Current economic conditions
• Where are the jobs today and tomorrow?
• What skills and training do job seekers need?
• How is the workplace changing?

1/20/09 News Release Summary
• Unemployment rate rose from 8.0 percent in November to 9.0 percent in December.• US rate 7.2 percent.
• Employment down almost 47,000 since pre-recession peak (February 2008).

Unemployment rates have jumped dramatically since June.
Seasonally Adjusted Unemployment Rates, 1998 to Present
3.0
4.0
5.0
6.0
7.0
8.0
9.0
10.0
Jan-
98
Jul-9
8
Jan-
99
Jul-9
9
Jan-
00
Jul-0
0
Jan-
01
Jul-0
1
Jan-
02
Jul-0
2
Jan-
03
Jul-0
3
Jan-
04
Jul-0
4
Jan-
05
Jul-0
5
Jan-
06
Jul-0
6
Jan-
07
Jul-0
7
Jan-
08
Jul-0
8
U.S. Oregon
In December, Oregon had the
6th highest unemployment
rate in the nation.

Lets put today’s situation in perspective, based on historical experience.
Oregon's Seasonally Adjusted Unemployment Rate -- the Long-Term View
0
2
4
6
8
10
12
14
Jan-76
Jan-78
Jan-80
Jan-82
Jan-84
Jan-86
Jan-88
Jan-90
Jan-92
Jan-94
Jan-96
Jan-98
Jan-00
Jan-02
Jan-04
Jan-06
Jan-08
Pe
rce
nt
of
La
bo
r F
orc
e
12.1% in November 1982
9.0% in December 2008

We’re now in a phase of big job losses, with employment declines averaging almost 10,000 per month since October.
Down eight of ten last months.
Seasonally Adjusted Employment in OregonTotal Nonfarm Payroll: 1990 - 2008
1,200,000
1,400,000
1,600,000
1,800,000
1990 1992 1994 1996 1998 2000 2002 2004 2006 2008
Em
plo
yme
nt
Employment down 46,700 from pre-recession peak in February 2008

Recession hitting all sectors
• Major retailers such as Circuit City closing• Health care - OHSU, central Oregon hospitals cutting back• Nike• Verizon Wireless• Red Cross• Car dealerships• Education• Residential building companies filing bankruptcy• State agencies laying off

Industries showing big losses include retail trade and, in recent months, leisure and hospitality.
Seasonally Adjusted Employment in OregonRetail Trade: 1997 - 2008
170,000
180,000
190,000
200,000
210,000
1998 2000 2002 2004 2006
Em
plo
yme
nt
Seasonally Adjusted Employment in OregonLeisure and Hospitality: 1990 - 2008
100,000
120,000
140,000
160,000
180,000
200,000
1990 1992 1994 1996 1998 2000 2002 2004 2006
Em
plo
yme
nt

Health care is not recession-proof, though we just started seeing cuts in early February
Seasonally Adjusted Employment in OregonHealth and Social Services: 1997 - 2008
120,000
140,000
160,000
180,000
200,000
1998 2000 2002 2004 2006
Em
plo
yme
nt

So to summarize the Recession in one graph …
Construction and manufacturing have led Oregon's job losses.
-20,000
-15,000
-10,000
-5,000
0Con
stru
ction
Man
ufac
turin
g
Retail
trad
e
Profe
ssio
nal a
nd B
usine
ss S
ervic
es
Leisu
re a
nd H
ospi
tality
Financ
ial A
ctivi
ties
Gover
nmen
t
Natur
al R
esou
rces
and
Min
ing
Who
lesal
e tra
de
Job
s L
ost
...
Job loss from pre-recession peak to December 2008.

Where do we go from here?
One good thing about recessions…
… they never last forever

The state forecast suggest we don’t bottom out until at least 3Q09.
Quarterly Employment, History and ForecastOregon: 1998 - 2015
1,400,000
1,600,000
1,800,000
2,000,000
1998:1 2000:1 2002:1 2004:1 2006:1 2008:1 2010:1 2012:1 2014:1
To
tal N
on
farm
Pa
yro
ll E
mp
loym
en
t
Source: Office of Economic Analysis, Department of Administrative ServicesDecember 2008
Okay, enough of the recession. There are some broader workforce issues we have to also keep
focused on.
1. Even during a recession, there are many vacancies. But, competition can be fierce.

Registered Nurses and Farm Workers Vie for First PlaceOccupations with Most Vacancies, Spring 2008
0 500 1,000 1,500 2,000 2,500 3,000
Combined Food Preparation and Serving Workers, Including Fast Food
Stock Clerks and Order Fillers
Maids and Housekeeping Cleaners
Personal and Home Care Aides
Food Preparation Workers
Laborers and Freight, Stock, and Material Movers, Hand
Customer Service Representatives
Cooks, Restaurant
Packers and Packagers, Hand
Cashiers
Waiters and Waitresses
Nursing Aides, Orderlies, and Attendants
Retail Salespersons
Farmworkers and Laborers, Crop, Nursery, and Greenhouse
Registered Nurses
Number of Vacancies
Total openings for all occupations: 47,888
In May 2008, almost 48,000 vacancies spread across 500 occupations.

Broader workforce issues…
2. No one’s talking about baby boom retirements right now… but thoughtful planning is still needed.
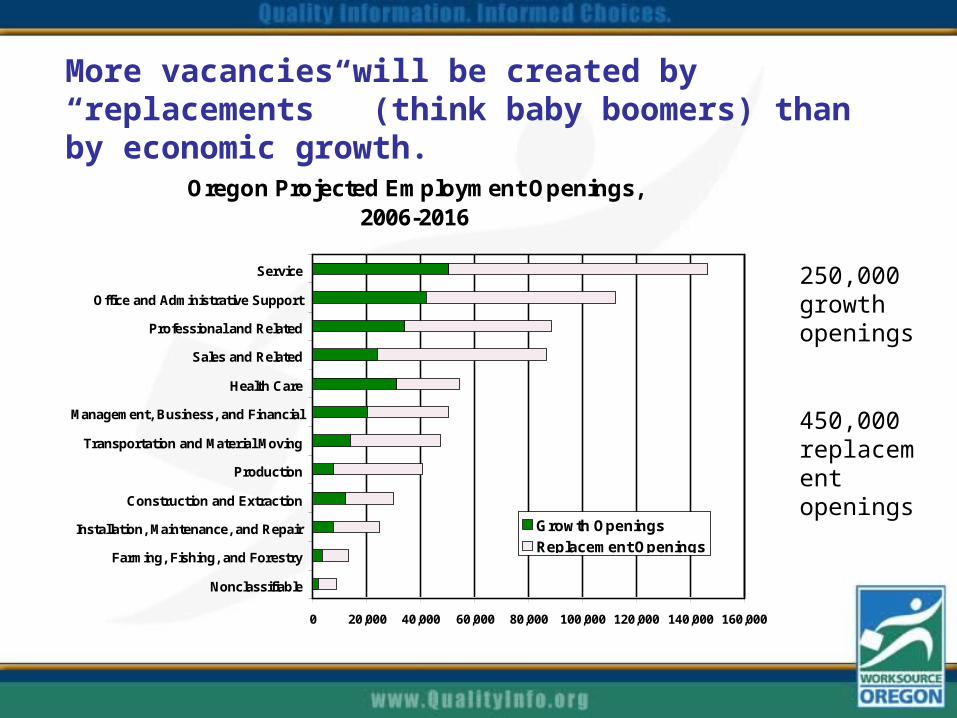
More vacancies will be created by “replacements” (think baby boomers) than by economic growth.
Oregon Projected Employment Openings, 2006-2016
0 20,000 40,000 60,000 80,000 100,000 120,000 140,000 160,000
Nonclassifiable
Farming, Fishing, and Forestry
Installation, Maintenance, and Repair
Construction and Extraction
Production
Transportation and Material Moving
Management, Business, and Financial
Health Care
Sales and Related
Professional and Related
Office and Administrative Support
Service
Growth Openings
Replacement Openings
250,000 growth openings
450,000 replacement openings

Broader workforce issues…
3. Even with those retirements, Oregon will probably have enough workers… but will they have the right training and skills?

All occupational groups are projected to add jobs…
Oregon Employment Change by Occupational Group, 2006-2016
0 10,000 20,000 30,000 40,000 50,000 60,000
Nonclassifiable
Farming, Fishing, and Forestry
Installation, Maintenance, and Repair
Production
Construction and Extraction
Transportation and Material Moving
Management, Business, and Financial
Sales and Related
Health Care
Professional and Related
Office and Administrative Support
Service
Important Notes
Relatively low-wage/low skill occupations add the most jobs.
Professional and health care significantly contribute to high-wage job growth.
Blue-collar jobs also growing.

Nearly three-fourths of Oregon’s projected job openings will not require post-secondary education, based on the minimum educational requirement for each job.
Oregon Job Openings -- Growth and Replacement -- by Required Training, 2006-2016
Associate3.9%
Related work experience
6.4%
Moderate-term on-the-job
training15.9%
Short-term on-the-job training
44.6%
Long-term on-the-job training
6.6%
Postsecondary training
7.9%
Bachelor's13.3%
Advanced degree3.4%

Not all High-wage, high-demand jobs require higher education
• Occupations vary from truck drivers to mechanical drafters to medical transcriptionists
• Some require apprenticeships or higher ability levels
• Many are on-the-job training

Low-skilled jobs are not no-skilled jobs.
• May not need high level credentials to apply for low-skilled jobs, but they must possess the requisite skills to succeed in their jobs.
• Appropriate workplace behavior and the ability to follow instructions are important

• Communication • Interpersonal develop • Teamwork• Leadership • Problem solving• Initiative and enterprise • Planning and organizing
Common skills sought by employers
• Self management • Accuracy • Ability to learn • Flexibility • Creativity • Technology and Computers• Commonsense• Reliability

Keep in mind that…
• Low skilled jobs offer promotional opportunities.
• Firms also construct pipelines of appropriately skilled workers by hiring entry-level workers with skills needed in the position above entry level.
• But, workers should be willing and able to expand their skill sets to the best of their ability.
Where is the best place to look for a job today?
• All industry sectors are down
• Very competitive
• Some who are eligible for retirement are not retiring yet
• Lots of experienced workers competing with youth

Where is the best place to look for a job tomorrow?
• Employment projections are long-term
• Look at occupations with higher projected job openings in our data
• Latest buzz is about Green Jobs
• Will take time for some sectors to come back

How is today’s workplace different?


Four Generations in the Work Place
• Traditionalists – born prior to1946
• Baby Boomers – 1946-1964
• Generation Xers – 1965-1980
• Millenials – 1981 - 1995

The world of work is evolving.
Today’s workers need to:
• realize they will be responsible for their own career development.
• realign expectations to include continuous learning over a lifetime.
• find out what the impact of technology means to their duties and tasks and to do something about it.
• no longer expect the employer to prepare them for changing duties.
• realize they need more than a résumé to market themselves. • realize there are more options for rewards than money and
promotions elder care, day care, flex hours, vacation and training time. leisure time, training opportunities.
To Summarize…
• Today – seems like all we hear is bad news
• But, things will get better. We still need to plan for tomorrow.
• The workplace and the workers are changing. We all need to keep pace with those changes.

Just for fun… where do the happiest people work?
Clergy 67%Firefighters 57%Travel agents 57%Architects 54%Misc. mechanical and repair 54%Special education teachers 53%Actors and directors 51%Science technicians 51%Airline pilots and navigators 49%Industrial engineers 48%
Source: "Job Satisfaction in the United States”, University of Chicago

Please visit our web site – www.QualityInfo.org – for more information
about Oregon’s economy and workforce.
Brenda Turner, Occupational EconomistWorkforce and Economic Research
Oregon Employment [email protected]
(503) 947-1233