understanding office discipline referral data. steps of data collection, analysis, and use...
TRANSCRIPT

Understanding Office Discipline Referral Data
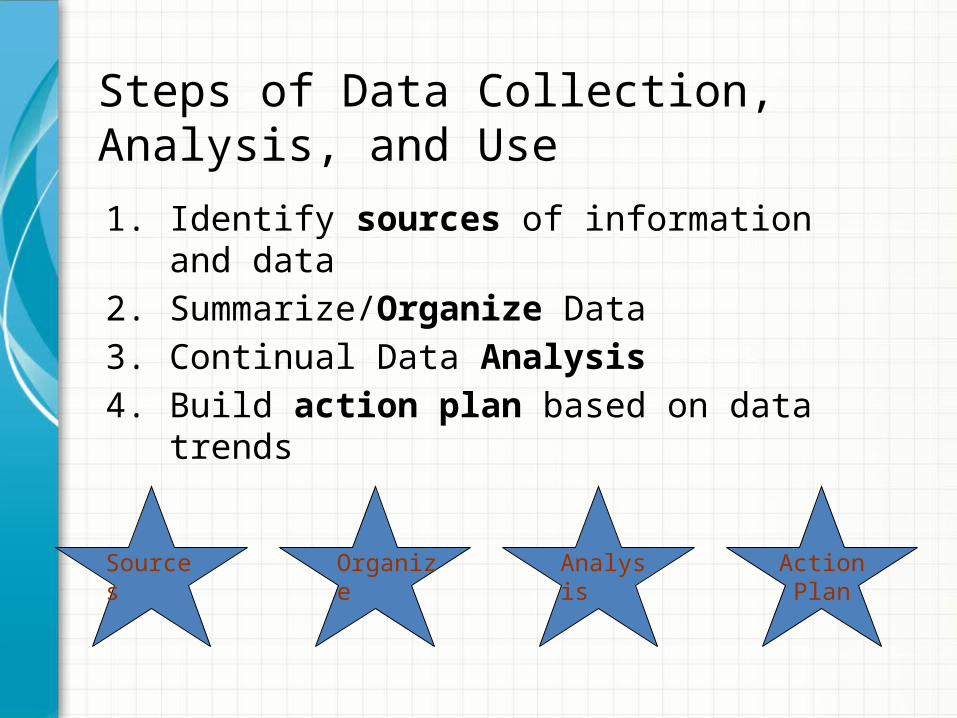
Steps of Data Collection, Analysis, and Use1. Identify sources of information and data2. Summarize/Organize Data3. Continual Data Analysis4. Build action plan based on data trends
Sources Organize Analysis Action Plan
The Big Five• Average Referral/Day/Month• # of Referrals by Behavior• # of Referrals by Location• # of Referrals by Time of Day• # of Referrals by Student
Sources

The Big Five• Average Referral/Day/Month• # of Referrals by Behavior• # of Referrals by Location• # of Referrals by Time of Day• # of Referrals by Student
Sources

Average Referral Rate per Month
Organize
Harlan Elementary SchoolBehavior Referrals/Day/Month
012
3456
789
Months
Beh
avio
r R
efe
rrals
/Day/M
on
th
2000-2001
2001-2002
2002-2003
2003-2004
2004-2005
2005-2006

Organize

Organize

Comparison by Location
0
50
100
150
200
250
Gym Other Location Library Hall/ Breeze way Cafeteria P layground Classroom
2002-2003
2003-2004
Organize

Organize

Incident Count for Time Code Incident Code Time
1 23 2 16 3 14 4 11 5 16 6 17 7 21 8 49
Total: 167
Time Intervals: 0 = Time missing 1 = 07:00 - 07:59 2 = 08:00 - 08:59 3 = 09:00 - 09:59 4 = 10:00 - 10:59 5 = 11:00 - 11:59 6 = 12:00 - 12:59 7 = 13:00 - 13:59 8 = 14:00 - 14:59 9 = 15:00 - 15:59
10 = 16:00 - 16:59 11 = 17:00 - 17:59 12 = 18:00 - 18:59 13 = 19:00 - 19:59 14 = 20:00 - 20:59 15 = 21:00 - 21:59 16 = 22:00 - 22:59 17 = 23:00 - 23:59
Organize

Organize

Referrals by Student
76%
21%
4%
0%
10%
20%
30%
40%
50%
60%
70%
80%
90%
100%
Behavior Reporting Triangle
6+ Referrals
2 - 5 Referrals
0 - 1 Referrals
Organize
Total Enrollment 327
# of Students with 0-1 247 76%
# of Students with 2-4 68 21%
# of Students with 6+ 12 4%

Other Referral Information• # of referrals per Day of the Week• # of Suspensions (In-School and Out-of-School)• # of Referrals by Classroom• # of Referrals by Staff • # of Referrals compared to # of
acknowledgments• Others?
Sources

250
300
350
400
450
500
550
600
Mon Tue Wed Thu Fri
Day of Week
Office Referrals by Day of Week1994-1995
Organize
Organize

Suspensions Data
0
10
20
30
40
50
60
70
80
90
Events Students Contributing
In School Suspensions
Out of School Suspensions
Organize
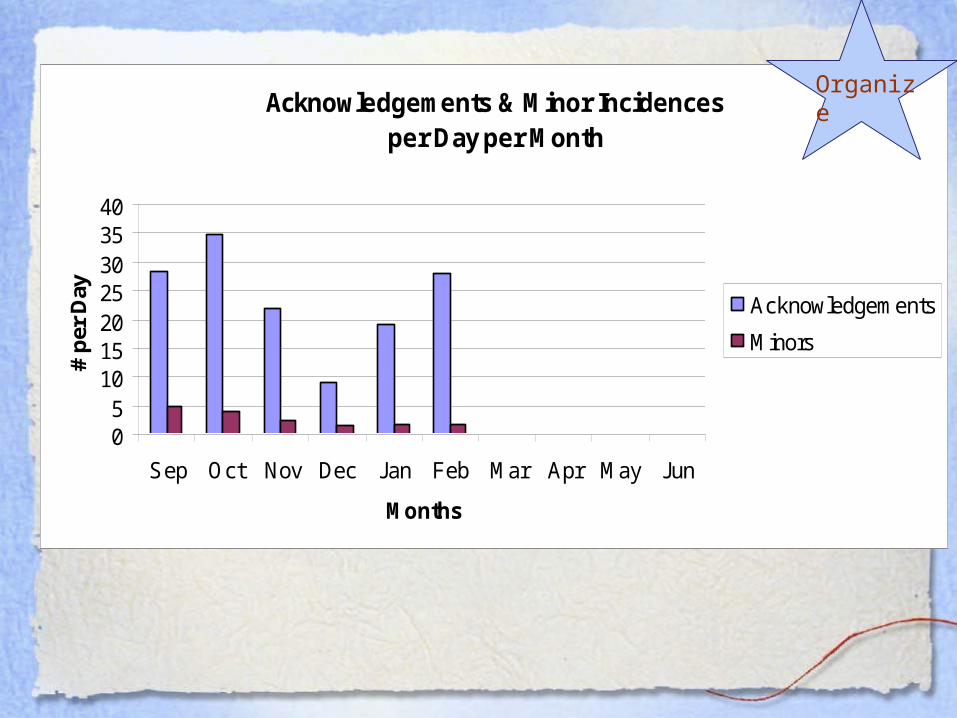
Acknowledgements & Minor Incidencesper Day per Month
05
10152025303540
Sep Oct Nov Dec Jan Feb Mar Apr May Jun
Months
# p
er D
ay Acknowledgements
Minors
Organize

Why Collect Data• Decision making• Professional accountability• Decisions made with data (information) are more
likely to be (a) implemented, and (b) be effective• You won’t just be relying on a “hunch” to know if
you are effective
Adapted from “Using Data for Decision-making” Rob H. Horner, George Sugai, Teri Lewis-Palmer, & Anne W. Todd

Key Features of Data Systems That Work
• The data are accurate• The data are easy to collect• Data are used for decision-making• The data must be available when decisions need
to be made• The people who collect the data must see the
information used for decision-making
Adapted from “Using Data for Decision-making” Rob H. Horner, George Sugai, Teri Lewis-Palmer, & Anne W. Todd
What Data to Collect for Decision-Making
• USE WHAT YOU HAVE• Office Discipline Referrals/Detentions - Measure
of overall environment• Referrals are affected by:
– (a) student behavior – (b) staff behavior – (c) administrative context
• Suspensions/Expulsions• Other Sources
Adapted from “Using Data for Decision-making” Rob H. Horner, George Sugai, Teri Lewis-Palmer, & Anne W. Todd