understanding of metrics used for …pernerscontacts.upce.cz/41_2015/jancik.pdfnumber 4, volume x,...
TRANSCRIPT

Number 4, Volume X, December 2015
Jančík, Rathouský: Understanding of Metrics used for supply chain management 28
UNDERSTANDING OF METRICS USED FOR SUPPLY CHAIN MANAGEMENT
Jakub Jančík1, Bedřich E. Rathouský2
Summary: The proposed paper is focused on measurement and evaluation of supply chain performance in order to its sustainable improvement. The main goal is to suggest categorization of metrics and examine each category in order to verify whether companies exploit the full potential of measurement. The presented outcomes are based on preliminary questionnaire survey conducted among Czech companies.
Keywords: metrics, performance measuring, supply chain management
INTRODUCTION As logistic managers need sufficient information and visibility not only within their
organization but also across their supply chains, the proper set of metrics is critical issue in supply chain performance management. Currently data is mainly used for evaluation of decision and performance in the past. In other words the data is used in reactive way. However there are significant potential benefits in their usage for creating a future plans when rate of accuracy and relevancy is known. For these two reasons metrics should be fundamental issue for each company which aims to be competitive and ensure sustainably growth. However the worth of data in overall supply chain optimization is neglected. Companies dealing with corporate performance measurement are by identifying accurate and proper set of metrics ale to evaluate their performance not only in the last period but also estimate the future trends. By retrospective view managers know what they did well and also identify bottlenecks where remediation is needed. The future estimations are baseline for decision making in the company in order to get the competitive advantage.
Regrettably a few of current companies see this potential and metrics are mostly used as a reactive tool to evaluate how the company managed in the past. That is one of reasons why companies are not able to go further in optimization their supply chain management and cooperation and communication with their suppliers or partners is not as flexible as it should be. By setting accurate set of metrics which reflects all business needs of supply chain companies gain ability not only to evaluate their performance but also set a platform for communication with their partners due to clear understanding and interpretation of numbers they are presenting.
1 Ing. Jakub Jančík, University of Economics in Prague, Faculty of Business Administration, Department of logistics, nám. W. Churchilla 4, 130 67 Praha 3, E-mail: [email protected] 2 Ing. Bedřich Rathouský, Ph.D., University of Economics in Prague, Faculty of Business Administration, Department of logistics, nám. W. Churchilla 4, 130 67 Praha 3, E-mail: [email protected]

Number 4, Volume X, December 2015
Jančík, Rathouský: Understanding of Metrics used for supply chain management 29
STATE OF THE ART Benefits from Supply Chain Management should be achieved only in the case when
SCM is clearly understood and well managed. Clear understanding of SCM across whole supply chain is a fundamental precondition for its effective integration which results in excellent customer service and company performance (1). This area covers not only sharing of visions on strategic level of management but also effective communication and information sharing. Communication between subjects of supply chain is crucial for achieving synergic effects in SCM (2) and as a lot of researchers have proven yet information sharing is one of most significant aspect which contributes to improvement overall supply chain process performance (3). Good management of supply chain processes represents second critical issue which contributes to increasing profits or improvement of operations(4).
Due to different understanding of performance by different stakeholders companies have to use adequate measures which will be generally clearly understood and which will reflect substance of particular business (5).
Currently there is numerous of different attitudes to categorize the metrics. Choosing of proper categorization is above all conditioned by perception of supply chain management. Possible categorizations are briefly discussed in what follows.
Elrod et al. (4) mention number of possible categorizations of metrics. The following list summary proposed classifications:
Quality, financial, time, product flexibility, overall performance, and innovation
Qualitative and quantitative metrics
Resource measures, output measures, and flexibility measures
Strategic, tactical, and operational
Resources, visibility, and agility
Financial costs, quality, time, and flexibility.
Morgan (6) adds another classification containing financial performance measures, cost performance measures, customer service measures, quality measures and operational productivity measures. Other point of view propose Gyula(5) who take under consideration only accounting and financial indicators or their combination.
In addition to various ways to categorize the metrics there are different approaches for defining metrics. The approach determines the understanding of metrics and it is closely related to categorization mentioned above. (5)propose several approaches to define and understand the metrics. First of them is using Balanced Scorecard technique(6) which defines four dimensions to measure – Customer, Finance, People, and Operations. Second is differentiation of management levels to separate sets of metrics that are defined for operational, tactical and strategic levels. Third approach proposed by (5) is defining according to supply chain management activities such as plan, source, make/assemble, and deliver. Elrod et al. (4) adds two more possible approaches to define the SCM metrics – based of processes, services or assets or based on hierarchy of three organizational levels starting from enterprise group, enterprise and department. A additional methods used for defining measures

Number 4, Volume X, December 2015
Jančík, Rathouský: Understanding of Metrics used for supply chain management 30
for SCM it can be mentioned Analytic hierarchy process (AHP) or Supply Chain Operations Reference (SCOR model) (7).
METHODOLOGY Presented data is based on findings of preliminary research conducted by authors to pre-
confirm their hypotheses about the role of measuring in supply chain management. Data was gathered by questionnaire survey. Researchers focused on two major areas: composition of metrics used in the companies and possibility of correlation between this composition and type of customer – supplier relationship.
Research is aimed at middle-sized and large-sized companies. Thereby research team contacted 800 organizations with annual turnover of more than 7.5 million EUR out of the following sectors: automotive, retail, food and beverage, electronics, logistic providers, fashion, pharmaceutics, other production (e.g. industrial pump manufacturing, manufacturing for energy and utilities, coil spring manufacturing etc.) and other (toys, paper-making industry, distribution and office suppliers).
Communication with respondents was divided into two phases. In the first phase the questionnaires were sent by e-mail and in the second phase research team realized phone call to companies to improve the response rate. Response rate for preliminary research was 4.25%.
Detail structure of the sample regarding the turnover and number of employees is shown in table 1. The majority of sample is represented by companies with more than 50 employees with more annual turnover between 10 and 200 million EUR. We can divide the sample into three major groups: first represents companies with turnover less than 50 million EUR per year and 50 – 249 employees representing 23.5% of the sample, second (20.6%) represents companies with turnover less than 200 million EUR and more than 500 employees and third major group (17.6%) represents companies with annual turnover between 10 and 200 million EUR and employing from 250 – 499 people.

Number 4, Volume X, December 2015
Jančík, Rathouský: Understanding of Metrics used for supply chain management 31
Tab. 1 – Structure of the sample
Turnover/ number
of employees
10-49 50 - 249
250 - 499
>500
Total sum
2 - 10 mil 3.9% 5.9%
0.0%
3.9%
13.7%
<50 mil 0.0% 23.5%
8.8%
5.9%
38.2%
<200 mil 0.0% 3.9%
8.8%
20.6%
33.3%
<500 mil 6.9% 3.9%
0.0%
3.9%
14.7%
Total sum 10.8% 37.2%
17.6%
34.3%
100.0%
Source: own research
The conceptual model which authors propose is based on two hypotheses. The survey was used to confirm or reject following hypotheses.
H1: Set of metrics used in companies for monitoring supply chain management is not well-balanced in a meaning of multidimensional perceiving of organization.
Performance measuring process should show measured entity as a whole and highlight the most critical bottlenecks. For this purpose it is necessary to specify proper and well-balanced set of metrics which is able to cover all aspects of monitored process. The aspect should be represented by single point of view - dimension (e.g. financial, time etc.) Company will get the whole picture about its performance only when it takes under consideration dimensions relevant to the specific process.
H2: Companies that emphasize relationships with their suppliers or customers use more complex and better balanced sets of metrics for monitoring performance of their supply chains.
Measuring of overall supply chain performance is more complex activity than measuring performance of single organization. Companies which build a partnership have to set metrics more carefully regarding business practices and techniques of each other. Due to this fact partners have to create more robust and complex set of metrics to achieve reliability of monitoring process.
Number 4, Volume X, December 2015
Jančík, Rathouský: Understanding of Metrics used for supply chain management 32
FINDINGS Considering responses from realized questionnaire survey authors decided to use
modified sixth categorization proposed by Elrod et al. (4). Authors determined five basic categories. The list of them follows:
Financial
Quality
Time
Flexibility
Operational performance.
Financial metrics are most commonly measured and reported. The reason for that lays in their availability as most of them have to be collected due to accounting point of view. Additionally, financial data e.g. revenues are generally well understood by managers so it is easy to use these metrics as a tool for monitoring and evaluating supply chain performance. Due to clear understandability financial quantities are good communication platform. Composite metrics of cost performance defined by Morgan (6) also belong into this category. These metrics are not purely financial because they show relation between other category metrics and costs, for example costs per unit, kilometer, pallet or kilogram. By researchers most frequently mentioned financial metrics are financial costs, distribution costs, information processing costs, inventory costs, total costs, manufacturing costs, inventory obsolesce, finished goods inventory, ROI, warehouse costs, incentive costs, intangible costs or revenues.
According to Elrod et al. (4) quality measures follow mostly customer satisfaction and reflects the extend of customer satisfaction with logistic service provision. In other words the quality metrics measure whether offered product or service meets the customer requirements. As a customer we consider the party of supply chain which is supplied by its subcontractor or partner. The most used quality metrics across our sample were error rates (in production, in expedition), on-time delivery and number of complaints. There is obvious incongruity between the literature (4, 5) and observations of the sample. The key metrics the recent researches and literature reviews suggest are mainly customer satisfaction, perceived value of the product or buyer-supplier relationship, accuracy, number of faulty notes invoiced or delivery dependability. These measures are more complex to monitor and by their nature they are softer than metrics used by respondents.
As each operation in supply chain takes a time, the metrics based on a time are extremely relevant to monitor and evaluate. In addition these metrics are clearly understandable and in most cases very easy to measure. The time is also significant strategic factor for competitiveness of organizations and/or supply chains (8).The most common time metrics measured by respondents are mainly inventory turnover or pallet turnover and delivery time. In spite of theoretical background according to realized survey the time measure category is category with the lowest usage rate. Theoretical background also list metrics which none of the sample uses as order lead time, effectiveness of scheduling techniques, product development cycle time, product lateness time, average lateness time, average earliness time and manufacturing lead time.

Number 4, Volume X, December 2015
Jančík, Rathouský: Understanding of Metrics used for supply chain management 33
Metrics which are related to an ability to adopt a change is classified as flexibility metrics (4). These metrics refers to ability how quick and how effective is company able to deal with unexpected situations. As unexpected situation we consider for example sudden drop in demand of product or service or otherwise sudden increase in demand of another. In production it may be the machine disorder. In general, the more flexible the company is the shorter is the time to react to the change. The most often flexibility measures used by respondents refers to level of inventory, stock accuracy and capacity of warehouse or production. The recent metrics reviews add for example labor flexibility, range of products and services, plant volume flexibility, product/service modification flexibility or expansion flexibility.
Operational performance should be characterized as a nonfinancial metric metrics which express a performance by for example number of operations or volume of goods. Often these quantities are related to time so they measure overall performance of the company. According to Morgan (6) there are three categories of performance metrics: financial performance, cost performance and operational productivity. Financial and cost performance measures are in case of realized research classified as a financial metrics. Yet in some cases financial measure is composed of operational performance metrics. For example costs per tonne-kilometre are classified as a financial but tonne-kilometre is typical operational performance measure. Realized research shown a considerable heterogeneity in metrics related to this category. In many cases the respondents measure volume of goods received and dispatched or duration/frequency of an operation.
The following Table2 shows full categorization based on realized research. The metrics are ordered by the occurrence rate. There can be seen potential hierarchy between some of listed metrics (for example costs per and overhead charges can be considered as a sub-category for costs as a whole) but for purpose of this article are the results sufficient. The table clearly shows main areas the companies are focused on.
In the financial area the most used metrics are costs. It shows that for organizations the costs are the most significant indicator. Often used measures are also value of stock and traditional economic indicators such as turnover, profit and margin. Category of financial metrics numbers 22 different metrics. Within the research sample it means 42 used financial metrics in total.
Quality is metrics are represented mainly by on-time delivery, spoilage and error rate. These three metrics represent 50% of quality metrics used within the sample. The composition of this category reflects contemporary perception of quality. The most used metrics are more or less related to the cost cutting which corresponds with usage rate of financial metrics. In other words the main reason for monitoring quality is not customer satisfaction yet but controlling of costs.
The low usage of time metrics – nearly 42% of sample – is primarily due to projection of time into other categories (for example costs per time, OTD, productivity etc.). The most monitored metric within the time category is turnover which occupies 60% of the category. The companies mostly monitor inventory turnover. Organizations dispose of warehouses also monitors pallet turnover.

Number 4, Volume X, December 2015
Jančík, Rathouský: Understanding of Metrics used for supply chain management 34
Flexibility is next very heterogeneous category. The dominant measures are fill rate, which indicates both free capacity of the warehouse and capacity usage, and capacity which refers mainly to production. Flexibility measures also monitor availability of product (product availability, number of SKUs) or storage area (number of stock lots, pallet space. Number of employees in the warehouse refers to the capacity of warehouse in the meaning time needed for reaction on unexpected receipt or dispatch.
Operational performance metrics measure mostly performance and volumes of manipulated goods. Productivity and effectiveness are typical measures which refer to the number of operations per time unit. This group of operational performance metrics occupies more than 35% of the category. Second group within the category monitors volumes of manipulated goods. The group is consist of freight in and freight out and occupies 35% of category too. The group of last 30% mainly consists of tools for monitoring of order.

Number 4, Volume X, December 2015
Jančík, Rathouský: Understanding of Metrics used for supply chain management 35
Tab. 2 – Distinct metrics used by companies
Source: own research

Number 4, Volume X, December 2015
Jančík, Rathouský: Understanding of Metrics used for supply chain management 36
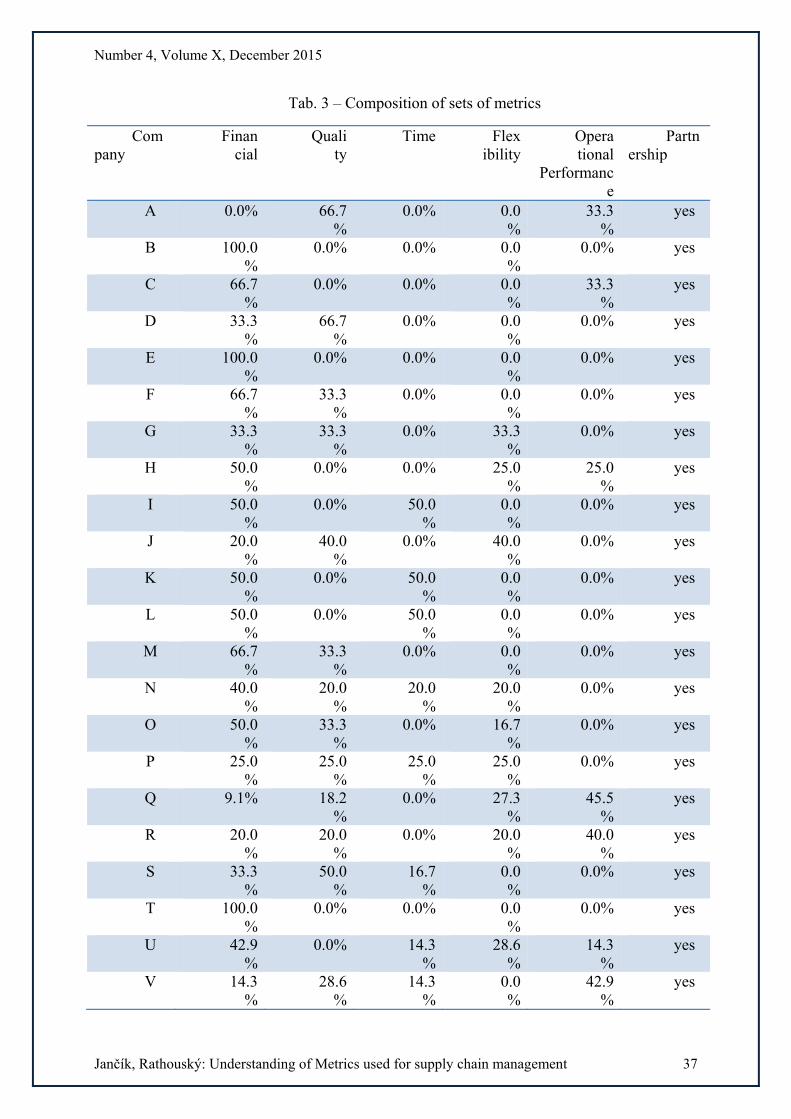
To emphasize the multidimensional nature of supply chain measurement process it is necessary to evaluate the composition of sets of metrics used in organizations. We defined five dimensions according to categories of metrics defined above. And test the balance of used categories. To verify second hypothesis we also verified whether the companies which develop the partnership have better balance set of metrics.
Table 3 shows the results of the analysis. It is important to note that all of respondents stated they are developing partnership. According to our presumption stated in second hypothesis all of them should have well balanced set of metrics which allows them to monitor all relevant dimensions of the company. The table shows the percentages of each category in the set of metrics defined by company.
Table 3 shows criticality of dimensions perceived by the sample. Time is not monitored by more than 58% of respondents, flexibility is omitted by more than 62% and more than 66% of respondents do not monitor the operational performance. On the other hand more than 62% of respondents monitor the quality and over 95% of the sample monitors the finance. According to replies the most critical dimension is unequivocally finance and second most critical aspect is quality.
Despite the fact that literature emphasizes the multidimensional perception of the organization, none of respondents covered all defined dimensions. 12.5% of respondents (B, E, T) monitor only one dimension and in all of these cases they monitor the finance. On the other hand 25% of respondents (G, H, J, O, S, X) covered three dimensions. Nearly 30% of respondents (N, P, Q, R, U, V, W) covered four dimensions and the distribution of metrics between dimensions was in most of these cases uniform. Most balanced set of metrics defined company P which distributed metrics absolutely evenly with value of variance equal to 0,16. Table 4shows complete list of values of variance related to number of used metrics and their distribution between dimensions. In the third column of Table 4 is number of covered dimensions. The quality of the set of metrics in the meaning of well balance is determined by the variance and number of covered dimensions. The better the set of metrics is, the lower the value of variance is when maximizing the number of covered dimensions.
Number 4, Volume X, December 2015
Jančík, Rathouský: Understanding of Metrics used for supply chain management 37
Tab. 3 – Composition of sets of metrics
Company
Financial
Quality
Time Flexibility
Operational
Performance
Partnership
A 0.0% 66.7%
0.0% 0.0%
33.3%
yes
B 100.0%
0.0% 0.0% 0.0%
0.0% yes
C 66.7%
0.0% 0.0% 0.0%
33.3%
yes
D 33.3%
66.7%
0.0% 0.0%
0.0% yes
E 100.0%
0.0% 0.0% 0.0%
0.0% yes
F 66.7%
33.3%
0.0% 0.0%
0.0% yes
G 33.3%
33.3%
0.0% 33.3%
0.0% yes
H 50.0%
0.0% 0.0% 25.0%
25.0%
yes
I 50.0%
0.0% 50.0%
0.0%
0.0% yes
J 20.0%
40.0%
0.0% 40.0%
0.0% yes
K 50.0%
0.0% 50.0%
0.0%
0.0% yes
L 50.0%
0.0% 50.0%
0.0%
0.0% yes
M 66.7%
33.3%
0.0% 0.0%
0.0% yes
N 40.0%
20.0%
20.0%
20.0%
0.0% yes
O 50.0%
33.3%
0.0% 16.7%
0.0% yes
P 25.0%
25.0%
25.0%
25.0%
0.0% yes
Q 9.1% 18.2%
0.0% 27.3%
45.5%
yes
R 20.0%
20.0%
0.0% 20.0%
40.0%
yes
S 33.3%
50.0%
16.7%
0.0%
0.0% yes
T 100.0%
0.0% 0.0% 0.0%
0.0% yes
U 42.9%
0.0% 14.3%
28.6%
14.3%
yes
V 14.3%
28.6%
14.3%
0.0%
42.9%
yes

Number 4, Volume X, December 2015
Jančík, Rathouský: Understanding of Metrics used for supply chain management 38
W 14.3%
28.6%
14.3%
0.0%
42.9%
yes
X 33.3%
33.3%
33.3%
0.0%
0.0% yes
Source: own research
Tab. 4 – Variance of metrics
company variance dimensions covered
A 0.64 2 B 10.24 1 C 0.64 2 D 0.64 2 E 0.16 1 F 0.64 2 G 0.24 3 H 0.56 3 I 0.24 2 J 0.8 3 K 0.24 2 L 0.24 2 M 0.64 2 N 0.4 4 O 1.36 3 P 0.16 4 Q 2.96 4 R 0.4 4 S 1.36 3 T 2.56 1 U 1.04 4 V 1.04 4 W 1.04 4 X 0.24 3
Average (ignoring extrems)
0.85
Source: own research
CONCLUSIONS Companies which measure their performance above all do not have the united
measuring systems. In the examined sample which counts 24 companies occurred 67 distinct metrics. Organizations monitor mostly the finance which indicates that the financial dimension is perceived as crucial. Within all dimensions the most used metric is costs.
In proposed paper we defined five key dimensions for supply chain measurement. Regrettably none of sets of metrics used by sample covered all of them. Yet considerable part of the sample covered at least three of them. As more than 70% of the sample during the
Number 4, Volume X, December 2015
Jančík, Rathouský: Understanding of Metrics used for supply chain management 39
supply chain performance monitoring and evaluation disregards two or more key dimensions we consider the first hypothesis “Set of metrics used in companies for monitoring supply chain management is not well-balanced in a meaning of multidimensional perceiving of organization” as confirmed.
We examined consistency of sets of metrics through variance of metrics used. Within the companies of which sets of metrics cover four dimensions, only 40% of (which means 12% of the whole sample) can be considered as balanced as their variance is below the average. The findings suggest that the second hypothesis (“Companies that emphasize relationships with their suppliers or customers use more complex and better balanced sets of metrics for monitoring performance of their supply chains.”) does not apply, but we are not able to reject it resolutely as all respondents stated they keep partnership. This fact may suggest either different interpretations of the term partnership by Czech companies or not understanding of the multidimensional nature of supply chain management.
The findings of preliminary research indicate that companies do not realize the full potential of measuring. We validate that the current state is using metrics as a reactive tool for evaluating performance of single company or its department. Companies keeping the partnerships with their suppliers use wide-ranging metrics which are not understood unanimously. This indicates that in general metrics are not used as a tool for cooperation across the supply chain or platform for communication. On the other hand considerable part of sample realizes and understands the multidimensional nature of measuring. It means that their measuring process is more accurate and provides more complex picture of the company or supply chain as a whole. This advantage should let these companies to improve their supply chains to be more effective and flexible.
ACKNOWLEDGEMENTS
This article and associated research was carried out as a part of the project financed by Internal Grant Agency of University of Economics, Prague, IG305025 and is provided as one of the outputs of the research project of the Faculty of Business Administration IP 307055 „National and corporate competitiveness from the perspective of endogenous growth models“.
REFERENCES
(1) BASNET, Chuda. The measurement of internal supply chain integration. Management Research Review [online]. 2013, roč. 36, č. 2, s. 153–172. ISSN 20408269. Dostupné z: doi:http://dx.doi.org.zdroje.vse.cz/10.1108/01409171311292252
(2) LAMBERT, Douglas M., Lisa M. ELLRAM a James R. STOCK. Logistika. Praha: Computer Press, 2000. Business books. Praxe manažera. ISBN 978-80-7226-221-2.
(3) BALL, Michael O., Meng MA, Louiqa RASCHID a Zhengying ZHAO. Supply Chain Infrastructures: System Integration and Information Sharing. SIGMOD Rec. [online]. 2002, roč. 31, č. 1, s. 61–66. ISSN 0163-5808. Dostupné z: doi:10.1145/507338.507350

Number 4, Volume X, December 2015
Jančík, Rathouský: Understanding of Metrics used for supply chain management 40
(4) ELROD, Cassandra, Susan MURRAY a Sundeep BANDE. A Review of Performance Metrics for Supply Chain Management. Engineering Management Journal. 2013, roč. 25, č. 3, s. 39–50. ISSN 10429247.
(5) GYULA, Laszlo Florian. Analysis of the Impact of the Supply Chain Performance on the Overall Organizational Performance. Annals of the University of Oradea, Economic Science Series. 2013, roč. 22, č. 1, s. 1505–1510. ISSN 15825450.
(6) MORGAN, Chris. Structure, speed and salience: performance measurement in the supply chain. Business Process Management Journal. 2004, roč. 10, č. 5, s. 522–536. ISSN 14637154.
(7) PERSSON, Fredrik, Christian BARTOLL, Adis GANOVIC, My LIDBERG, Matthias NILSSON, Johan WIBAEUS a Fredrik WINGE. Supply Chain Dynamics in the SCOR Model - a Simulation Modeling Approach. In: Proceedings of the Winter Simulation Conference [online]. Berlin, Germany: Winter Simulation Conference, 2012, s. 415:1–415:12 [vid. 14. říjen 2015]. WSC ’12. Dostupné z: http://dl.acm.org/citation.cfm?id=2429759.2430297
(8) PERNICA, Petr. Logistický management: teorie a podniková praxe. Praha: Radix, 1998. ISBN 978-80-86031-14-9.