understanding menstrual characteristics from the
TRANSCRIPT

Anthropological Review • Vol. 83(2), 109–128 (2020)
Understanding menstrual characteristics from the perspective of reproductive energetics:
a study on the adolescent Oraon tribal populations
Joyeeta Thakur, Monali Goswami, Subho Roy
Department of Anthropology, University of Calcutta, 35 Ballygunj Circular Road, Kolkata 700019, West Bengal
AbstrAct: The energetic costs of ovarian functions rely on the oxidizable fuels synthesized from carbohy-drate, protein and fat that contribute to body’s fat storage. Energy deficient diet in association with low body fat may disrupt normal ovulatory function and lead to several menstrual irregularities. We examined the association of nutritional status with menstrual characteristics among a group of adolescent Oraon tribal population of West Bengal, India. We selected 301 adolescent girls, aged 10-19 years. Information on socio-demographic status, menstrual characteristics and assessment of the dietary intake and nutritional status were collected following standard protocol. ‘Healthy weight’ participants more likely reported irreg-ularity in periods and skipping of menstrual cycle and shorter cycle length. Multivariate analysis revealed PBF has inverse association with PMS, duration of discharge and skipping of cycle (p<0.05); carbohydrate intake has direct association with duration of menstrual discharge (p<0.05); increased dietary fat intake has direct association with skipping of cycle, but not with BMI (p<0.05); increase in MUAC has direct as-sociation with dysmenorrhoea (p<0.05). Conclusion: Our study indicates energy deficiency does alter the menstrual characteristics of the Oraon adolescent girls.
Key words: Menstrual characteristics, energetics, adolescent, Oraon
Introduction
The energetic costs of normal ovarian function, rely on the ability in saving ox-idizable fuels in terms of nutrient trans-formations of physical, chemical and bi-ological systems (Leonard and Ulijaszek 2002; Torre et al. 2014). Several studies
revealed that at the time of physiological imbalance between reproductive needs and metabolism, ovarian function gets suppressed (Ellison 2001; Schneider 2004; Torre et al. 2011; Shapira 2013) as an energy-conserving adaptation (Myer-son et al. 1991; Nattiv et al. 1994; Elli-son 2003). It has been hypothesized that
Reproductive energetics among the Oraon
Original Research Article Received: January 13, 2020; Revised: March 17, 2020; Accepted: March 18, 2020DOI: 10.2478/anre-2020-0009© 2020 Polish Anthropological Society
Joyeeta Thakur, Monali Goswami, Subho Roy

110 Joyeeta Thakur, Monali Goswami, Subho Roy
a critical amount of fat, relative to lean body mass is necessary for initiation of menses and maintaining ovulatory func-tion (Bronson and Manning 1991; Reddy et al. 2005; Chavarro et al. 2015). Schol-ars argue that restricted positive ener-gy balance during adolescent period of growth may result into low Body Mass Index (BMI) (Petridou et al. 1996; Key et al. 2001), which subsequently attributes to the ovarian hormone levels (Kirchen-gast and Huber 2004; Miller et al. 2004; Ziomkiewicz et al. 2008). Several studies suggest that women with low body fat percentages, owing to poor-calorie intake led to several menstrual irregularities, including short duration of menstrual bleeding, infrequent periods, abnormal-ly painful periods, and even cessation of the cycle (Tena-Sempere 2007; Randhawa et al. 2016; Sherly 2017). Other studies reported a J-shaped relationship between BMI and ovulatory disorders, like pain-ful, irregular and even absence of men-struation (Parimalavalli and Sangeetha 2011; Mukherjee 2014; Jena et al. 2017). A compelling evidence comes from a ru-ral-urban study conducted among the Indian adolescents, where none of the girls with a normal BMI had symptoms of dysmenorrhea compared to those with a very low BMI, suggesting a below opti-mal functioning of the body (Madhubala & Jyoti 2013). Mukherjee et al. (2014) showed subcutaneous fat deposition and mid upper arm circumference (MUAC) remain significant determinants for ir-regular menstrual periods, skipping of menstrual cycles and number of days of menstrual discharge among the wom-en athletes. Thus, fat distribution in the body, which is an indicator of energy bal-ance may contribute in describing the menstrual characteristics of a population. Literature also suggests that an energy
deficient or low caloric diet in association with low weight and/or low fat mass may disrupt normal ovulatory function (Pirke et al. 1986). The major source of bulk of energy consists of the “nutritional trini-ty”, carbohydrate, protein and fat, which provides energy for body’s vital process-es and biosynthesis (Hoekstra 1963). Prolonged intake of low-carbohydrate diet may go about as a stressor, creating hypothalamic-pituitary-adrenal (HPA) axis dysfunction, which may encounter sporadic menstrual cycles, hypothalamic amenorrhea or menstrual disorders like premenstrual syndrome (PMS) (Jenkins et al. 2009; Mozaffarian et al. 2011; Roba et al. 2016). For instance, consumption of protein triggers energy metabolism that are under homeostatic controls (Pezesh-ki et al. 2016). Other studies reported effect of both protein and energy on ovu-lation rate (Memon et al. 1969 and How-land et al. 1966). For example, Bushman women ovulated only at a certain time of the year when food is plentiful (Vander Walt et al. 1978). In a developing coun-try like India, adolescent girls, especial-ly those belonging to socioeconomically backward community are more likely to be undernoursihed (National Institute of Nutrition 2002; Kaur et al., 2007; Choudhary et al. 2009). Therefore, the present study is an endeavour to examine the association of nutritional status with menstrual characteristics among a group of adolescent Oraon tribal population of West Bengal, India.
Materials and MethodsStudy area and participants
The present study was carried out in the Jalpaiguri district of the State of West Bengal, India. The district of Jalpaiguri is

Reproductive energetics among the Oraon 111
situated at the foothills of the Himalaya Mountains. According to the last census report, around 7,31,704 tribal (indige-nous) populations reside in this district, making it rank second with respect to the total tribal populations of this state (Jal-paiguri District Census Handbook 2011). The Oraon tribal population stands to be the largest tribal population of this dis-trict. The study area covered three Gram Panchayets (GPs) (rural administrative units), namely Rungamuttee, Damdim and Bagrakote that fall under Mal com-munity development block of the dis-trict. The GPs were selected based on the numerical dominance of Oraon tribal population.
Study participants
The Chotanagpur Plateau of India is the original abode of the Oraons. During the colonial period, the predecessors of this group of Oraons migrated to the district of Jalpaiguri and joined the tea industry as labour force (Bhowmik et al. 1996; Chaudhury and Varma 2002; Ghosh 2014). Presently, around 3, 68,413 Ora-on populations live in this district, out of which 3 1,76,929 were women (Census 2011).
We identified 307 adolescent girls [World Health Organizations (WHO) 1989] from the selected GPs, who ful-filled the criteria of our study by a door to door survey. The following were the criteria set for selecting our study par-ticipants: aged between 10 and 19 years, but attained menarche at least two years prior to the date of study, not reported to have suffered from any major gynaeco-logical health problems and did not have any experience of sexual intercourse. Out of total 307 individuals, data from six participants could not be collected
since two of them did not volunteer to participate at the time of collection of anthropometric data, three of them latter revealed about their sexual relationship and one was dropped for not being able to recall the food items consumed on the day preceding the day of the interview. Finally, data were collected from 301 Or-aon adolescent girls.
Methods of data collection
A pre-tested structured schedule was used to collect information about their socio-demographic profile, menstrual characteristics and dietary intake. An-thropometric measurements were taken using standard protocol (Lohman et al. 1988).
Data Types
Socio-demographic data include age of the participants (in years) at the time of interview, educational and occupation-al status of the participants and of their parents, types of family and per capita monthly household expenditure [in Indi-an National Rupees (INR)]. Education-al status was categorised as non-literate (never received any formal education), up to primary level (completed formal education up to standard four), up to up-per-primary level (completed formal ed-ucation up to standard eight), up to sec-ondary level (completed formal education up to standard ten), above secondary lev-el (received formal beyond standard ten). Menstrual characteristics included age at menarche, menstrual years (years passed since menarche), duration of menstrual discharge (number of days during which menstrual blood is discharged), num-ber of days of peak discharge (number of days during which maximum amount

112 Joyeeta Thakur, Monali Goswami, Subho Roy
of menstrual blood is discharged, as per-ceived by the participant), type of men-strual discharge (scanty, moderate and heavy amount of menstrual bleeding, as perceived by the participant), menstrual cycle length (in days) (period between the first day of menstrual bleeding and the day immediately prior to the next menstrual bleeding), regularity in men-strual periods(menstruation that took place on a monthly basis at a specific in-terval of time), skipping of cycle (skip-ping of menstrual cycle during a particu-lar month or for some months) and the longest time without menstrual bleeding (following the record of skipping of men-strual cycle, the longest duration of the month or months reported of not experi-encing any menstrual bleeding).
Data on duration and type of men-strual discharge, number of days of peak discharge and regularity of the menstrual cycle were collected on the basis of the re-porting of the last three episodes of men-struation prior to the date of interview. Menstrual cycle length was estimated by calculating the mean value of the last three episodes of menstrual cycle length prior to the date of interview. Skipping of menstrual cycle(s) and the longest report-ed time without the menstrual bleeding was recorded on the basis of the history of the last one year period prior to the date of interview. Menstrual disorders includ-ed PMS and dysmenorrhea. PMS include symptoms like anxiety or irritation, mood swing, depression, insomnia, lack of in-terest in social interaction and difficulty in concentration, abdominal pain, mus-culoskeletal pain, fluid retention, breast tenderness, food craving, loss of appetite, digestive disorders, fatigue, dizziness and oily skin and acne. Dysmenorrhea was considered as painful abdominal cramp-ing, musculoskeletal pain (muscle, joints,
hips and pelvic pain, as assessed by the participants) at the time of menstrual bleeding. The participants were asked to recall if they have experienced any PMS and or dysmennorrhea related symptoms during the last three months period prior to the date of interview. Age at menarche was ascertained by asking the exact date, if couldn’t recall, then the nearest month. Most of the participants recalled the menarcheal age by referring to their for-mal educational standards, i.e. in which class they studied at the time of onset of first menstrual bleeding. Few of the par-ticipants, who dropped their formal edu-cation prior to the reaching of menarche, recalled the exact year and the month by referring to certain memorable landmark events or some festivals around that time. Nutritional status of the participants was assessed by using anthropometric vari-ables and dietary intake. Anthropomet-ric variables like height (m), mid upper arm circumference (MUAC) (m), waist circumference (WC) (m) and hip circum-ference (HC) (m) were measured using standard protocol (Lohman et al. 1988). Height was measured using anthropome-ter. The participants were asked to stand erect, look straight on a levelled surface with heels together and toes apart, bare-foot and with head oriented in the Frank-fort horizontal (FH) plane. MUAC was measured with non stretched measuring tape by asking the participant to flex the bicep muscle while the tape was wrapped around the flexed bicep gently in the midway between the tip of acromian and olecranon process. WC was measured at a point midway between the lower border of the ribs and the highest point of iliac crest using the same non-stretchable tape in horizontal position, with the subject standing erect and looking straight for-ward. HC was also measured by applying

Reproductive energetics among the Oraon 113
the tape at the point yielding the maxi-mum circumference or the widest part over the buttocks, between the greater trochanter (top of the thigh bone) and the lower buttock level, with the partic-ipant’s legs together. Body weight (kg) and percent body fat (PBF) were record-ed from the Omron Body Composition Monitor (model HBF-375) following the standard technique provided in the in-struction manual. The participants were made to stand on barefoot on Omron Body Composition Monitor with extend-ed arms straight at a 90°angle to the body. The digital display of the monitor showed the body weight (kg) and percent body fat (PBF) of the participants.
Anthropometric indices
– Body mass index (BMI) was calculat-ed by using the standard formula: BMI (kg/m2) = Weight (kg)/Height2 (m2). BMI was classified based on their age following the classification of WHO (1996): a BMI less than 5th percentile was classified as ‘underweight’, 5th to <85th percentile as ‘healthy weight’, 85th to <95th percentile as overweight and ≥95th percentile as obese. The participants were categorised into ‘underweight’ and ‘‘healthy weight’’. The participants under ‘‘healthy weight’’ category includes all those whose BMI values fall are 5th percen-tile and beyond.
– Waist-hip ratio (WHR) was calculat-ed (WHO 2000) using the formula: WHR = WC (m)/HC (m).
– The following equations of VanItallie et al. (1990) were utilized to assess the proportion of Fat mass (FM) and Fat mass index (FMI):
– (i) FM (kg) = (PBF/100) × weight (kg); (ii) FMI (kg/m2) = FM (kg) /Height2 (m2).
Assessment of energy, carbohydrate, protein and fat consumption
Dietary intake of the participants was assessed using 24 hour recall method. Participants were asked to report the types of food items consumed on the day immediately preceding the date of data collection. We did not include the partic-ipants who were on sick diet or attend-ed feast on the day preceding the date of study. Daily intake of both cooked and uncooked food items (gram/day) were collected using ‘portion size’ method as suggested in National Institute of Nu-trition (NIN) (2011) dietary guidelines. While measuring the raw uncooked food ingredients, pictures of different portion sizes of various raw food items (snapped from the local market) were presented before the participants and for the cooked items, standard measuring “cups” (of various sizes) were used.
Intake of raw equivalents of different foods for each major consumed item by the participant on the preceding day of interview was calculated using the fol-lowing formulae (NIN 2009).
conversion factor (CF) for a given
ingredient in a preparation
=
weight of that raw food used in the
preparationtotal cooked quan-
tity of that
raw equivalent of a given food ingredient con-
sumed by an individual
=
conversion factor of the food item
×volume of cooked food consumed
114 Joyeeta Thakur, Monali Goswami, Subho Roy
Later, all the consumed raw foods were converted to weight (grams) on the basis of density (Food and Agriculture Organization, FAO)/In foods density da-tabase version 2.0, 2012) and thereafter assessment were made on the amount of carbohydrate (grams), protein (grams), fat (grams) and energy (Kcal) of each raw food item based on the NIN guide-line (2017). We did not find the refer-ence of conversion of some of the food items reported to have been consumed by the participants following NIN guide-line (2017). In such cases we followed the references of conversion described by Ghosh-Jerath (2015) and Verma et al. (2015). The total energy consumption by a participant was estimated by summing the amount of carbohydrate, protein and fat, derived from the consumed food items by the participants on the day pre-ceding the date of interview. The entire data were collected by one of the authors (JT) during the winter months, Novem-ber to February, 2016–2018. These four winter months were chosen to minimise the seasonal variation in food intake.
Statistical analysis
Descriptive statistics were used to esti-mate the socio-demographic as well as nutritional status of the participants. We examined the distribution of the contin-uous data using the Kolmogorov-Smirn-ov test and found that the variables like age of the participants at the time of in-terview, age at menarche, menstrual du-ration, number of days of peak discharge, menstrual cycle length followed normal distribution and hence mean and standard deviation values of these variables were calculated. Variables like weight, MUAC, BMI, PBF, FMI, WHR resting metabolism, consumption quantity of carbohydrate,
protein and fat, total calorie intake and monthly household expenditure showed skewed distribution; therefore the median values along with its lower and upper lim-its were estimated for these variables. So-cio-demographic factors like educational status of the participants and that of their parents, occupational types of their par-ents, family type and menstrual character-istics of the participants (like menstrual discharge, regularity in the menstrual cycle, skipping of menstrual cycle, PMS and symptoms related to dysmenorrhoea) were expressed in frequency and percent-age values. Bivariate statistics, like inde-pendent sample t-test and chi square test were used to examine the association of ‘underweight’ and ‘healthy weight’ cate-gories with menstrual characteristics that are categorical in nature. Stepwise linear regression was applied to find out the de-terminants of menstrual cycle length, du-ration of menstrual discharge and number of days of peak menstrual discharge. The significant associates of the final model were presented in the result. For all the dependent variables, socio-demograph-ic factors parameters (educational status of the participants and of their parents, occupational types of the parents and monthly household expenditure); men-strual characteristics (age at menarche, menstrual years, duration of bleeding, number of days of peak discharge, cycle length, irregularity of periods, skipping of cycle, PMS and dysmenorrhoea); an-thropometric variables (MUAC, BMI, PBF, FMI and WHR); and nutrient intake (consumption quantity of carbohydrate, protein and fat) were considered as the independent associates. The collinearity between the independent variables was measured with the help of condition in-dex. Stepwise logistic regression (back-ward conditional) was applied to identify

Reproductive energetics among the Oraon 115
the determinants of irregular menstrual cycle, skipping of cycle, experience of any PMS and dysmenorrhoea. We used the same independent variables (as used in stepwise linear regression model) as the possible associate variables. The analyses of the data were done using the Statistical Package for Social Sciences version18.0 (SPSS Inc., Chicago IL, USA). And p-val-ues less than equal to 0.05 (two-tailed) were considered statistically significant.
Ethical considerations
Prior to data collection, the purpose and nature of the study were explained to the participants. The study was approved by Institutional Ethical Committee, Univer-sity of Calcutta (026/17-18/1699).
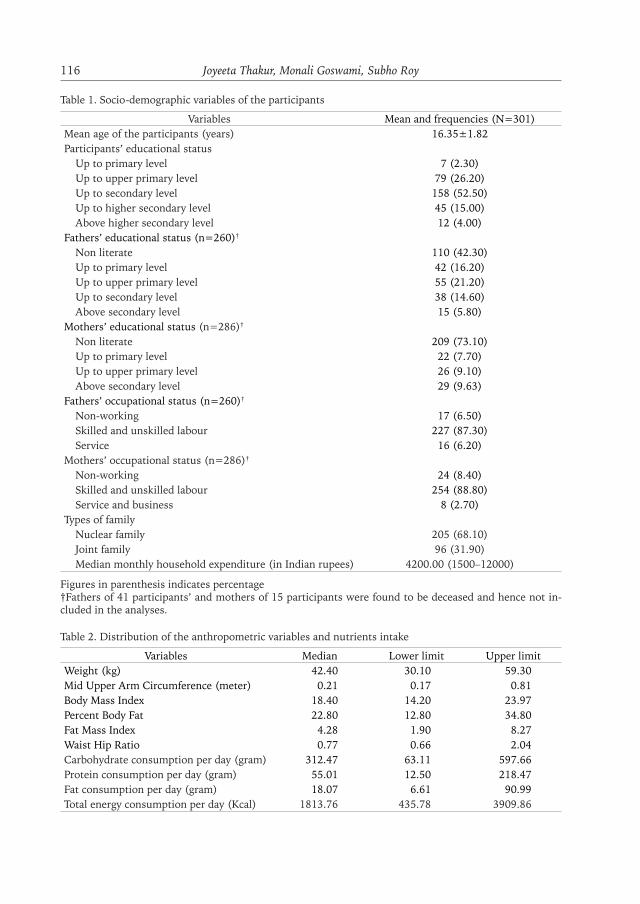
ResultsSocio demographic status of the partici-pants shows that participants were aged between 14 and 19 years, with the mean age of 16.35± 1.82 years. Half of the par-ticipants studied up to secondary level and one fourth of them up to primary level. Most of the parents of the partic-ipants were non literate and were en-gaged as skilled/unskilled labours in tea production industry. The median month-ly household expenditure was found to be 4200.00 INR (Table 1). The median values of MUAC, BMI and percent body fat (PBF) showed that the participants were on the edge of undernourishment. The median values of consumption of macronutrients like carbohydrate, pro-tein and fat were 312.47 gm, 55.01 gm and 18.07 gm respectively and the medi-an intake of daily energy was found to be inadequate than that of the required and recommended daily allowances (RDA) (Table 2). The relationship between BMI
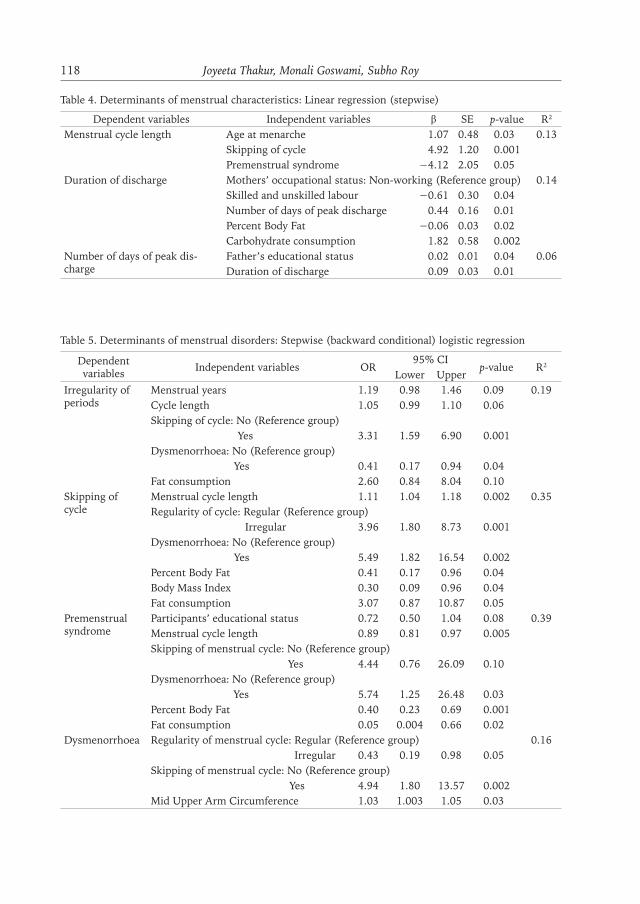
and menstrual characteristics (Table 3) shows that the mean age at menarche was slightly higher among the ‘under-weight’ participants compared to that of their ‘healthy weight’ counterparts. The lowest and the highest ages at menarche were 11 years and 16 years respectively (irrespective of their BMI status). The mean duration of the menstrual bleeding (days) was similar for both the groups but the mean duration of days for peak discharge tended to be higher among the ‘healthy weight’ participants com-pared to those who were ‘underweight’. ‘Healthy weight’ participants had com-paratively shorter mean interval between two consecutive menstrual cycles than that of their ‘underweight’ counterparts. While majority of the ‘healthy partici-pants’ experienced irregular period, the incidence of skipping of menstrual cycle and duration of absence of menstrual pe-riod (for more than two months) were higher among the ‘underweight’ partici-pants . None of the menstrual character-istics has been found to differ significant-ly between ‘underweight’ and ‘‘healthy weight’’ participants. The same table also shows that the prevalence of PMS and dysmenorrhoea were high among all the participants; however, the prevalence of PMS was higher among the ‘healthy participants’ than the ‘underweight par-ticipants’. Barring the prevalence of two of the dysmenorrhoeal symptoms (ab-dominal pain and musculoskeletal pain), vaginal pain during passing of urine was significantly higher among the ‘healthy participants’ compared to the ‘under-weight participants’ (p≤0.05). Linear regression analyses (Table 4) revealed that participants with increase in age at menarche (p≤0.05) and with increased incidence of skipping of menstrual cy-cle (p≤0.001) were more likely to have
116 Joyeeta Thakur, Monali Goswami, Subho Roy
Table 1. Socio-demographic variables of the participants
Variables Mean and frequencies (N=301)Mean age of the participants (years) 16.35±1.82Participants’ educational status Up to primary level 7 (2.30) Up to upper primary level 79 (26.20) Up to secondary level 158 (52.50) Up to higher secondary level 45 (15.00) Above higher secondary level 12 (4.00)Fathers’ educational status (n=260)†
Non literate 110 (42.30) Up to primary level 42 (16.20) Up to upper primary level 55 (21.20) Up to secondary level 38 (14.60) Above secondary level 15 (5.80)Mothers’ educational status (n=286)†
Non literate 209 (73.10) Up to primary level 22 (7.70) Up to upper primary level 26 (9.10) Above secondary level 29 (9.63)Fathers’ occupational status (n=260)†
Non-working 17 (6.50) Skilled and unskilled labour 227 (87.30) Service 16 (6.20)Mothers’ occupational status (n=286)†
Non-working 24 (8.40) Skilled and unskilled labour 254 (88.80) Service and business 8 (2.70)Types of family Nuclear family 205 (68.10) Joint family 96 (31.90) Median monthly household expenditure (in Indian rupees) 4200.00 (1500–12000)
Figures in parenthesis indicates percentage†Fathers of 41 participants’ and mothers of 15 participants were found to be deceased and hence not in-cluded in the analyses.
Table 2. Distribution of the anthropometric variables and nutrients intake
Variables Median Lower limit Upper limitWeight (kg) 42.40 30.10 59.30Mid Upper Arm Circumference (meter) 0.21 0.17 0.81Body Mass Index 18.40 14.20 23.97Percent Body Fat 22.80 12.80 34.80Fat Mass Index 4.28 1.90 8.27Waist Hip Ratio 0.77 0.66 2.04Carbohydrate consumption per day (gram) 312.47 63.11 597.66Protein consumption per day (gram) 55.01 12.50 218.47Fat consumption per day (gram) 18.07 6.61 90.99Total energy consumption per day (Kcal) 1813.76 435.78 3909.86

Reproductive energetics among the Oraon 117
longer menstrual cycle length. But re-verse is the relationship between men-strual cycle length and incidence of PMS (p≤0.05). Similarly, duration of menstru-al discharge was found to be significant-ly associated with factors like mothers’
occupational status (p≤0.05), number of days of peak discharge (p<0.01), PBF (p≤0.05) and consumption of carbo-hydrate (p<0.01). Number of days of peak discharge on the other hand, was significantly associated with fathers’ ed-
Table 3. Distribution of participants for reported menstrual variables against Body Mass Index status
Variables ‘Underweight’n=60
‘Healthy weight’n=241
t-value, χ2
p-valueMean age at menarche (years) 13.32±1.21 13.29±1.15 t =0.16, p=0.88Median age at menarche (years) 13.00 (11–16)ψ 13.00 (11–16)ψ –Mean Length of the menstrual cycle (days) 30.30±7.08 29.94±7.01 t=0.36, p= 0.67Mean duration of menstrual bleeding (days) 4.37±1.30 4.37±1.33 t=0.01, p= 0.70Mean number of days of peak discharge 1.43±0.59 1.47±0.67 t=0.42, p= 0.36Menstrual flow on peak discharge days
Light 0 (0.00) 4 (1.66)χ2= 1.27, p=0.53Medium 20 (33.33) 71 (29.46)
Heavy 40 (66.67) 166 (68.88)Skipping of cycle (last one year) 20 (33.33) 77 (31.95) χ2=0.02, p=0.55Longest time without menstrual bleeding (months) 2.13±1.56 1.75±1.45 t =0.99, p=0.43
Irregularity in menstrual cycle 17 (28.33) 76 (31.54) χ2= 0.23, p=0.76Premenstrual syndrome (PMS) 50 (83.33) 220 (91.29) χ2= 3.29, p=0.09Anxiety/depression 26 (52.00) 113 (51.36) χ2=0.01, p=0.94Anger/irritability 16 (32.00) 86 (39.09) χ2=0.87, p=0.35Mood swing 13 (26.00) 81 (36.82) χ2=0.14, p=0.71Insomnia 10 (20.00) 61 (27.73) χ2=1.26, p=0.26Lack of interest in social interaction 17 (34.00) 74 (33.64) χ2=0.02, p=0.96Difficulty in concentration 20 (40.00) 100 (45.45) χ2=0.49, p=0.48Abdominal pain 26 (52.00) 124 (56.36) χ2=0.31, p=0.58Musculoskeletal pain 28 (56.00) 110 (50.00) χ2=0.59, p=0.44Fluid retention 12 (24.00) 34 (15.45) χ2=2.11, p=0.15Brest tenderness 11 (22.00) 34 (15.45) χ2=1.26, p=0.26Food craving 17 (34.00) 70 (31.82) χ2=0.09, p=0.77Loss of appetite 19 (38.00) 63 (28.64) χ2=1.69, p=0.19Digestive disorders 13 (26.00) 49 (22.27) χ2=0.32, p=0.57Fatigue 18 (36.00) 90 (40.91) χ2=0.41, p=0.52Dizziness 14 (28.00) 56 (25.45) χ2=0.14, p=0.71Oily skin/acne 16 (32.00) 66 (30.00) χ2=0.08, p=0.78Dysmenorrhoeal problems 47 (78.33) 188 (78.01) χ2= 0.003, p=0.96Abdominal pain 41 (87.23) 154 (81.05) χ2=0.75, p=0.39Musculoskeletal pain 47 (100.00) 182 (95.79) χ2=1.54, p=0.22Vaginal pain during and after passing urine 11 (23.40) 73 (38.42) χ2=3.90, p ≤ 0.05
Figures in parenthesis indicates percentage.ψ – median values with upper and lower limits in parenthesis.
118 Joyeeta Thakur, Monali Goswami, Subho Roy
Table 4. Determinants of menstrual characteristics: Linear regression (stepwise)
Dependent variables Independent variables β SE p-value R2
Menstrual cycle length Age at menarche 1.07 0.48 0.03 0.13Skipping of cycle 4.92 1.20 0.001Premenstrual syndrome −4.12 2.05 0.05
Duration of discharge Mothers’ occupational status: Non-working (Reference group) 0.14Skilled and unskilled labour −0.61 0.30 0.04Number of days of peak discharge 0.44 0.16 0.01Percent Body Fat −0.06 0.03 0.02Carbohydrate consumption 1.82 0.58 0.002
Number of days of peak dis-charge
Father’s educational status 0.02 0.01 0.04 0.06Duration of discharge 0.09 0.03 0.01
Table 5. Determinants of menstrual disorders: Stepwise (backward conditional) logistic regression
Dependent variables Independent variables OR
95% CIp-value R2
Lower UpperIrregularity of periods
Menstrual years 1.19 0.98 1.46 0.09 0.19Cycle length 1.05 0.99 1.10 0.06 Skipping of cycle: No (Reference group) Yes 3.31 1.59 6.90 0.001 Dysmenorrhoea: No (Reference group) Yes 0.41 0.17 0.94 0.04 Fat consumption 2.60 0.84 8.04 0.10
Skipping of cycle
Menstrual cycle length 1.11 1.04 1.18 0.002 0.35Regularity of cycle: Regular (Reference group) Irregular 3.96 1.80 8.73 0.001Dysmenorrhoea: No (Reference group) Yes 5.49 1.82 16.54 0.002 Percent Body Fat 0.41 0.17 0.96 0.04 Body Mass Index 0.30 0.09 0.96 0.04 Fat consumption 3.07 0.87 10.87 0.05
Premenstrual syndrome
Participants’ educational status 0.72 0.50 1.04 0.08 0.39Menstrual cycle length 0.89 0.81 0.97 0.005 Skipping of menstrual cycle: No (Reference group) Yes 4.44 0.76 26.09 0.10 Dysmenorrhoea: No (Reference group) Yes 5.74 1.25 26.48 0.03 Percent Body Fat 0.40 0.23 0.69 0.001 Fat consumption 0.05 0.004 0.66 0.02
Dysmenorrhoea Regularity of menstrual cycle: Regular (Reference group) 0.16 Irregular 0.43 0.19 0.98 0.05 Skipping of menstrual cycle: No (Reference group) Yes 4.94 1.80 13.57 0.002 Mid Upper Arm Circumference 1.03 1.003 1.05 0.03

Reproductive energetics among the Oraon 119
ucational status (p≤0.05) and duration of discharge (p<0.01). The R2 values could explain 13%, 14% and 6% of the variance for menstrual cycle length, du-ration of discharge and number of days of peak discharge respectively. Results of the final step of logistic regression (stepwise backward elimination) (Table 5) shows that the likelihood of having irregular periods significantly increased among those with history of skipping of menstrual cycle (OR 3.31, p=0.001), but significantly decreased among those with history of dysmenorrhoea (OR=0.41, p=0.04). In addition, the likelihood of skipping menstrual cycle significant-ly increased with increase in menstrual cycle length (OR=1.11, p=0.002), for those with history of irregular men-strual cycle (OR=3.96, p=0.001) and dysmenorrhoea (OR=5.49, p=0.002) and with regularl dietary fat consump-tion (OR=3.07, p=0.05); however, the trend is reversed with an increase in PBF (OR=0.41, p=0.04) and BMI (OR=0.30, p=0.04). Regression analysis further shows menstrual problems like the chance of experiencing PMS significant-ly increased among those with history of dysmenorrhoea (OR=5.74, p=0.03), but decreased with increase in menstrual cycle length (OR=0.89, p=0.005), PBF (OR=0.40, p=0.001) and fat consump-tion (OR=0.05, p=0.02). The incidence of dysmenorrhea significantly increased with increase in skipping of menstrual cycle (OR=4.94, p=0.002) and MUAC (OR=1.31, p=0.03), but decreased among those with irregular menstrual cycle (OR=0.43, p=0.05). The R2 values indicate that the models could explain 19%, 35% 39% and 16% of the variance for irregularity of periods, skipping of cycles, PMS and dysmenorrhoea respec-tively.
Discussion
From the perspective of life history the-ory, energetic trade-offs between repro-ductive functions and other metabolic allocations for survival is the central understanding of ‘reproductive effort’ (Stearns 1992; Ellison 2003). It is argued that ovarian functions, in terms of pro-duction of major steroid hormones that controls the ovarian cycle are sensitive to energy availability (Ellison 2001). In India, almost a quarter of the popula-tion comprises adolescents (Agarwal et al., 2010) and 47 per cent of them are undernourished [United Nations Chil-dren’s Fund (UNICEF 2011)]. Studies also show that reproductive morbidity is higher among these undernourished adolescents (Dasgupta et al. 2008; Mo-hite et al. 2013). This problem is more pronounced among the adolescents hail-ing from socially backward groups like scheduled castes and tribes, who are the worst sufferer of the ravages of energy deficiency (NIN, 2002). Our study clear-ly indicates nutritional energy deficiency among the Oraon adolescent participants in terms of daily energy consumption (deficient by 21% from the recommend-ed dietary allowances suggested by NIN 2010), body fat (median is on the edge of ‘critical fat value’ for normal ovulato-ry functions: Frisch et al. 1973) and BMI (median is on the edge of being ‘under-weight’: WHO 1996).
The effect of restricted energy avail-ability on menstrual functions appears to be burdensome when energetic con-straints are high (Bullen et al. 1985; Prior et al. 1982). The fat cells release leptin hormone, which is required at a specific level to send signal to the hypothalamus for carrying out menstrual activity (Ob-ert et al. 2016; Osman 2016). Individuals
120 Joyeeta Thakur, Monali Goswami, Subho Roy
with low body fat percentages potentially cause hormonal disturbance, leading to leading to longer menstrual cycles, irreg-ular periods, painful periods and even ces-sation of the cycle (Tena-Sempere 2014; Randhawa et al. 2016; Sherly 2017). For example, lower level of body mass due to negative energy balance will cause low levels of estradiol and therefore interrup-tion in menstrual cycle length (Kirchen-gast and Huber 2004; Miller et al. 2004; Ziomkiewicz et al. 2008). In the same vein, we also found that ‘underweight’ participants have longer cycle length and more frequently skipped their cycle than that of the ‘healthy weight’ participants. Alongside, we also found percent body fat (PBF) as well as BMI decreased the chance of menstrual cycle skipping.
It may be argued that nutritional fac-tors do play a role in the maturation of hy-pothalamic–pituitary–ovarian axis (Tre-loar et al. 1967; Vollman 1977), which in turn regularize the cycle length. The ef-fect of unbalanced nutrition on the men-strual cycle has largely been investigated in epidemiological studies. For example, a low caloric diet may rapidly create dis-turbances in the pulsatility of gonado-trophic hormones, thereby induce cycle disorders and ovarian dysfunction (Pirke et al. 1986; Frisch 1978, 1988; Schweiger et al. 1987). But our study denotes that irregularity in periods was comparative-ly high among the ‘healthy weight’ than that of the ‘underweight’ participants, which is consistent with the finding of a Bangladesh based study (Hossain et al. 2011). We also found dietary fat con-sumption is inversely related to skipping skipping of menstrual cycle. A high lev-el of body fat storage due to the intake of higher amount of dietary fat may de-crease the excretion of urinary proges-terone metabolite and reduce serum and
urinary luteinizing hormone (LH) levels. This may subsequently affect the normal functioning of ovary, oocyte, and corpus luteum leading to skipped cycle (Kuok-kanen et al. 2016).
The results of our study show that percent body fat and carbohydrate intake remained significant associates of dura-tion of menstrual discharge as found by Stokic et al. (2005). According to ‘Frisch hypothesis’, a critical amount of fat is necessary not only for menarche (17% body fat), but also to maintain normal menstrual periodicity (22% body fat) (Frisch et al. 1973; Frisch 1976). During each menstrual cycle, endometrium pro-liferates to develop high secretary capac-ity and an elaborate microvasculature (Johnson and Everitt, 1988; Ferin et al. 1993). Continuous metabolism of ener-gy is required to sustain the process of endometrium proliferation (Price et al. 1981; Strassmann et al. 1996, 1997). Therefore, energetic source like carbo-hydrate plays a crucial role for duration of menstrual bleeding. A large number of participants have experienced PMS, especially those who are from ‘healthy weight’ category, contradicting the coun-try’s scenario which denotes 20% preva-lence of PMS in India (Joshi et al. 2010). However, Nourjah (2008) observed that the intensity of PMS may vary and as many as 80% of women of reproduc-tive age may experience premenstrual emotional and physical changes. Our study revealed the lowered risk of PMS with increasing dietary fat consumption, which supports some previous results (Houghton 2016 and Gold et al. 2007). PMS and attribution of dietary fat also denotes a duel hypothesis. During the luteal phase of menstrual cycle, the de-mand for energy increases for individu-als with PMS due to a rise in metabolic
Reproductive energetics among the Oraon 121
rate (Vlitos and Davies 1996; Bussell 2014). It is well known that dietary fats provide a source of energy and a source of essential fatty acids like, omega-3 and omega-6 (Lee 1997). Studies also sug-gest that some women with premen-strual syndrome have elevated prolactin levels and few of them are abnormally sensible to normal quantities of pro-lactin (Horrobin 1983 and Filho et al. 2011). Prostaglandin E1, derived from dietary essential fatty acids, is able to at-tenuate the biologic actions of prolactin and that in the absence of prostaglandin E1 prolactin has exaggerated effects re-sulting in PMS. On the contrary, most of the literature including Nagata et al. (2004) and American College of Ob-stetricians and Gynaecologists (2015) recommend reducing fat intake to treat PMS. Dietary fats may affect a woman’s cytokine, hormone levels (Houghton and Bertone-Johnson 2015) and also act as pro-inflammatory factors increasing C-reactive protein (CRP) concentrations (Aeberli et al. 2006; Santos et al. 2013). A higher CRP and other inflammatory cytokine levels may cause PMS (Ber-tone-Johnson et al. 2014; Houghton et al. 2017). Although the aetiology of PMS has not been elucidated, yet it has been suggested that PMS is multifactorial and risk factors like age, family history, life-style and consumption of micronutrients may also determine the experience of PMS (Kandeepan et al. 2013; Mohamad-irizi and Kordi 2015). Many researchers suggested that vitamin rich food may reduce premenstrual symptoms like ir-ritability, constipation and edema that may rise days before the onset of men-struation (Bendich 2000; Niemeier et al. 2006). Our study participants, ow-ing to their socioeconomic and cultur-al background mostly consume leafy
vegetables [rai saag (Brassica juncea), pui saag (Basella alba), kochu saag (Co-locasia anti-quorum), muli saag (Raphanus sativus), palang saag (Spinacia oleracea), beng saag (Centella asiatica), muchari saag (Hygrophila polysperma), bhatua saag (Chenopodium album), katai saag (Vangue-ria spinosus), kukri saag (Dryopteris co-chleata)] that are enriched with vitamins and micronutrients (data not present-ed). These leafy vegetables are abundant in the locality, and the consumption of these food items may be linked with the aetiology of PMS. The most widely ac-cepted explanation for the pathogenesis of primary dysmenorrhea is the over-production of uterine prostaglandins. Enhanced release of prostaglandins, al-legedly from disintegrating cells during endometrial sloughing, is believed to cause myometrial hypercontractility, re-sulting in ischemia and hypoxia of the uterine muscle, and, ultimately, men-strual pain (Dawood 1987; Iacovides et al. 2015). A complex interaction be-tween both low and high body fat and steroid hormones attributes to dysmen-orrhoea (Scott and Johnston 1982; Ju et al. 2015). Our result connotes a higher prevalence of dysmenorrhea among the ‘underweight’ participants compared to ‘healthy weight’ corroborating with the existing literature (Chauhan and Kala 2012; Hirata et al. 2002 and Tang-chai et al. 2004). Perhaps progesterone affects the synthesis of prostaglandins and their attachment to myometrium re-ceptors (Wang et al. 2004). A low level of energetic balance may alter the level of sexual steroid hormones and there-by disrupt the function of hypothalam-ic-pituitary-ovarian axis (Gagua et al. 2012), causing menstrual pain (Bajalan et al. 2019). Multivariate analyses of our study revealed an increased risk of dys-
122 Joyeeta Thakur, Monali Goswami, Subho Roy
menorrhoea with an increase in MUAC. Many studies (Craig et al. 2014; Cha-put et al. 2016; Jaiswal et al. 2017) have suggested increased MUAC as an indi-cator of obesity, thus a higher energetic balance. It has been hypothesised that adiposity may influence endometrial thickness by its estrogen-mediated effect (Jungheim et al. 2012). Studies show that an increase in body weight reduces sex-hormone binding globulin (SHBG). The function of SHBG is to bind oestro-gen. A reduced SHBG elevates serum oestrogen level, which in turn prompts proliferation of endometrial tissues that produce prostaglandins, resulting in dysmenorrhea (Barnard etal. 2000; Ju et al. 2015). The crossover clinical trial by Barnard et al. (2000) also found that an intervention with a low fat vegetarian diet during two consecutive menstrual cycles’ diminished duration and severity of dysmenorrhea.
The findings of the present study should be viewed under certain limita-tions. Data on energy expenditure by means of physical activity would have provided a better picture of energy avail-ability of the participants and its effect on menstrual functions. Since ovarian functions are energetically demanding for a human female, menstrual cycle is expected to be sensitive to the factors influencing energy availability and me-tabolism. Therefore, any alteration in the energetic homeostasis is closely asso-ciated with the changes in reproductive axis. Our study reinforces this concept that energy availability determines the menstrual characteristics. Thus, trading off energy allocation to reproductive ef-fort, especially for the vulnerable group like tribal adolescents, are likely to affect their continuum of ovarian function (El-lison 2008).
Acknowledgements
We are indebted to all the study partic-ipants who have volunteered to partici-pate in the study. We are also thankful to the University Grants Commission, India for providing the financial support.
Authors’ contributions
JT has contributed fifty percent by col-lecting and anlysing the data and in par-tially drafting the manuscript; MG has contributed thirty percent by drafting the manuscript; SR has contributed twenty percent by designing the study and re-viewing the manuscript.
Conflict of interest
The authors report no conflicts of inter-est.
Corresponding author
Joyeeta Thakur, Department of Anthro-pology, University of Calcutta, 35 Bal-lygunj Circular Road, Kolkata 700019, West Bengal, Indiae-mail: [email protected]
ReferencesAeberli I, Molinari L, Spinas G, Lehmann
R, l’Allemand D, Zimmermann MB. 2006. Dietary intakes of fat and antioxidant vita-mins are predictors of subclinical inflam-mation in overweight Swiss children. Am J Clin Nutr 84(4):748–55.
Agarwal AK, Agarwal A. 2010. A Study of dysmenorrhea during menstruation in ad-olescent girls. Indian J Community Med 35(1):159–64.
Bajalan Z, Alimoradi Z, Moafi F. 2019. Nu-trition as a potential factor of primary dysmenorrhea: a systematic review of ob-
Reproductive energetics among the Oraon 123
servational studies. Gynecol Obstet Invest 84(3):209–24.
Barnard ND, Scialli AR, Hurlock D, Bertron P. 2000. Diet and sex-hormone binding globulin, dysmenorrhea, and premenstru-al symptoms. Obstet Gynecol 95(2):245–50.
Bendich A. 2000. The potential for dietary supplements to reduce premenstrual syn-drome (PMS) symptoms. J Am Coll Nu-tr 19(1):3–12.
Bertone-Johnson ER, Ronnenberg AG, Houghton SC, Nobles C, Zagarins SE, Takashima-Uebelhoer BB, Faraj JL, Whit-comb BW. 2014. Association of inflam-mation markers with menstrual symptom severity and premenstrual syndrome in young women. Hum Reprod 29(9):1987–94.
Bhowmik SK. 1996. Tea plantation workers in West Bengal. In: Bhowmik SK, Xaxa V, Kalam MA, editors. Tea plantation labour in India. Electronic ed. New Delhi: Fried-rich Ebert Stiftung; p. 43–80.
Bronson FH, Manning J. 1991. The energetic regulation of ovulation: a realistic role for body fat. Biol Reprod 44(6):945–50.
Bullen BA, Skrinar GS, Beitins IZ, von Mering G, Turnbull BA, McArthur JW. 1985. In-duction of menstrual disorders by strenu-ous exercise in untrained women. N Engl J Med. 312(21):1349–53.
Bussell G. 2014. Premenstrual syndrome (PMS), food factsheet. British Dietet-ic Association (BDA). [Accessed 2019 May 05]. Available at: https://www.bda.uk.com/foodfacts/pms.pdf.
Census of India 2011. Census of India. Gov-ernment of India, New Delhi. [Accessed 2019 June 08]. Available at: http://www.censusindia.gov.in/2011census/PCA/ST.html.
Census of India 2011. District census hand-book, Jalpaiguri, West Bengal. Census of India, Government of India, New Delhi; 2011. [Accessed 2019 June 08]. Available at: http://censusindia.gov.in/2011cen-sus/dchb/1902_PART_B_DCHB_JALPAI-GURI.pdf.
Centers for Disease Control and Prevention. The BMI for age growth charts. Centers for Disease Control and Prevention. The United States Department of Health & Human Services. [Accessed 2019 June 16]. Available at: https://www.cdc.gov/growthcharts/html_charts/bmiagerev.ht-m#females.
Chaput JP, Katzmarzyk PT, Barnes JD, Fogel-holm M, Hu G, Kuriyan R, Kurpad A, Lambert EV, Maher C, Maia J et al. 2017. Mid-upper arm circumference as a screening tool for identifying children with obesity: a 12-country study. Pediatr Obes 12(6):439–45.
Charrondiere UR, Haytowitz D, Stadlmayr B. 2012. FAO/INFOODS density database. version 2.0. Food and Agriculture Orga-nization of the United Nations. Rome, It-aly. [Accessed 2019 July 12]. Available at: http://www.fao.org/3/ap815e/ap815e.pdf.
Chaudhury S, Varma N. 2002. Between gods/goddesses/demons and “science”: percep-tions of health and medicine among plan-tation laborers in Jalpaiguri district, Ben-gal. Social Scientist 30(5/6):18–38.
Chauhan M, Kala J. 2012. Relation between dysmenorrhea and body mass index in adolescents with rural versus urban vari-ation. J Obstet Gynaecol India 4(62):442–45.
Chavarro JE, Gaskins AJ, Afeiche MC. 2015. Nutrition and ovulatory function. In: Tremellen K, Pearce K, editors. Nutrition, fertility and human reproductive function. 1st ed. USA: CRC Press: Boca Raton, FL; p. 27.
Choudhary S, Mishra CP, Shukla KP. 2009. Correlates of nutritional status of adoles-cent girls in the rural area of Varanasi. The Internet J of Nutr and Wellness 7(2):1–10.
Craig E, Bland R, Ndirangu J, Reilly JJ. 2014. Use of midupper arm circumference for determining overweight and overfatness in children and adolescents. Archives of Disease in Childhood (ADC) 99(8):763–66.

124 Joyeeta Thakur, Monali Goswami, Subho Roy
Dawood MY. 1987. Dysmenorrhea and pros-taglandins. In: Gold JJ, Josimovich JB, ed-itors. Gynecologic endocrinology. 4th ed. Vol 4. New York: Plenum Publishing Cor-poration; p. 405 –421.
Della Torre S, Benedusi V, Fontana R, Maggi A. 2014. Energy metabolism and fertili-ty: A balance preserved for female health. Nat Rev Endocrinol 10(1):13–23.
Della Torre S, Rando G, Meda C, Stell A, Chambon P, Krust A, Ibarra C, Magni P, Ciana P, Maggi A. 2011. Amino acid-de-pendent activation of liver estrogen recep-tor alpha integrates metabolic and repro-ductive functions via IGF-1. Cell Metab 13(2):205–14.
Ellison PT. 2001. On fertile ground: a natural history of human reproduction. Massa-chusetts: Harvard University Press, Cam-bridge.
Ellison PT. 2003. Energetics and reproductive effort. Am J Hum Biol 15(3):342–51.
Ellison PT. 2008. Energetics, reproductive ecology and human evolution. Paleo An-thropology. p. 172−200. [Accessed 2019 May 12]. Available at: https://evolution.binghamton.edu/evos/wp-content/up-loads/2010/01/PA20080172.pdf.
Ferin M, Jewelewicz R, Warren M, 1993. The menstrual cycle: physiology, reproductive disorders and infertility. New York: Ox-ford Press.
Frisch RE, Revelle R, Cook S. 1973. Com-ponents of weight at menarche and the initiation of the adolescent growth spurt in girls: estimated total water, lean body weight and fat. Hum Biol 45(3):469–83.
Frisch RE. 1976. Critical weights, a criti-cal body composition, menarche, and the maintenance of menstrual cycles. In: Watts ES, Johnston FE, Lasker GW, edi-tors. Biosocial Interrelations in Popula-tion Adaptation. 1st ed. Paris: Moulton Press; p. 319–352.
Frisch RE. 1978 Population, food intake, and fertility. There is historical evidence for a direct effect of nutrition on reproductive ability. Science 199(4324):22–30.
Frisch RE. 1988. Fatness and fertility. Sci Am 258(3):88–95.
Gagua T, Tkeshelashvili B, Gagua D. 2012. Primary dysmenorrhea: prevalence in ad-olescent population of Tbilisi, Georgia and risk factors. J Turk Ger Gynecol Assoc 13(3):162–68.
Ghosh, B. 2014. Vulnerability, forced migra-tion and trafficking in children and wom-en: a field view from the plantation in-dustry in West Bengal. Econ and Political Wkly 49(26–27):58–65.
Ghosh-Jerath S, Singh A, Kamboj P, Gold-berg G, Magsumbol M. 2015. Traditional knowledge and nutritive value of indige-nous foods in the oraon tribal community of jharkhand: an exploratory cross-sec-tional study. Ecol Food Nutr 54(5):493–519.
Gold EB, Bair Y, Block G, Greendale GA, Har-low SD, Johnson S, Kravitz HM, Rasor MO, Siddiqui A, Sternfeld B et al. 2007. Diet and lifestyle factors associated with premenstrual symptoms in a racially di-verse community sample: study of wom-en’s health across the nation (SWAN). J Womens Health (Larchmt) 16(5):641–56.
Hirata M, Kumabe K, Inoue Y. 2002. Relation-ship between the frequency of menstrual pain and weight in female adolescents. Nihon Koshu Eisei Zasshi 49(6):510–24.
Hoekstra WG. 1963. Metabolic Interrelation-ships of Fats, Proteins and Carbohydrates. American meat science association. AM-SA-RMC Proceedings. [Accessed 2019 May 23] Available at: https://meatscience.org/publications-resources/rmc-pro -ceedings/1963 and https://meatscience.org/docs/default-source/publications-re-sources/rmc/1963/metabolic-interrela-tionships-of-fats-proteins-and-carbohy-drates.pdf?sfvrsn=1ed3bbb3_2.
Horrobin DF. 1983. The role of essential fatty acids and prostaglandins in the premenstrual syndrome. J Reprod Med 28(7):465–68.
Hossain MG, Sabiruzzaman M, Islam S, Hisyam RZ, Lestrel PE, Kamarul T. 2011. Influence of anthropometric measures

Reproductive energetics among the Oraon 125
and sociodemographic factors on men-strual pain and irregular menstrual cycles among university students in Bangladesh. Anthropol Sci 119(3):239–46.
Houghton S, Bertone-Johnson ER. 2015. Macronutrients and premenstrual syn-drome. In: Berhardt LV, editor. Advances in medicine and biology. Vol. 87. New York: Nova Science Publishers, Inc. Haup-pauge; p. 137–156.
Houghton SC. 2016. Macronutrients and the risk of premenstrual syndrome [doctoral dissertations]. Massachusetts: Universi-ty of Massachusetts Amherst. [Accessed 2019 May 23]. Available at: https://pdfs.semanticscholar.org/bda3/a2f766cf3a1e-61ccef0a0090442630f8bb5d.pdf.
Howland BE, Kirkpatrick RL, Pope AL, Casi-da LE.1966. Pituitary and ovarian func-tion in ewes fed on two nutritional levels. J Anim Sci 25(3):716–21.
Iacovides S, Avidon I, Baker FC. 2015. What we know about primary dysmenorrhea to-day: a critical review. Hum Reprod Update 21(6):762–78.
Jaiswal M, Bansal R, Agarwal A. 2017. Role of mid-upper arm circumference for de-termining overweight and obesity in chil-dren and adolescents. J Clin Diagn Res 11(8):SC05–SC08.
Jena P, Panda J, Mishra A, Agasti N. 2017. Menstrual pattern and Body Mass Index in adolescent school girls; a cross-section-al study. Global Journal for Research Anal-ysis (GJRA) 6(6):29–31.
Jenkins DJ, Wong JM, Kendall CW, Esfahani A, Ng VW, Leong TC, Faulkner DA, Vid-gen E, Greaves KA, Paul G et al. 2009. The effect of a plant-based low-carbohy-drate (“Eco-Atkins”) diet on body weight and blood lipid concentrations in hy-perlipidemic subjects. Arch Intern Med 169(11):1046–54.
Johnson MH, Everitt BJ. 1988. Essential re-production. 3rd ed. Oxford: Blackwell Sci-entific, United Kingdom.
Johnson S, Weddell S, Godbert S, Freundl G, Roos J, Gnoth C. 2015. Development of the first urinary reproductive hormone
ranges referenced to independently de-termined ovulation day. Clin Chem Lab Med 53(7):1099–108.
Joshi JV, Pandey SN, Galvankar P, Gogate JA. 2010. Prevalence of premenstrual symp-toms: preliminary analysis and brief re-view of management strategies. J Midlife Health 1(1):30–34.
Ju H, Jones M, Mishra GD. 2015. A U-shaped relationship between body mass index and dysmenorrhea: a longitudinal study. PLoS One 10(7):1–12.
Jungheim ES, Travieso JL, Carson KR, Mo-ley KH. 2012. Obesity and reproductive function. Obstet Gynecol Clin North Am 39(4):479–93.
Kaur TJ, Kochar GK, Agarwal T. 2007. Im-pact of nutrition education on nutrient adequacy of adolescent girls. Stud Home Comm Sci 1(1):51–55.
Key TJ, Allen NE, Verkasalo PK, Banks E. 2001. Macronutrient Metabolism Group Symposium on ‘Energy flux and cancer’: Energy balance and cancer: the role of sex hormones. Proc Nutr Soc 60:81–89.
Kirchengast S, Huber J. 2004. Body compo-sition characteristics and fat distribution patterns in young infertile women. Fertil Steril 81(3):539–44.
Kuokkanen S, Polotsky AJ, Chosich J, Brad-ford AP, Jasinska A, Phang T, Santoro N, Appt SE. 2016. Corpus luteum as a novel target of weight changes that contribute to impaired female reproductive physiol-ogy and function. Syst Biol Reprod Med 62(4):227–42.
Lee LK, Chen PC, Lee KK, Kaur J. 2006. Men-struation among adolescent girls in Ma-laysia: A cross-sectional school survey. Singapore Med J 47(10):869–74.
Leonard WR, Ulijaszek SJ. 2002. Energetics and evolution: an emerging research do-main. Am J Hum Biol 14(5):547–50.
Lohman TG, Roche AF, Martorell R. 1988. Anthropometric standardization refer-ence manual. Champaign, IL: Human Ki-netics Books, USA.
Longvah T, Ananthan R, Bhaskarachary K, Venkaiah K. 2017. Indian food compo-
126 Joyeeta Thakur, Monali Goswami, Subho Roy
sition table 2017. National Institute of Nutrition. Indian Council of Medical Re-search. Ministry of Health and Family Welfare, Govt. of India. Hyderabad. [Ac-cessed 2019 May 14]. Available at: http://ninindia.org/Downloads/IFCT%202017%20Book.pdf.
Memon GN, Antoniewicz RJ, Benevenga NJ, Pope AL, Casida LE. 1969. Some ef-fects of differences in dietary energy and protein levels on the ovary and the ante-rior pituitary gland of the ewe. J Anim Sci 28(1):57–62.
Menkes DB, Coates DC, Fawcett JP. 1994. Acute tryptophan depletion aggravates premenstrual syndrome. J Affect Disord 32(1):37–44.
Miller KK, Grinspoon S, Gleysteen S, Grieco KA, Ciampa J, Breu J, Herzog DB, Kli-banski A. 2004. Preservation of neuroen-docrine control of reproductive function despite severe undernutrition. J Clin En-docrinol Metab 89(9):4434–38.
Mohamadirizi S, Kordi M. 2013. Association between menstruation signs and anxiety, depression, and stress in school girls in Mashhad in 2011–2012. Iran J Nurs Mid-wifery Res 18(5):402–07.
Mohamadirizi S, Kordi M.2015. The relation-ship between food frequency and men-strual distress in high school females. Iran J Nurs Midwifery Res 20(6):689–93.
Mohite RV, Mohite VR, Kumbhar SM, Gan-ganahalli P. 2013. Common menstrual problems among slum adolescent girls of western Maharashtra, India. Journal of Krishna Institute of Medical Sciences Uni-versity 2(1):89–97.
Mozaffarian D, Hao T, Rimm EB, Wil-lett WC, Hu FB. 2011. Changes in di-et and lifestyle and long-term weight gain in women and men. N Engl J Med 364(25):2392–404.
Mukherjee P, Mishra S, Ray S. 2014. Menstru-al characteristics of adolescent athletes: A study from West Bengal, India. Coll An-tropol 38(3):917–923.
Myerson M, Gutin B, Warren MP, May MT, Contento I, Lee M, Pi-Sunyer
FX, Pierson RN Jr, Brooks-Gunn J. 1991. Resting metabolic rate and energy balance in amenorrheic and eumenorrheic run-ners. Med Sci Sports Exerc 23(1):15–22.
Nagata C, Hirokawa K, Shimizu N, Shimizu H. 2004. Soy, fat and other dietary factors in relation to premenstrual symptoms in Japanese women. BJOG: An Int J of Obstet and Gynaecol. 111(6):594–99.
National Institute Of Nutrition. 2009. As-sessment of diet and nutritional status of rural population and prevalence of hy-pertension and type 2 diabetes mellitus among adults: A field operational manual. National Institute Of Nutrition, Indian Council of Medical Research, Hyderabad.
National Institute of Nutrition. 2002. Di-et and nutritional status of rural popu-lation. National Nutrition Monitoring Bureau Technical Report No.21. NIN, Indian Council of Medical Research, Hy-derabad. [Accessed 2019 July 25]. Avail-able at: http://nnmbindia.org/NNMBRE-PORT2001-web.pdf.
National Institute of Nutrition. 2011. Dietary Guidelines for Indians-A Manual. NIN, In-dian Council of Medical Research, Hyder-abad. [Accessed 2019 July 25]. Available at: http://ninindia.org/DietaryGuide-linesforNINwebsite.pdf.
National Institute Of Nutrition. 2009. Nu-trient requirements and recommended dietary allowances for Indians, 2010. A Report of the Expert Group of the Indi-an Council of Medical Research. Indian Council of Medical Research, Hyderabad.
Nattiv A, Agostini R, Drinkwater B, Yea-ger KK. 1994. The female athlete triad: The interrelatedness of disordered eat-ing, amenorrhea, and osteoporosis. Clin Sports Med 13(2):405–18.
Nourjah P. 2008. Premenstrual syndrome among teacher training university stu-dents in Iran. J Obstet Gynecol India 58(1):49–52.
Obert J, Mafongoya P. 2016. Tepary bean: a climate smart crop for food and nutrition-al security. J Nutr Food Sci 6:490.
Reproductive energetics among the Oraon 127
Osman AH. 2016. Protein energy malnutri-tion and susceptibility to viral infections as zika and influenza viruses. J Nutr Food Sci 6(3):489.
Parimalavalli R, Sangeetha M. 2011. Anthro-pometric measurements and nutrient in-take of adolescent girls. Anthropologist 13(2):111–15
Petridou E, Syrigou E, Toupadaki N, Zavitsa-nos X, Willett W, Trichopoulos D. 1996. Determinants of age at menarche as early life predictors of breast cancer risk. Int J Cancer 68(2):193–98.
Pezeshki A, Zapata RC, Singh A, Yee NJ, Che-likani PK. 2016. Low protein diets produce divergent effects on energy balance. Scien-tific Reports No. 6 (article no. 25145):1–13. [Accessed 2019 May 30]. Available at: https://www.ncbi.nlm.nih.gov/pmc/articles/PMC4848496/pdf/srep25145.pdf.
Pirke KM, Schweiger U, Laessle R, Dickhaut B, Schweiger M, Waechtler M. 1986. Di-eting influences the menstrual cycle: veg-etarian versus non vegetarian diet. Fertil Steril 46(6): 1083–88.
Price PN, Duncan SL, Levin RJ.1981. Oxy-gen consumption of human endometrium during the menstrual cycle measured in vitro using an oxygen electrode. J Reprod Fertil 63(1):185–92.
Prior JC, Yuen BH, Clement P, Bowie L, Thom-as J. 1982. Reversible luteal phase changes and infertility associated with marathon training. Lancet 2(8292):269–70.
Randhawa JK, Mahajan K, Kaur M, Gupta A. 2016. Effect of dietary habits and so-cio-economic status on menstrual disor-ders among young females. Am J Biol Sci 4(3–1):19–22.
Reddy UM, Branum AM, Klebanoff MA. 2005. Relationship of maternal body mass index and height to twinning. Obstet Gynecol 105(3):593–97.
Roba KT, Abdo M, Wakayo T. 2016. Nutrition-al status and its associated factors among school adolescent girls in Adama city, cen-tral Ethiopia. J Nutr Food Sci 6(3):493.
Rocha Filho EA, Lima JC, Pinho Neto JS, Mon-tarroyos U. 2011. Essential fatty acids for
premenstrual syndrome and their effect on prolactin and total cholesterol levels: a randomized, double blind, placebo-con-trolled study. Reprod Health. 8(2):1–9.
Samieipour IS, Kiani F, Samiei-pour Y, Hey-darabadi AB, Tavassoli E, Rahim-zade R. 2016. Comparing the effects of vitamin B1 and calcium on premenstrual syndrome (PMS) among female students. Int J Pedi-atr 4(9):3519–28.
Santos S, Oliveira A, Lopes C. 2013. System-atic review of saturated fatty acids on in-flammation and circulating levels of adi-pokines. Nutr Res 33(9):687–95.
Schneider, J.E. 2004. Energy balance and re-production. Physiol Behav 81(2):289–317.
Schweiger U, Laessle R, Pfister H, Hoehl C, Schwingenschloegel M, Schweiger M, Pirke KM.1987. Dietinduced menstru-al irregularities: effects of age and weight loss. Fertil Steril 48(5):746–51.
Scott EC, Johnston FE. 1982. Critical fat, menarche, and the maintenance of men-strual cycles: a critical review. J Adolesc Health Care 2(4):249–60.
Shapira, N. 2013. Women’s higher health risks in the obesogenic environment: A gender nutrition approach to metabolic di-morphism with predictive, preventive, and personalised medicine. EPMA J 4(1):1–12.
Sherly DG, Siva-Priya DV, Rama-Swamy C. 2017. Prevalence of menstrual irregular-ities in correlation with body fat among students of selected colleges in a district of Tamil Nadu, India. Natl J Physiol Pharm Pharmacol 7(7):740–43.
Shils ME, Olson JA, Shike M. 1994. Modern nutrition in health and disease. 8th ed. Philadelphia: Lea & Febiger.
Stearns SC. 1992. The evolution of life his-tories. Oxford: Oxford University Press, London. p. 249.
Stokić E, Srdić B, Barak O. 2005. Body mass index, body fat mass and the occurrence of amenorrhea in ballet dancers. Gynecol Endocrinol 20(4):195–99.
Strassmann BI. 1996. The evolution of endo-metrial cycles and menstruation. Q Rev Biol 71(2):181–220.

128 Joyeeta Thakur, Monali Goswami, Subho Roy
Strassmann BI. 1997. Energy Economy in the Evolution of Menstruation. Evol An-thropol 5(5):157–64.
Tangchai K, Titapant V, Boriboonhirunsarn D. 2004. Dysmenorrhea in Thai adoles-cents, frequency, impact, and knowledge of treatment. J Med Assoc Thai 87(Suppl 3):S69–73.
Tena-Sempere M. 2007. Roles of ghrelin and leptin in the control of reproductive func-tion. Neuroendocrinology 86(3):229–41.
Terri K. 2008. Essentials of Pediatric Nursing. India: Wolter Kluwer Publisher.
The American College of Obstetricians and Gynecologists. 2015. Premenstrual syn-drome. [Accessed July 12]. Available at: https://www.acog.org/Patients/FAQs/Premenstrual-Syndrome-PMS.
Treloar AE, Boynton RE, Behn BG, Brown BW. 1967. Variation of the human men-strual cycle through reproductive life. Int J Fertil 12(1 Pt 2):77–126.
United Nations Children’s Fund (UNICEF). 2011. Risks and opportunities for the world’s largest national population of adolescent girls. New York: UNICEF. [Accessed 2019 May 18]. Available at: https://www.unicef.org/sowc2011/pdfs/India.pdf.
Van der Walt LA, Wilmsen EN, Jenkins T. 1978. Unusual sex hormone pattern among desert-dwelling hunter-gatherers. Clin Endocrinol Metab 46(4):658–63.
VanItallie TB, Yang MU, Heymsfield SB, Funk RC, Boileau RA. 1990. Height-normal-ized indices of the body’s fat-free mass and fat mass: potentially useful indica-tors of nutritional status. Am J Clin Nutr 52(6):953–59.
Verma A, Neerubala, Srivastava B. 2015. Nu-tritional composition and antinutritional factors in indian sorrel leaves (oxalis cornic-ulata) and its product development. World J Pharm and Pharma Sci 4(6):1641–46.
Vlitos ALP, Davies GJ. 1996. Bowel function, food intake and the menstrual cycle. Nutr Res Rev 9(1):111–34.
Vollman RF. 1977. The menstrual cycle. In: Friedman EA, editor. Major problems in
obstetrics and gynecology. Philadelphia: WB Saunders, Pa, USA; p.74–159.
Wang L, Wang X, Wang W, Chen C, Ron-nennberg AG, Guang W, Huang A, Fang Z, Zang T, Wang L et al. 2004. Stress and dysmenorrhoea: a population based prospective study. Occup Environ Med 61(12):1021– 1026.
World Health Organization (WHO). 1996. The use and interpretation of anthropom-etry. World Health Organization Expert Committee on Physical Status. Technical Report Series No. 854, World Health Or-ganization. Geneva. [Accessed 2019 May 16]. Available at: https://www.cdc.gov/nccdphp/dnpao/growthcharts/training/bmiage/page4.html.
World Health Organization (WHO). 1989. The health of youth. Document A42, Technical Discussions 2. World Health Organization. Geneva. [Accessed 2019 May 18]. Available at: apps.who.int/iris/bitstream/10665/172242/1/WHA42_TD-2_eng.pdf.
World Health Organization. 2000. Obesity: preventing and managing the global epi-demic. Report of a WHO Consultation of Obesity. Geneva, Switzerland. [Accessed 2019 May 16]. Available at: http://www.who.int/nutrition/publications/obesity/WHO_TRS_894/en/.
World Health Organization. 1986. World Health Organization multicenter study on menstrual and ovulatory patterns in adolescent girls. II. Longitudinal study of menstrual patterns in the early postmen-archeal period, duration of bleeding epi-sodes and menstrual cycles. World Health Organization Task Force on Adolescent Reproductive Health. J Adolesc Health Care 7(4):236–44.
Ziomkiewicz A, Ellison PT, Lipson SF, Thune I, Jasienska G.2008. Body fat, energy bal-ance and estradiol levels: a study based on hormonal profiles from complete men-strual cycles. Hum Reprod 23(11):2555–63.