understanding loblaws v3 · 2019-08-06 · acquired provigoand agora in 1998 notes costco...
TRANSCRIPT

Understanding Loblaws
June 2005

2
Loblaws
Understanding Loblaws
PRESENTATION STRUCTUREThis presentation is structured into three sections: a brief overview of the Canadian market, an overview of Loblaws and an analysis of Loblaws’ strategy
CanadianMarketOverview
LoblawsOverview
LoblawsStrategy

3
Loblaws
Understanding Loblaws
PRESENTATION STRUCTUREFirst, a brief overview of the Canadian market
CanadianMarketOverview

4
Loblaws
Understanding Loblaws
CANADA IS VERY SIMILAR TO AUSTRALASIA In numerous ways – population distribution, demographics, socially, culturally - Canada is very similar to Australasia (Australia + New Zealand)
100%23.8m
1%0.2mNorthern Territory
1%0.3mACT
2%0.5mTasmania
4%1.0mSouth Island
6%1.5mSouth Australia
8%1.9mWestern Australia
13%3.0mNorth Island
16%3.8mQueensland
21%4.9mVictoria
28%6.7mNew South Wales
% of PopulationPopulation
Australasia
100%31.7m
1%0.2mNorthern Territories/Nunavut/Yukon/PEI
2%0.5mNewfoundland/Labrador
2%0.8mNew Brunswick
3%0.9mNova Scotia
3%1.0mSaskatchewan
4%1.2mManitoba
10%3.2mAlberta
12%4.2mBritish Columbia
24%7.5mQuebec
39%12.3mOntario
% of PopulationPopulation
Canada
Population distribution: Canada vs. Australasian(people, millions, 2003)
85% 78%
Source: ABS; SNZ; SC; Coriolis analysis

5
Loblaws
Understanding Loblaws
POLITICAL STRUCTURECanada is composed of 14 provinces and territories, which are generally clumped into four meta-regions: Western Canada, Ontario, Quebec and Atlantic CanadaPolitical map of Canada (2004)
WesternCanada Atlantic
Canada

6
Loblaws
Understanding Loblaws
THE GREAT WHITE NORTHThe vast majority of the Canadian population is clustered in the south close to the U.S. border
Canadian population distribution by geographic location (people, millions, 1975-2005e)
Population less than 1,000
Population greater than 1,000

7
Loblaws
Understanding Loblaws
SLOW POPULATION GROWTHCanada is experiencing very low population growth of 1.1% per year
23.124.5
25.827.7
29.430.8
32.3
1975 1980 1985 1990 1995 2000 2005
Canadian population growth (people, millions, 1975-2005e)
CAGR75-05e1.1%
Source: SC; Coriolis analysis

8
Loblaws
Understanding Loblaws
STRONG GROWTH IN FOOD AWAYCanadian households are spending more money on food away, at the expense of supermarkets
72%67%
62%
28%33%
38%
1985 1995 2004
Share of Food Spending: Food at Home vs. Food Away (% of household food spending, 1985-2004)
Food at Home
Food Away
AbsoluteChange
85-04
-10%
+10%
…or effectively 0.5%/year
Source: SC; Coriolis analysis

9
Loblaws
Understanding Loblaws
TWO LARGE RETAILERSCanada has two main supermarket groups (Loblaws and Sobeys) and a number of other smaller groups
Loblaws32.2%
Sobeys15.1%
Metro7.1%
Safeway7.1%
A&P5.9%
Overwaitea4.4%
Costco4.4%
Wal-Mart3.6%
Federated Co-op1.8%
Co-op Atlantic0.9%
Other17.5%
Top 247.3%
Next 835.2%
Canadian retail grocery market share by group(% of sales, 2004)

10
Loblaws
Understanding Loblaws
23%
39%33%
38%
9%
15%18%
30%
20%
1%2%
27%18%
13%
5%
10%5%5%
4% 2%3%
4% 3% 6%
22%16% 15% 14%
West Ontario Quebec Atlantic
STRONG REGIONAL GROUPSMany of the smaller Canadian retail groups are strong regionally
Canadian retail grocery market share by group by region(% of sales, 2003)
Other
Sobeys
Loblaws
Overwaitea
Safeway
A&P Metro
100% 100% 100% 100%
Wal-MartCostco Atlantic Co-op
Federated Co-op
Source: company reports; Canadian Grocer; NBF; xarious published sources; Coriolis analysis

11
Loblaws
Understanding Loblaws
MAJOR CANADIAN SUPERMARKET GROUPSThere are a large number of strong participants in the Canadian market, including four US based retailers (Safeway, A&P, Costco and Wal-Mart)
C$1.4b
C$2.8b
C$3.4b
C$3.4b
C$4.5b
C$5.5b
C$5.5b
C$11.7b
C$24.9b
GrocerySales1
(2002)
Subsidary of Wal-MartWal-MartNational213C$9.0bPublic (WMT)
Co-opWest~300N/AFederated Co-op
Public (COST)
Private(Jim Pattison)
Public (GAP)
Public
Public(SWY)
Public (SBY) &Sobey Family
Public (L) &Weston Family
Ownership
Subsidary of Costco US
Subsidary of A&P US
Subsidary of Safeway US
Acquired Oshwa Group 1998
Acquired Provigo and Agora in 1998
Notes
Costco
OverwaiteaSave-On
A&PDominion
Food Basics
MetroSuper C
Loeb
Safeway
SobeysIGA
Price Chopper
LoblawsOthers+
Key Formats
National62US$5.2b
West177C$3.4b
Ontario176US$2.7b
QuebecOntario
1,018C$5.1b
West215US$3.5b
National1,300+C$11.0b
1,641+
# of stores
National
GeographicSpread
C$26.2b
Group Sales(in Canada)Group
1. Grocery sales includes sales of wholesale franchise and independent stores supplied by the group; excludes GM sales of Wal-Mart and CostcoSource: company reports; Canadian Grocer; NBF; xarious published sources; Coriolis analysis
Key attributes of major Canadian supermarket groups(various, 2003/4)

12
Loblaws
Understanding Loblaws
PRESENTATION STRUCTUREThis section gives an overview of Loblaws to put the company into context
CanadianMarketOverview
LoblawsOverview

13
Loblaws
Understanding Loblaws
MARKET SHARE GROWTHLoblaw has more than doubled its Canadian market share in the past decade
Loblaw16.8%
Other83.2%
Loblaw32.2%
Other67.8%
1990 2003
Loblaw’s Canadian market share growth(% of supermarket/retail food, 1990 vs. 2004)
Source: company reports; Canadian Grocer; NBF; xarious published sources; Coriolis analysis

14
Loblaws
Understanding Loblaws
SALES GROWTHLoblaw’s had a period of slow sales growth in the mid-80’s and 90’s, however, since Loblaw acquired Provigo, growth has returned
$3.5
$6.4$7.8
$8.6 $8.3 $7.9 $8.4 $8.5$9.3 $9.4
$10.0 $9.9 $9.8$11.0
$12.5
$18.8$20.1
$21.5
$23.1
$25.2$26.2
1976 1984 1985 1986 1987 1988 1989 1990 1991 1992 1993 1994 1995 1996 1997 1998 1999 2000 2001 2002 2003 2004
CAGR76-047.4%
CAGR99-046.9%
Loblaw’s group sales by year (C$, billions, 1976- 2004)
CAGR86-973.1%
Source: company reports; Coriolis analysis

15
Loblaws
Understanding Loblaws
-$50
$64 $67 $64$16
$59$89 $99
$76 $90$126
$147$174
$213$261
$376
$473
$563
$728
$845
$968
1976 1984 1985 1986 1987 1988 1989 1990 1991 1992 1993 1994 1995 1996 1997 1998 1999 2000 2001 2002 2003 2004
PROFIT GROWTHHowever, during the period of slow sales growth, Loblaw was dramatically increasing its profitability
CAGR84-0414.5%
CAGR99-0420.8%
Loblaw’s group net profit by year (C$, millions, 1976- 2004)
CAGR86-9711.1%
Source: company reports; Coriolis analysis

16
Loblaws
Understanding Loblaws
CONSISTENT PROFIT GROWTHLoblaw has delivered on steady, consistent profit margin growth over the past fifteen years
96.2% 96.2% 96.6% 96.5% 95.9% 95.4% 95.1% 94.8% 94.3% 94.2% 93.7% 93.2% 92.8% 92.6% 91.9%
3.8% 3.8% 3.4% 3.5% 4.1% 4.6% 4.9% 5.2% 5.7% 5.8% 6.3% 6.8% 7.2% 7.4% 8.1%
1990 1991 1992 1993 1994 1995 1996 1997 1998 1999 2000 2001 2002 2003 2004
Loblaw’s components of sales (% of sales, 1990- 2004)
EBITDA
COS/SG&A
AbsoluteChange
85-04
-4.3%
+4.3%
Source: company reports; Coriolis analysis

17
Loblaws
Understanding Loblaws
ACQUISITIONS AND DIVESTITURESLoblaw’s acquisitions strengthened it’s position in Canada; divestitures got it out of the U.S. market
239/109/655+ProvigoAcquisition1998
?Agora Foods / Oshawa Foods Atlantic Canada Acquisition1998
?Remaining U.S. operations (St. Louis & New Orleans)Divestiture1995
18Dominion Stores (Newfoundland)Acquisition1992
10Former Steinberg stores (Ottawa)Acquisition1992
?Fortino’s supermarket chain (Ontario)Acquisition1988
-P.J. Schmitt Co. wholesale businessDivestiture1988
40Mr Grocer franchise independent groupAcquisition1987
26Stores in St. Louis (from Kroger)Acquisition1986
250Stores in Chicago, Syracuse and California marketsDivestiture1976
# of StoresCompanyActionYear
Loblaw’s major acquisitions and divestitures since 1975 (various)
“The Company is prepared to enter new markets through the opening of new stores, as in its stated plan, to enter the Quebec market, or from focused acquisitions when opportunities arise. The Company is also prepared to exit particular markets and redeploy assets elsewhere when it is strategically advantageous to do so, as demonstrated by the disposal of the United States retail business in 1995.” Loblaw Annual Report 1996
Source: company reports; Coriolis analysis

18
Loblaws
Understanding Loblaws
SHARE PRICELoblaw’s shares have been a good investment
Loblaw’s share price(C$, actual, Jan 1973- Feb 2005)
15X
Source: BigCharts

19
Loblaws
Understanding Loblaws
LOBLAWS OWNERSHIP STRUCTURELoblaw, owned 62% by George Weston Foods Limited, which is in turn owned 60% by Galen Weston and familyOwnership structure of Loblaws(various, 2004)
Galen Weston& Family
AssociatedBritish Foods
Sales: £5.2b
54%
Fortnum& Mason
100%60%
GeorgeWeston Ltd.
Sales: C$29.2b
George WestonFoods (AU/NZ)
62%
Loblaws Company
Sales: C$b
WestonFoods
C$4.5b
Source: company reports; Coriolis analysis

20
Loblaws
Understanding Loblaws
LOBLAWS COMPANY STRUCTURELoblaw’s functions as both a retailer and a wholesaler
Company structure of Loblaws(various, 2003)
LoblawCompany
Sales: $25.2b
CorporateStores
Sales: $18.8bUnits: 646
WholesaleStores
Sales: $6.5bUnits: 7,671
FranchisedStores
Units: 397
AssociatedStores
Units: 598
IndependentAccounts
Units: 6,676
Source: company reports; Coriolis analysis

21
Loblaws
Understanding Loblaws
NUMEROUS BANNERSAs a result of wholesale activity and acquisitions, Loblaws has a large number of both retail and wholesale store formats and bannersLoblaw store formats and banners(2004)
Quebec
East
West
WholesaleRetail
Source: company reports; Coriolis analysis

22
Loblaws
Understanding Loblaws
CORPORATE VS WHOLESALE SALESWhile corporate sales are three times the size of wholesale sales, both sectors are showing strong growth
$2.6 $2.7 $2.7 $3.0 $3.1$4.9 $5.6 $5.8 $6.0 $6.5
$7.4 $7.2 $7.2$8.0
$9.3
$13.9$14.5
$15.7$17.1
$18.8
1994 1995 1996 1997 1998 1999 2000 2001 2002 2003
Group sales: corporate and wholesale(C$, billions, 1994-2003)
Corporate
Wholesale
$10.0 $9.9 $9.8$11.0
$12.5
$18.8$20.1
$21.5
$23.1
$25.2
CAGR94-0310.8%
10.9%
10.5%
2004 data not yet available
Source: company reports; Coriolis analysis

23
Loblaws
Understanding Loblaws
GROWTH IN CORPORATE STORESOverall growth in corporate store numbers has been driven by acquisition and organic growth
338 341360
656
585606 617
632646
1995 1996 1997 1998 1999 2000 2001 2002 2003
Number of corporate stores(units, actual, 1995-2003)
Source: company reports; Coriolis analysis

24
Loblaws
Understanding Loblaws
CHANGING WHOLESALE STRUCTURELoblaws is evolving toward fewer, larger wholesale stores/accounts
341 360 656 585 606 617 632 646580 547 409 417 405 401 406 397
928 817 736 694 659 598
5,047 4,723
11,842
9,637
8,2527,172 7,069
6,676
1996 1997 1998 1999 2000 2001 2002 2003
Number of stores and independent accounts(units, actual, 1995-2003)
IndependentAccounts
Associated
5,968
FranchisedCorporate
5,968
13,835
11,456
9,999
8,884 8,7668,317
AbsoluteChange
96-03
+2,349
+2,349
+598-183+305
Source: company reports; Coriolis analysis

25
Loblaws
Understanding Loblaws
STORE LOCATIONS BY TYPELoblaw’s store portfolio is strong in the highly populated centre of the country, but relatively weak in the far west
245
29432
165
24218
20
451
34
1443
58
515
39
4421
17
79
37
242
22
245
1
1
3
1
5
31
Loblaw’s store locations by ownership type and province(various, 2004)
CorporateFranchisedAssociated
Strong
RelativelyWeak
Source: company reports; Coriolis analysis

26
Loblaws
Understanding Loblaws
PRESENTATION STRUCTUREThe final part of this presentation looks at Loblaw’s strategy
CanadianMarketOverview
LoblawsOverview
LoblawsStrategy
27
Loblaws
Understanding Loblaws
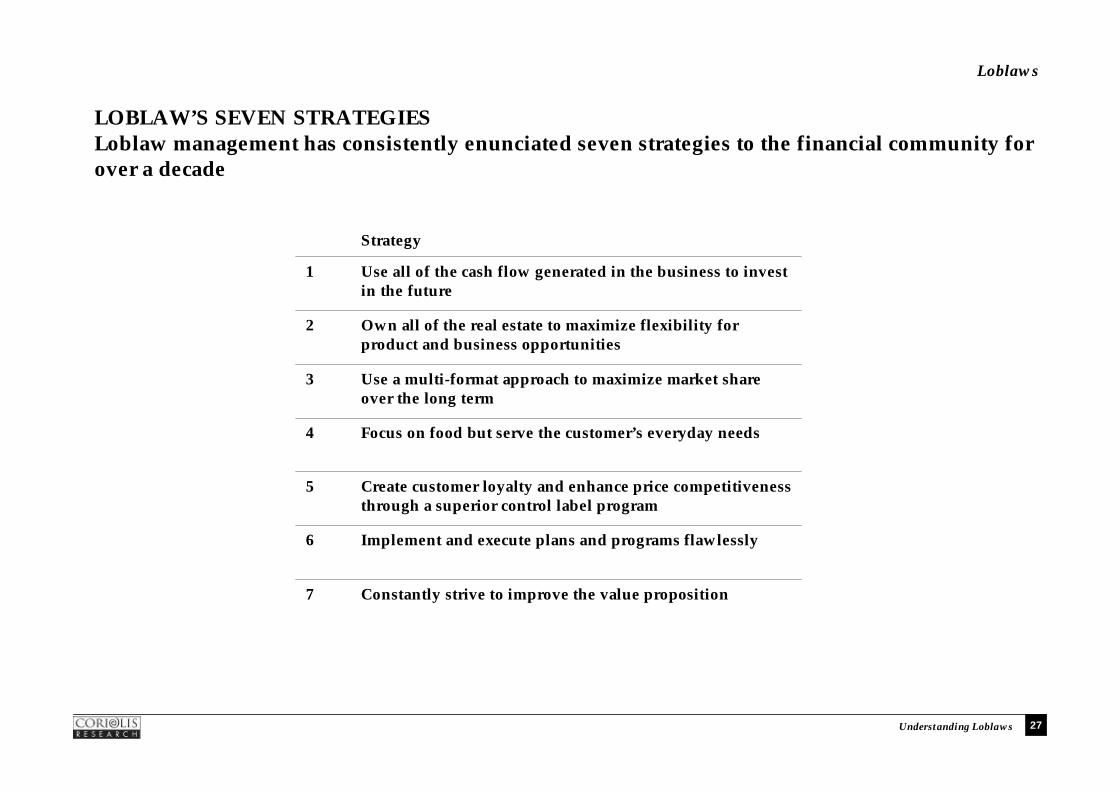
LOBLAW’S SEVEN STRATEGIESLoblaw management has consistently enunciated seven strategies to the financial community for over a decade
7
6
5
4
3
2
1
Constantly strive to improve the value proposition
Implement and execute plans and programs flawlessly
Create customer loyalty and enhance price competitiveness through a superior control label program
Focus on food but serve the customer’s everyday needs
Use a multi-format approach to maximize market share over the long term
Own all of the real estate to maximize flexibility for product and business opportunities
Use all of the cash flow generated in the business to invest in the future
Strategy

28
Loblaws
Understanding Loblaws
REINVEST CASH FLOW1. Use all of the cash flow generated in the business to invest in the future
Sales mix by category by store format(% of sales, 2004)
$-
$200
$400
$600
$800
$1,000
$1,200
$1,400
$1,600
1994 1995 1996 1997 1998 1999 2000 2001 2002 2003 2004
Capital investment (fixed asset purchases)
Cash flows from operating activities
Source: company reports; Coriolis analysis

29
Loblaws
Understanding Loblaws
SPEND MONEY TO MAKE MONEYLoblaw management believes you need to spend money to make money
– “Loblaw has religiously invested virtually all of its free cash flow into store network and/or infrastructure upgrades. Loblaw has typically lead the industry in capex/sales ratio opening or renovating more square footage per year than all of its industry competitors combined. Loblaw has one of the most current store networks in Canada.” James Durren, analyst, NBF, Oct 2003
– “We’ve got a huge part of our capital going into these big stores over the next few years… It’s a big property challenge, but so far we’re very pleased with the results.” Galen Weston, Chairman, Loblaws, Dec 2004
– “Loblaw became Canada's largest food distributor by continual reinvestment in modern facilities and selected formats in existing markets. The company has long recognized that in a seemingly mature, low margin business one needs to spend money to make money. It is no accident that in food retailing it is most often the case that the number one player has the best assets in the market. Loblaw is a financially sound company with both the ability and commitment to spend cash to grow its business. Generation of strong cash flow is a key determinant of its ability to compete effectively.” Patricia Baker, analyst, Merrill Lynch, Jun 2000

30
Loblaws
Understanding Loblaws
OWN ALL YOUR REAL ESTATE 2. Own all of the real estate to maximize flexibility for product and business opportunities
61% 62% 63%
67%
2000 2001 2002 2003
Percent of corporate store sites owned by the company(% of sites, 2000-2003)
+6% in 3 years
Source: company reports; Coriolis analysis

31
Loblaws
Understanding Loblaws
REAL ESTATE IS A GOOD INVESTMENT Loblaw management believes real estate ownership provides flexibility and is a good investment
– “Real estate decisions were centralized due to their importance in business strategy, capital allocation and their impact on the income statement. Richard Currie viewed real estate differently than other food distributors. He noted, "We have a policy of owning real estate and leasing fixtures, whereas for most of the supermarket industry it is just the opposite." The Company adopted this philosophy for two main reasons. First, real estate had been an appreciating asset and Currie had a policy of "own potentially appreciating assets, lease certainly depreciating assets." Second, real estate ownership provided flexibility. By owning a property, Loblaw was free to change the store format or to bring in any services (e.g. a pharmacy) without worrying about a landlord's agreements with surrounding retailers. Loblaw took real estate so seriously that Richard Currie still approved every site personally.” HBR, Oct 1995
– “Real Estate: The availability and conditions affecting the acquisition and development of real estate properties may impact the Company’s strategies and financial performance. The Company maintains a significant portfolio of owned retail real estate and, whenever practical, pursues a strategy of purchasing sites for future store locations. This enhances the Company’s operating flexibility by allowing the Company to introduce new departments and services that could be precluded under operating leases. At year end 2003,the Company owned 67% (2002 – 63%) of its corporate store square footage.” Loblaw Annual Report 2003
– “Maintaining flexibility is a cornerstone to Loblaw’s strategic approach to food distribution. Real estate ownership provides maximum operating flexibility. It presents operating flexibility to change a store size, make additions, or downsize at the store level.” Patricia Baker, analyst, Merrill Lynch, Jun 2000
– “Loblaw owns 67% of its corporate store locations. This allows Loblaw to add new businesses (i.e. pharmacies, gas stations) and over the longer-term change formats (i.e. Loblaw vs. No Frills format) as market dynamics dictate without facing landlord constraints.” James Durren, analyst, NBF, Oct 2003

32
Loblaws
Understanding Loblaws
MULTI-FORMAT APPROACH3. Use a multi-format approach to maximize market share over the long term

33
Loblaws
Understanding Loblaws
MULTI-FORMAT FOR MARKET SHARELoblaw believes this range of store formats allows it to the maximum possible market share
– “You can’t go into battle with only ships or planes or infantry or tanks.” Richard Currie, President, Loblaws, Oct 1994
– “All of the different formats used essentially one supply chain. This was what Loblaw called the "Bus bar" approach (multiple outlets could be plugged into a single system) and allowed Loblaw to share resources between banners and achieve economies of scale in areas such as finance, logistics, information technology and warehousing.” HBR, Oct 1995
– “All manner of retailer must ensure that they address the needs of each market with the right assets. Loblaw brings a variety of banners and formats to each market. We liken this to a portfolio approach. Not all food shoppers are alike. The market by definition is segmented. It is with this fact in mind that Loblaw brings a portfolio of stores to bear on each and every market.
– Providing this kind of choice permits theoretical access to the entire market, i.e. a target market of 100% of households. Limiting one’s positioning to a single format would thereby limit one’s target market. Access to the entire market would no longer be available. If 20% of a given market consists of discount store shoppers, a discount food format only has access to 20% of the market, theoretically.
– Yet this portfolio approach is not driven only from a desire to penetrate one hundred percent of households. Running with a number of formats allows for recycling of older assets. Loblaw has ably converted many stores which had become too small to serve certain markets to their No Frills discount banner. This effectively realigns a real estate asset and generates incremental sales and profits.” Patricia Baker, analyst, Merrill Lynch, Jun 2000
– “Canada is a small, geographically diverse market with limited population density and intense price competition. Loblaw’s multi-formats and corporate/franchise ownership experience significantly extends the Company’s geographic reach while maximizing ROIC.” James Durren, analyst, NBF, Oct 2003

34
Loblaws
Understanding Loblaws
NEW FORMAT INNOVATIONLoblaw regularly develops new store formats
1991
1986
1979
1978
YearStarted
Counter success of Price Club and Costco in Canada
Wholesale Club
Franchise program for independents in rural markets
Local Supermarket
Offer a complete one-stop shopFull line in-store pharmacy
Supercentre
Recycle older stores in poorer areas to a price fighter
Objective
Limited Assortment Store
Store FormatStore Fascia
New store fascia developed by Loblaw (various)
Source: company reports; Coriolis analysis

35
Loblaws
Understanding Loblaws

36
Loblaws
Understanding Loblaws
SIX KEY STORE FORMATSLoblaw currently operates six key store formats under numerous banners
Offer club store shopping to businesses and households3,500sku60,000+sqftCorporate80RCWCWholesale Club
85
85
80
100
100
PriceIndex
Conversion of conventional supermarket to a strong perishables offer to attract regular daily/weekly shopping trip
25,000-45,000sqft
CorporateLoblawsProvigo
Fresh Box
Urban locations where space is expensive and competition limited; store layouts vary based on site constraints and local demographics
10,000-15,000sku
18,000-45,000sqft
Corporate, Franchised
& Independent
LoblawsZehrsLucky DollarProvigo+others
Conventional Supermarkets
Corporate
Corporate
Franchised
Ownership
RCSSMaxi&Co
LoblawsExtra FoodsMaxi
No Frills
Fascia(s)
50,000-70,000sku
20,000-30,000sku
4,000+sku
# ofSKU
85,000-150,000sqft
60,000-80,000sqft
Under 20,000sqft
StoreSize
Superstore offer plus extensive general merchandiseSupercentres
Value through lower prices; Grocery warehouse surrounded by strong perishables; warehouse racking; bag your own groceries; pallet shelving
Superstores/Box Warehouse
Located in older locations that could no longer support a conventional supermarket; adding dollar store sections
Objective
Limited Assortment
Format
Loblaw’s six key store formats(various)
Source: company reports; Canadian Grocer; NBF; CIBC; various published sources; Coriolis analysis

37
Loblaws
Understanding Loblaws
SALES MIX BY FORMATThere is significant variation in sales mix by store format
72%
45%
75%
50%40%
25%
50%
20%
40%
35%
3% 5% 5%10%
25%
Classic Fresh Box LimitedAssortment
Superstore Supercentre
Sales mix by category by store format(% of sales, 2004)
Grocery
Persihables
GM/HBC
Source: company reports; Canadian Grocer; NBF; CIBC; various published sources; Coriolis analysis
38
Loblaws
Understanding Loblaws
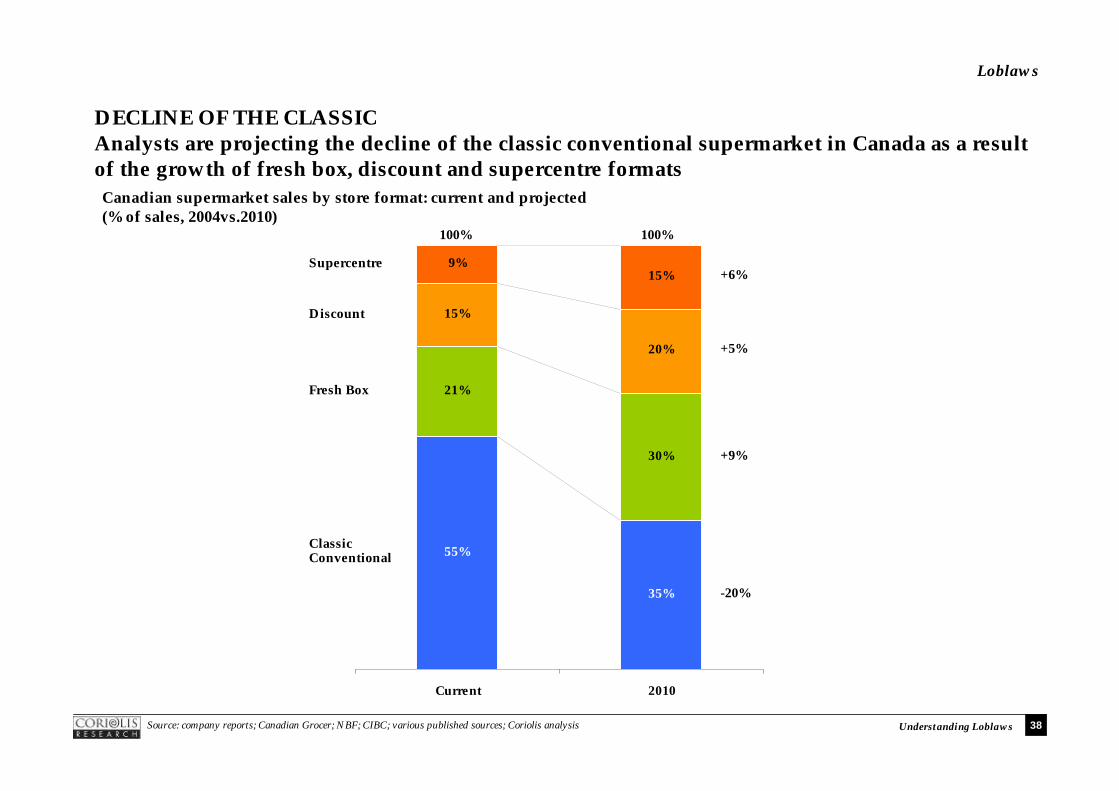
DECLINE OF THE CLASSICAnalysts are projecting the decline of the classic conventional supermarket in Canada as a result of the growth of fresh box, discount and supercentre formats
55%
35%
21%
30%
15%
20%
9%15%
Current 2010
Canadian supermarket sales by store format: current and projected(% of sales, 2004vs.2010)
ClassicConventional
Fresh Box
Discount
Supercentre+6%
+5%
+9%
-20%
100% 100%
Source: company reports; Canadian Grocer; NBF; CIBC; various published sources; Coriolis analysis

39
Loblaws
Understanding Loblaws
FOCUS ON LARGE STORESLoblaws has focused its corporate store growth on stores larger than 60,000 square feet
1.1 1.2 2.3 2.0 1.9 1.8 1.8 1.72.9 3.2
6.75.4 5.7 5.1 5.1 5.3
4.2 4.1
6.66.4 6.4 7.3 7.4 7.36.2
7.2
9.810.7
13.014.4
16.618.3
1996 1997 1998 1999 2000 2001 2002 2003
Loblaw’s total square footage of corporate stores by store size(sqft, millions, 1996-2003)
Less than 20,000sqft
20,000 to 40,000sqft
40,000 to 60,000sqft
More than 60,000sqft
14.415.7
25.524.5
27.028.6
30.932.6
Source: company reports; Coriolis analysis

40
Loblaws
Understanding Loblaws

41
Loblaws
Understanding Loblaws
FOOD FOCUSED ONE-STOP SHOP4. Focus on food but serve the customer’s everyday needs…
– “Although the Company was still focused on being a food distributor, it saw itself as a "one-stop shop for everyday household needs." To varying degrees, depending on size, location and opportunity, all Loblaw stores met these needs by offering pharmacies, flower shops, health and beauty care items, cosmetics, greeting cards, music, books, videos, casual apparel. gas bars, photo finishing and dry cleaning in addition to food products and perishable foods. The Company felt that each service provided the customer with another reason to visit a location. Each visit served to further develop the relationship between Loblaw and the consumer and provided another opportunity for an additional food or non-food purchase. For example, if a customer visited a location to pick up dry cleaning or drop off film, he or she was more likely to pick up a some milk or bread that may otherwise have been purchased at a convenience store. Loblaw looked at "departments" as another opportunity to provide significant value to the customer. The items sold through the "departments" such as CDs, books, flowers, pharmaceuticals etc., traditionally had a higher margin structure than food. Thus, Loblaw could sell these products at substantially lower prices and yet make acceptable profits. For instance, Loblaw might make $1.00 profit on a CD. For a music store this margin might have been unacceptable but for a food retailer, there were few single items on the shelf that could provide that kind of return.” HBR, Oct 1995
– “Loblaw considers the supermarket the base from which “everyday household needs” businesses develop. As such there is no shortage of potential. Depending on size, location, and opportunity, all Loblaw stores offer pharmacies, flower shops, health and beauty care departments, cosmetics, greeting cards, music, books, casual apparel, gas bars, photo-finishing and dry cleaning. The oft-quoted view of the company's President is that "Loblaw is in the business of owning and building boxes". The underlying notion is that this is a dynamic, evolving industry and, over time the layout and the products will change. Ownership of the "box" permits maximum flexibility. This orientation removes traditional constraints from the determination of which "everyday household needs" this retailer can provide to the consumer.” Patricia Baker, analyst, Merrill Lynch, Jun 2000

42
Loblaws
Understanding Loblaws

43
Loblaws
Understanding Loblaws

44
Loblaws
Understanding Loblaws

45
Loblaws
Understanding Loblaws

46
Loblaws
Understanding Loblaws

47
Loblaws
Understanding Loblaws
FOOD FOCUSED ONE-STOP SHOP4. Focus on food but serve the customer’s everyday needs… continued
– “General merchandise growth continues to outstrip overall sales growth (which means that overall food comp’s are likely negative). Nevertheless, the push on general merchandise continues to be core to the Loblaw growth plans, and the category should produce almost $5 billion in sales for Loblaw this year – a 15% growth rate. In eastern Canada, this has put stress on logistics operations that are largely not configured to handle this business. The company is intending to add a dedicated distribution center in Ontario in 2005, which should dramatically reduce the costs – and improve the service levels – for the general merchandise business in Ontario.” Perry Caicco, CIBC, Jul 2004
– “This is a reaffirmation by Loblaw that a superior food offering will be a key differentiator versus Wal-Mart’s Supercenter format if/when it is introduced in Canada. This change has been most noticeable in the Western Canada’s Real Canadian Superstores where a fresh produce upgrade and enhanced store design was implemented in 2002. This imperative also highlights Loblaw’s aggressive pursuit of new revenue streams amongst the customers “everyday needs” such as general merchandise, pharmacy, dry cleaning, and photo labs.” James Durren, analyst, NBF, Oct 2003

48
Loblaws
Understanding Loblaws
WAL-MART INVASIONWal-Mart entered the Canadian market in 1994 with the acquisition of 122 Woolco stores and has opened another 128 stores in the decade since then, triggering a renewed GM push by Loblaw
123131 136
144153
166174
196
213
231
250
1993 1994 1995 1996 1997 1998 1999 2000 2001 2002 2003 2004
None
Wal-Mart store numbers in Canada(units, 1993- 2004)
+128
Source: WMT company reports; Coriolis analysis

49
Loblaws
Understanding Loblaws
SUPERMARKETS ONLY LEAD IN FOODIn Canada, Supermarkets are only leaders in the food category; there is opportunity for growth in Drug/HBC and General Merchandise
6% 3% 2%
74%
18%
10%
4%
64%
2%
4%8%
27%
6%1%
3%
6% 6%
55%
Food Drug/HBC GM
Merchandise sales by channel(% of sales, 2003)
Supermarket
Mass MerchantClub
Other
Drugstore
Convenience
100% 100% 100%
Source: company reports; Canadian Grocer; NBF; CIBC; various published sources; Coriolis analysis

50
Loblaws
Understanding Loblaws
A LONG ROADAchieving success in general merchandise has been a long road for Loblaws
– “Loblaw’s has built a large, fast-growing general merchandise business but this is no overnight success. The $4 billion dollar general merchandise business is the product of two decades of trial and error. Behind the scenes the company has over the years experienced logistics problems, unsold inventory, return pile-ups, damages, shrink, poor quality and labour issues. As Loblaw’s general merchandise strategy evolved to selling “everyday household needs,”consumers gradually became accustomed to trolling the company’s general merchandise section for gifts, kitchen items, hardware and seasonal needs. And Loblaw gradually became more adept at sourcing, distribution and customer service, although there is still a long way to go. Despite its success in general merchandise, the company still needs an appropriate dedicated distribution centre in Eastern Canada, proper and comprehensive return policies, stronger and sharper markdown procedures, more training and decision making at store level and a better model for handling damaged, returned and malfunctioning products.” Perry Caicco, CIBC, Jan 2004

51
Loblaws
Understanding Loblaws
BENEFITS & PITFALLS OF GMA strong general merchandise program has both positives and negatives for Loblaw’s (and any retailer)
BenefitsThe benefits to a grocer of a strong, comprehensive general merchandise program for a supermarket are many:
• It levers the strong daily store traffic into incremental sales.Lower price point, “consumable” general merchandise items can be particularly successful.
• It helps maximize seasonal merchandising programs.
• It opens up a wide variety of cross-merchandising opportunities.
• It can enhance a store’s reputation as an “expert” in certain categories such as cooking or cleaning.
• Stores can create a “surprise” factor by the use of special buys of general merchandise.
• Gross margins can often be higher than those of food, although those are often offset by costs in other areas (markdowns, shrink, labour).
PitfallsOn the other hand, there are many pitfalls in the general merchandise business, which most supermarkets tend to learn “the hard way”:
• The stuff simply doesn’t turn like food and so ties up inventory dollars — GMROI calculations often show that general merchandise is not a good investment.
• There is more art than science in product decisions, and if there is any element of fashion in the product, there is an opportunity to make a huge and costly inventory mistake.
• Markdown management is a foreign language to most grocers. It is difficult to learn that a dog is a dog, and that “the first cut is the deepest”.
• Grocers are often shocked by the price cuts needed to move some of this merchandise, especially after the appropriate season.
• Most grocers do not have enough general merchandise volume or experience to perform direct sourcing, and so are reliant on brokers, agents, wholesalers and rack-jobbers. Although these are less risky routes to market, the margins can be awfully thinonce everyone gets their cut, which means shelf prices end up too high.
• Most everyday general merchandise puts grocers into direct competition with Wal-Mart. Therefore, prices must be set at a level that leaves at most a “reasonable” gap. As Wal-Mart’s prices come down, this gets more difficult.
Source: Perry Caicco, analyst, CIBC, Jan 2004

52
Loblaws
Understanding Loblaws

53
Loblaws
Understanding Loblaws
54
Loblaws
Understanding Loblaws

55
Loblaws
Understanding Loblaws

56
Loblaws
Understanding Loblaws

57
Loblaws
Understanding Loblaws

58
Loblaws
Understanding Loblaws

59
Loblaws
Understanding Loblaws

60
Loblaws
Understanding Loblaws

61
Loblaws
Understanding Loblaws

62
Loblaws
Understanding Loblaws

63
Loblaws
Understanding Loblaws
SUPERIOR PRIVATE LABEL5. Create customer loyalty and enhance price competitiveness through a superior control label program

64
Loblaws
Understanding Loblaws
BEST IN NORTH AMERICALoblaw has the best and strongest private label program in North America, achieving 24.2% of total group sales
– “Control label retail sales reached $5.6 billion in 2003 while penetration, measured as control label retail sales as a percentage of the Company’s retail sales, increased to 24.2% from 23.6% in 2002. The Company introduced approximately 1,500 new control label products in 2003,including 500 new PC general merchandise products. The Company’s control label program, which includes President’s Choice, PC, no name, Club Pack, GREEN,TOO GOOD TO BE TRUE, EXACT and Life@Home, provides additional sales growth potential.” Loblaw Annual Report 2003
– “Loblaw’s has the highest penetration of controlled label sales in North America (23.6% of retail sales) with President’s Choice (PC) viewed as the industry’s premium private label leader in quality and innovation. Loblaw has extended this success into general merchandise products starting in western Canada with the “Life at Home” brand and is now developing a premium general merchandise line under the PC label.” James Durren, analyst, NBF, Oct 2003

65
Loblaws
Understanding Loblaws
C$1.8b
C$2.2b
C$1.3b
C$0.3b
GREENTGTBT
Club PackOthers
TWO TIRE APPROACHLoblaw uses a two-tiered approach to private label
Yearlaunched
Sales(C$B;03)
2,500
2,500
2,000
200
% of PLSales
32%
40%
23%
5%
Strategy
– Launched as inflation fighter– Modeled on Carrefour range– Cheap and basic
– Create a real point of difference– Modeled on Marks&Spencer– Increase margins vs. branded
– Address specific consumer needs– Capture margin in new categories– Segment market
– OTC Pharmaceuticals– Sell through in-store pharmacies– Increase margins vs. branded
# oflines
1978
1983
1996
198919911988
Source: Various Loblaw annual reports; Toronto Star; Private Label Buyer magazine; Canadian Grocer; Coriolis analysis and estimates
Loblaw private label brands(various)

66
Loblaws
Understanding Loblaws
SIGNIFICANT INVESTMENTLoblaw invests significant time and resources into its ongoing private label development program and is constantly launching new products and upgrading packaging
GREENTGTBT
Club PackOthers
Loblaw private label brands(various)

67
Loblaws
Understanding Loblaws
PRESIDENTS CHOICE – SUB-BRANDSPresidents Choice has launched a number of sub-brands

68
Loblaws
Understanding Loblaws
PRESIDENTS CHOICE – BLUE MENUPresidents Choice has recently launched the Blue Menu range of low/no products

69
Loblaws
Understanding Loblaws
PRESIDENTS CHOICE - GENERAL MERCHANDISEThere are now over 400 Presidents Choice general merchandise items

70
Loblaws
Understanding Loblaws
PRESIDENTS CHOICE – FINANCIAL SERVICESThe President’s Choice name has also been extended into financial services

71
Loblaws
Understanding Loblaws
STRONG GROWTHLoblaw has increased its private label share and sales massively in the past decade
Loblaw private label growth(various)
15%
24%
1997 2003
$1.6
$5.6
1997 2003
CAGR97-0323.2%
+9%
% total group sales Sales
Source: company reports; Canadian Grocer; NBF; CIBC; various published sources; Coriolis analysis

72
Loblaws
Understanding Loblaws
EXECUTE FLAWLESSLY6. Implement and execute plans and programs flawlessly
– “We believe this imperative is a key ingredient in Loblaw’s corporate culture. Loblaw is not afraid to experiment, is not slow to take action, but prides itself on above average execution. Let’s face it identifying potential opportunities, or strategies is not that difficult - what typically separates winners from losers is timely excellence in execution. Loblaw has had a long history of successfully applying/adapting industry developments for the Canadian market/consumer. At Loblaw we continue to observe several key behaviours that fuel success i) constant experimentation ii) avoidance of the “not invented here” syndrome iii) excellence of execution – timely and typically very well done. Examples are PC financial, Club Pack, the PC general merchandise program, No Frills- dollar store test.” James Durren, analyst, NBF, Oct 2003
73
Loblaws
Understanding Loblaws
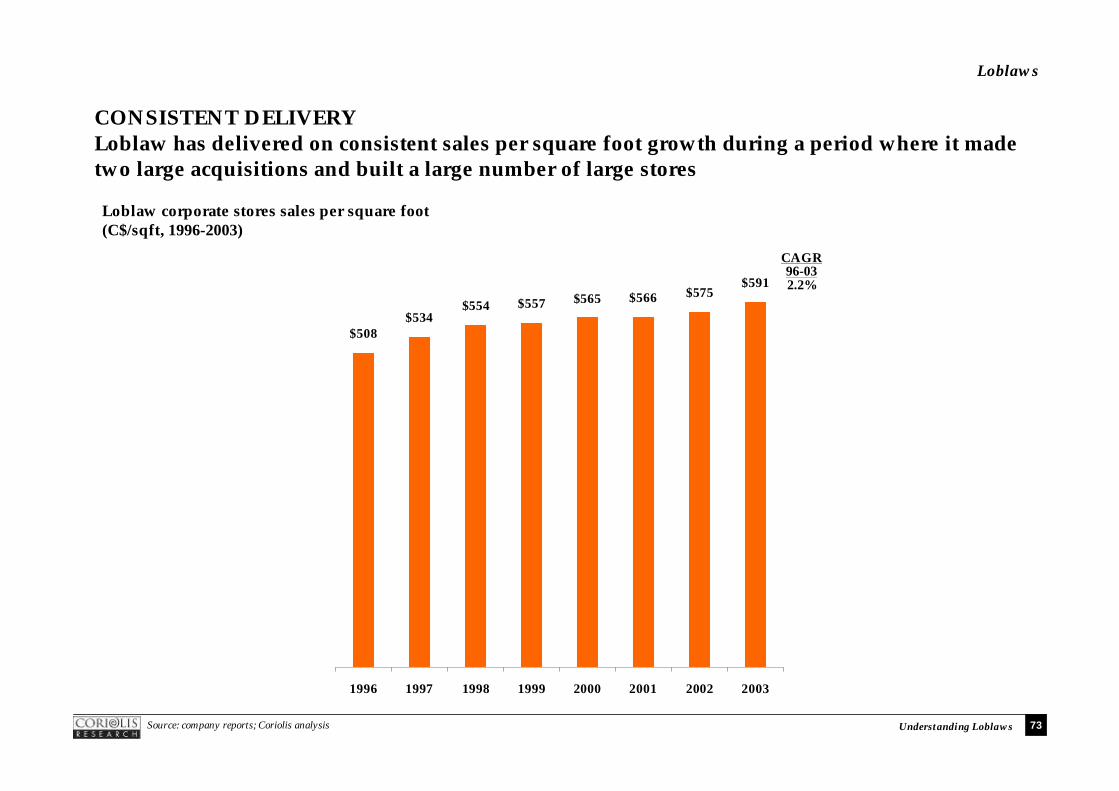
CONSISTENT DELIVERY Loblaw has delivered on consistent sales per square foot growth during a period where it made two large acquisitions and built a large number of large stores
$508$534
$554 $557 $565 $566 $575$591
1996 1997 1998 1999 2000 2001 2002 2003
Loblaw corporate stores sales per square foot(C$/sqft, 1996-2003)
CAGR96-032.2%
Source: company reports; Coriolis analysis
74
Loblaws
Understanding Loblaws
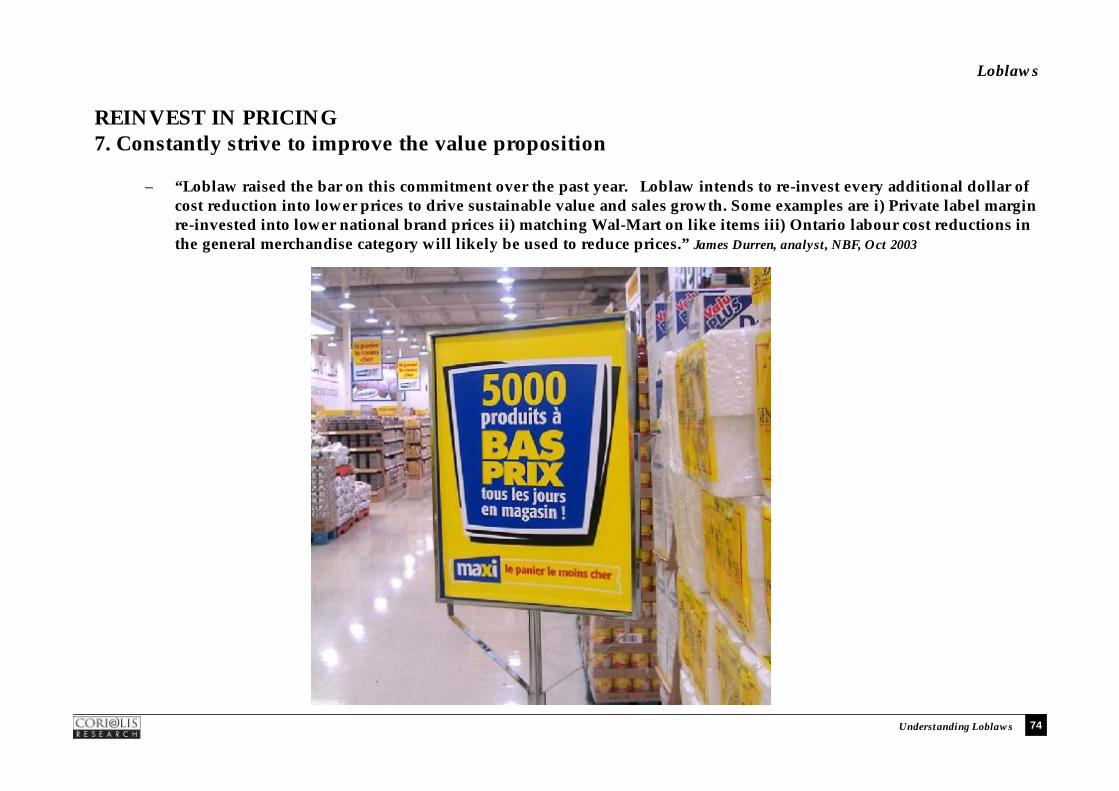
REINVEST IN PRICING7. Constantly strive to improve the value proposition
– “Loblaw raised the bar on this commitment over the past year. Loblaw intends to re-invest every additional dollar of cost reduction into lower prices to drive sustainable value and sales growth. Some examples are i) Private label margin re-invested into lower national brand prices ii) matching Wal-Mart on like items iii) Ontario labour cost reductions in the general merchandise category will likely be used to reduce prices.” James Durren, analyst, NBF, Oct 2003

75
Loblaws
Understanding Loblaws

76
Loblaws
Understanding Loblaws
LOBLAW’S STRATEGIC ENABLERSIn addition, Loblaw management has two additional strategic enablers supporting its strategy
2
1
Have an efficient supply chain
Continued focus on administrative cost controls and operating efficiencies, including a focus on controlling retail shrink and retail labour management
Strategy

77
Loblaws
Understanding Loblaws
LOBLAW’S STRATEGIC ENABLER: COST CONTROLLoblaw management regards strong cost control as the enabler of all other initiatives
– “If you don’t have control of your cost structure – especially in a business that employs 35,000 people – in the medium to long term you’re going to be dead.” Galen Weston, Chairman, Loblaws, Dec 2004
– “The “Centralisation Project” has, we believe, a potential for about $250m of cost savings over four to five years. This involves removing redundant functions, driving best practices across the country and seeking more national purchasing opportunities. Fruits of this project will not be seen until late 2004 or early 2005 and every last penny will be plowed back into pricing.” Perry Caicco, CIBC, Feb 2004
– “Making new store layouts more consistent coast-to-coast, using similar principals in every market, reduces costs and increases merchandising effectiveness.” Perry Caicco, CIBC, Feb 2004
– “But the good news is significant: the company has been successfully taking costs out of its business as part of an immense project to improve supply chain and store operating efficiency. These savings are real, material and ongoing. They have allowed Loblaw to grow its operating margins while prices fall. In the meantime, investors are considering the merits of a company that no longer grows earnings at 18-20% per year. But the current 15-16% earnings growth rate is, in our opinion, being generated by a healthier model, one that places Loblaw in the forefront of the major worldwide growth trends in grocery: more discount formats, faster private label development, lower prices, sharper logistics, better fresh presentations and intelligent additions of high-turn general merchandise.” Perry Caicco, CIBC, Jul 2004

78
Loblaws
Understanding Loblaws
LOBLAW’S STRATEGIC ENABLER: COST CONTROLLoblaw management regards strong cost control as the enabler of all other initiatives… cont.
– “Seeing the need to drop prices in order to forestall alternative channel growth, Loblaw launched a massive cost-cutting program early in 2003 under the “one company” motto. These efforts, which include benchmarking and collaborating across the company on store operations and procurement efforts, will yield their biggest savings from supply chain initiatives. In Q1, we saw the first fruits of these projects. The larger stores and better labour cost environment allowed Loblaw to drive strong price reductions throughout 2003 and build what we believe was a national market share gain of between 1.0 and 1.5 points. These efforts continued in Q1, although sales growth was tougher to come by as deflation, competitive square footage and more aggressive alternative channel players took their toll. Going forward, pricing action will be re-doubled as the company is emboldened by their ability to get costs out of the business. In the absence of these actions, Loblaw and other Canadian grocery competitors are at the mercy of new players and channels that have sprung up quickly and – at least in the case of the top three - are siphoning off sales largely through pricing.” Perry Caicco, CIBC, May 2004
– “Costs are Coming Out: The company is putting immense focus on getting its buying costs down through a series of efforts including better commodity sourcing, more consolidated and streamlined off-shore buying, collaborative planning with selected suppliers, and some experiments in demand forecasting. These efforts are in the very early stages and, among other questions, are probably forcing the company to come to grips with the use of its proprietary scanning data. With Wal-Mart’s Customer Link as a precedent, the company has an immense opportunity to shift certain costs to suppliers, reduce head office processing costs and improve in-stock positions and promotional efficiency. The company produced its first $10-15m of cost savings in Q1 from its Supply Chain project, and another $30-35m of savings in Q2. These efforts, plus the continual shift of business to fresh products and general merchandise, are all that is pushing margins up right now. As we mentioned previously, we believe that there are $250m of identifiable costs to come out of the business. Getting them all out won’t be easy, and might not be quick, but the journey will likely turn up many other cost-savings opportunities. In many ways, this is the most importantproject at Loblaw right now.” Perry Caicco, CIBC, Jul 2004

79
Loblaws
Understanding Loblaws
SUPPLY CHAIN INITIATIVESLoblaw has long been a leader in efficient supply chain initiatives
– “Slow-moving warehouse: One initiative was the creation of a slow-moving warehouse. The concept was a simple, yet powerful way to more efficiently use warehouse space. Loblaw in Ontario used 7 warehouse distribution points. Traditionally, each warehouse held a full range of products for the geographic area that it covered. Within any given warehouse there were fast moving items such as Tide and slow moving items such as ant traps. The problem was that slow moving items took up significant amounts of space and the low turnover meant that cash was held in inventory longer. Loblaw’s solution to this problem was to create a "Slow-Moving Warehouse" where thetraditional slow-moving goods would be consolidated. This solution not only freed up space in existing warehouses but because all stores were sourcing the slow moving items from a single point, the inventory turn rate increased and cash tied up in inventory dropped significantly.” HBR, Oct 1995
– “Perpetual inventory: Perpetual inventory meant knowing the exact number of SKUs in a store at any given time. The system entailed using scanning data at both the receiving dock and the checkout counter to track product. Traditionally, checkout scanning data had been used primarily for merchandising decisions. It was seldom used for ordering or inventory management. Perpetual inventory was already in use extensively in the UK. and a U.S. chain, Shaw's, represented the industry standard in North America. The technology allowed The Company to better manage shelves reducing stock-outs and increasing profit. Using existing technology, Loblaw began a pilot project in 1995.”HBR, Oct 1995

80
Loblaws
Understanding Loblaws
IN SUMMARY…Loblaw’s strategy can be summarised as follows…
Cost Control
ReinvestCashflow
Own RealEstate
Multi-Format
One-Stop Shop
Private Label
ImplementFlawlessly
ValueProposition
Efficient Supply Chain