understanding hispanic entrepreneurial success: an
TRANSCRIPT

Understanding Hispanic Entrepreneurial Success: An Exploratory Study
Denisse Olivas University of Texas at El Paso
Gary L. Frankwick
University of Texas at El Paso
This paper explores the success and failure factors for Hispanic businesses, and extends the literature through an analysis of a Texas Hispanic Chamber of Commerce database. Literature suggests that tailored training provided by organizations such as these will reduce failure rates. Thus, the study focused on identifying characteristics of firms that maintained or joined a chamber of commerce. Employing a database of 687 chamber members, cluster analysis provided an initial profile of companies who renew membership, and those who drop it. The paper concludes with recommendations for future research. INTRODUCTION
Over the past decade, the Hispanic population in the United States has increased from about 12.5% to more than 16.5% of the population (U.S. Census Bureau, 2010). Along with the rise in population, the number of Hispanic businesses has also increased. From 2002 to 2007 the number of businesses increased 43.7 percent, to a total of 2.3 million establishments and $350 billion in revenue (U.S. Census Bureau, 2007). By 2015, however, this number is estimated to have climbed to 4.07 million establishments with $661 billion in revenue, a 57 percent increase from 2007 (Geoscape, 2015). Hispanics are also more likely to start a business and to be self-employed with 9.1% of this group employed as entrepreneurs while only 7.8% of the general U.S. population is self-employed (Geoscape, 2013). Despite the latest economic recession, Hispanics still maintain a higher percentage of self-employment than other groups of entrepreneurs. It is also suggested by Pisani (2014), that many of these Hispanic firms are necessity driven as opposed to opportunity driven, which means that Hispanic entrepreneurs start their businesses due to lack of employment opportunities.
As important as this group is and as entrepreneurial as it might be, many studies have recognized that these and other minority businesses still lag in many economic factors. According to the latest research, minorities are more likely to start small businesses, but are not likely to be as successful as other, non-Hispanic, businesses (Canedo, Stone, Black, & Lukaszewski, 2014). In general, the whole entrepreneurial process is more difficult for minorities (Bates, Jackson, & Johnson, 2007). To determine potential strategies to help these businesses succeed, it is important to understand their needs and the challenges they face (Bureau of Business Research, 2012).
In the state of Texas, Hispanic businesses represent 20.7 percent of all businesses, a 40.2 percent increase from 2002 to 2007, which translates into 447,589 businesses (Bureau of Business Research,
Journal of Business Diversity Vol. 16(1) 2016 11

2012). According to the 2007 Survey of Business Owners, Texas has the third highest percentage of Hispanic businesses in the U.S. with $62.1 billion in receipts (U.S. Census Bureau, 2007). Even after the large increase of Hispanic businesses, the 2007 SBO data still showed that these businesses lagged in all economic indicators when compared to non-Hispanic businesses. Measurable performance values such as average gross receipts, payroll size and employment size were one-fourth to one-half the size of their non-Hispanic counterparts (Bureau of Business Research, 2012). In addition, this research revealed that most businesses remain small even after operating for many years; scalability seems to be a prominent problem among these firms (Bureau of Business Research, 2012). Some of the challenges that Hispanic entrepreneurs face include a lack of business education and managerial experience, as well as access to credit (Canedo, Stone, Black, & Lukaszewski, 2014). As FoxNews (2012) reported, larger banks tend to require more than two years’ proof of financial information to grant loans to entrepreneurs, and this is usually difficult for immigrants to provide. Similarly, the Texas study revealed that management/ leadership, sales, and communication are the top training needs for them (Bureau of Business Research, 2012). As the Geoscape (2015) report concludes, entrepreneurs are enthusiastic to start their business, but they struggle to get them off the ground and they also struggle to have procedures in place for cash management and overall financial planning. This also points to the lack of education and lack of credit opportunities cited earlier.
In the El Paso region, the pattern of Hispanic business reflects that of its population. Currently, 60 percent of businesses are owned primarily by Hispanics in El Paso County (U.S. Census Bureau, 2007). This region or Borderplex, as it is often called, encompasses parts of two countries and three states, and is one of the largest regions that boast a high percentage of Hispanics. Hispanic businesses are increasingly becoming the backbone of the economy of the U.S. Thus, understanding the factors that relate to Hispanic business success is of great interest for the health and well-being of the economy, especially on the U.S.-Mexico Border where the rate of entrepreneurial activities tends to be higher than in the U.S. interior (Mora & Dávila, 2006).
Survival of businesses in general is difficult. According to the Small Business Administration (2012), about half of all businesses survive the first five years or more, and about one third of businesses survive beyond 10 years. For Hispanics it is even more difficult to survive. A study conducted by Dávila and Mora (2014) hones in on the high minority shut down rates and revealed that from 2002-2007 Hispanic-male owned businesses failed at a 40% rate and Hispanic female-owned businesses failed at a 45% rate as shown in figure 1 below.
FIGURE 1
SHUT-DOWN RATES OF NEWLY ESTABLISHED FIRMS IN 2007 BY GENDER AND RACE/ETHNICITY
Source: Dávila and Mora. Authors’ estimates using the public-use microdata sample of the 2007 Survey of Business Owners. Notes: Newly established firms are those that opened in 2007. “Whites” refer to non-Hispanic whites. Firms ceasing operations that had initially opened for a one-time event or because the owner passed away are excluded.
12 Journal of Business Diversity Vol. 16(1) 2016

Georgarakos and Tasiramos (2008) also found in their studies a lower level of survival in entrepreneurship for foreign-born Mexicans and other Hispanics compared to non-Hispanic whites. In addition, they observe that among all minority groups African Americans are the only group of U.S. born individuals with a higher percentage of exits from entrepreneurship (Georgarakos & Tasiramos, 2008).
It is thought that education programs and networking provided by a Chamber of Commerce for entrepreneurs may diminish the high failure rates through tailored trainings by helping them understand how to modify business models that deal with growth, as well as how to achieve access to capital for expansion. With Hispanic business becoming a larger part of a healthy economy, this research investigates the failure and success rates as outcomes of various programs, which chambers and other organizations offer to these businesses. This exploratory study examines characteristics of Chamber of Commerce members and compares them to businesses that let membership lapse, in an effort to discover possible reasons for this behavior and their possible failures due to lack of programs and resources. HISPANIC BUSINESS NEEDS AND CHARACTERISTICS
Although research on Hispanic businesses is still at an early stage of development, previous research from the economic theoretical frameworks and from the behavioral sciences can shed light on Hispanic business performance and needs. Research in these areas can help determine economic and sociological factors that affect the start and growth of Hispanic enterprises.
Some of the latest research on Hispanic businesses has come from the Bureau of Business Research at the University of Texas at Austin. In 2011, the University conducted a study on Texas Hispanic-Owned Businesses with Paid Employees (2012). The UT Austin study cited many reasons for Hispanic businesses lagging behind other entrepreneurial businesses, including lower levels of education, smaller business networks, and a lower percentage of parents with a history of business experience (Bureau of Business Research, 2012). Additionally, the study cited management and leadership, relationship building, and communication skills as major training needs for the Hispanic business community. Less access to decision makers on government contracting opportunities, unfairly being excluded from participating in government contracts, and unfairly being excluded from participating in private sector opportunities, were cited as common reasons for lagging behind (Bureau of Business Research, 2012). Dávila and Mora (2013) also add that lack of access to credit and a lack of technology use affect these businesses greatly. Wang and Li (2007) also examine several metropolitan areas in the U.S. South, and show that the opportunities and challenges provided by each of these areas vary through the economic structure available in the area, the history of immigration, and the ethnic diversity. This means that the success of a Hispanic owned business varies significantly based on the resources available in the communities where they exist, whether they are institutional, political, social, or cultural (Wang & Li, 2007). Markman and Baron (2003), however, suggest that success really depends on the personal characteristics of the entrepreneur, and that a closer match between their skills, knowledge, values, and personality, the more satisfied and successful they can become. Sample Characteristics
The majority of the data collected for this study were provided by the Hispanic Chamber of Commerce1 for a large southwest Texas community. The original data set contained 1,000 records. However, this included multiple entries for some businesses based on the number of locations in the region. After eliminating duplicate records based on location, 687 unique observations remained. At this point, the database consisted of 75 fields, with partial data on each company in the sample. Observations for 165 businesses contained data in about 80% of the fields. For the remaining 522 businesses only about 40% of the fields were complete. To fill in missing data the following procedures were implemented:
1. Browsed businesses’ physical files. 2. Used Excel spreadsheets provided by Chamber staff. 3. Searched online for available information for each business. 4. Collected data via email survey, and
Journal of Business Diversity Vol. 16(1) 2016 13

5. Called businesses individually to complete remaining empty fields.
Four categories make up the membership of the Chamber data set: New Active, New Not Active, Renewal Active, and Renewal Not Active. The general objective of the study is to determine the characteristics of the businesses that compose each of the membership categories in an effort to determine differences between active and lapsed membership groups. Assuming that entrepreneurs drop membership because of a lack of felt benefit for the cost involved, it was hoped that deficiencies in desired services could be identified and remedied. The following are the descriptions for each membership category:
New Active: Businesses that have become active within the past year. New Not Active: Businesses that have not renewed their membership after their first year or have
not paid their dues and therefore were not renewed. Renewal Active: Businesses that are renewing each year and are current members of the
Chamber. Renewal Not Active: Businesses that had been with the Chamber longer than a year, but did not
renew this year. Data Analysis and Results
Once the data set was as complete as possible given the previously stated process, we began to analyze the data using the two step cluster option in SPSS. Based on the four categories described above, businesses were cluster based on various characteristics including; number of years as a member, industry, size, ownership type (public, private), owner gender/age, legal structure, and membership type. The two step cluster process requires complete data in each field, so the actual sample size for each analysis varies based on the degree of complete data in each variable selected for analysis. Analysis 1
The first set of variables tested included all of the variables mentioned above. The two-step cluster test yielded two clusters. The number of records included on each cluster were 20 (47.6%) and 22 (52.4%) for a total of 44. Figure 2 shows all of the variables entered and the two clusters it yielded. The top four variables are the most important in determining cluster membership. “Status (1-4)”, which is the membership category stated previously, “new date”, which is the number of years as a member of the Chamber, “business type”, which is the industry, and gender, were the four strongest variables. The last four variables, size of business, ownership type, legal structure, and membership type (based on cost) added little to determining cluster membership. The top four variables mentioned above are the strongest with over 80% of the influence on determining clusters.
FIGURE 2
0 0.5 1 1.5
Status (1-4) NewDate
Business Type Gender
Size Ownership Type
Legal Structure Membership Type
Predictor Importance
Predictor Importance
14 Journal of Business Diversity Vol. 16(1) 2016
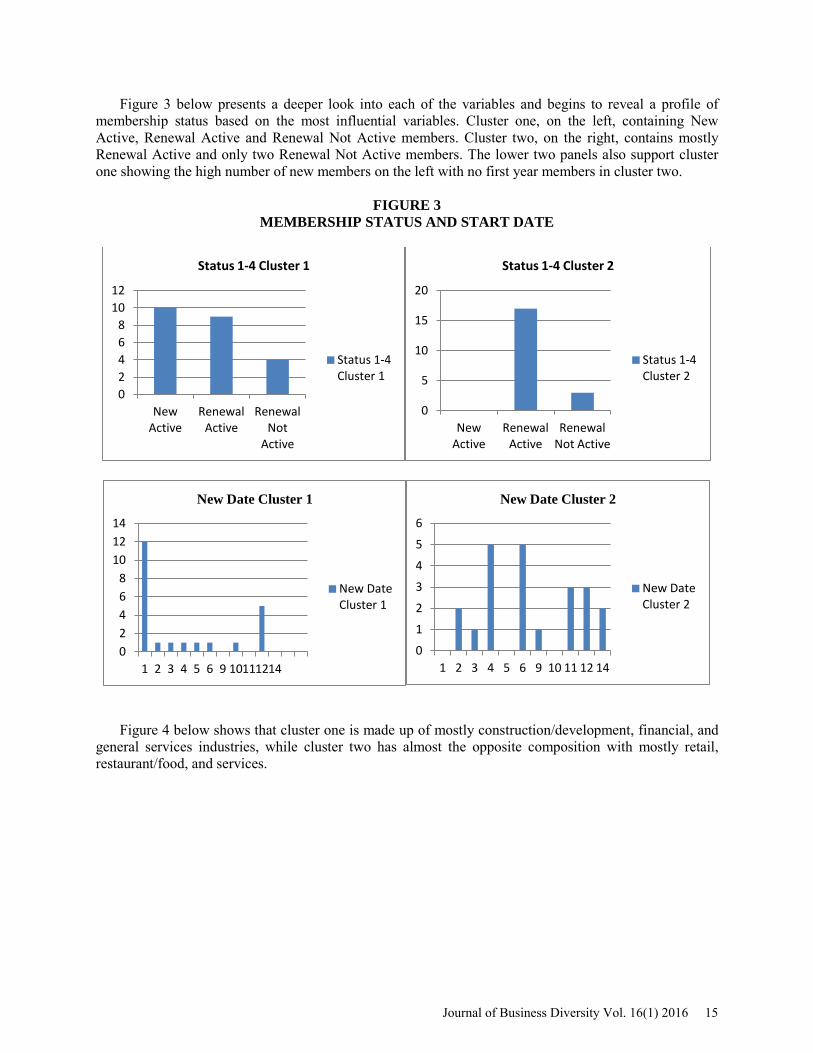
Figure 3 below presents a deeper look into each of the variables and begins to reveal a profile of membership status based on the most influential variables. Cluster one, on the left, containing New Active, Renewal Active and Renewal Not Active members. Cluster two, on the right, contains mostly Renewal Active and only two Renewal Not Active members. The lower two panels also support cluster one showing the high number of new members on the left with no first year members in cluster two.
FIGURE 3 MEMBERSHIP STATUS AND START DATE
Figure 4 below shows that cluster one is made up of mostly construction/development, financial, and
general services industries, while cluster two has almost the opposite composition with mostly retail, restaurant/food, and services.
0 2 4 6 8
10 12
New Active
Renewal Active
Renewal Not
Active
Status 1-4 Cluster 1
Status 1-4 Cluster 1
0
5
10
15
20
New Active
Renewal Active
Renewal Not Active
Status 1-4 Cluster 2
Status 1-4 Cluster 2
0 2 4 6 8
10 12 14
1 2 3 4 5 6 9 10 11 12 14
New Date Cluster 1
New Date Cluster 1
0
1
2
3
4
5
6
1 2 3 4 5 6 9 10 11 12 14
New Date Cluster 2
New Date Cluster 2
Journal of Business Diversity Vol. 16(1) 2016 15
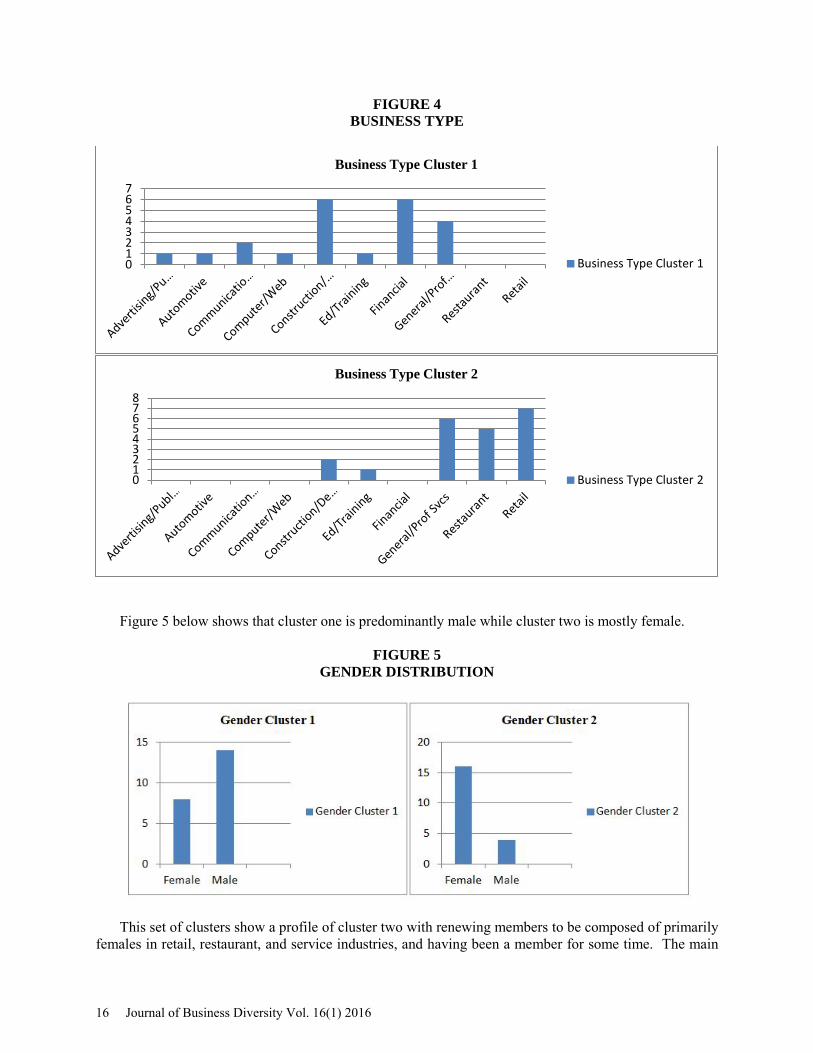
FIGURE 4 BUSINESS TYPE
Figure 5 below shows that cluster one is predominantly male while cluster two is mostly female.
FIGURE 5 GENDER DISTRIBUTION
This set of clusters show a profile of cluster two with renewing members to be composed of primarily females in retail, restaurant, and service industries, and having been a member for some time. The main
0 1 2 3 4 5 6 7
Business Type Cluster 1
Business Type Cluster 1
0 1 2 3 4 5 6 7 8
Business Type Cluster 2
Business Type Cluster 2
16 Journal of Business Diversity Vol. 16(1) 2016

profile for cluster one is dominated by male owners that are primarily Newly Active or Renewal Not Active, which means they are newer to the Chamber. This is the group that may require the greatest attention to determine what might encourage them to remain as a member of the organization. Perhaps they do not see that their success depends on getting help or attending programs provided by the organization. Analysis 2
With gender emerging as a significant discriminator of membership status, additional analyses were run to determine a more accurate profile of female owned businesses. The second analysis yielded two clusters with gender as the strongest predictor of cluster membership, followed by “business type”, which is the industry, size, type of ownership, and “status (1-4)”, which is the membership category explained earlier.
Figure 6 below shows that two other variables had relatively minor influence on membership status.
FIGURE 6 CLUSTER PREDICTORS
Figure 7 below shows the clear gender difference between the two clusters with most males
dominating cluster one and only females dominating in cluster two.
FIGURE 7 GENDER DISTRIBUTION
0 0.2 0.4 0.6 0.8 1 1.2
Status (1-4) NewDate
Business Type Gender
Size Ownership Type
Legal Structure Membership Type
Predictor Importance
Predictor Importance
0
5
10
15
20
Female Male
Gender Cluster 1
Gender Cluster 1
0
5
10
15
20
Female Male
Gender Cluster 2
Gender Cluster 2
Journal of Business Diversity Vol. 16(1) 2016 17

Figure 8 shows the male dominated cluster one as slightly larger businesses than the female dominated cluster two. Company size here is defined somewhat differently from the standard employed by the Small Business Administration. Since most of the chamber’s members are actually small according to the SBA definition, it would not help them to define all of their members with that metric. In this data set, small is less than 10 employees, medium is less than 100 employees, and large is 100 or more employees.
FIGURE 8 COMPANY SIZE
Figure 9 below shows a similar pattern of membership to the first analysis with cluster two primarily
renewals while cluster one has both new and renewals. Again, female-owned businesses are smaller, but they are renewing membership at a higher rate than the male-owned larger businesses.
FIGURE 9 MEMBERSHIP STATUS
Analysis 3 Analysis three focuses on business size and only the two categories of members after the first year -
Renewal Active and Renewal Not Active. This was intended to get a clearer picture of those that renewed and those that did not. A separate test of New Active and New Not Active membership was also conducted, but it yielded one cluster, so no further analysis was done on that group.
0
5
10
15
20
Small Medium
Size Cluster 1
Size Cluster 1
0
5
10
15
20
Small Medium
Size Cluster 2
Size Cluster 2
0 2 4 6 8
10 12 14
New Active
Renewal Active
Renewal Not
Active
Status 1-4 Cluster 1
Status 1-4 Cluster 1
0
5
10
15
New Active
Renewal Active
Renewal Not
Active
Status 1-4 Cluster 2
Status 1-4 Cluster 2
18 Journal of Business Diversity Vol. 16(1) 2016

In this analysis three clusters emerged. Clusters one and two were almost entirely small businesses while cluster three had a majority of medium sized businesses. These results are presented in Figure 10.
FIGURE 10
COMPANY SIZE
Figure 11 below shows the difference between cluster one and two with respect to the tenure of the
business with the Chamber. Cluster one is primarily newer, though not first year, members. Cluster two consists of members in the third to eighth year of tenure, while cluster three is longer term members.
FIGURE 11
MEMBERSHIP TENURE
0
5
10
15
20
Smal
l M
ediu
m
Larg
e Size Cluster 1
Size Cluster 1
0 5
10 15 20 25 30 35
Size Cluster 2
Size Cluster 2
0
5
10
15
20
Smal
l
Med
ium
Larg
e
Size Cluster 3
Size Cluster 3
Journal of Business Diversity Vol. 16(1) 2016 19
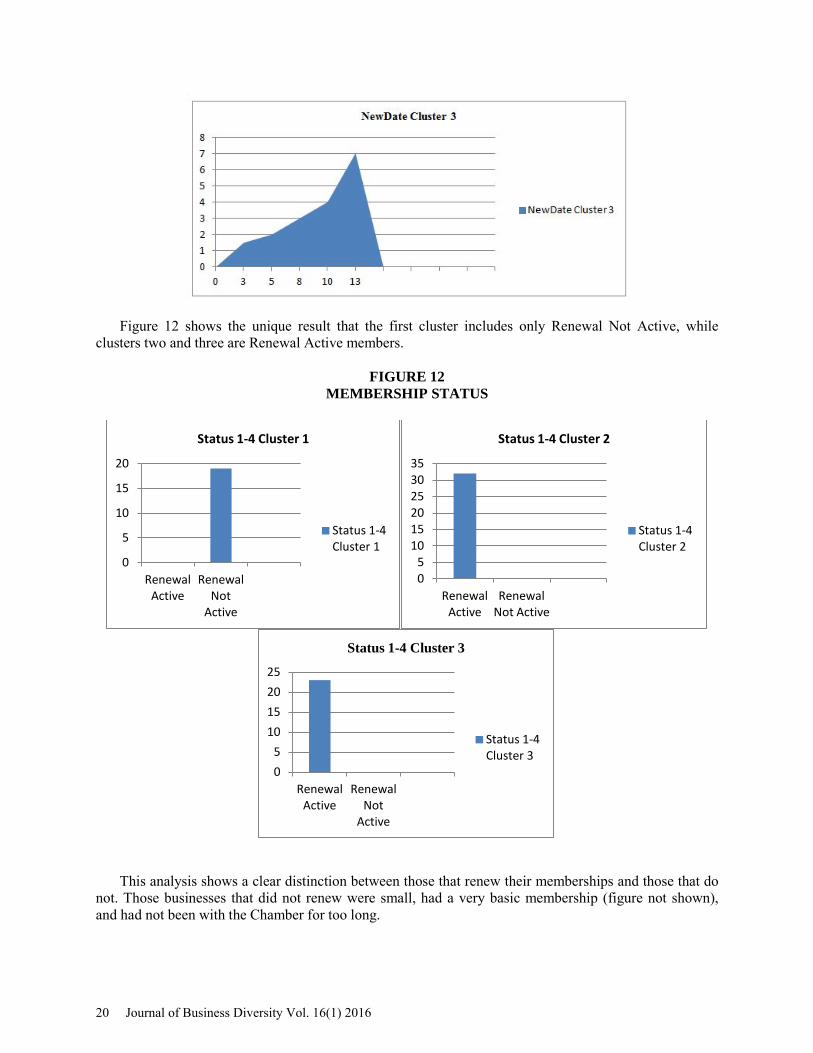
Figure 12 shows the unique result that the first cluster includes only Renewal Not Active, while clusters two and three are Renewal Active members.
FIGURE 12
MEMBERSHIP STATUS
This analysis shows a clear distinction between those that renew their memberships and those that do not. Those businesses that did not renew were small, had a very basic membership (figure not shown), and had not been with the Chamber for too long.
0
5
10
15
20
Renewal Active
Renewal Not
Active
Status 1-4 Cluster 1
Status 1-4 Cluster 1
0 5
10 15 20 25 30 35
Renewal Active
Renewal Not Active
Status 1-4 Cluster 2
Status 1-4 Cluster 2
0 5
10 15 20 25
Renewal Active
Renewal Not
Active
Status 1-4 Cluster 3
Status 1-4 Cluster 3
20 Journal of Business Diversity Vol. 16(1) 2016

CONCLUSIONS AND FUTURE RESEARCH
The results suggest that female-owned businesses tend to renew membership at a much higher rate than do male-owned businesses. If memberships are renewed because owners perceive that they gain something by the membership, it would be interesting to now survey these businesses to determine why women feel they get a greater benefit than do men. It might also be that men and women tend to enter different types of businesses and certain types of businesses gain more than others. This is indicated in analysis one Figure 4 with female owned businesses being primarily services, restaurants, and retailers while males owned more financial, construction, and automotive types of businesses. Business size might also play a role in benefits derived with medium sized businesses renewing at a higher rate, though lower total membership, than smaller businesses. This combined with the result that renewing businesses are somewhat older members than the non-renewing businesses, might suggest the need to find out if the Chamber is over promising new members benefits that it cannot provide. Future research can address this question too. Other research might survey a broader group of both Hispanic and non-Hispanic business owners to identify success and failure causes and whether they vary by ethnic group. This is just the beginning of a stream of research intended to help Hispanic-owned businesses succeed. Finding out why businesses maintain or drop membership in the Chamber of Commerce may help in this process. ENDNOTE
1. We would like to thank the El Paso Hispanic Chamber of Commerce for supporting this research. REFERENCES Dávila, A., & Mora, M. T. (2013). Hispanic entrepreneurs in the 2000s. Stanford, California: Stanford
University Press. Dávila, A., & Mora, M. T. (2014, July 14). Nearly half of new small businesses established by Black and
Hispanic women shut down within a year [Web log post]. Retrieved from http://blogs.lse.ac.uk/usappblog/2014/07/10/nearly-half-of-new-small-businesses-established-by-black-and-hispanic-women-shut-down-within-a-year/
Bates, T., Jackson, W. E., & Johnson, J. H. (2007). Advancing research on minority entrepreneurship. American Academy of Political and Social Science, 613, 10-17. Retrieved from http://www.jstor.org/stable/25097945
Bureau of Business Research. (2012). Survey of Texas Hispanic-owned businesses with paid employees. Retrieved from http://repositories.lib.utexas.edu/bitstream/handle/2152/17525/bbr-2012-texas-hispanic- owned-businesses.pdf
Canedo, J. L., Stone, D. L., Black, S. M., &Lukaszewski, K. (2014). Individual factors affecting entrepreneurship in Hispanics. Journal of Managerial Psychology, 29(6), 755-772. doi:10.1108/JMP-11-2012-0333
FoxNews. (2012). 4 Resources for Hispanic Business Owners. Retrieved from http://smallbusiness.foxbusiness.com/entrepreneurs/2012/09/18/4-resources-for-hispanic-business-owners/
Georgarakos, D., & Tatsiramos, L. (2009). Entrepreneurship and survival dynamics of immigrants to the U.S. and their descendants. Labour Economics, 16(2), 161-170. doi: 10.1016/j.labeco.2008.08.006
Geoscape. (2013). Hispanic businesses & entrepreneurs drive growth in the new economy (2013 Report). Retrieved from http://geoscape.com/AMDS2013
Geoscape. (2015) Hispanic businesses & entrepreneurs drive growth in the new economy (3rd Annual Report 2015). Retrieved from http://geoscape.com/AMDS
Journal of Business Diversity Vol. 16(1) 2016 21

Kauffman Foundation. (2009). Business dynamics briefing: high growth and failure of young firms. Retrieved from http://www.kauffman.org/~/media/kauffman_org/research%20reports%20and %20covers/2009/04/bds_high_growth_and_failure_4609.pdf
Markman, G. D. & Baron, R. (2003). Person-entrepreneurship fit: why some people are more successful as entrepreneurs than others. Human Resource Management Review, 13, 281-301. doi: 10.1016/S1053-4822(03)00018-4
Mora, M. T., & Dávila, A. (2006). Mexican Immigrant Self-Employment Along the U.S.-Mexico Border: An Analysis of Census Data. Social Science Quarterly, 87 (1), 97-109. Retrieved from http://onlinelibrary.wiley.com/doi/10.1111/j.0038-4941.2006.00370.x/pdf
Pisani, M., Guzman, J. M., Richardson, C., & Sepulveda, C. (2014, April). Latino entrepreneurship in South Texas. Paper presented at the Association for Borderlands Studies, Albuquerque, NM.
Small Business Administration. (2012). Frequently asked questions about small businesses. Retrieved from http://www.sba.gov/sites/default/files/FAQ_Sept_2012.pdf
U.S. Census Bureau. (2007). 2007 survey of business owners summaries of findings (Report 2007). Retrieved from http://www.census.gov/econ/sbo/getsof.html?07hispanic
U.S. Census Bureau. (2010). Hispanic population: 2010 (Report No. C2010BR-04). Retrieved from http://www.census.gov/prod/cen2010/briefs/c2010br-04.pdf
Wang, Q., & Li, W. (2007). Entrepreneurship, ethnicity and local contexts: Hispanic entrepreneurs in three U.S. southern metropolitan areas. GeoJournal, 68, 167-182. doi: 10.1007/s10708-007-9081-0
22 Journal of Business Diversity Vol. 16(1) 2016