understanding excess body weight - ministry of … · understanding excess body weight: new zealand...
TRANSCRIPT
Understanding
Excess Body
Weight
New Zealand Health Survey
Citation: Ministry of Health. 2015. Understanding Excess Body Weight: New Zealand
Health Survey. Wellington: Ministry of Health.
Published in April 2015
by the Ministry of Health
PO Box 5013, Wellington 6145, New Zealand
ISBN: 978-0-478-44456-8 (online)
HP 6085
This document is available at www.health.govt.nz
This work is licensed under the Creative Commons Attribution 4.0 International licence. In essence, you
are free to: share ie, copy and redistribute the material in any medium or format; adapt ie, remix, transform and build
upon the material. You must give appropriate credit, provide a link to the licence and indicate if changes were made.
Understanding Excess Body Weight: New Zealand Health Survey iii
Foreword
I am pleased to present this report that describes the body weight of New Zealanders. In this
report the weight of adults and children, as measured by body mass index, are compared for
different sub-populations. The report also compares the overweight- and obesity-related risk of
ill health predicted by three additional measures of excess body weight; waist circumference,
waist-to-height ratio and body mass index/ waist circumference ratio. Finally, the report tracks
the prevalence of obesity in New Zealand over the last 36 years by analysing data from historic
national surveys.
The report uses data collected between 2011 and 2013 as part of the New Zealand Health Survey.
The pooling of data across years was enabled when the Survey became continuous in 2011. The
Survey provides a valuable data source that includes a range of health topics, collected from
about 13,000 adults and over 4000 children each year.
I look forward to future releases from the Survey that will provide further insight into the health
of New Zealanders.
I would like to extend a special thank you to the many thousands of New Zealanders who gave
their time to take part in the survey. The information they have provided is critical for informing
and monitoring the body weight of adults and children in New Zealand.
I hope you find this report useful and informative.
Don Gray
Deputy Director-General, Policy
Ministry of Health
iv Understanding Excess Body Weight: New Zealand Health Survey
Authors
This report was written by Hilary Sharpe and Sarah Bradbury, with statistical analysis
undertaken by Matt Cronin, Robert Templeton, Deepa Weerasekera and Michelle Liu. Input was
provided by Maria Turley, Denise Hutana and Jackie Fawcett (Health and Disability
Intelligence, Ministry of Health), Elizabeth Aitken and David Foley (Clinical Leadership.
Protection and Regulation, Ministry of Health), Roimata Timutimu (Māori Health, Ministry of
Health) and Scott Ryland (Policy Business Unit, Ministry of Health).
Understanding Excess Body Weight: New Zealand Health Survey v
Contents
Foreword iii
Authors iv
Introduction 1
Overview 1
Background 1
Methods 3
Data sources 3
Measurement of body size 4
Decade of birth analysis 6
Interpretation notes 8
Excess body weight in adults 10
Key messages 10
Obesity rates in adults 11
Body mass index distribution 16
Alternative measures of excess body weight 18
Tracking the obesity epidemic 22
Excess body weight in children 27
Key messages 27
Body mass index distribution 28
Alternative measures of excess body weight 30
Relationship between parental and child obesity status 31
Parental perception of child weight 31
Summary 33
Appendices 35
Appendix 1: Age-period-cohort analysis by ethnic group 35
Appendix 2: Comparison of BMI distribution in children for 2006/07 and 2011–2013 36
Appendix 3: Parental perception of obese child’s weight, by child’s ethnic group 37
Appendix 4: Parental perception of obese child’s weight, by deprivation quintile 38
References 39
vi Understanding Excess Body Weight: New Zealand Health Survey
List of Tables
Table 1: Body mass index cut-off points for adults aged 18 years and over 4
Table 2: International Obesity Task Force BMI reference values for children and
adolescents aged 2–17 years 5
Table 3: Waist circumference cut-off points for adults aged 18 years and over 5
Table 4: Body mass index/WC matrix 5
Table 5: Sample sizes used in this report, by birth decade and period surveyed 6
Table 6: BMI distribution by sociodemographic characteristics, for males, 2011–2013 13
Table 7: BMI distribution by sociodemographic characteristics, for females,
2011–2013 14
Table 8: Adjusted rate ratios for obesity and extreme obesity among adults 15
Table 9: Percentage of adults in each WC category, by sex, 2011–2013 18
Table 10: Percentage of adults with a WHtR equal to or greater than 0.5, by ethnic
group and sex 20
Table 11: Comparison of measures of excess body weight, by sex, 2011–2013 20
Table 12: Comparison of measures of excess body weight, by ethnic group, males,
2011–2013 21
Table 13: Comparison of measures of excess body weight, by ethnic group, females,
2011–2013 21
Table 14: Body mass index distribution in adults by survey year and sex 22
Table 15: Sociodemographic characteristics of children, by BMI category, 2011–2013 29
Table 16: Adjusted rate ratios for obesity and morbid obesity among children 29
Table 17: Percentage of children with a WHtR greater than or equal to 0.5, by sex and
ethnic group 30
Table 18: Comparison of child versus parent weight status, by BMI category 31
Table 19: Parental perception of child’s weight compared to BMI measurement 31
Table 20: Body mass index distribution in children by survey year and sex 36
Table 21: Parental perception of child’s weight compared to BMI measurement, by
ethnic group 37
Table 22: Parental perception of their obese child’s weight status, by deprivation 38
Understanding Excess Body Weight: New Zealand Health Survey vii
List of Figures
Figure 1: Proportion of adults in each BMI category, 2011–2013 11
Figure 2: Rates of obesity and extreme obesity, by sex and ethnic group, 2011–2013 12
Figure 3: Body mass index distribution in adults, by sex, 2011–2013 16
Figure 4: Body mass index distribution in adults, by ethnic group, 2011–2013 17
Figure 5: Body mass index distribution in adults, by deprivation, 2011–2013 17
Figure 6: Percentage of adults in each BMI/WC risk category, by sex, 2011–2013 19
Figure 7: Percentage of adults in each BMI/WC risk category, by ethnic group,
2011–2013 19
Figure 8: Body mass index distribution in adults, 1997 and 2011–2013 22
Figure 9: Adult obesity rate, 1977*–2012/13 23
Figure 10: Adult obesity rate, by birth cohort, 1977–2012/13 24
Figure 11: Adult obesity rate, by age and year of survey, 1977–2011-13 25
Figure 12: Change in the obesity rate, by birth cohort and age at time of survey 25
Figure 13: Percentage of children in each BMI category, by sex and ethnic group,
2011–2013 28
Figure 14: Parental perception of their obese child’s weight status, by age group 32
Figure 15: Change in obesity prevalence by age at time of survey, by birth cohort and
ethnic group 35

Understanding Excess Body Weight: New Zealand Health Survey 1
Introduction
Overview This report reviews the current status of the obesity epidemic in New Zealand, exploring the
increase in obesity observed over the last 36 years. It looks at the population subgroups that are
affected most, and investigates the impact of the obesity epidemic on different birth cohorts. As
well as focusing on overweight and obesity, it looks at the prevalence of extreme obesity, where
health impacts on individuals are likely to be most pronounced. This information will help
inform future health policy on the promotion of healthy weight and the management of obesity.
Background Excess body weight is one of the most important modifiable risk factors for a number of
important diseases, including type 2 diabetes, ischaemic heart disease, ischaemic stroke and
several common cancers. Obese individuals are also at increased risk of sleep apnoea, infertility,
gout and musculoskeletal problems such as osteoarthritis (WHO 2000). High body mass index
(BMI) is now one of the top three risk factors contributing to ill health and disability, and to
shortened life expectancy, in New Zealanders (Ministry of Health 2013a).
Individuals who are extremely obese (defined as having a BMI of ≥ 40 kg/m2 (obese class III))
have the highest risk of obesity-related ill health, and pose the greatest burden on health care
services (Calle et al 1999; Arterburn et al 2005). Life expectancy in extremely obese people is
shortened by an estimated 8–10 years, compared with 2–4 years among those with a BMI of
30–35 kg/m2 (obese class I) (Whitlock et al 2009).
Obesity among children is also of concern; obese children are at increased risk of remaining
obese into adulthood (Serdula et al 1993). Obese children are more likely to be pre-diabetic and
to have early markers of cardiovascular disease, including high cholesterol and raised blood
pressure. In the short term, obese children are at greater risk of bone and joint problems, sleep
apnoea, and social and psychological problems such as stigmatisation and poor self-esteem
(Daniels et al 2005).
This report uses pooled data from the 2011–2013 New Zealand Health Survey to look at the
prevalence of overweight and obesity (including extreme obesity) among children and adults. It
looks at the obesity rate among different population subgroups and over time, to facilitate
understanding of the obesity epidemic. It also explores parental perception of children’s weight,
and the association between parent and child obesity.
An individual’s BMI does not tell us about the distribution of body fat on that individual, which
can impact on the resulting risk of ill health. In particular, excess abdominal fat increases an
individual’s risk of diabetes and cardiovascular disease (Janssen et al 2002). This report uses
waist circumference (WC) and waist-to-height ratio (WHtR) as alternative methods for
measuring body size and categorising disease risk.
2 Understanding Excess Body Weight: New Zealand Health Survey
There has been a dramatic increase in the global prevalence of obesity over recent decades
(OECD 2014). New Zealand, like other developed nations, has seen overweight and obesity
become the norm, affecting nearly two-thirds of adults and a third of children. Since the 1970s
the prevalence of obesity in adults has increased three-fold, from 10 percent in 1977 to 30
percent in 2011–2013. Time trend information on childhood obesity is not available as far back;
however, between 2006/07 and 2011–2013 the rate of obesity among 2–14-year olds increased
from 9 percent to 11 percent.
The potential reasons for the recent increase in obesity are complex, but are largely attributed to
the increasingly obesogenic environment in which we live (Swinburn 2008). The last three
decades have seen a much greater availability and promotion of cheap, energy-dense, nutrient-
poor foods, together with a reduction in physical activity levels. This report looks at how the
obesity epidemic is affecting different birth cohorts, exploring whether the obesogenic
environment is having a greater impact on those born more recently.
Did you find what you were looking for?
Please help us improve our reports – tell us whether we are giving you the information you
want at: www.health.govt.nz/nzhs-feedback
It will only take a minute or two, and we really value your feedback!
Understanding Excess Body Weight: New Zealand Health Survey 3
Methods
Data sources This report is based on data from cross-sectional health surveys conducted in New Zealand over
a 36-year period (1977–2013). The surveys all involved large, nationally representative random
samples, where surveyors approached respondents in their homes and physically measured
their heights and weights. There were some differences in the survey design and data collection
methodology, but overall the researchers consider these differences are not likely to significantly
bias the broad patterns of obesity rate changes that were observed.
The 1977 National Diet Survey involved over 1900 New Zealanders (Birkbeck 1983). The 1989
Life in New Zealand study was commissioned by the Hillary Commission and run by Otago
University (Russell 1991). Data for children aged 5–14 years in 2002 comes from the National
Children’s Nutrition Survey, funded by the Ministry of Health and conducted by Otago,
Auckland and Massey Universities (Ministry of Health 2003).
The 1997 National Nutrition Survey was undertaken in a subset of 1996/97 New Zealand Health
Survey respondents. The target population for the 1996/97 New Zealand Health Survey was the
total usually resident, non-institutionalised civilian population of all ages residing in permanent
private dwellings. A stratified multi-stage cluster sampling process was undertaken to select a
sample from this population. Māori and Pacific peoples were over-sampled. Further details
about the survey design are reported in Taking the Pulse: The 1996/97 New Zealand Health
Survey (Ministry of Health 1999) and NZ Food: NZ People: Key results of the 1997 National
Nutrition Survey (Ministry of Health 2003).
The New Zealand Health Survey collects a wealth of information on the health and wellbeing of
New Zealanders. The survey results refer to the usually resident population of all ages living in
permanent dwellings, aged-care facilities and student accommodation. Not included in the
survey are: people living in institutions (such as prisons and long-term hospital care), the
homeless, short-term visitors and tourists.
The New Zealand Health Survey introduced measurement of the height and weight of adults in
the 2002/03 survey. Measurement of height and weight in children aged 2–14 years was then
introduced in the 2006/07 survey. Further details about the 2002/03 and the 2006/07 New
Zealand Health Survey study design can be found on the Ministry of Health website:
www.health.govt.nz.
In July 2011 the New Zealand Health Survey became a continuous survey, allowing data to be
pooled from the 2011/2012 and the 2012/2013 survey collection rounds. Pooling data in this
manner provides a larger sample size, allowing analyses at a greater level of detail for certain
population groups. The majority of data referred to in this report were collected over the
24-month period between July 2011 and June 2013.
Further details about the current New Zealand Health Survey methodology are available in the
New Zealand Health Survey Methodology Report 2012/13 (Ministry of Health 2013b).
4 Understanding Excess Body Weight: New Zealand Health Survey
Measurement of body size Body mass index is the most commonly used measure of body size, and is the measure routinely
reported in the New Zealand Health Survey annual indicator reports.
This report presents data for a number of different measures, including: BMI, WC, BMI/WC
matrix and WHtR. The following sections provide more detail.
Body mass index – adults
Body mass index is an index of weight adjusted for height, and is calculated in adults by dividing
weight in kilograms by height in metres squared (kg/m2). Body mass index is widely used as an
indirect measure of body fatness because it is relatively simple to measure and is correlated with
total body fat.
Although BMI is correlated with total body fat, it varies according to age, gender, ethnicity and
other factors, such as body build. This variation occurs primarily because BMI does not
differentiate between lean and fat mass; nor does it provide information on the distribution of
body fat. Although BMI is a reasonable indicator of body fatness in populations and in most
individuals, it is not a reliable indicator for all individuals.
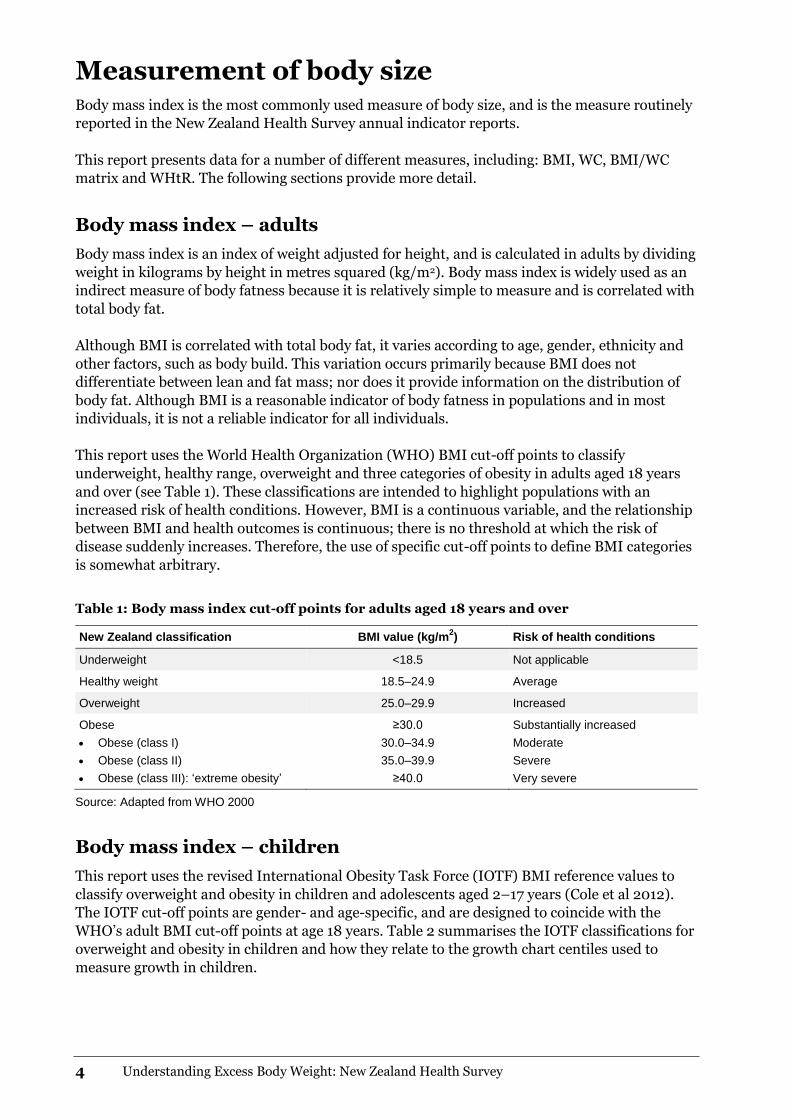
This report uses the World Health Organization (WHO) BMI cut-off points to classify
underweight, healthy range, overweight and three categories of obesity in adults aged 18 years
and over (see Table 1). These classifications are intended to highlight populations with an
increased risk of health conditions. However, BMI is a continuous variable, and the relationship
between BMI and health outcomes is continuous; there is no threshold at which the risk of
disease suddenly increases. Therefore, the use of specific cut-off points to define BMI categories
is somewhat arbitrary.
Table 1: Body mass index cut-off points for adults aged 18 years and over
New Zealand classification BMI value (kg/m2) Risk of health conditions
Underweight <18.5 Not applicable
Healthy weight 18.5–24.9 Average
Overweight 25.0–29.9 Increased
Obese
Obese (class I)
Obese (class II)
Obese (class III): ‘extreme obesity’
≥30.0
30.0–34.9
35.0–39.9
≥40.0
Substantially increased
Moderate
Severe
Very severe
Source: Adapted from WHO 2000
Body mass index – children
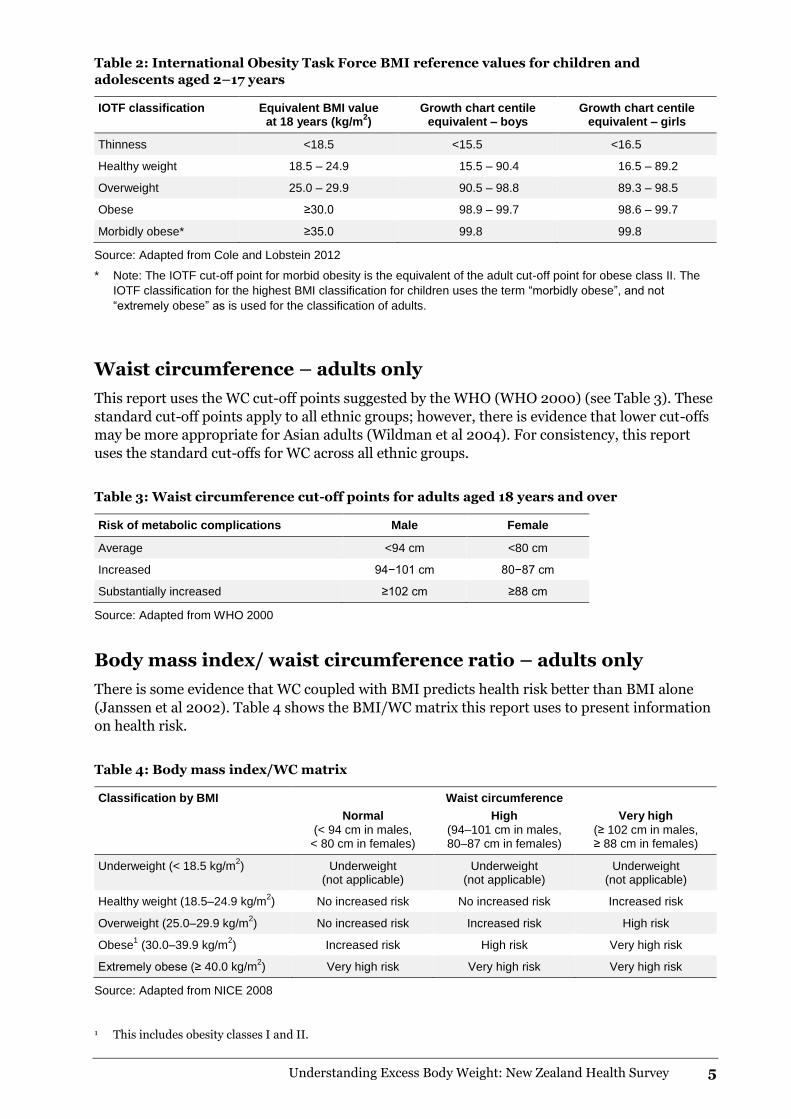
This report uses the revised International Obesity Task Force (IOTF) BMI reference values to
classify overweight and obesity in children and adolescents aged 2–17 years (Cole et al 2012).
The IOTF cut-off points are gender- and age-specific, and are designed to coincide with the
WHO’s adult BMI cut-off points at age 18 years. Table 2 summarises the IOTF classifications for
overweight and obesity in children and how they relate to the growth chart centiles used to
measure growth in children.
Understanding Excess Body Weight: New Zealand Health Survey 5
Table 2: International Obesity Task Force BMI reference values for children and
adolescents aged 2–17 years
IOTF classification Equivalent BMI value at 18 years (kg/m
2) Growth chart centile
equivalent – boys Growth chart centile
equivalent – girls
Thinness <18.5 <15.5 <16.5
Healthy weight 18.5 – 24.9 15.5 – 90.4 16.5 – 89.2
Overweight 25.0 – 29.9 90.5 – 98.8 89.3 – 98.5
Obese ≥30.0 98.9 – 99.7 98.6 – 99.7
Morbidly obese* ≥35.0 99.8 99.8
Source: Adapted from Cole and Lobstein 2012
* Note: The IOTF cut-off point for morbid obesity is the equivalent of the adult cut-off point for obese class II. The
IOTF classification for the highest BMI classification for children uses the term “morbidly obese”, and not
“extremely obese” as is used for the classification of adults.
Waist circumference – adults only
This report uses the WC cut-off points suggested by the WHO (WHO 2000) (see Table 3). These
standard cut-off points apply to all ethnic groups; however, there is evidence that lower cut-offs
may be more appropriate for Asian adults (Wildman et al 2004). For consistency, this report
uses the standard cut-offs for WC across all ethnic groups.
Table 3: Waist circumference cut-off points for adults aged 18 years and over
Risk of metabolic complications Male Female
Average <94 cm <80 cm
Increased 94−101 cm 80−87 cm
Substantially increased ≥102 cm ≥88 cm
Source: Adapted from WHO 2000
Body mass index/ waist circumference ratio – adults only
There is some evidence that WC coupled with BMI predicts health risk better than BMI alone
(Janssen et al 2002). Table 4 shows the BMI/WC matrix this report uses to present information
on health risk.
Table 4: Body mass index/WC matrix
Classification by BMI Waist circumference
Normal
(< 94 cm in males, < 80 cm in females)
High
(94–101 cm in males, 80–87 cm in females)
Very high
(≥ 102 cm in males, ≥ 88 cm in females)
Underweight (< 18.5 kg/m2) Underweight
(not applicable) Underweight
(not applicable) Underweight
(not applicable)
Healthy weight (18.5–24.9 kg/m2) No increased risk No increased risk Increased risk
Overweight (25.0–29.9 kg/m2) No increased risk Increased risk High risk
Obese1 (30.0–39.9 kg/m
2) Increased risk High risk Very high risk
Extremely obese (≥ 40.0 kg/m2) Very high risk Very high risk Very high risk
Source: Adapted from NICE 2008
1 This includes obesity classes I and II.

6 Understanding Excess Body Weight: New Zealand Health Survey
Waist-to-height ratio – adults and children
Research has identified a WHtR equal to or greater than 0.5 as indicative of increased
cardiovascular disease and diabetes risk (Browning et al 2010). This research indicates that a
WHtR cut-off of 0.5 (regardless of unit used, eg, centimetres or inches) is suitable for use as an
indicator of overweight in both males and females and across all ethnic groups. The universality
of this cut-off provides a convenient and simple public health message: that individuals should
keep their waist circumference to less than half their height.
This report also uses WHtR to measure excess body weight in children. A study using data from
the 2002 National Children’s Nutrition Survey found that WHtR was highly correlated with BMI
in children, regardless of ethnicity (Goulding et al 2010). It showed that there was little variation
in WHtR cut-offs by age, reducing the need for age-specific cut-offs as in the context of BMI.
Further information
Further information on the anthropometric measures collected and used by the New Zealand
Health Survey are available on the Ministry of Health’s website in Body Size Technical Report:
Measurements and classifications in the 2006/07 New Zealand Health Survey.
Decade of birth analysis Cross-sectional survey data going back to 1977 has enabled us to examine rates of obesity in
those born in the same decade and track how their obesity rates have changed over time.
By examining how obesity rates change by birth decade we obtain a deeper understanding of
how the prevalence of obesity can change as people get older (age effects). We can also study the
effect of spending a greater amount of one’s life exposed to periods when obesity has generally
become much more prevalent (period effects). This can increase our understanding of how the
current age distribution of obesity has occurred, and, in turn, of how New Zealand’s overall
obesity prevalence might change in future decades.
This report presents an exploratory first-stage analysis. More formal statistical modelling using
an age-period-cohort approach may well be the next stage. However, such models are practically
and even conceptually problematic: age, period and cohort effects are not independent of each
other, and cannot be disentangled without making some simplifying assumptions.
Research for this report did not track the same birth cohort over time. Instead, it used data on
individuals who share a birth decade who responded to any of the health surveys discussed
above. Migration in and out of the country means the populations represented by our birth-
decade groups varied a little over time. In this sense the obesity rate trajectories this report
observes in its ‘birth decade’ samples are only proxies for the obesity rate trajectories that might
have been observed from a true longitudinal cohort study.
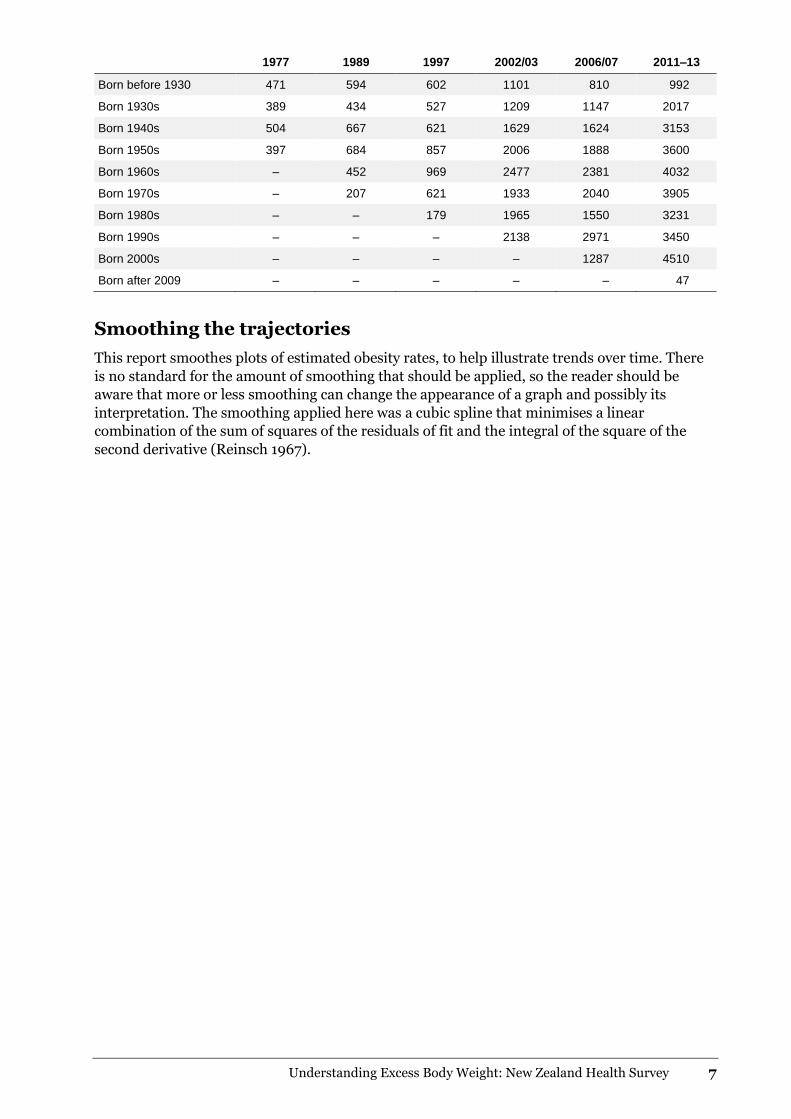
Sample sizes
The following table gives the sample sizes used in this report, by birth decade and period
surveyed.
Table 5: Sample sizes used in this report, by birth decade and period surveyed
Year of survey
Understanding Excess Body Weight: New Zealand Health Survey 7
1977 1989 1997 2002/03 2006/07 2011–13
Born before 1930 471 594 602 1101 810 992
Born 1930s 389 434 527 1209 1147 2017
Born 1940s 504 667 621 1629 1624 3153
Born 1950s 397 684 857 2006 1888 3600
Born 1960s – 452 969 2477 2381 4032
Born 1970s – 207 621 1933 2040 3905
Born 1980s – – 179 1965 1550 3231
Born 1990s – – – 2138 2971 3450
Born 2000s – – – – 1287 4510
Born after 2009 – – – – – 47
Smoothing the trajectories
This report smoothes plots of estimated obesity rates, to help illustrate trends over time. There
is no standard for the amount of smoothing that should be applied, so the reader should be
aware that more or less smoothing can change the appearance of a graph and possibly its
interpretation. The smoothing applied here was a cubic spline that minimises a linear
combination of the sum of squares of the residuals of fit and the integral of the square of the
second derivative (Reinsch 1967).
8 Understanding Excess Body Weight: New Zealand Health Survey
Interpretation notes
This section provides some key points for interpreting survey results presented in this report.
For more details about survey methodology, see the New Zealand Health Survey Methodology
Report (Ministry of Health 2013b).
Representative population
All results presented in this report are weighted so that they are representative of the total adult
population (those aged 15 years and over) and the total child population (those aged 2–14
years).
Calculation of proportions
The proportion of the population who belong to a particular group (eg, the proportion of the
population who are obese) is estimated by calculating the sum of the weights for the obese group
divided by the sum of the weights of all respondents.
Calculation of totals (counts)
Estimates of totals are given by calculating the sum, over all respondents, of the weight
multiplied by the variable of interest.
Statistical significance
Statistical significance is measured at the 5 percent significance level (that is, p-value less than
0.05).
Rounding
Data tables give prevalence estimates to zero decimal places. In some cases, this rounding
results in prevalence estimates that do not add up to 100%. Adjusted rate ratios (ARRs) are
rounded to one decimal place. Estimated numbers of people are rounded to the nearest
1000 people. Unrounded values were used during calculations.
Small numbers
In order to ensure the reliability of the survey data presented, and to protect the confidentiality
of participants, data have only been presented when at least 30 respondents were in the
population group being analysed. In some cases, to obtain an adequate sample size, data have
been presented in an aggregated form.
Total response ethnicity
This report uses total response ethnicity to define ethnic groups. Total response ethnicity
classifies a person in all the ethnic groups they identify with; this means that statistics for
individual people can appear in more than one ethnic group.
Understanding Excess Body Weight: New Zealand Health Survey 9
Adjusted rate ratios for comparisons between population groups
This report uses adjusted rate ratios (ARRs) to compare prevalences between different
population groups. A rate ratio reveals how many times larger or smaller the rate is for the
group of interest (eg, Māori) compared with the reference group (eg, non-Māori). A rate ratio
above 1 means the indicator is more likely in the group of interest than in the reference group; a
rate ratio below 1 means the indicator is less likely. An asterisk (*) indicates statistically
significant rate ratios.
To analyse ethnic differences, this report compares each ethnic group with all other people. This
helps to answer the question, ‘Does each ethnic group differ from other New Zealanders for this
outcome?’.
This report presents ARRs for the following comparisons:
men and women
Māori and non-Māori (for total, men, women)
Pacific and non-Pacific (for total, men, women)
Asian and non-Asian (for total, men, women)
people living in the most and least deprived areas.
The ARRs are adjusted for demographic factors that may be influencing (ie, confounding) the
comparison, as follows:
When comparing men and women (within the total, Māori, Pacific or Asian population), rate
ratios are adjusted for age, using the WHO world population.
For ethnic comparisons where data on men and women are combined, rate ratios are
adjusted for age and sex.
Deprivation comparisons are adjusted for age, sex and ethnic group.
Ethnic rate ratios are not adjusted for neighbourhood deprivation in this report, as deprivation
is one of the key mechanisms contributing to differences in health status between ethnic groups
(that is, deprivation is on the causal pathway between ethnicity and health status).
10 Understanding Excess Body Weight: New Zealand Health Survey
Excess body weight in adults
Key messages
Almost one-third of New Zealand adults (30%) are obese; a further third (35%) are
overweight in 2011-13.
Almost two-thirds of Pacific adults and almost half of Māori adults are obese.
An estimated 147,000 adults are extremely obese; 6 percent of females and 3 percent of
males have a BMI of 40kg/m2 or above.
Extreme obesity rates are highest in Pacific adults (11% of males and 21% of females)
and Māori adults (7% of males and 12% of females).
After adjusting for age, sex and ethnic differences, the rate of extreme obesity is four
times higher in adults living in the most deprived areas, compared with those living in
the least deprived areas.
More than half of New Zealand adults have a high or very high WC, putting them at
increased risk of diabetes and cardiovascular disease.
Females are more likely to have a very high WC (42%) compared with males (29%).
One in four adults is at very high risk of ill health due to a combination of high BMI and
high WC. In Pacific adults, one in two is at very high risk.
Seven out of ten males (71%) and three out of five females (59%) have a high WHtR.
The adult obesity rate has trebled since the 1970s, from 10 percent in 1977 to
30 percent in 2011–2013.
Over the last three decades, the obesity rate has increased across all age groups.
At any age, adults born more recently have higher rates of obesity than those born in
earlier decades. For example, among those born in the 1940s, 10 percent were obese by
40 years of age, whereas among those born in the 1960s, 20 percent were obese by the
same age.
Understanding Excess Body Weight: New Zealand Health Survey 11
Obesity rates in adults
Two-thirds of New Zealand adults are either overweight or obese
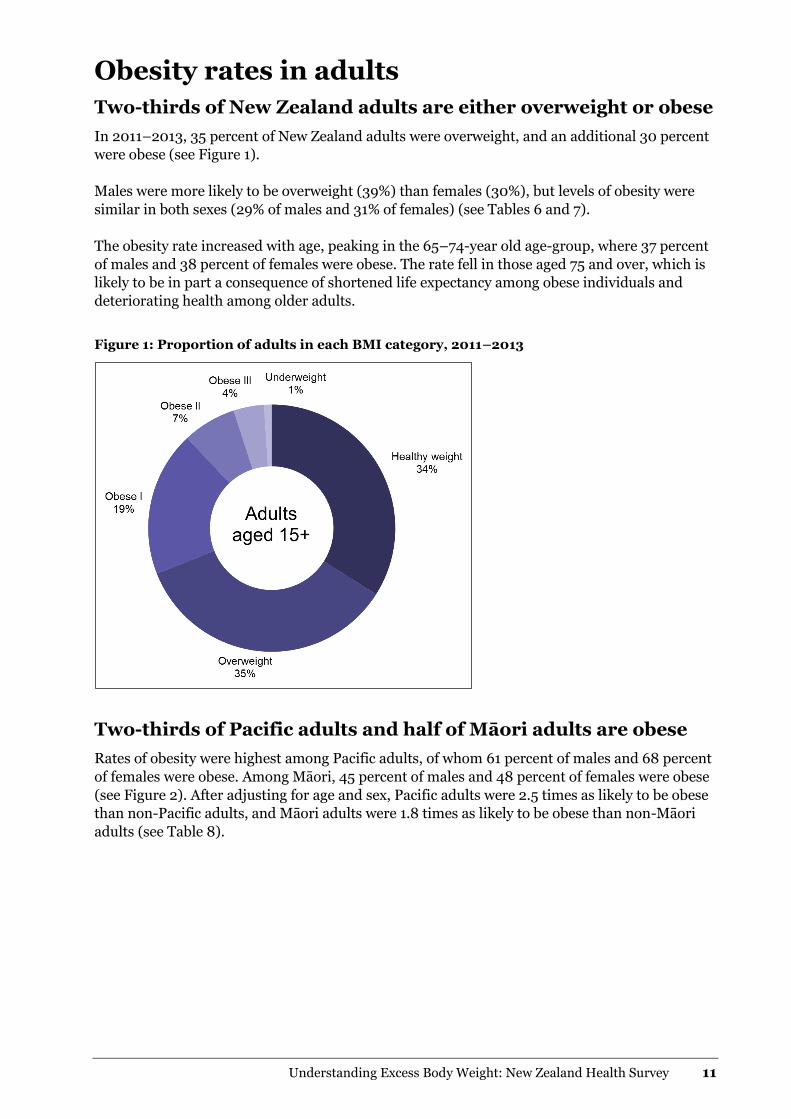
In 2011–2013, 35 percent of New Zealand adults were overweight, and an additional 30 percent
were obese (see Figure 1).
Males were more likely to be overweight (39%) than females (30%), but levels of obesity were
similar in both sexes (29% of males and 31% of females) (see Tables 6 and 7).
The obesity rate increased with age, peaking in the 65–74-year old age-group, where 37 percent
of males and 38 percent of females were obese. The rate fell in those aged 75 and over, which is
likely to be in part a consequence of shortened life expectancy among obese individuals and
deteriorating health among older adults.
Figure 1: Proportion of adults in each BMI category, 2011–2013
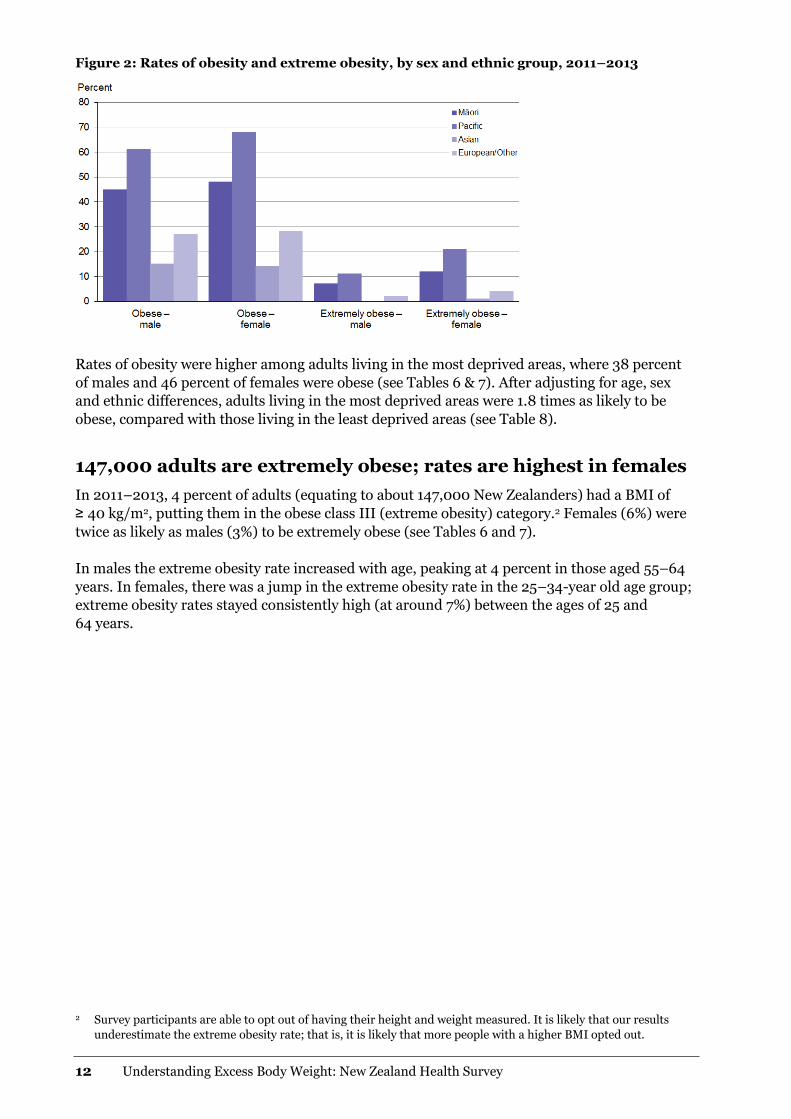
Two-thirds of Pacific adults and half of Māori adults are obese
Rates of obesity were highest among Pacific adults, of whom 61 percent of males and 68 percent
of females were obese. Among Māori, 45 percent of males and 48 percent of females were obese
(see Figure 2). After adjusting for age and sex, Pacific adults were 2.5 times as likely to be obese
than non-Pacific adults, and Māori adults were 1.8 times as likely to be obese than non-Māori
adults (see Table 8).
12 Understanding Excess Body Weight: New Zealand Health Survey
Figure 2: Rates of obesity and extreme obesity, by sex and ethnic group, 2011–2013
Rates of obesity were higher among adults living in the most deprived areas, where 38 percent
of males and 46 percent of females were obese (see Tables 6 & 7). After adjusting for age, sex
and ethnic differences, adults living in the most deprived areas were 1.8 times as likely to be
obese, compared with those living in the least deprived areas (see Table 8).
147,000 adults are extremely obese; rates are highest in females
In 2011–2013, 4 percent of adults (equating to about 147,000 New Zealanders) had a BMI of
≥ 40 kg/m2, putting them in the obese class III (extreme obesity) category.2 Females (6%) were
twice as likely as males (3%) to be extremely obese (see Tables 6 and 7).
In males the extreme obesity rate increased with age, peaking at 4 percent in those aged 55–64
years. In females, there was a jump in the extreme obesity rate in the 25–34-year old age group;
extreme obesity rates stayed consistently high (at around 7%) between the ages of 25 and
64 years.
2 Survey participants are able to opt out of having their height and weight measured. It is likely that our results
underestimate the extreme obesity rate; that is, it is likely that more people with a higher BMI opted out.
Understanding Excess Body Weight: New Zealand Health Survey 13
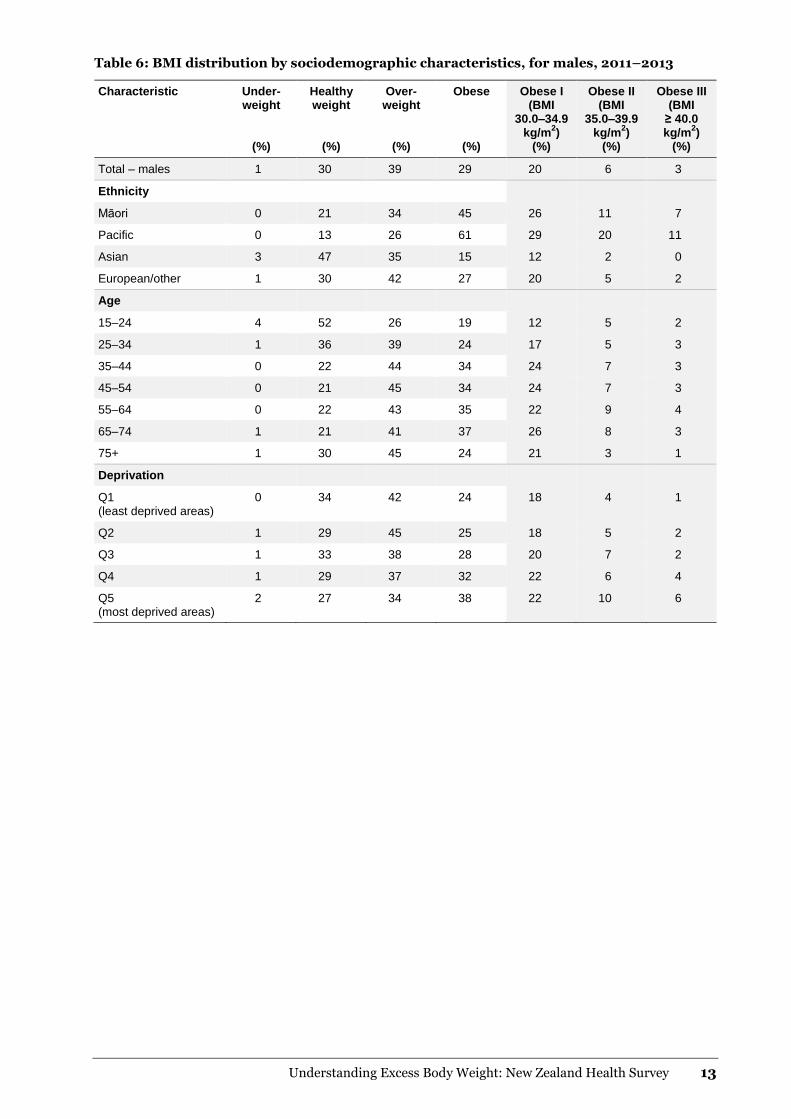
Table 6: BMI distribution by sociodemographic characteristics, for males, 2011–2013
Characteristic Under-weight
(%)
Healthy weight
(%)
Over-weight
(%)
Obese
(%)
Obese I (BMI
30.0–34.9 kg/m
2)
(%)
Obese II (BMI
35.0–39.9 kg/m
2)
(%)
Obese III (BMI
≥ 40.0 kg/m
2)
(%)
Total – males 1 30 39 29 20 6 3
Ethnicity
Māori 0 21 34 45 26 11 7
Pacific 0 13 26 61 29 20 11
Asian 3 47 35 15 12 2 0
European/other 1 30 42 27 20 5 2
Age
15–24 4 52 26 19 12 5 2
25–34 1 36 39 24 17 5 3
35–44 0 22 44 34 24 7 3
45–54 0 21 45 34 24 7 3
55–64 0 22 43 35 22 9 4
65–74 1 21 41 37 26 8 3
75+ 1 30 45 24 21 3 1
Deprivation
Q1 (least deprived areas)
0 34 42 24 18 4 1
Q2 1 29 45 25 18 5 2
Q3 1 33 38 28 20 7 2
Q4 1 29 37 32 22 6 4
Q5 (most deprived areas)
2 27 34 38 22 10 6
14 Understanding Excess Body Weight: New Zealand Health Survey
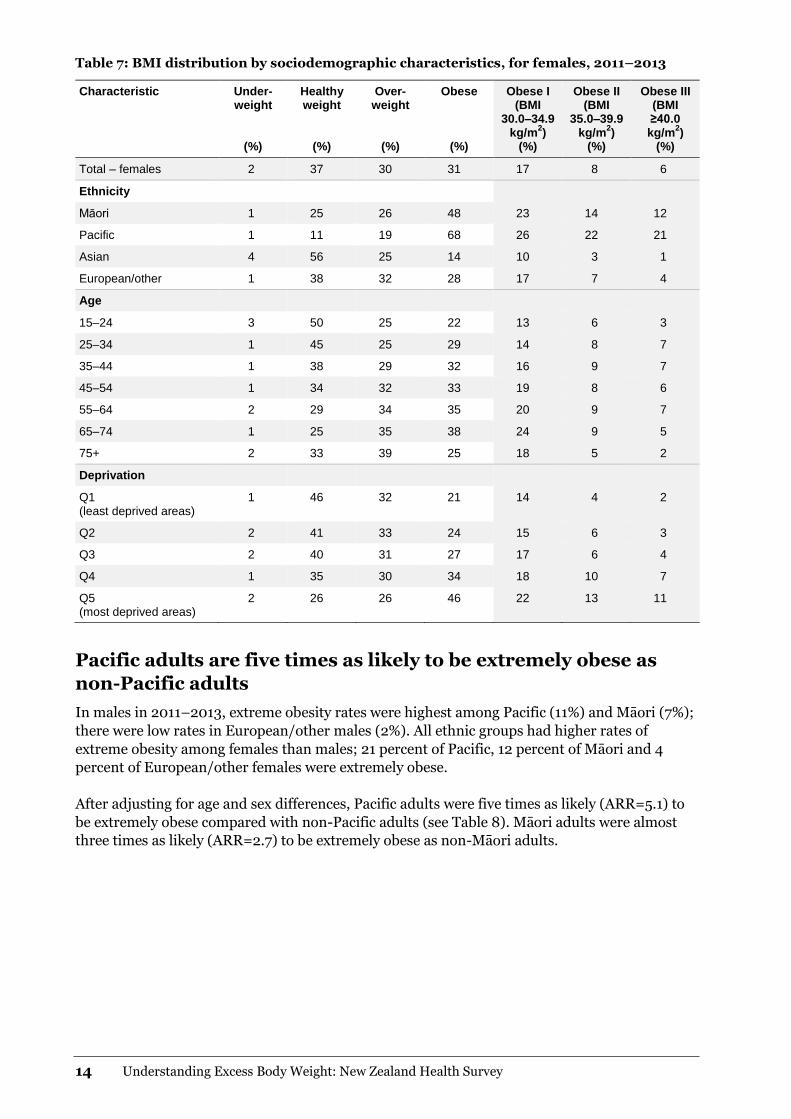
Table 7: BMI distribution by sociodemographic characteristics, for females, 2011–2013
Characteristic Under-weight
(%)
Healthy weight
(%)
Over-weight
(%)
Obese
(%)
Obese I (BMI
30.0–34.9 kg/m
2)
(%)
Obese II (BMI
35.0–39.9 kg/m
2)
(%)
Obese III (BMI ≥40.0 kg/m
2)
(%)
Total – females 2 37 30 31 17 8 6
Ethnicity
Māori 1 25 26 48 23 14 12
Pacific 1 11 19 68 26 22 21
Asian 4 56 25 14 10 3 1
European/other 1 38 32 28 17 7 4
Age
15–24 3 50 25 22 13 6 3
25–34 1 45 25 29 14 8 7
35–44 1 38 29 32 16 9 7
45–54 1 34 32 33 19 8 6
55–64 2 29 34 35 20 9 7
65–74 1 25 35 38 24 9 5
75+ 2 33 39 25 18 5 2
Deprivation
Q1 (least deprived areas)
1 46 32 21 14 4 2
Q2 2 41 33 24 15 6 3
Q3 2 40 31 27 17 6 4
Q4 1 35 30 34 18 10 7
Q5 (most deprived areas)
2 26 26 46 22 13 11
Pacific adults are five times as likely to be extremely obese as
non-Pacific adults
In males in 2011–2013, extreme obesity rates were highest among Pacific (11%) and Māori (7%);
there were low rates in European/other males (2%). All ethnic groups had higher rates of
extreme obesity among females than males; 21 percent of Pacific, 12 percent of Māori and 4
percent of European/other females were extremely obese.
After adjusting for age and sex differences, Pacific adults were five times as likely (ARR=5.1) to
be extremely obese compared with non-Pacific adults (see Table 8). Māori adults were almost
three times as likely (ARR=2.7) to be extremely obese as non-Māori adults.
Understanding Excess Body Weight: New Zealand Health Survey 15
Adults living in the most deprived areas are four times as likely
to be extremely obese as those living in the least deprived areas
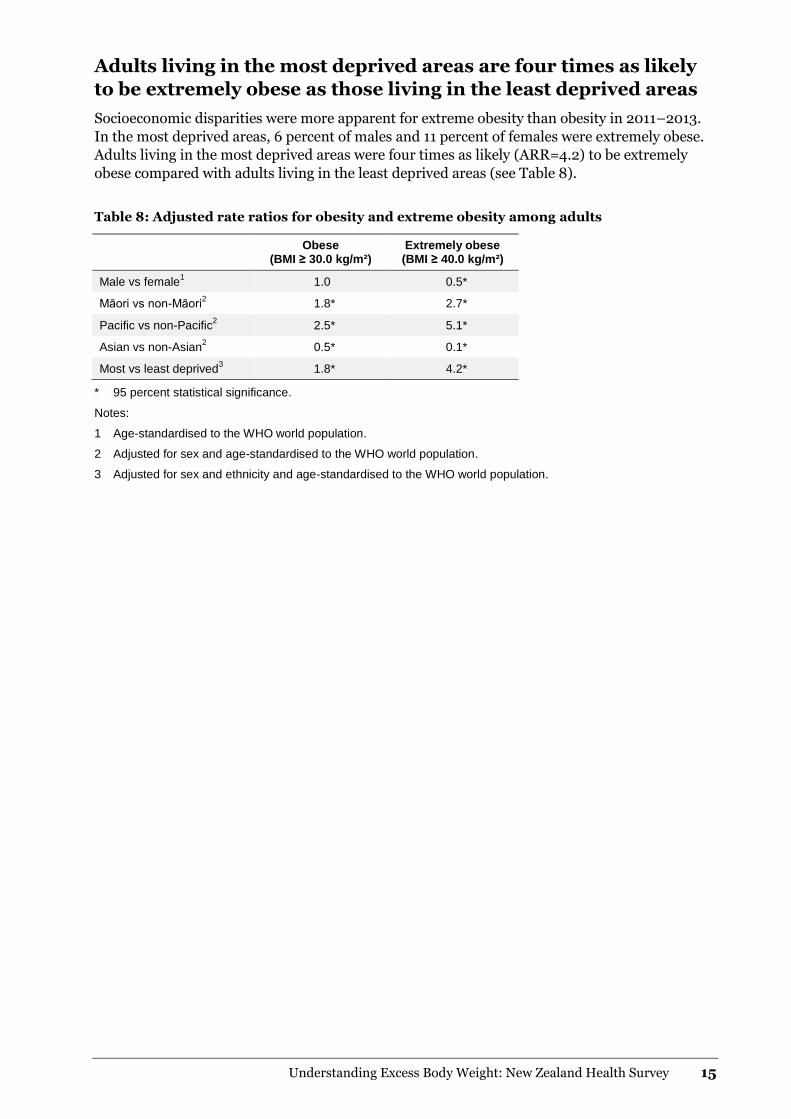
Socioeconomic disparities were more apparent for extreme obesity than obesity in 2011–2013.
In the most deprived areas, 6 percent of males and 11 percent of females were extremely obese.
Adults living in the most deprived areas were four times as likely (ARR=4.2) to be extremely
obese compared with adults living in the least deprived areas (see Table 8).
Table 8: Adjusted rate ratios for obesity and extreme obesity among adults
Obese (BMI ≥ 30.0 kg/m²)
Extremely obese (BMI ≥ 40.0 kg/m²)
Male vs female1 1.0 0.5*
Māori vs non-Māori2 1.8* 2.7*
Pacific vs non-Pacific2 2.5* 5.1*
Asian vs non-Asian2 0.5* 0.1*
Most vs least deprived3 1.8* 4.2*
* 95 percent statistical significance.
Notes:
1 Age-standardised to the WHO world population.
2 Adjusted for sex and age-standardised to the WHO world population.
3 Adjusted for sex and ethnicity and age-standardised to the WHO world population.
16 Understanding Excess Body Weight: New Zealand Health Survey
Body mass index distribution
Men are more likely to be overweight, but females are more
likely to be extremely obese
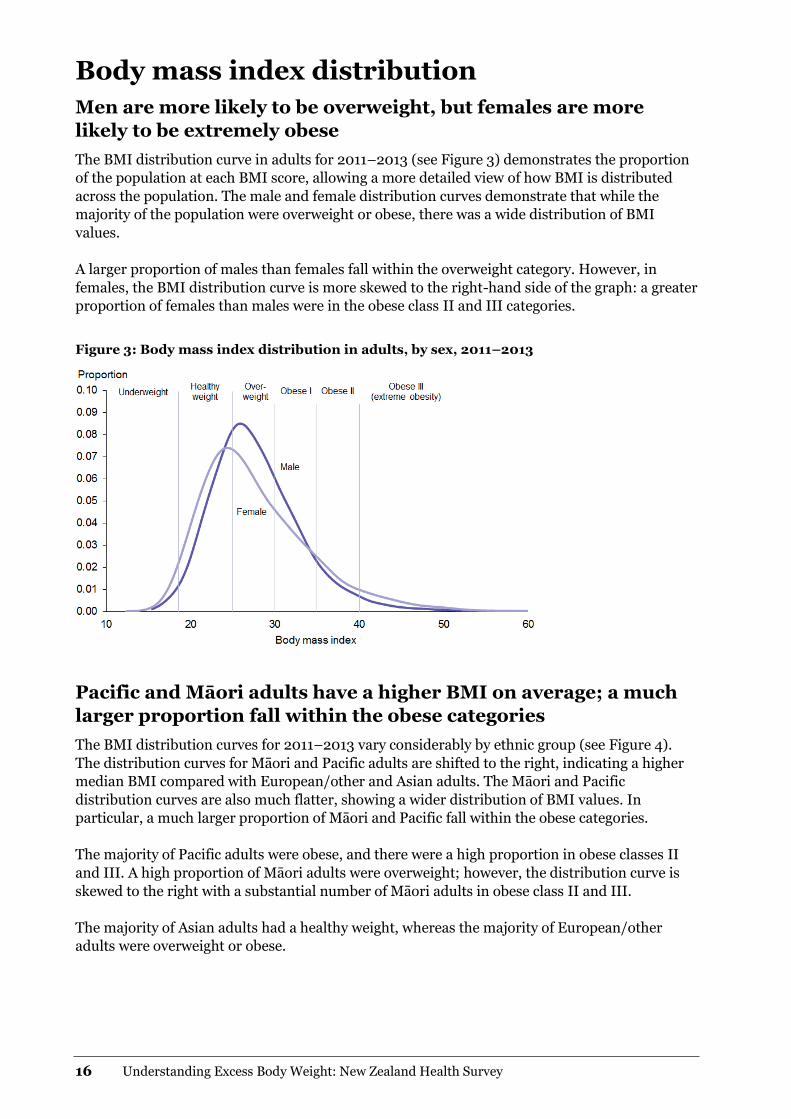
The BMI distribution curve in adults for 2011–2013 (see Figure 3) demonstrates the proportion
of the population at each BMI score, allowing a more detailed view of how BMI is distributed
across the population. The male and female distribution curves demonstrate that while the
majority of the population were overweight or obese, there was a wide distribution of BMI
values.
A larger proportion of males than females fall within the overweight category. However, in
females, the BMI distribution curve is more skewed to the right-hand side of the graph: a greater
proportion of females than males were in the obese class II and III categories.
Figure 3: Body mass index distribution in adults, by sex, 2011–2013
Pacific and Māori adults have a higher BMI on average; a much
larger proportion fall within the obese categories
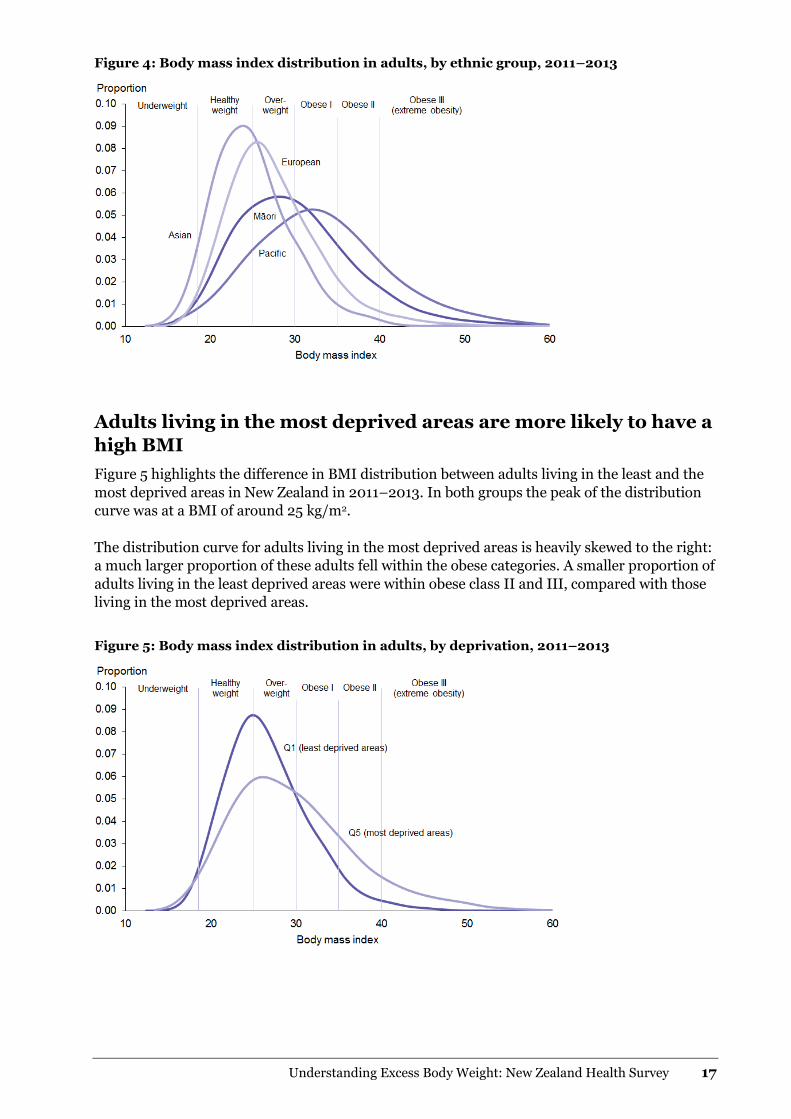
The BMI distribution curves for 2011–2013 vary considerably by ethnic group (see Figure 4).
The distribution curves for Māori and Pacific adults are shifted to the right, indicating a higher
median BMI compared with European/other and Asian adults. The Māori and Pacific
distribution curves are also much flatter, showing a wider distribution of BMI values. In
particular, a much larger proportion of Māori and Pacific fall within the obese categories.
The majority of Pacific adults were obese, and there were a high proportion in obese classes II
and III. A high proportion of Māori adults were overweight; however, the distribution curve is
skewed to the right with a substantial number of Māori adults in obese class II and III.
The majority of Asian adults had a healthy weight, whereas the majority of European/other
adults were overweight or obese.
Understanding Excess Body Weight: New Zealand Health Survey 17
Figure 4: Body mass index distribution in adults, by ethnic group, 2011–2013
Adults living in the most deprived areas are more likely to have a
high BMI
Figure 5 highlights the difference in BMI distribution between adults living in the least and the
most deprived areas in New Zealand in 2011–2013. In both groups the peak of the distribution
curve was at a BMI of around 25 kg/m2.
The distribution curve for adults living in the most deprived areas is heavily skewed to the right:
a much larger proportion of these adults fell within the obese categories. A smaller proportion of
adults living in the least deprived areas were within obese class II and III, compared with those
living in the most deprived areas.
Figure 5: Body mass index distribution in adults, by deprivation, 2011–2013

18 Understanding Excess Body Weight: New Zealand Health Survey
Alternative measures of excess body weight This section presents results for the following alternative measures of health risk associated with
excess body weight:
Waist circumference (WC)
BMI/WC matrix
Waist-to-height ratio (WHtR).
Waist circumference
Waist circumference is the simplest and most convenient indicator of abdominal obesity. There
is good evidence that individuals who carry excess body fat around their abdomen are at greater
risk of developing diabetes and cardiovascular disease than those whose excess body fat is more
evenly distributed (WHO 2000). Waist circumference provides useful complementary
information to BMI.
Women are more likely than men to have a very high waist circumference
In 2011–2013 more than half of adults (53% of males and 62% of females) were identified as
having a high or very high WC (see Table 9).
Two out of five females (42%) had a very high WC, associated with a substantially increased risk
of diabetes and cardiovascular disease. A further one in five (20%) had a high WC, putting them
at increased risk.
Males were less at risk in terms of WC: 29 percent had a very high WC, and a further 23 percent
had a high WC.
Compared with BMI, WC categorises a lower proportion of males as being at high risk; however,
both measurements place 29 percent of males at very high risk. In females, WC and BMI puts a
similar proportion at high risk. However, a larger proportion of females were categorised as
being at very high risk when using WC (see Tables 9 and 11).
Table 9: Percentage of adults in each WC category, by sex, 2011–2013
Waist circumference Normal High Very high
Male < 94 cm Female < 80 cm
(%)
Male 94–101 cm Female 80–87 cm
(%)
Male ≥ 102 cm Female ≥ 88 cm
(%)
Male 47 23 29
Female 38 20 42
Tables 12 and 13 summarise ethnic breakdowns of WC.
Understanding Excess Body Weight: New Zealand Health Survey 19
Body mass index/WC matrix
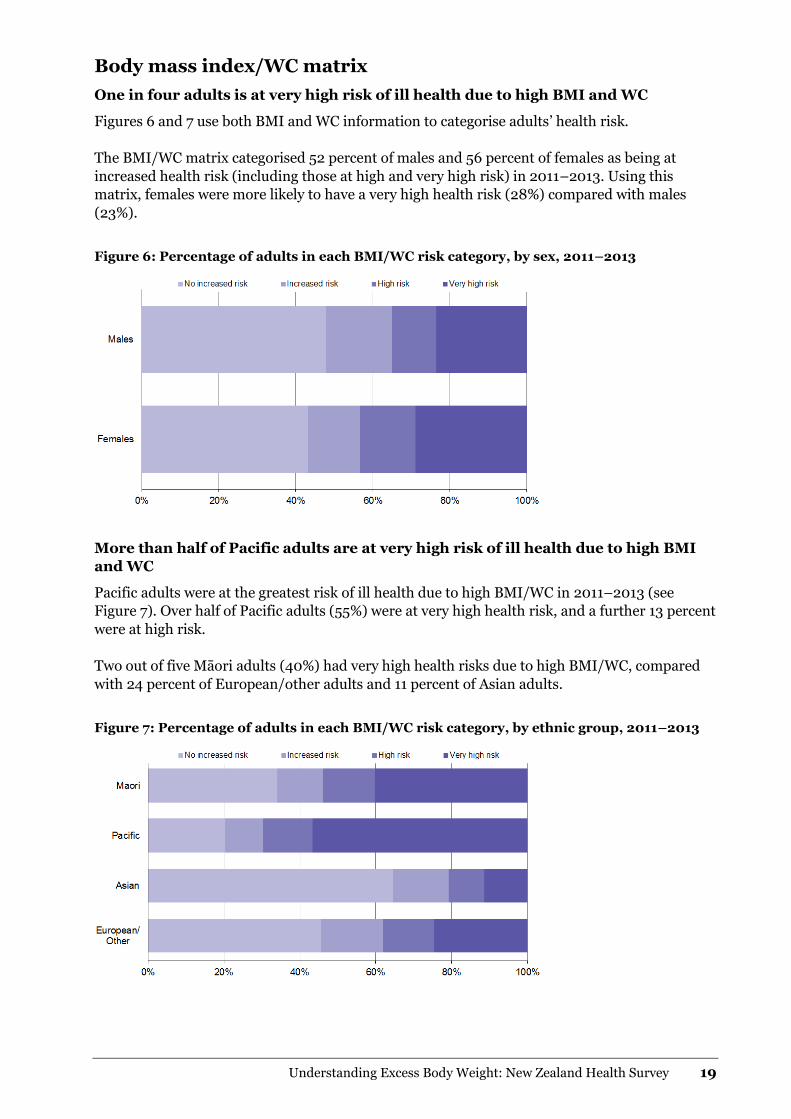
One in four adults is at very high risk of ill health due to high BMI and WC
Figures 6 and 7 use both BMI and WC information to categorise adults’ health risk.
The BMI/WC matrix categorised 52 percent of males and 56 percent of females as being at
increased health risk (including those at high and very high risk) in 2011–2013. Using this
matrix, females were more likely to have a very high health risk (28%) compared with males
(23%).
Figure 6: Percentage of adults in each BMI/WC risk category, by sex, 2011–2013
More than half of Pacific adults are at very high risk of ill health due to high BMI
and WC
Pacific adults were at the greatest risk of ill health due to high BMI/WC in 2011–2013 (see
Figure 7). Over half of Pacific adults (55%) were at very high health risk, and a further 13 percent
were at high risk.
Two out of five Māori adults (40%) had very high health risks due to high BMI/WC, compared
with 24 percent of European/other adults and 11 percent of Asian adults.
Figure 7: Percentage of adults in each BMI/WC risk category, by ethnic group, 2011–2013
20 Understanding Excess Body Weight: New Zealand Health Survey
Waist-to-height ratio
Some researchers have suggested WHtR as a better discriminator for hypertension, diabetes and
dyslipidaemia risk in both sexes, compared to BMI, WC and waist-to-hip ratio (Ashwell et al
2009). Although not widely used, WHtR may be a preferable measure of excess body fat in short
or tall individuals, where waist circumference could under- or overestimate disease risk.
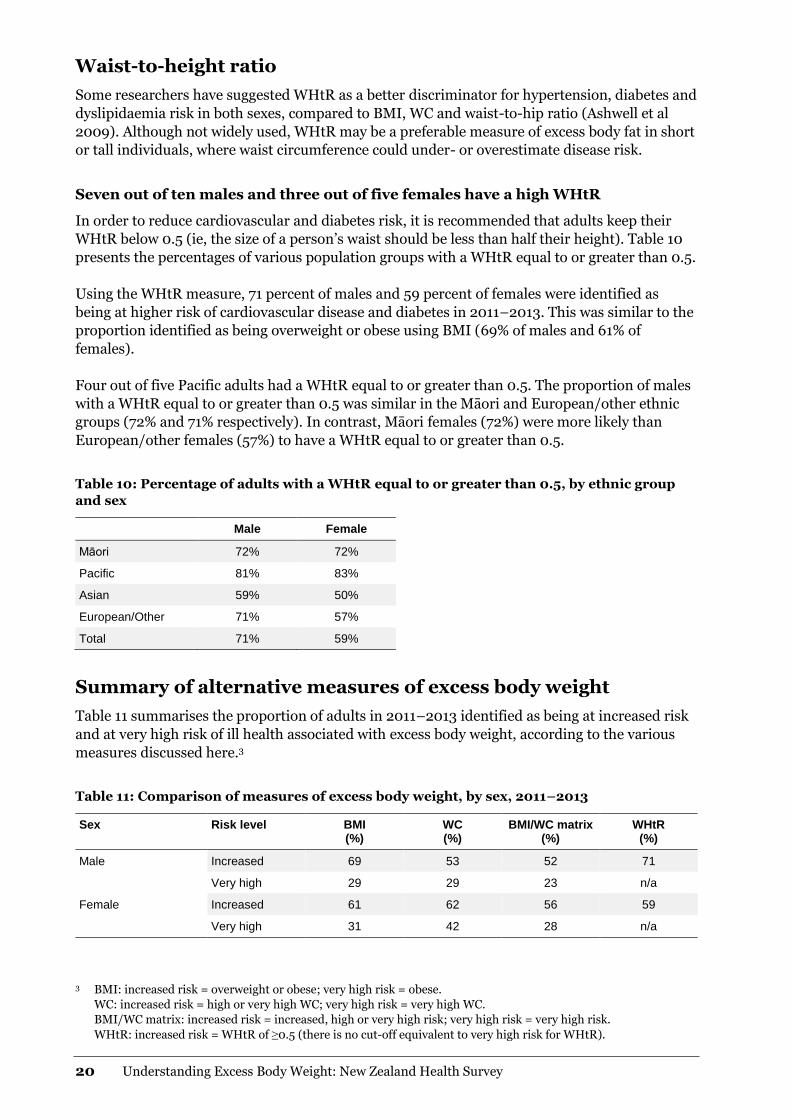
Seven out of ten males and three out of five females have a high WHtR
In order to reduce cardiovascular and diabetes risk, it is recommended that adults keep their
WHtR below 0.5 (ie, the size of a person’s waist should be less than half their height). Table 10
presents the percentages of various population groups with a WHtR equal to or greater than 0.5.
Using the WHtR measure, 71 percent of males and 59 percent of females were identified as
being at higher risk of cardiovascular disease and diabetes in 2011–2013. This was similar to the
proportion identified as being overweight or obese using BMI (69% of males and 61% of
females).
Four out of five Pacific adults had a WHtR equal to or greater than 0.5. The proportion of males
with a WHtR equal to or greater than 0.5 was similar in the Māori and European/other ethnic
groups (72% and 71% respectively). In contrast, Māori females (72%) were more likely than
European/other females (57%) to have a WHtR equal to or greater than 0.5.
Table 10: Percentage of adults with a WHtR equal to or greater than 0.5, by ethnic group
and sex
Male Female
Māori 72% 72%
Pacific 81% 83%
Asian 59% 50%
European/Other 71% 57%
Total 71% 59%
Summary of alternative measures of excess body weight
Table 11 summarises the proportion of adults in 2011–2013 identified as being at increased risk
and at very high risk of ill health associated with excess body weight, according to the various
measures discussed here.3
Table 11: Comparison of measures of excess body weight, by sex, 2011–2013
Sex Risk level BMI (%)
WC (%)
BMI/WC matrix (%)
WHtR (%)
Male Increased 69 53 52 71
Very high 29 29 23 n/a
Female Increased 61 62 56 59
Very high 31 42 28 n/a
3 BMI: increased risk = overweight or obese; very high risk = obese.
WC: increased risk = high or very high WC; very high risk = very high WC.
BMI/WC matrix: increased risk = increased, high or very high risk; very high risk = very high risk.
WHtR: increased risk = WHtR of ≥0.5 (there is no cut-off equivalent to very high risk for WHtR).
Understanding Excess Body Weight: New Zealand Health Survey 21
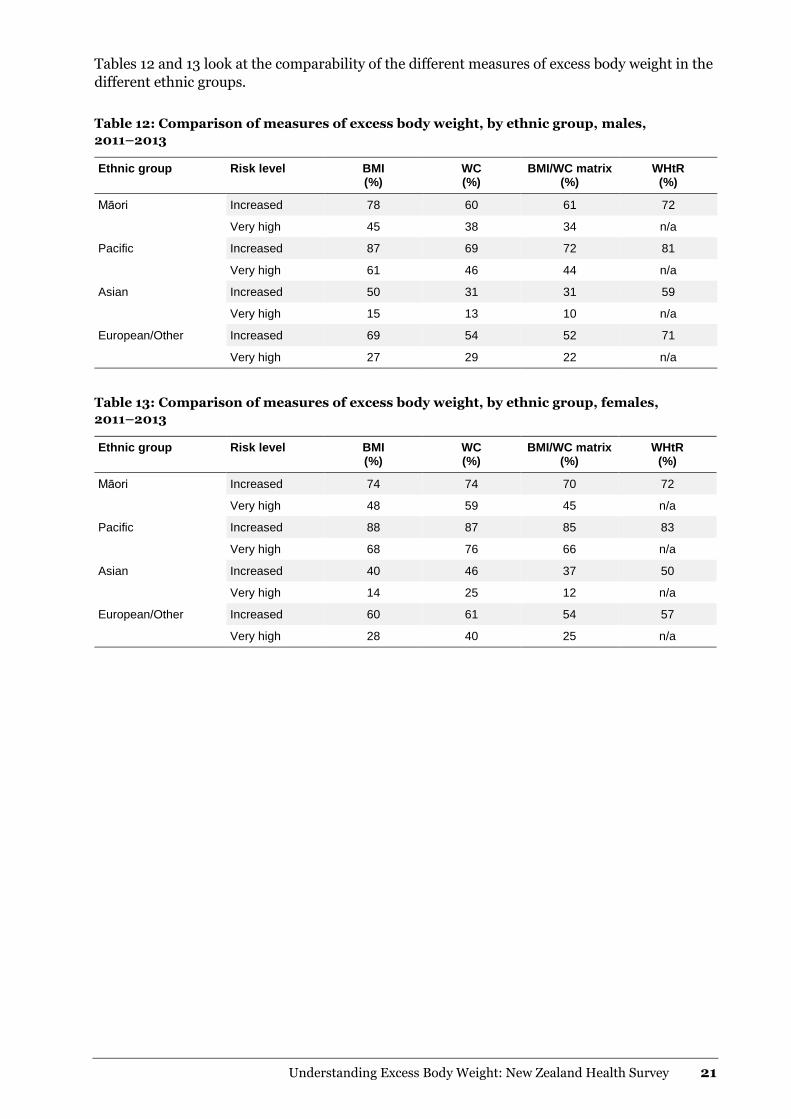
Tables 12 and 13 look at the comparability of the different measures of excess body weight in the
different ethnic groups.
Table 12: Comparison of measures of excess body weight, by ethnic group, males,
2011–2013
Ethnic group Risk level BMI (%)
WC (%)
BMI/WC matrix (%)
WHtR (%)
Māori Increased 78 60 61 72
Very high 45 38 34 n/a
Pacific Increased 87 69 72 81
Very high 61 46 44 n/a
Asian Increased 50 31 31 59
Very high 15 13 10 n/a
European/Other Increased 69 54 52 71
Very high 27 29 22 n/a
Table 13: Comparison of measures of excess body weight, by ethnic group, females,
2011–2013
Ethnic group Risk level BMI (%)
WC (%)
BMI/WC matrix (%)
WHtR (%)
Māori Increased 74 74 70 72
Very high 48 59 45 n/a
Pacific Increased 88 87 85 83
Very high 68 76 66 n/a
Asian Increased 40 46 37 50
Very high 14 25 12 n/a
European/Other Increased 60 61 54 57
Very high 28 40 25 n/a
22 Understanding Excess Body Weight: New Zealand Health Survey
Tracking the obesity epidemic
Over the last 15 years there has been an increase in BMI across
the whole population
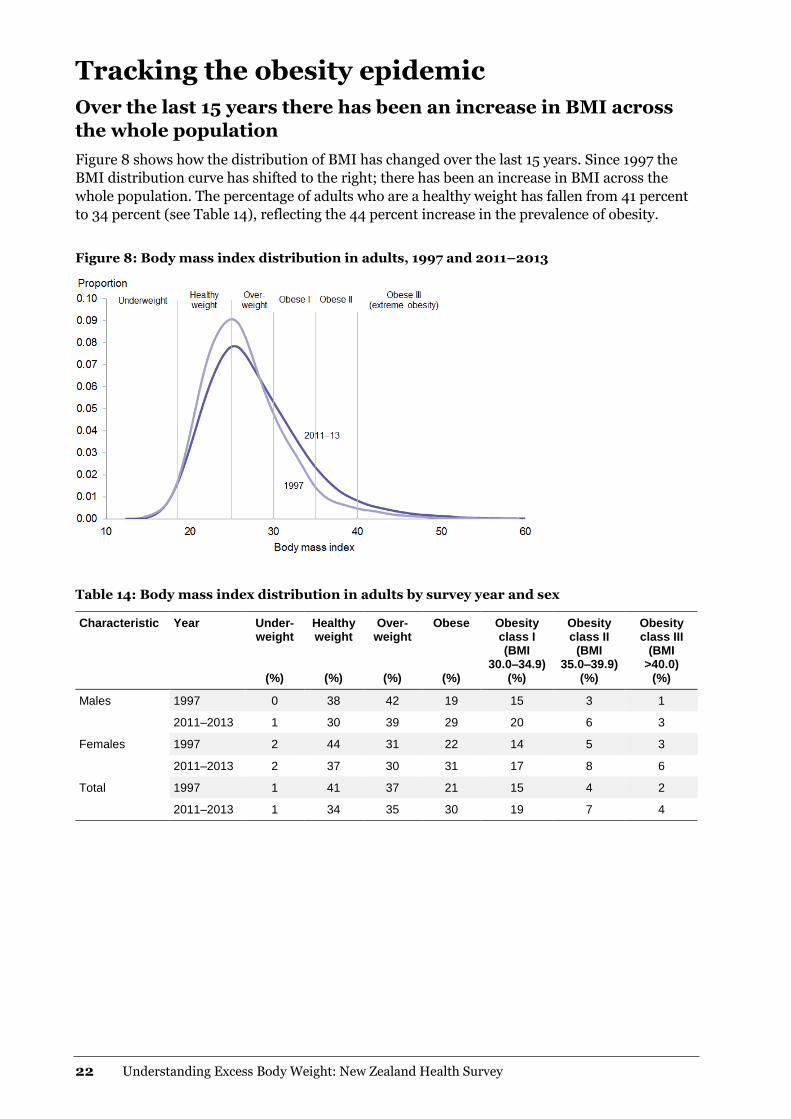
Figure 8 shows how the distribution of BMI has changed over the last 15 years. Since 1997 the
BMI distribution curve has shifted to the right; there has been an increase in BMI across the
whole population. The percentage of adults who are a healthy weight has fallen from 41 percent
to 34 percent (see Table 14), reflecting the 44 percent increase in the prevalence of obesity.
Figure 8: Body mass index distribution in adults, 1997 and 2011–2013
Table 14: Body mass index distribution in adults by survey year and sex
Characteristic Year Under-weight
(%)
Healthy weight
(%)
Over-weight
(%)
Obese
(%)
Obesity class I (BMI
30.0–34.9) (%)
Obesity class II
(BMI 35.0–39.9)
(%)
Obesity class III
(BMI >40.0)
(%)
Males 1997 0 38 42 19 15 3 1
2011–2013 1 30 39 29 20 6 3
Females 1997 2 44 31 22 14 5 3
2011–2013 2 37 30 31 17 8 6
Total 1997 1 41 37 21 15 4 2
2011–2013 1 34 35 30 19 7 4
Understanding Excess Body Weight: New Zealand Health Survey 23
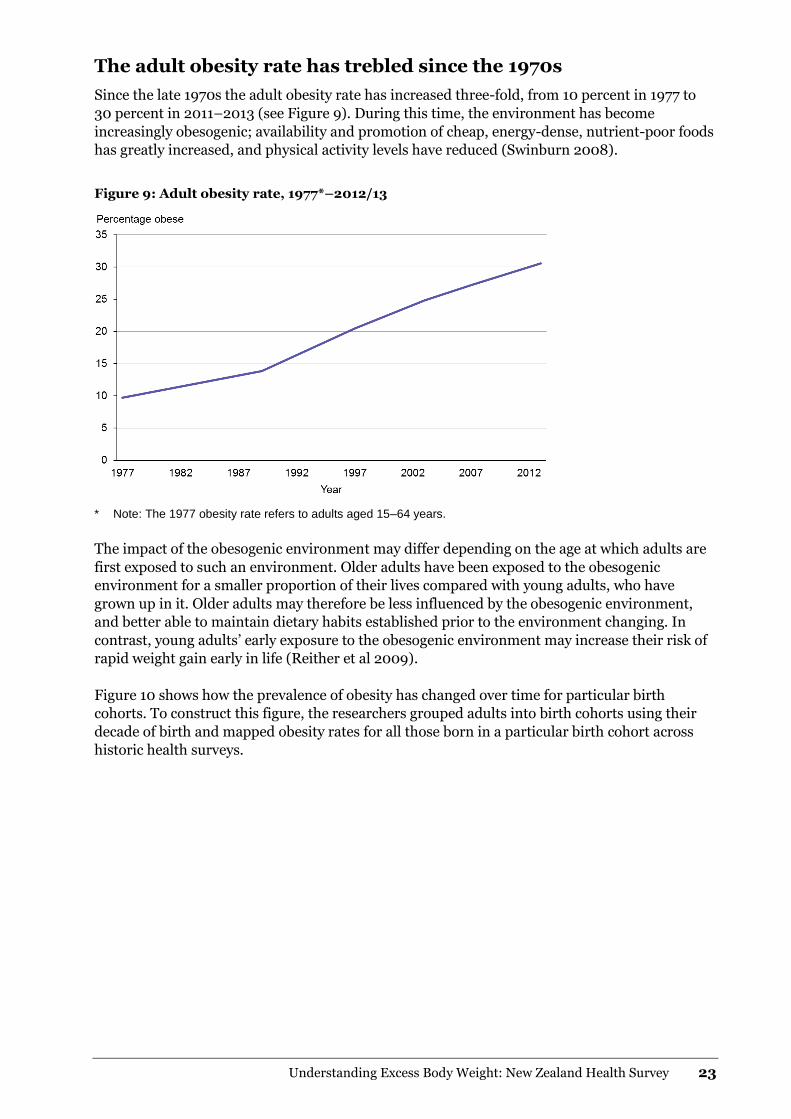
The adult obesity rate has trebled since the 1970s
Since the late 1970s the adult obesity rate has increased three-fold, from 10 percent in 1977 to
30 percent in 2011–2013 (see Figure 9). During this time, the environment has become
increasingly obesogenic; availability and promotion of cheap, energy-dense, nutrient-poor foods
has greatly increased, and physical activity levels have reduced (Swinburn 2008).
Figure 9: Adult obesity rate, 1977*–2012/13
* Note: The 1977 obesity rate refers to adults aged 15–64 years.
The impact of the obesogenic environment may differ depending on the age at which adults are
first exposed to such an environment. Older adults have been exposed to the obesogenic
environment for a smaller proportion of their lives compared with young adults, who have
grown up in it. Older adults may therefore be less influenced by the obesogenic environment,
and better able to maintain dietary habits established prior to the environment changing. In
contrast, young adults’ early exposure to the obesogenic environment may increase their risk of
rapid weight gain early in life (Reither et al 2009).
Figure 10 shows how the prevalence of obesity has changed over time for particular birth
cohorts. To construct this figure, the researchers grouped adults into birth cohorts using their
decade of birth and mapped obesity rates for all those born in a particular birth cohort across
historic health surveys.
24 Understanding Excess Body Weight: New Zealand Health Survey
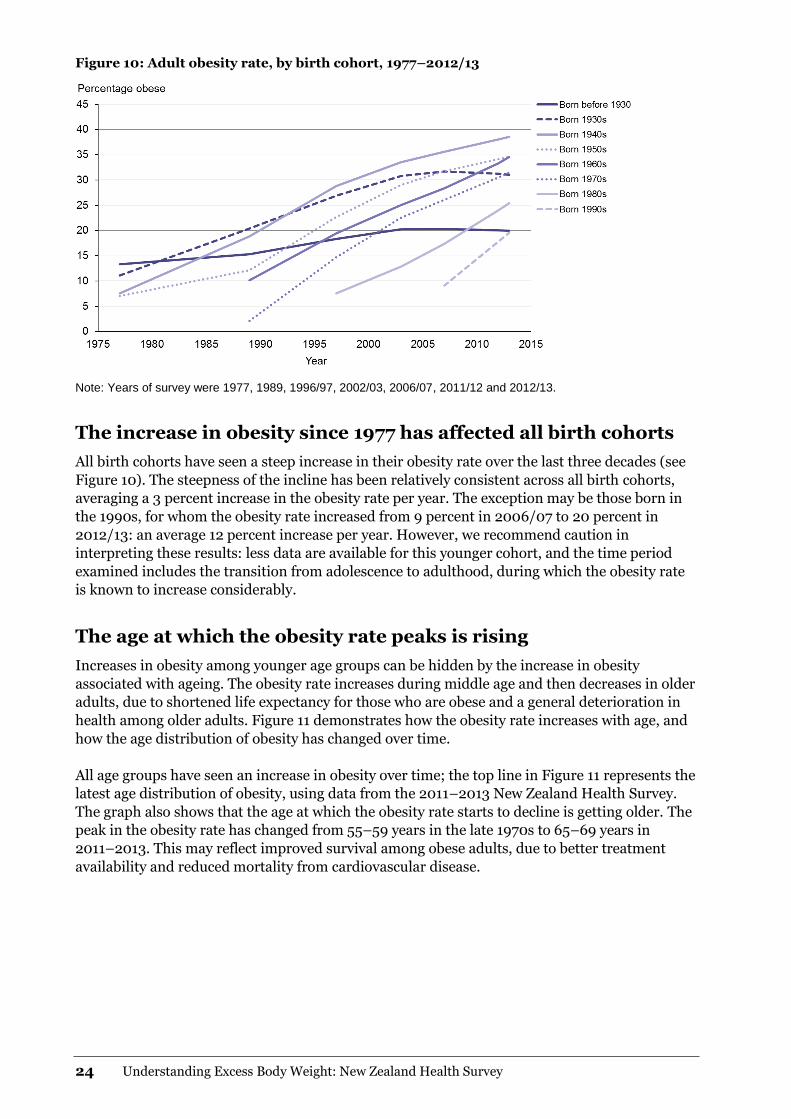
Figure 10: Adult obesity rate, by birth cohort, 1977–2012/13
Note: Years of survey were 1977, 1989, 1996/97, 2002/03, 2006/07, 2011/12 and 2012/13.
The increase in obesity since 1977 has affected all birth cohorts
All birth cohorts have seen a steep increase in their obesity rate over the last three decades (see
Figure 10). The steepness of the incline has been relatively consistent across all birth cohorts,
averaging a 3 percent increase in the obesity rate per year. The exception may be those born in
the 1990s, for whom the obesity rate increased from 9 percent in 2006/07 to 20 percent in
2012/13: an average 12 percent increase per year. However, we recommend caution in
interpreting these results: less data are available for this younger cohort, and the time period
examined includes the transition from adolescence to adulthood, during which the obesity rate
is known to increase considerably.
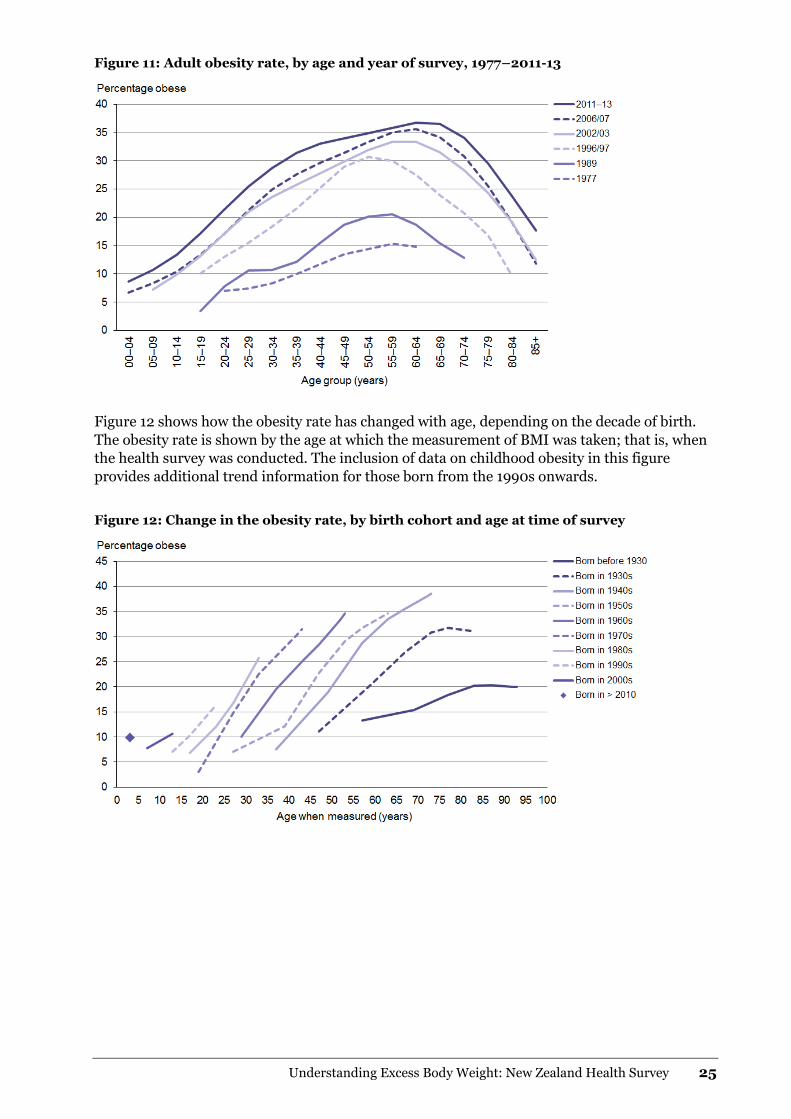
The age at which the obesity rate peaks is rising
Increases in obesity among younger age groups can be hidden by the increase in obesity
associated with ageing. The obesity rate increases during middle age and then decreases in older
adults, due to shortened life expectancy for those who are obese and a general deterioration in
health among older adults. Figure 11 demonstrates how the obesity rate increases with age, and
how the age distribution of obesity has changed over time.
All age groups have seen an increase in obesity over time; the top line in Figure 11 represents the
latest age distribution of obesity, using data from the 2011–2013 New Zealand Health Survey.
The graph also shows that the age at which the obesity rate starts to decline is getting older. The
peak in the obesity rate has changed from 55–59 years in the late 1970s to 65–69 years in
2011–2013. This may reflect improved survival among obese adults, due to better treatment
availability and reduced mortality from cardiovascular disease.
Understanding Excess Body Weight: New Zealand Health Survey 25
Figure 11: Adult obesity rate, by age and year of survey, 1977–2011-13
Figure 12 shows how the obesity rate has changed with age, depending on the decade of birth.
The obesity rate is shown by the age at which the measurement of BMI was taken; that is, when
the health survey was conducted. The inclusion of data on childhood obesity in this figure
provides additional trend information for those born from the 1990s onwards.
Figure 12: Change in the obesity rate, by birth cohort and age at time of survey
26 Understanding Excess Body Weight: New Zealand Health Survey
At any age, those born in more recent decades are more likely to
be obese than those born in earlier decades
Figure 12 reiterates what Figure 10 also shows: a steep increase in obesity rates that is similar
across all birth cohorts.
The incline is less steep for those born in the 1930s and before, likely to reflect that these
individuals were entering old age when measurements were taken. It is fairly consistent for
those born from the 1940s onwards, but those born more recently are reaching higher obesity
rates earlier. For example, by 40 years of age, around 10 percent of those born in the 1940s were
obese, whereas over 20 percent of those born in the 1960s were obese by the same age.
Analysis of changes in obesity rates by ethnic group (see Appendix 1) showed similar cohort
effects to those outlined above. The age-effects are most evident in Pacific people.
Understanding Excess Body Weight: New Zealand Health Survey 27
Excess body weight in
children
Key messages
Body mass index distribution
One-third of children are overweight or obese; 11 percent are obese in 2011-13.
Around 35,000 children (5%) are morbidly obese; that is, have a BMI of ≥ 35 kg/m2.
Like overall obesity rates, rates of morbid obesity in children are highest in Pacific
(12%) and Māori children (8%).
Morbid obesity rates are highest in children aged 2–4 years (6%), decreasing to
3 percent in those aged 10–14 years.
After adjusting for age, sex and ethnic differences, children living in the most deprived
areas are four times as likely to be morbidly obese as those living in the least deprived
areas.
Alternative measures of excess body weight
One in four children has a high WHtR; that is, a WHtR of ≥ 0.5.
Pacific children are most likely to have a high WHtR; two out of five Pacific children are
affected.
Parental perception of child weight
Over half of parents of obese children do not perceive their child to be overweight.
Parents of obese children aged 2–4 years are the least likely to believe that their child
has a weight problem: nine out of ten believes their child to be neither under- nor
overweight.
28 Understanding Excess Body Weight: New Zealand Health Survey
Body mass index distribution
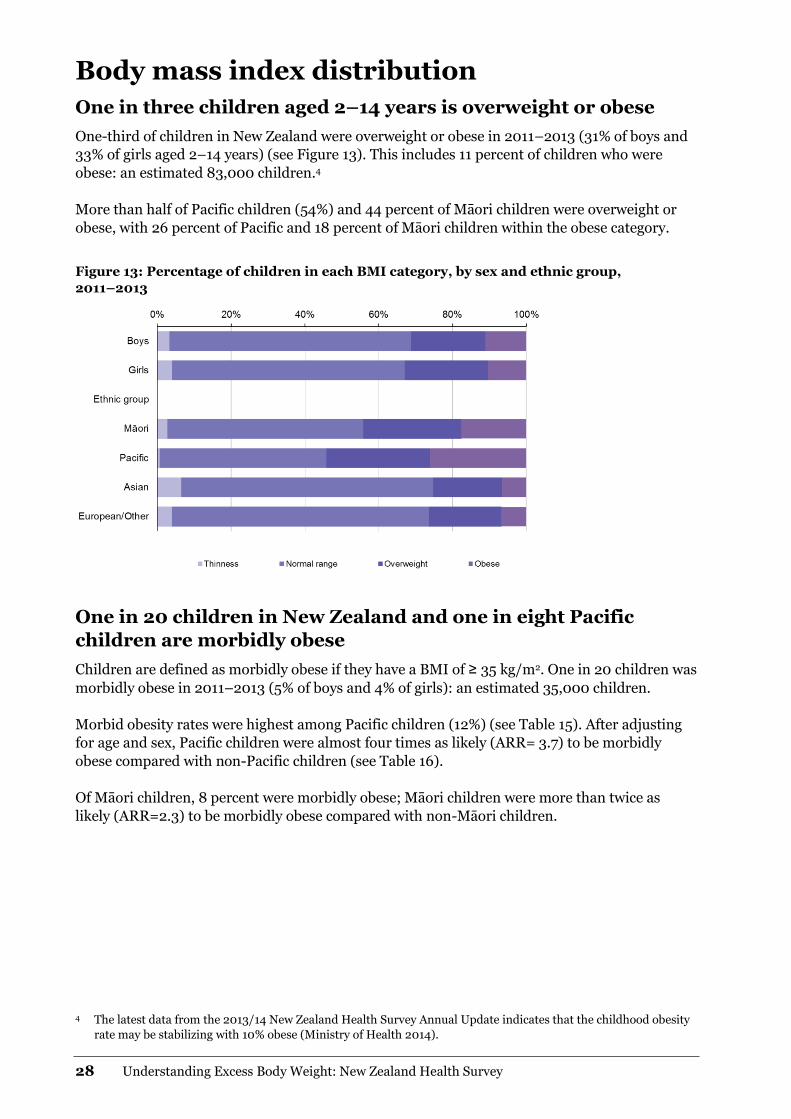
One in three children aged 2–14 years is overweight or obese
One-third of children in New Zealand were overweight or obese in 2011–2013 (31% of boys and
33% of girls aged 2–14 years) (see Figure 13). This includes 11 percent of children who were
obese: an estimated 83,000 children.4
More than half of Pacific children (54%) and 44 percent of Māori children were overweight or
obese, with 26 percent of Pacific and 18 percent of Māori children within the obese category.
Figure 13: Percentage of children in each BMI category, by sex and ethnic group,
2011–2013
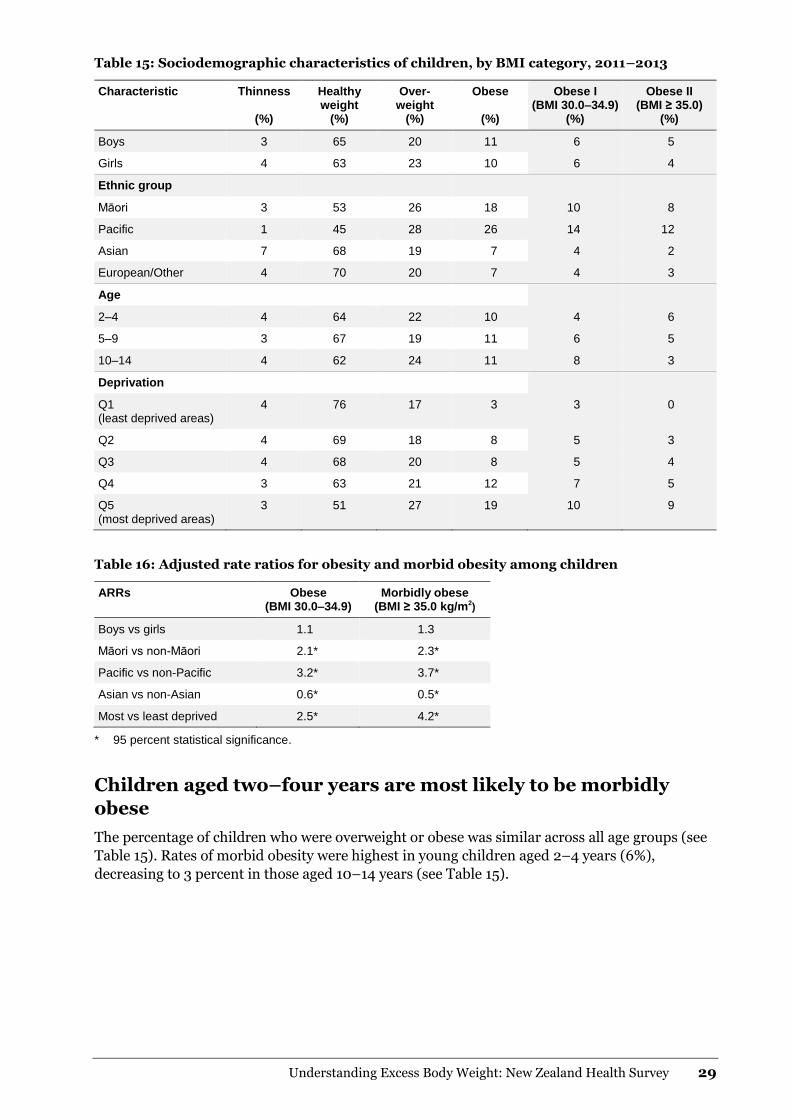
One in 20 children in New Zealand and one in eight Pacific
children are morbidly obese
Children are defined as morbidly obese if they have a BMI of ≥ 35 kg/m2. One in 20 children was
morbidly obese in 2011–2013 (5% of boys and 4% of girls): an estimated 35,000 children.
Morbid obesity rates were highest among Pacific children (12%) (see Table 15). After adjusting
for age and sex, Pacific children were almost four times as likely (ARR= 3.7) to be morbidly
obese compared with non-Pacific children (see Table 16).
Of Māori children, 8 percent were morbidly obese; Māori children were more than twice as
likely (ARR=2.3) to be morbidly obese compared with non-Māori children.
4 The latest data from the 2013/14 New Zealand Health Survey Annual Update indicates that the childhood obesity
rate may be stabilizing with 10% obese (Ministry of Health 2014).
Understanding Excess Body Weight: New Zealand Health Survey 29
Table 15: Sociodemographic characteristics of children, by BMI category, 2011–2013
Characteristic Thinness
(%)
Healthy weight
(%)
Over-weight
(%)
Obese
(%)
Obese I (BMI 30.0–34.9)
(%)
Obese II (BMI ≥ 35.0)
(%)
Boys 3 65 20 11 6 5
Girls 4 63 23 10 6 4
Ethnic group
Māori 3 53 26 18 10 8
Pacific 1 45 28 26 14 12
Asian 7 68 19 7 4 2
European/Other 4 70 20 7 4 3
Age
2–4 4 64 22 10 4 6
5–9 3 67 19 11 6 5
10–14 4 62 24 11 8 3
Deprivation
Q1 (least deprived areas)
4 76 17 3 3 0
Q2 4 69 18 8 5 3
Q3 4 68 20 8 5 4
Q4 3 63 21 12 7 5
Q5 (most deprived areas)
3 51 27 19 10 9
Table 16: Adjusted rate ratios for obesity and morbid obesity among children
ARRs Obese (BMI 30.0–34.9)
Morbidly obese (BMI ≥ 35.0 kg/m2
)
Boys vs girls 1.1 1.3
Māori vs non-Māori 2.1* 2.3*
Pacific vs non-Pacific 3.2* 3.7*
Asian vs non-Asian 0.6* 0.5*
Most vs least deprived 2.5* 4.2*
* 95 percent statistical significance.
Children aged two–four years are most likely to be morbidly
obese
The percentage of children who were overweight or obese was similar across all age groups (see
Table 15). Rates of morbid obesity were highest in young children aged 2–4 years (6%),
decreasing to 3 percent in those aged 10–14 years (see Table 15).
30 Understanding Excess Body Weight: New Zealand Health Survey
Almost half of children (46%) living in the most deprived areas
are overweight or obese
Rates of overweight and obesity were highest among children living in the most deprived areas
in 2011–2013: 46 percent of these children were overweight or obese, compared with 20 percent
of those living in the least deprived areas. One in five children (19%) living in the most deprived
areas was obese, including 9 percent who were morbidly obese.
After adjusting for age, sex and ethnic differences, children who lived in the most deprived areas
were 2½ times as likely (ARR=2.5) to be obese, and four times as likely (ARR=4.2) to be
morbidly obese, compared with those living in the least deprived areas (see Table 16).
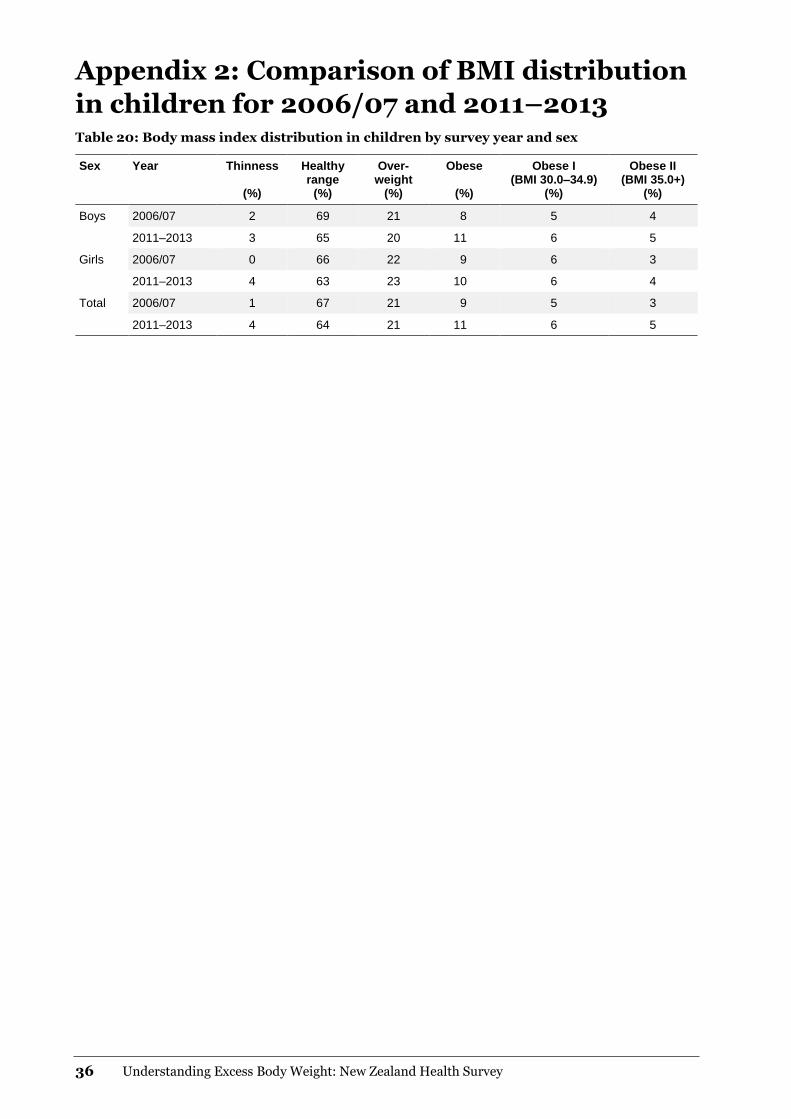
Appendix 2 compares the percentage of boys and girls in each BMI category for 2006/07 and
2011–2013.
Alternative measures of excess body weight
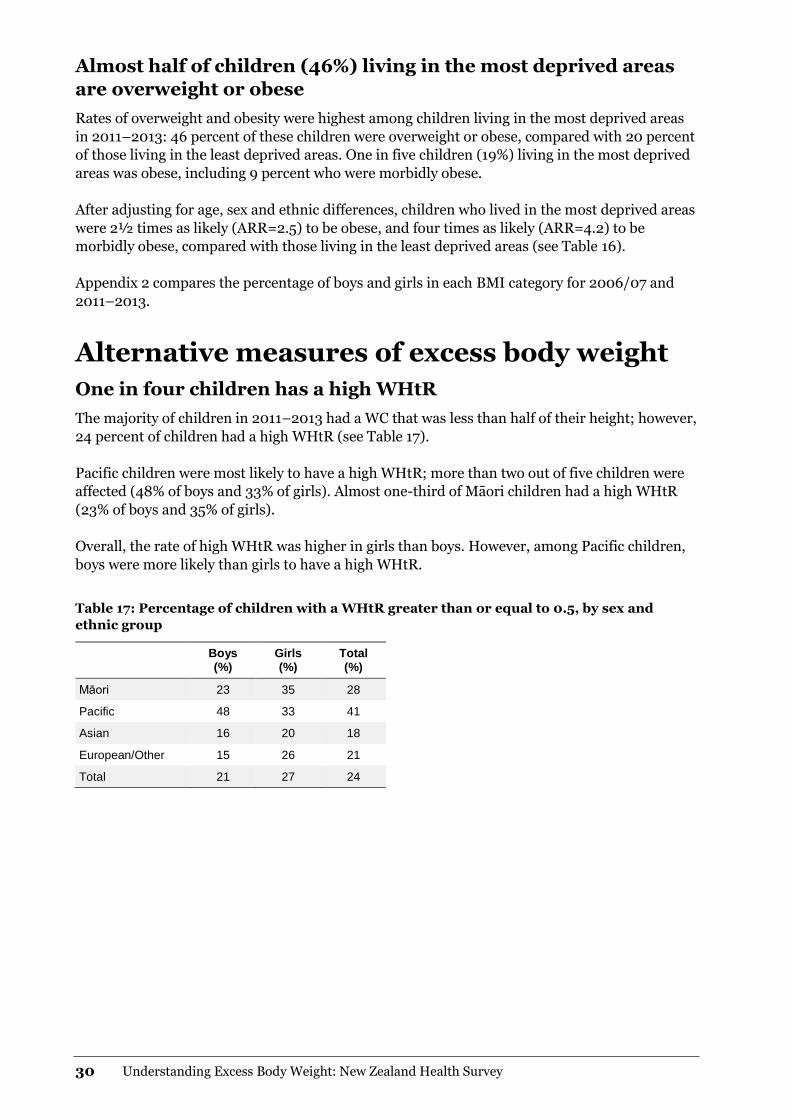
One in four children has a high WHtR
The majority of children in 2011–2013 had a WC that was less than half of their height; however,
24 percent of children had a high WHtR (see Table 17).
Pacific children were most likely to have a high WHtR; more than two out of five children were
affected (48% of boys and 33% of girls). Almost one-third of Māori children had a high WHtR
(23% of boys and 35% of girls).
Overall, the rate of high WHtR was higher in girls than boys. However, among Pacific children,
boys were more likely than girls to have a high WHtR.
Table 17: Percentage of children with a WHtR greater than or equal to 0.5, by sex and
ethnic group
Boys (%)
Girls (%)
Total (%)
Māori 23 35 28
Pacific 48 33 41
Asian 16 20 18
European/Other 15 26 21
Total 21 27 24
Understanding Excess Body Weight: New Zealand Health Survey 31
Relationship between parental and child
obesity status
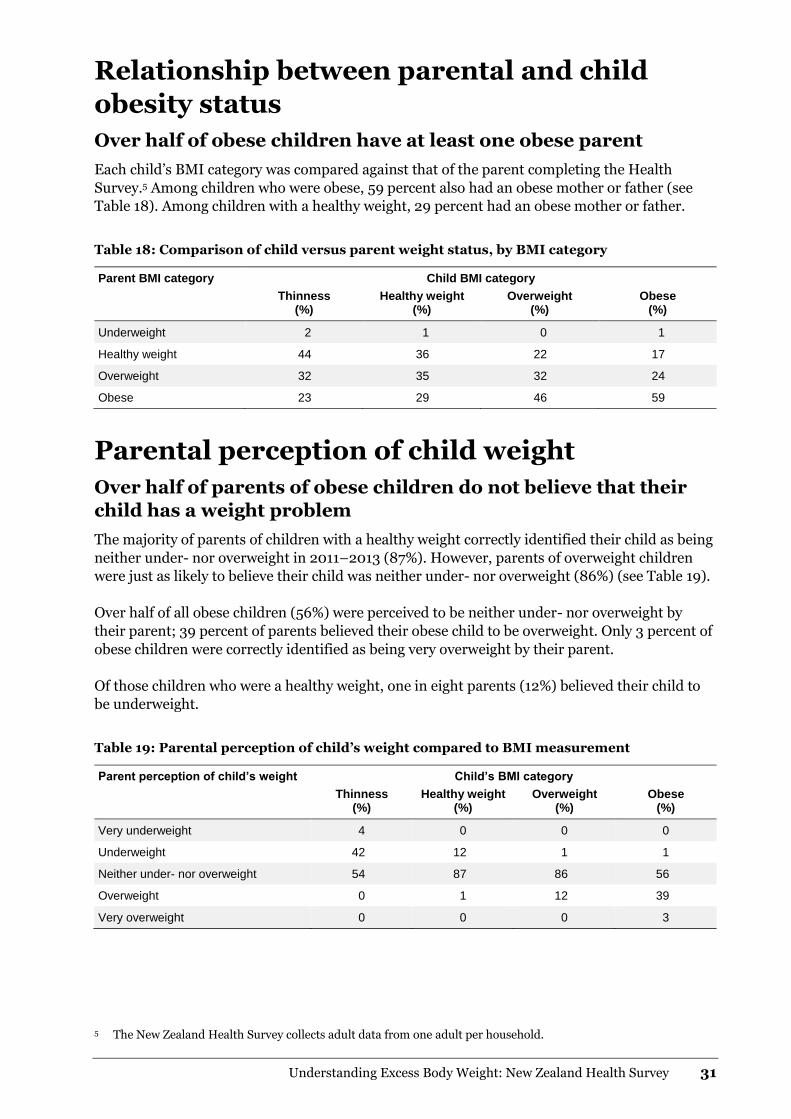
Over half of obese children have at least one obese parent
Each child’s BMI category was compared against that of the parent completing the Health
Survey.5 Among children who were obese, 59 percent also had an obese mother or father (see
Table 18). Among children with a healthy weight, 29 percent had an obese mother or father.
Table 18: Comparison of child versus parent weight status, by BMI category
Parent BMI category Child BMI category
Thinness (%)
Healthy weight (%)
Overweight (%)
Obese (%)
Underweight 2 1 0 1
Healthy weight 44 36 22 17
Overweight 32 35 32 24
Obese 23 29 46 59
Parental perception of child weight
Over half of parents of obese children do not believe that their
child has a weight problem
The majority of parents of children with a healthy weight correctly identified their child as being
neither under- nor overweight in 2011–2013 (87%). However, parents of overweight children
were just as likely to believe their child was neither under- nor overweight (86%) (see Table 19).
Over half of all obese children (56%) were perceived to be neither under- nor overweight by
their parent; 39 percent of parents believed their obese child to be overweight. Only 3 percent of
obese children were correctly identified as being very overweight by their parent.
Of those children who were a healthy weight, one in eight parents (12%) believed their child to
be underweight.
Table 19: Parental perception of child’s weight compared to BMI measurement
Parent perception of child’s weight Child’s BMI category
Thinness (%)
Healthy weight (%)
Overweight (%)
Obese (%)
Very underweight 4 0 0 0
Underweight 42 12 1 1
Neither under- nor overweight 54 87 86 56
Overweight 0 1 12 39
Very overweight 0 0 0 3
5 The New Zealand Health Survey collects adult data from one adult per household.
32 Understanding Excess Body Weight: New Zealand Health Survey
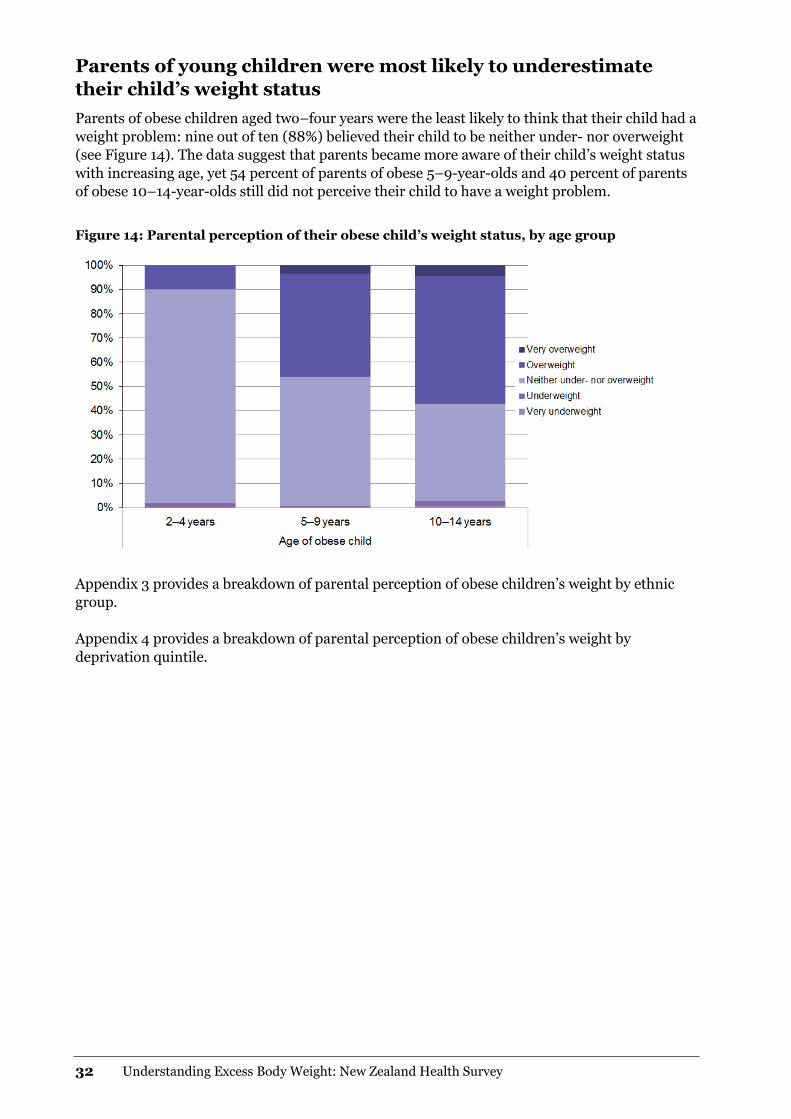
Parents of young children were most likely to underestimate
their child’s weight status
Parents of obese children aged two–four years were the least likely to think that their child had a
weight problem: nine out of ten (88%) believed their child to be neither under- nor overweight
(see Figure 14). The data suggest that parents became more aware of their child’s weight status
with increasing age, yet 54 percent of parents of obese 5–9-year-olds and 40 percent of parents
of obese 10–14-year-olds still did not perceive their child to have a weight problem.
Figure 14: Parental perception of their obese child’s weight status, by age group
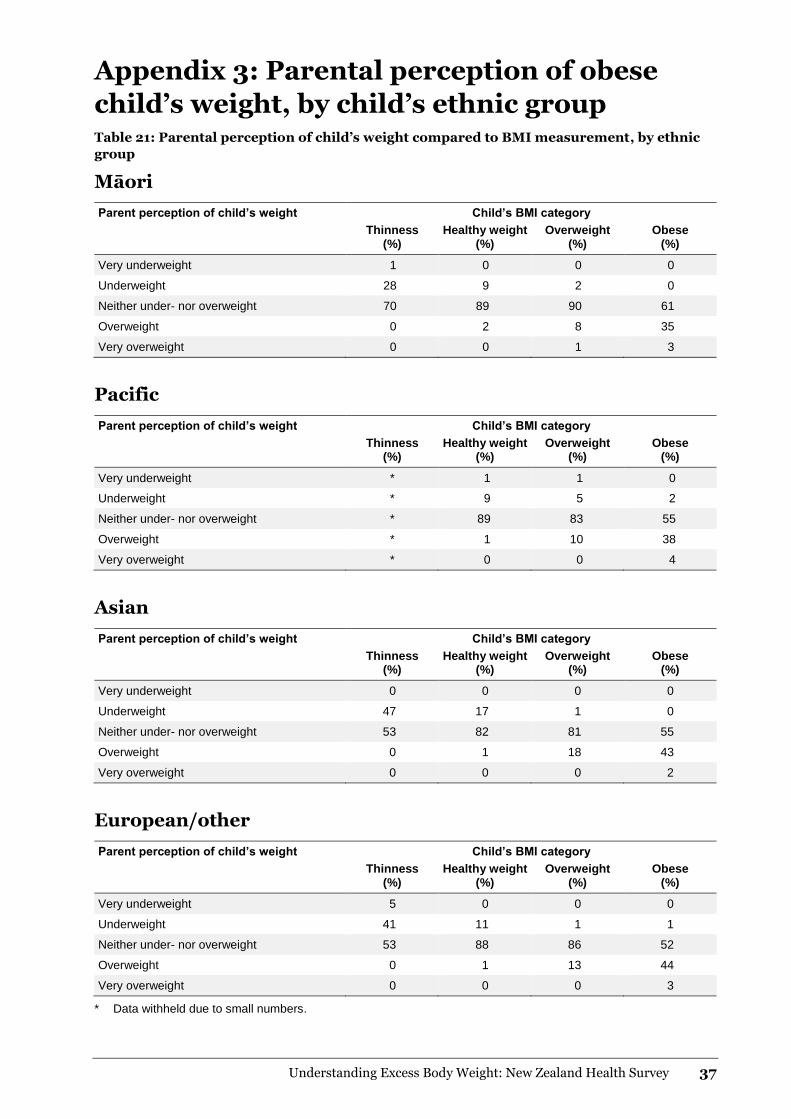
Appendix 3 provides a breakdown of parental perception of obese children’s weight by ethnic
group.
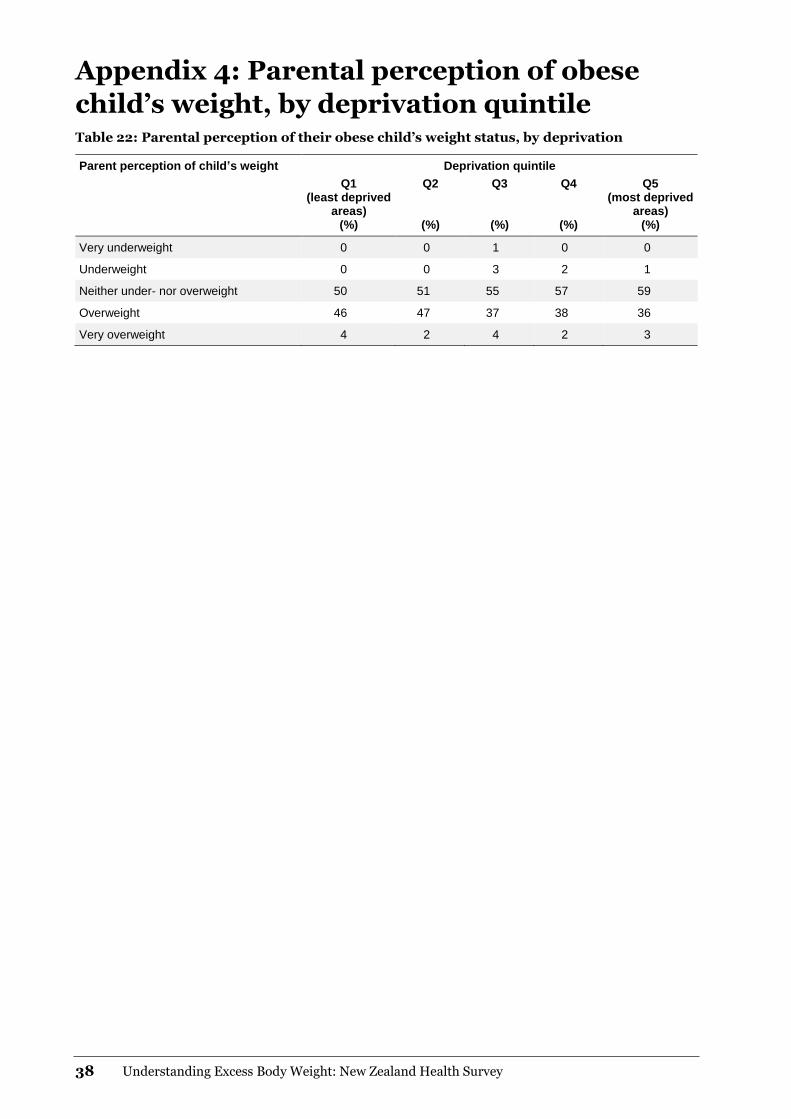
Appendix 4 provides a breakdown of parental perception of obese children’s weight by
deprivation quintile.
Understanding Excess Body Weight: New Zealand Health Survey 33
Summary
This analysis highlights the scale of the obesity epidemic in New Zealand: 30 percent of adults
and 11 percent of children were obese in 2011-13. In addition, a further 35 percent of adults and
21 percent of children were overweight. Over 2.5 million New Zealanders – more than half the
population – were either overweight or obese.
Since the late 1970s, the adult obesity rate has increased three-fold; from 10% in 1977 to 30% in
2011–13. The increase in adult obesity is evident across all age groups, with an average 3 percent
increase in the obesity rate per year.
There is a lack of data on historic obesity trends for children; however, the childhood obesity
rate increased from 9 percent in 2006/07 to 11 percent in 2011–13. The latest data from the
2013/14 New Zealand Health Survey (Ministry of Health 2014) indicates that the childhood
obesity rate may be stabilising with 10% of children obese. If the rate is stabilising, it would
bring New Zealand in line with a number of other OECD countries which have seen their
childhood obesity rates stabilise (and, in the case of Mexico and England, slightly decline) over
the same time period (OECD 2014).
The increase in obesity among younger adults means that these individuals will spend a much
greater proportion of their lifetime obese, making them more susceptible to obesity-related ill
health. There is already an increased prevalence of type 2 diabetes mellitus in children and
youth in New Zealand (Hotu et al 2004; Jefferies et al 2012).
The age at which the obesity rate peaks is also increasing, which may be due to improved
survival among obese adults. A more obese elderly population is likely to result in increased
rates of chronic disease and an increased number of individuals living with multiple health
conditions.
This report highlights the prevalence of extreme obesity in New Zealand: 4 percent of adults
have a BMI of ≥ 40 kg/m2 and 5 percent of children have a BMI of ≥ 35 kg/m2. This means
147,000 adults and 35,000 children are at very high risk of obesity-related health problems, and
are accordingly likely to represent a significant burden to the health sector.
Extreme obesity is a particular concern among Pacific peoples and Māori. Rates of extreme
obesity are five times higher in Pacific adults and nearly four times higher in Pacific children
than they are in the non-Pacific population. Among Māori, extreme obesity rates are nearly
three times as high in adults and more than twice as high in children as they are in non-Māori.
Previous New Zealand Health Survey publications have already highlighted the socioeconomic
disparities in obesity rates. After adjusting for age, sex and ethnic differences, obesity rates
among those living in the most deprived areas are almost twice as high for adults and 2½ times
as high for children, compared with those living in the least deprived areas. Analyses in this
report show that these disparities are even greater for extreme obesity. Both adults and children
living in the most deprived areas are four times as likely to be extremely obese compared with
those living in the least deprived areas.
34 Understanding Excess Body Weight: New Zealand Health Survey
The analysis of parental perception of child weight in this report highlights that the majority of
parents are unaware that their obese child is overweight. This is particularly the case among
those living in the most deprived areas and parents of young children. Perhaps because of the
general increase in childhood obesity, our perception of what normal, healthy weight looks like
in a child may have changed. These findings will be of interest to those looking to promote the
development of healthy habits in children.
The aim of this report was to provide an overview of the epidemiology of obesity. In doing so,
the researchers have identified a number of areas for future analysis. The birth cohort analysis
presented in this report highlights the historic growth in obesity; the obvious question is what
the future holds. This report does not provide obesity projections, which would require more
detailed analysis of factors influencing obesity rates in the future, including immigration,
changes in life expectancy and the impact of current policies.
Further research linking the alternative measures of excess body weight presented in this report
with particular health outcomes would help identify the most appropriate measures to assess
disease risk among different population groups. Linking data from the New Zealand Health
Survey with hospitalisation data would also enable a more detailed understanding of the health
risks and health care usage associated with obesity and extreme obesity.
New Zealand Health Survey data is available to researchers through Statistics New Zealand
datasets. The Ministry of Health encourages other researchers to explore this rich data source.
Understanding Excess Body Weight: New Zealand Health Survey 35
Appendices
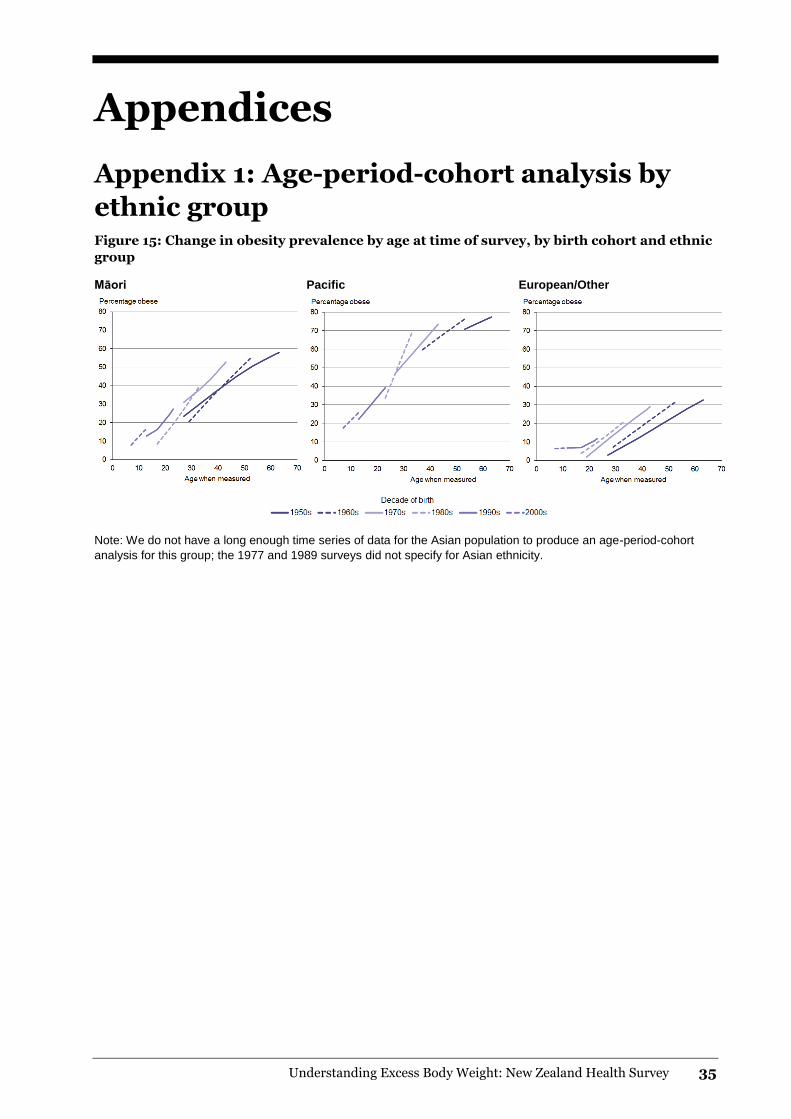
Appendix 1: Age-period-cohort analysis by
ethnic group Figure 15: Change in obesity prevalence by age at time of survey, by birth cohort and ethnic
group
Māori Pacific European/Other
Note: We do not have a long enough time series of data for the Asian population to produce an age-period-cohort
analysis for this group; the 1977 and 1989 surveys did not specify for Asian ethnicity.
36 Understanding Excess Body Weight: New Zealand Health Survey
Appendix 2: Comparison of BMI distribution
in children for 2006/07 and 2011–2013 Table 20: Body mass index distribution in children by survey year and sex
Sex Year Thinness
(%)
Healthy range
(%)
Over-weight
(%)
Obese
(%)
Obese I (BMI 30.0–34.9)
(%)
Obese II (BMI 35.0+)
(%)
Boys 2006/07 2 69 21 8 5 4
2011–2013 3 65 20 11 6 5
Girls 2006/07 0 66 22 9 6 3
2011–2013 4 63 23 10 6 4
Total 2006/07 1 67 21 9 5 3
2011–2013 4 64 21 11 6 5
Understanding Excess Body Weight: New Zealand Health Survey 37
Appendix 3: Parental perception of obese
child’s weight, by child’s ethnic group Table 21: Parental perception of child’s weight compared to BMI measurement, by ethnic
group
Māori
Parent perception of child’s weight Child’s BMI category
Thinness (%)
Healthy weight (%)
Overweight (%)
Obese (%)
Very underweight 1 0 0 0
Underweight 28 9 2 0
Neither under- nor overweight 70 89 90 61
Overweight 0 2 8 35
Very overweight 0 0 1 3
Pacific
Parent perception of child’s weight Child’s BMI category
Thinness (%)
Healthy weight (%)
Overweight (%)
Obese (%)
Very underweight * 1 1 0
Underweight * 9 5 2
Neither under- nor overweight * 89 83 55
Overweight * 1 10 38
Very overweight * 0 0 4
Asian
Parent perception of child’s weight Child’s BMI category
Thinness (%)
Healthy weight (%)
Overweight (%)
Obese (%)
Very underweight 0 0 0 0
Underweight 47 17 1 0
Neither under- nor overweight 53 82 81 55
Overweight 0 1 18 43
Very overweight 0 0 0 2
European/other
Parent perception of child’s weight Child’s BMI category
Thinness (%)
Healthy weight (%)
Overweight (%)
Obese (%)
Very underweight 5 0 0 0
Underweight 41 11 1 1
Neither under- nor overweight 53 88 86 52
Overweight 0 1 13 44
Very overweight 0 0 0 3
* Data withheld due to small numbers.
38 Understanding Excess Body Weight: New Zealand Health Survey
Appendix 4: Parental perception of obese
child’s weight, by deprivation quintile Table 22: Parental perception of their obese child’s weight status, by deprivation
Parent perception of child’s weight Deprivation quintile
Q1 (least deprived
areas) (%)
Q2
(%)
Q3
(%)
Q4
(%)
Q5 (most deprived
areas) (%)
Very underweight 0 0 1 0 0
Underweight 0 0 3 2 1
Neither under- nor overweight 50 51 55 57 59
Overweight 46 47 37 38 36
Very overweight 4 2 4 2 3
Understanding Excess Body Weight: New Zealand Health Survey 39
References
Arterburn, DE, Maciejewski, MC, Tsevat, J. 2005. Impact of morbid obesity on medical expenditures
in adults. International Journal of Obesity (London) 29(3): 334-9.
Ashwell M, Gibson S. 2009. Waist to height ratio is a simple and effective obesity screening tool for
cardiovascular risk factors: analysis of data from the British National Diet and Nutrition Survey of
Adults aged 19–64 years. Obesity Facts 2(2): 97–103.
Birkbeck J. 1983. New Zealanders and their Diet: A report to the National Heart Foundation of
New Zealand on the national diet survey, 1977. Dunedin: Otago University.
Browning LM, Hsieh SD, Ashwell M. 2010. A systematic review of waist-to-height ratio as a
screening tool for the prediction of cardiovascular disease and diabetes: 0.5 could be a suitable global
boundary value. Nutrition Research Reviews 23(2): 247–69.
Calle EE, Thun MJ, Petrelli JM, et al. 1999. Body-mass index and mortality in a prospective cohort of
U.S. adults. The New England Journal of Medicine 341: 1097-1105.
Cole TJ, Lobstein T. 2012. Extended international (IOTF) body mass index cut-offs for thinness,
overweight and obesity. Pediatric Obesity 7(4): 284–94.
Daniels SR, Arnett DK, Eckel RH, et al. 2005. Overweight in children and adolescents:
pathophysiology, consequences, prevention, and treatment. Circulation 111(15): 1999–2012.
Goulding A, Taylor RW, Grant AM, et al. 2010. Waist-to-height ratios in relation to BMI z-scores in
three ethnic groups from a representative sample of New Zealand children aged 5–14 years. Int J
Obes 34(7): 1188–90.
Hotu S, Carter B, Watson P, et al. 2004. Increasing prevalence of type 2 diabetes in adolescents.
Journal of Paediatrics and Child Health 40(4): 201–4.
Janssen I, Katzmarzyk PT, Ross R. 2002. Body mass index, waist circumference, and health risk:
Evidence in support of current national institutes of health guidelines. Archives of Internal Medicine
162(18): 2074–9.
Jefferies C, Carter P, Reed PW, et al. 2012. The incidence, clinical features, and treatment of type 2
diabetes in children< 15 years in a population‐based cohort from Auckland, New Zealand,
1995–2007. Pediatric Diabetes 13(4): 294–300.
Ministry of Health. 1999. Taking the Pulse – The 1996/97 New Zealand health survey – SF-36 data
analysis. Wellington: Ministry of Health.
Ministry of Health. 2003. NZ Food NZ Children: Key results of the 2002 National Children’s
Nutrition Survey. Wellington: Ministry of Health.
Ministry of Health. 2013a. Health Loss in New Zealand: A report from the New Zealand Burden of
Diseases, Injuries and Risk Factors, 2006–16. Wellington: Ministry of Health.
Ministry of Health. 2013b. New Zealand Health Survey Methodology Report 2012/13. Wellington:
Ministry of Health.
Ministry of Health. 2014. Annual update of key results 2013/14: New Zealand Health Survey.
Wellington: Ministry of Health.
NICE. 2006. Obesity: Guidance on the prevention of overweight and obesity in adults and children.
NICE guidelines (G43). www.nice.org.uk.
40 Understanding Excess Body Weight: New Zealand Health Survey
OECD. 2014. OECD Obesity Update 2014. Paris.
Reinsch CH. 1967. Smoothing by spline functions. Numerische mathematik 10(3): 177–83.
Reither EN, Hauser RM, Yang Y. 2009. Do birth cohorts matter? Age-period-cohort analyses of the
obesity epidemic in the United States. Soc Sci Med 69(10): 1439–48.
Russell DWN. 1991. Life in New Zealand Survey Commission Report. Dunedin, University of Otago.
Volume 1.
Serdula MK, Ivery D, Coates RJ, et al. 1993. Do obese children become obese adults? A review of the
literature. Preventive medicine 22(2): 167-77.
Swinburn B. 2008. Obesity prevention: the role of policies, laws and regulations. Australia and New
Zealand Health Policy 5(1): 12.
Whitlock G, Lewington S, Sherliker P, et al. 2009. Body-mass index and cause-specific mortality in
900 000 adults: collaborative analyses of 57 prospective studies. Lancet 373(9669): 1083–96.
WHO. 2000. Obesity: Preventing and managing the global epidemic. Report of a WHO
Consultation (WHO Technical Report Series 894).
Wildman RP, Gu D, Reynolds K, et al. 2004. Appropriate body mass index and waist circumference
cutoffs for categorization of overweight and central adiposity among Chinese adults. The American
Journal of Clinical Nutrition 80(5): 1129–36.