understanding electroencephalography gregory b. sharp, m.d. chief of pediatric neurology university...
TRANSCRIPT
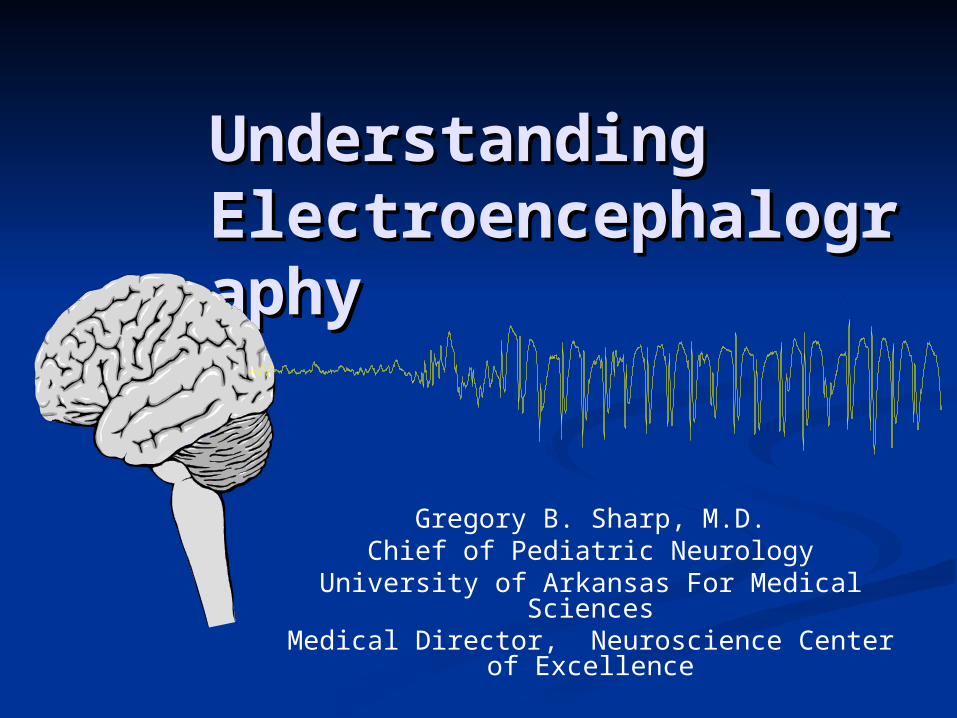
Understanding Understanding ElectroencephalogrElectroencephalographyaphy
Gregory B. Sharp, M.D.Chief of Pediatric Neurology
University of Arkansas For Medical SciencesMedical Director, Neuroscience Center of
Excellence
The Source of EEGThe Source of EEG
EEG = a measure of cerebral electrical EEG = a measure of cerebral electrical activityactivity The generator sources for EEG waves are The generator sources for EEG waves are
within the cerebral cortexwithin the cerebral cortex Electrical activity recorded on the scalp is Electrical activity recorded on the scalp is
produced by extracellular current flow produced by extracellular current flow associated with summated excitatory and associated with summated excitatory and inhibitory postsynaptic potentials (EPSPs inhibitory postsynaptic potentials (EPSPs and IPSPs)and IPSPs)
Individual action potentials do not contribute Individual action potentials do not contribute directly to EEG activitydirectly to EEG activity

Synaptic Potentials: Synaptic Potentials: The Basis of EEG ActivityThe Basis of EEG Activity
Synaptic potentials are of much lower Synaptic potentials are of much lower voltage than action potentials, but the voltage than action potentials, but the produced current has a much larger produced current has a much larger distributiondistribution
PSPs have a longer duration and involve a PSPs have a longer duration and involve a larger amount of membrane surface area larger amount of membrane surface area than APsthan APs

EPSPs and IPSPsEPSPs and IPSPs
EPSP – produces a change in EPSP – produces a change in membrane permeability within a membrane permeability within a select portion of the cell membrane select portion of the cell membrane resulting in a net influx of + ions resulting in a net influx of + ions that depolarizes the cell that depolarizes the cell
IPSP – selective activation of either IPSP – selective activation of either ClCl-- or K or K++ channels resulting in a net channels resulting in a net outward ionic current with outward ionic current with hyperpolarization of the cellhyperpolarization of the cell
EEG: A Reflection of EEG: A Reflection of CurrentCurrent
Spontaneous EEG activity occurs when Spontaneous EEG activity occurs when currents flow across charged neuronal currents flow across charged neuronal membranesmembranesAn EEG waveform reflects a An EEG waveform reflects a summation of PSPs from thousands or summation of PSPs from thousands or even millions of cortical neuronseven millions of cortical neuronsThe EEG represents the “average” The EEG represents the “average” behavior of large neuronal aggregatesbehavior of large neuronal aggregatesThe current flow from positive to The current flow from positive to negative is arranged in a dipolenegative is arranged in a dipole

The DipoleThe Dipole
Theoretically, the current flows in a 3-Theoretically, the current flows in a 3-dimensional ellipse with the greatest dimensional ellipse with the greatest current density along a straight line current density along a straight line connecting the positive pole to the connecting the positive pole to the negative polenegative poleThe complex arrangement of the brain The complex arrangement of the brain and head, differences in cell type and and head, differences in cell type and function within a region, and physical function within a region, and physical differences between brain areas result differences between brain areas result in an approximate dipole that is not a in an approximate dipole that is not a perfect model.perfect model.
Rhythmical vs. Arrhythmical Rhythmical vs. Arrhythmical EEG ActivityEEG Activity
When EEG waves are rhythmical, When EEG waves are rhythmical, most of the cells within the given most of the cells within the given neuronal pool are behaving similarly neuronal pool are behaving similarly
With arrhythmic activity, there is With arrhythmic activity, there is less correlation with individual cell less correlation with individual cell behaviorbehavior

Pyamidal Cells: Pyamidal Cells: Principal Current Principal Current Generators of EEGGenerators of EEG
Topographical organization within Topographical organization within the cortical mantle corresponds to a the cortical mantle corresponds to a dipoles oriented perpendicular to dipoles oriented perpendicular to the cortical surfacethe cortical surface

Factors Affecting EEG Factors Affecting EEG WaveformsWaveforms
Voltage of the cortical dischargeVoltage of the cortical discharge
Area involved in synchronous activityArea involved in synchronous activity
Degree of synchronyDegree of synchrony
Location of the dipole generators in Location of the dipole generators in relation to the convolutions of the relation to the convolutions of the cortical mantle.cortical mantle.
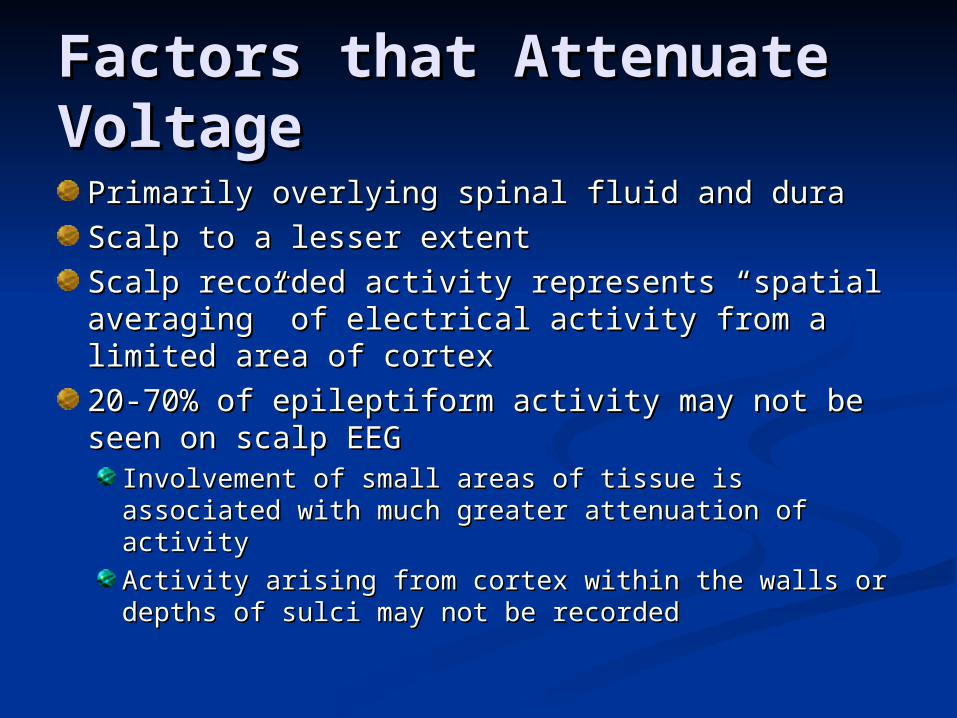
Factors that Attenuate Factors that Attenuate VoltageVoltage
Primarily overlying spinal fluid and dura Primarily overlying spinal fluid and dura
Scalp to a lesser extentScalp to a lesser extent
Scalp recorded activity represents “spatial Scalp recorded activity represents “spatial averaging” of electrical activity from a limited averaging” of electrical activity from a limited area of cortexarea of cortex
20-70% of epileptiform activity may not be 20-70% of epileptiform activity may not be seen on scalp EEGseen on scalp EEG
Involvement of small areas of tissue is associated Involvement of small areas of tissue is associated with much greater attenuation of activitywith much greater attenuation of activity
Activity arising from cortex within the walls or Activity arising from cortex within the walls or depths of sulci may not be recordeddepths of sulci may not be recorded

Origin of EEG Origin of EEG RhythmicityRhythmicity
Rhythmical activity – sequences of regularly Rhythmical activity – sequences of regularly recurring waveforms of similar shape and recurring waveforms of similar shape and durationdurationRhythmical activity may be locally generated Rhythmical activity may be locally generated or occur via projected synaptic inputs from or occur via projected synaptic inputs from deeper structuresdeeper structuresThe thalamus, via an anatomic cellular The thalamus, via an anatomic cellular organization, thalamocortical projections and organization, thalamocortical projections and mechansims that are not fully understood, mechansims that are not fully understood, governs different types of rhythmical activitygoverns different types of rhythmical activity
Sleep spindlesSleep spindlesAlpha rhythm in the occipital cortexAlpha rhythm in the occipital cortex3 per second spike and wave associated with 3 per second spike and wave associated with absence seizuresabsence seizures

200 uV
1 sec
Vertex Wave and Sleep Vertex Wave and Sleep SpindlesSpindles
Fp1-F3
F3-C3
C3-P3
P3-O1
Fp2-F4
F4-C4
C4-P4
P4-O2
200 uV
1 sec
200 uV
1 sec
Fp1-F3
F3-C3
C3-P3
P3-O1
Fp2-F4
F4-C4
C4-P4
P4-O2
Fp1-F7
F7-T3
T3-T5
T5-O1
Fp2-F8
F8-T4
T4-T6
T6-O2
200 uV
1 sec
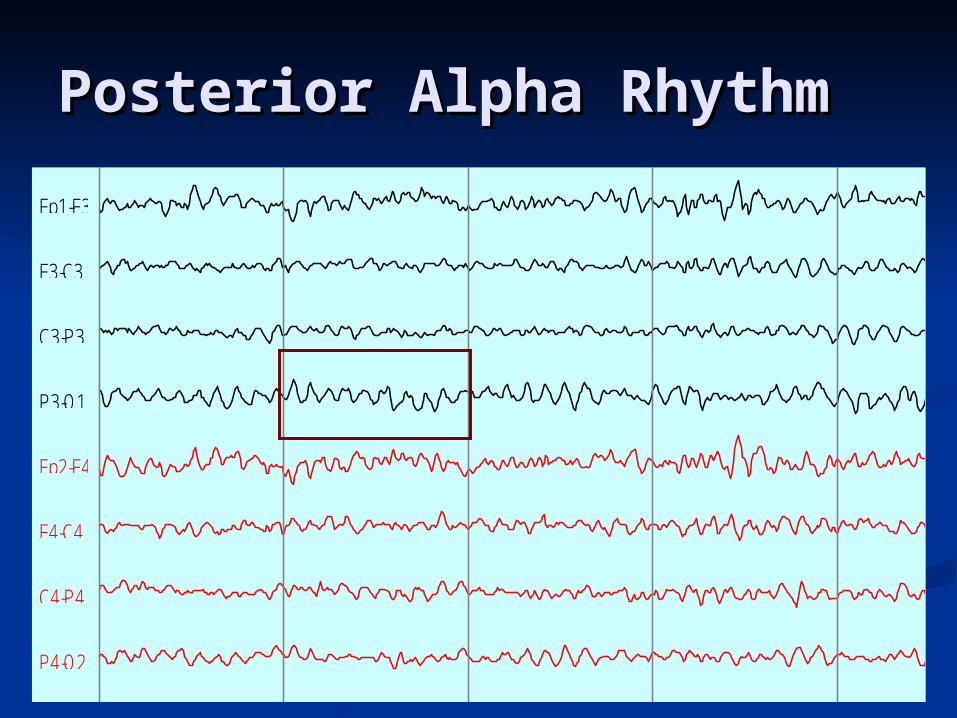
Posterior Alpha RhythmPosterior Alpha Rhythm
Fp1-F3
F3-C3
C3-P3
P3-O1
Fp2-F4
F4-C4
C4-P4
P4-O2
200 uV
1 sec

Epileptiform Discharges: Epileptiform Discharges: SpikesSpikes
Indicate susceptibility to seizuresIndicate susceptibility to seizures
May be generalized or focalMay be generalized or focal
Focal spikes – cortical spikes are Focal spikes – cortical spikes are associated with synchronous associated with synchronous paroxysmal depolarizing bursts paroxysmal depolarizing bursts occurring in neurons within the occurring in neurons within the focus resulting in extracellular focus resulting in extracellular current flow that is recorded as current flow that is recorded as surface spikessurface spikes
200 uV
1 sec

The Spike and Wave The Spike and Wave ComplexComplex
The cellular depolarizing bursts are The cellular depolarizing bursts are followed by long-lasting followed by long-lasting afterhyperpolarization in cells within afterhyperpolarization in cells within the focusthe focus
Additional inhibition occurs in Additional inhibition occurs in surrounding cortex, thalamus and surrounding cortex, thalamus and other subcortical areasother subcortical areas
This results in a surface slow wave This results in a surface slow wave that follows the individual spikethat follows the individual spike

Fp1-F7
F7-T3
T3-T5
Left Temporal SpikesLeft Temporal Spikes
Spike and slow wave complex

Neuronal Neuronal SynchronizationSynchronization
The interictal spike may be initiated by The interictal spike may be initiated by a spontaneous burst in one or a few a spontaneous burst in one or a few cellscellsEach cell has excitatory connections to Each cell has excitatory connections to a number of other cellsa number of other cellsExcitatory connections will allow burst Excitatory connections will allow burst propagation if inhibition is decreased, propagation if inhibition is decreased, absent or simply overcome absent or simply overcome Loss of effective dendritic inhibitory Loss of effective dendritic inhibitory synapses may occur over timesynapses may occur over time

Generalized Spike-and-Generalized Spike-and-WaveWave
A pathological exaggeration of cortical A pathological exaggeration of cortical excitability is the basic disturbance and excitability is the basic disturbance and appears to initiate the processappears to initiate the processCortical spikes precede epileptiform Cortical spikes precede epileptiform discharges in depthsdischarges in depthsThalamocortical connections are necessary for Thalamocortical connections are necessary for triggering and phasing the spike-and-wave triggering and phasing the spike-and-wave burstsburstsThe brainstem reticular formation appears to The brainstem reticular formation appears to modulate spike-and-wave activity by modifying modulate spike-and-wave activity by modifying the level of cortical excitability. the level of cortical excitability. Substantia nigra involvement in some way is Substantia nigra involvement in some way is essential in the production of generalized essential in the production of generalized convulsions.convulsions.

EEG FrequenciesEEG Frequencies
Delta Delta 0 - 4 Hertz0 - 4 Hertz
ThetaTheta 4 - 7 Hertz4 - 7 Hertz
AlphaAlpha 8 - 13 Hetrz8 - 13 Hetrz
BetaBeta > 13 Hertz> 13 Hertz

EEG in NeonatesEEG in Neonates
Premature newborn – due to the Premature newborn – due to the incomplete development of neuronal incomplete development of neuronal connections, synapse formation, connections, synapse formation, myelination, etc., EEG activity prior to 30 myelination, etc., EEG activity prior to 30 weeks estimated gestational age (EGA) is weeks estimated gestational age (EGA) is disccontinuous and very “abnormal” disccontinuous and very “abnormal” appearingappearing
Focal sharp discharges in frontal and Focal sharp discharges in frontal and temporal regions are normal to some temporal regions are normal to some extent until about 44 weeks EGAextent until about 44 weeks EGA

Trace Discontinue in 27 week EGA Trace Discontinue in 27 week EGA NeonateNeonate
Fp1-F7
F7-T5
T5-O1
Fp1-F3
F3-P3
P3-O1
Fp2-F4
F4-P4
P4-O2
Fp2-F8
F8-T6
T6-O2
100 uV1 sec

FP1-F7
F7-T5
T5-O1
FP1-F3
F3-P3
P3-O1
Fp2-F4
F4-P4
P4-O2
Fp2-F8
F8-T6
T6-O2
1 sec
50 µV
2 month old with Enterococcal meningitis and left posterior temporal focal electrographic seizure
FP1-F7
F7-T5
T5-O1
FP1-F3
F3-P3
P3-O1
Fp2-F4
F4-P4
P4-O2
Fp2-F8
F8-T6
T6-O2
1 sec 50 µV
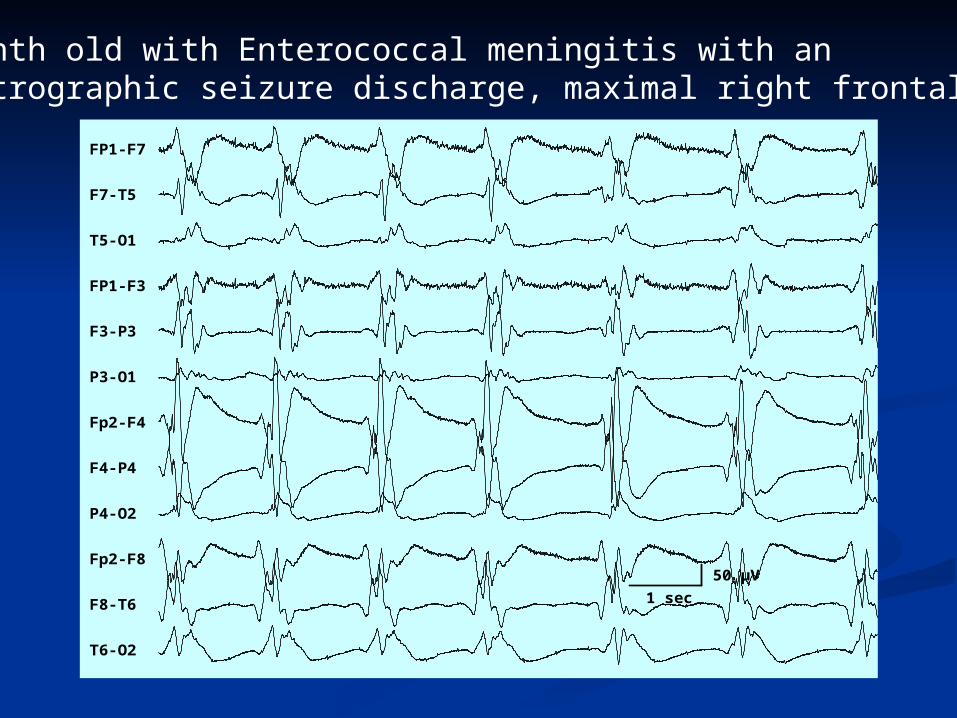
2 month old with Enterococcal meningitis with anelectrographic seizure discharge, maximal right frontal

FP1-F7
F7-T5
T5-O1
FP1-F3
F3-P3
P3-O1
Fp2-F4
F4-P4
P4-O2
Fp2-F8
F8-T6
T6-O2
1 sec
50 µV
2 month old with Enterococcal meningitis and right posterior temporal focal electrographic seizure

FP1-F7
F7-T5
T5-O1
FP1-F3
F3-P3
P3-O1
Fp2-F4
F4-P4
P4-O2
Fp2-F8
F8-T6
T6-O2
1 sec
50 µV
2 month old with Enterococcal meningitis and bilateral independent focal electrographic seizures

Progression of EEG in Progression of EEG in ChildhoodChildhood
Occipital rhythmical activity = Alpha Occipital rhythmical activity = Alpha rhythmrhythm
3-5 months3-5 months 3.5-4.5 Hertz3.5-4.5 Hertz
12 months12 months 5-6 Hertz5-6 Hertz
3 years3 years 7.5-9.5 Hertz7.5-9.5 Hertz
9 years9 years >9 Hertz>9 Hertz

EEG During Sleep EEG During Sleep
Stage I sleep Stage I sleep Dropout of alpha rhythmDropout of alpha rhythm
Intermixed slowingIntermixed slowing
Stage II sleepStage II sleepIncreased intermixed theta and delta slowingIncreased intermixed theta and delta slowing
Vertex waves, sleep spindles and K-Vertex waves, sleep spindles and K-complexescomplexes
Positive occipital sharp transients of sleep Positive occipital sharp transients of sleep (POSTs)(POSTs)

Progression of SleepProgression of Sleep
Stage III sleepStage III sleepIncreased delta slowingIncreased delta slowing
Central vertex activity diminishesCentral vertex activity diminishes
Stage IV sleepStage IV sleepMarked delta slowingMarked delta slowing
Absence of vertex activityAbsence of vertex activity
Stage III and IV = Slow wave sleepStage III and IV = Slow wave sleep

Stage 3-4 SleepStage 3-4 SleepFp1-F3
F3-C3
C3-P3
P3-O1
Fp2-F4
F4-C4
C4-P4
P4-O2
Fp1-F7
F7-T3
T3-T5
T5-O1
Fp2-F8
F8-T4
T4-T6
T6-O2
200 uV
1 sec
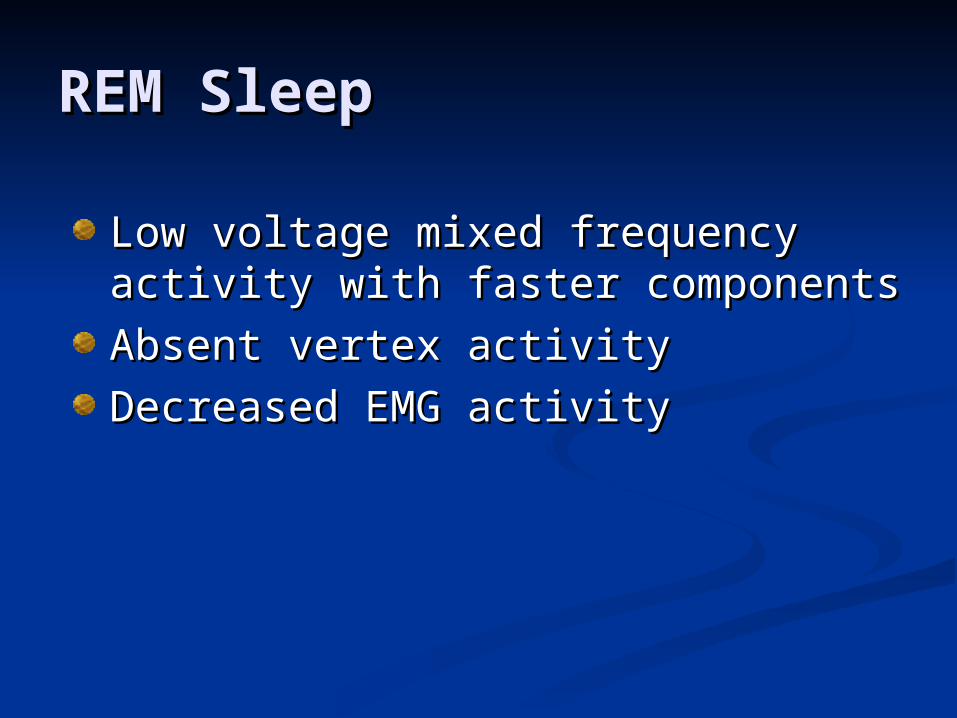
REM SleepREM Sleep
Low voltage mixed frequency Low voltage mixed frequency activity with faster componentsactivity with faster components
Absent vertex activityAbsent vertex activity
Decreased EMG activityDecreased EMG activity

Focal Epileptiform Focal Epileptiform Discharges Discharges and Abnormalitiesand Abnormalities
Spikes and sharp wavesSpikes and sharp waves
Phase reversal localizes the focusPhase reversal localizes the focus
Recorded seizuresRecorded seizures
Focal slowing may indicate an Focal slowing may indicate an underlying epileptogenic focus, underlying epileptogenic focus, structural lesion or injury, or structural lesion or injury, or postictal effectpostictal effect
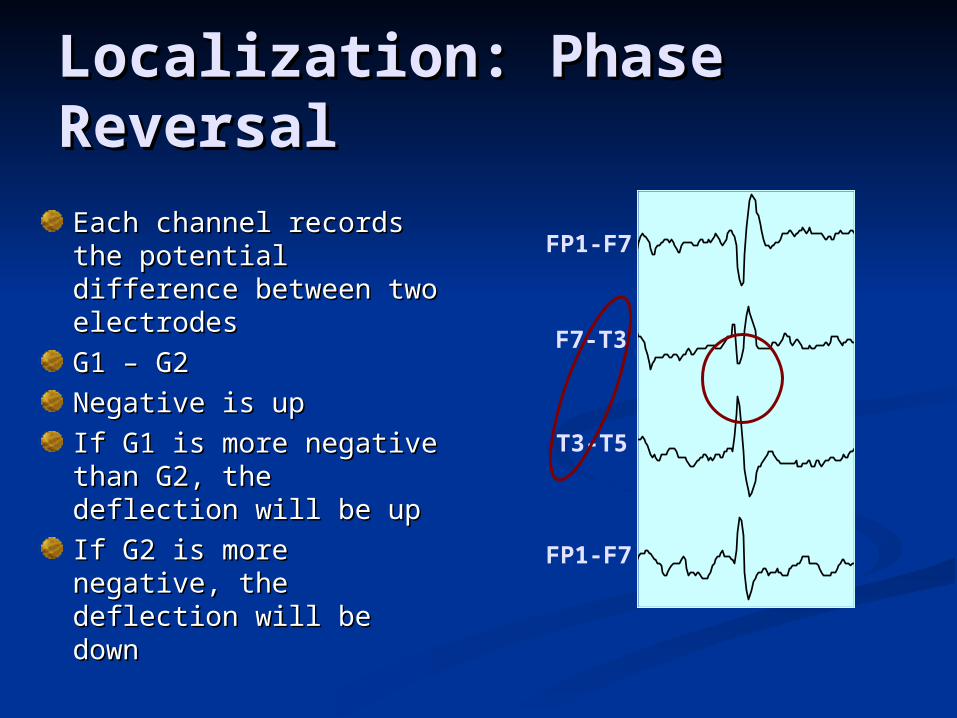
Localization: Phase Localization: Phase ReversalReversal
Each channel records Each channel records the potential the potential difference between difference between two electrodestwo electrodes
G1 – G2G1 – G2
Negative is upNegative is up
If G1 is more negative If G1 is more negative than G2, the deflection than G2, the deflection will be upwill be up
If G2 is more negative, If G2 is more negative, the deflection will be the deflection will be downdown
200 uV
1 sec
FP1-F7
F7-T3
T3-T5
FP1-F7
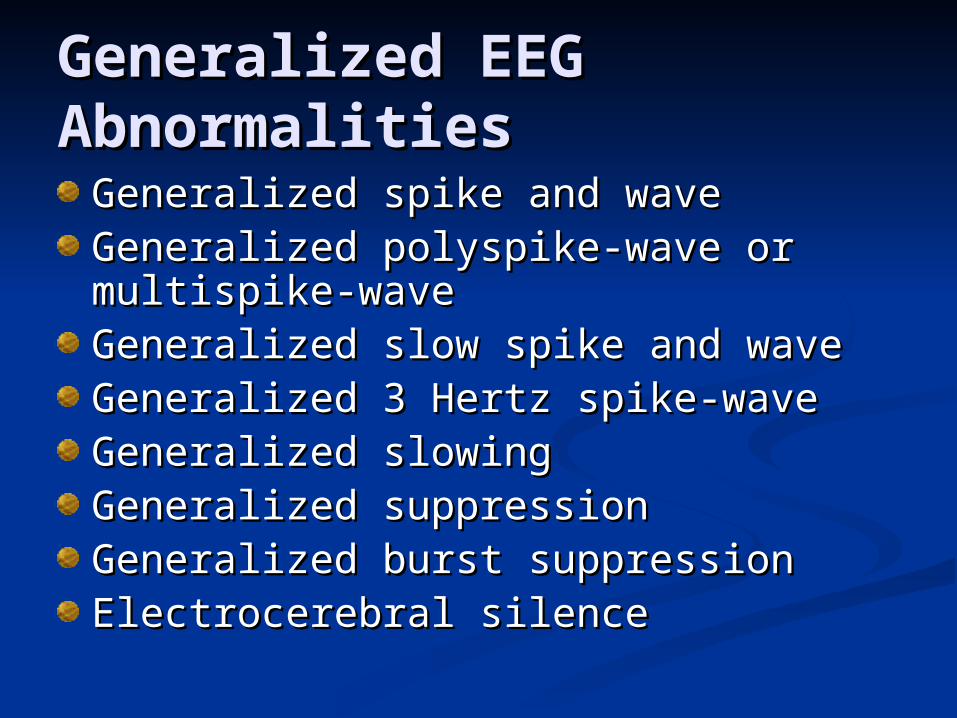
Generalized EEG Generalized EEG AbnormalitiesAbnormalities
Generalized spike and waveGeneralized spike and waveGeneralized polyspike-wave or Generalized polyspike-wave or multispike-wavemultispike-waveGeneralized slow spike and waveGeneralized slow spike and waveGeneralized 3 Hertz spike-waveGeneralized 3 Hertz spike-waveGeneralized slowingGeneralized slowingGeneralized suppressionGeneralized suppressionGeneralized burst suppressionGeneralized burst suppressionElectrocerebral silenceElectrocerebral silence

Generalized Spike-WaveGeneralized Spike-WaveFp1-F3
F3-C3
C3-P3
P3-O1
Fp2-F4
F4-C4
C4-P4
P4-O2
Fp1-F7
F7-T3
T3-T5
T5-O1
Fp2-F8
F8-T4
T4-T6
T6-O2
200 uV
1 sec
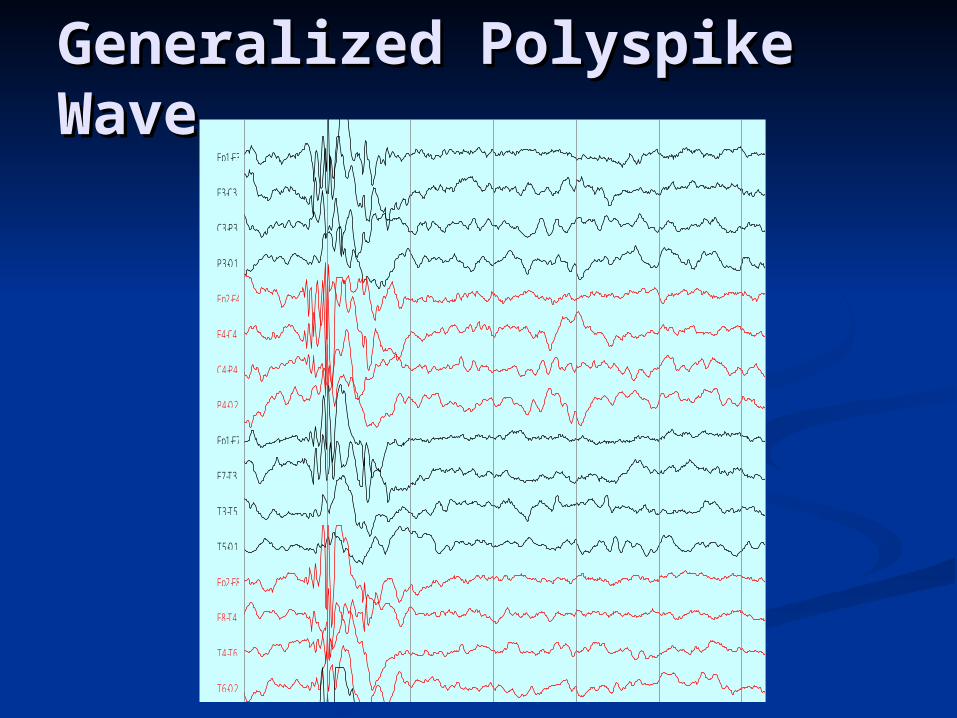
Generalized Polyspike Generalized Polyspike WaveWave
Fp1-F3
F3-C3
C3-P3
P3-O1
Fp2-F4
F4-C4
C4-P4
P4-O2
Fp1-F7
F7-T3
T3-T5
T5-O1
Fp2-F8
F8-T4
T4-T6
T6-O2
200 uV
1 sec

3 Hertz Spike and Wave3 Hertz Spike and Wave
Fp1-F3
F3-C3
C3-P3
P3-O1
Fp2-F4
F4-C4
C4-P4
P4-O2
1 sec 50 µV
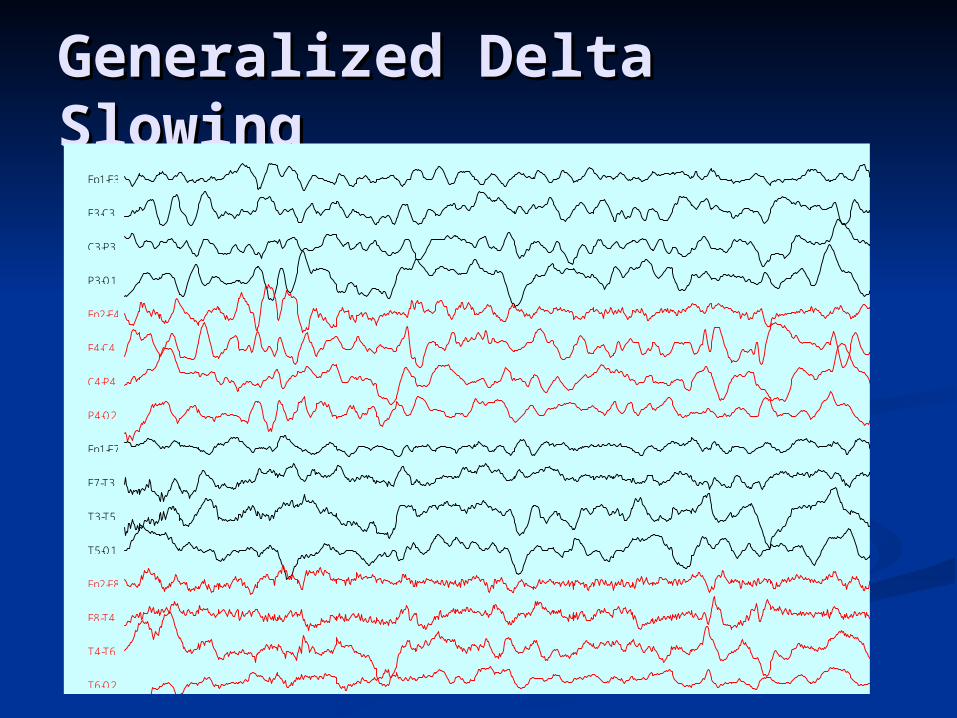
Generalized Delta Generalized Delta SlowingSlowing
Fp1-F3
F3-C3
C3-P3
P3-O1
Fp2-F4
F4-C4
C4-P4
P4-O2
Fp1-F7
F7-T3
T3-T5
T5-O1
Fp2-F8
F8-T4
T4-T6
T6-O2
200 uV
1 sec
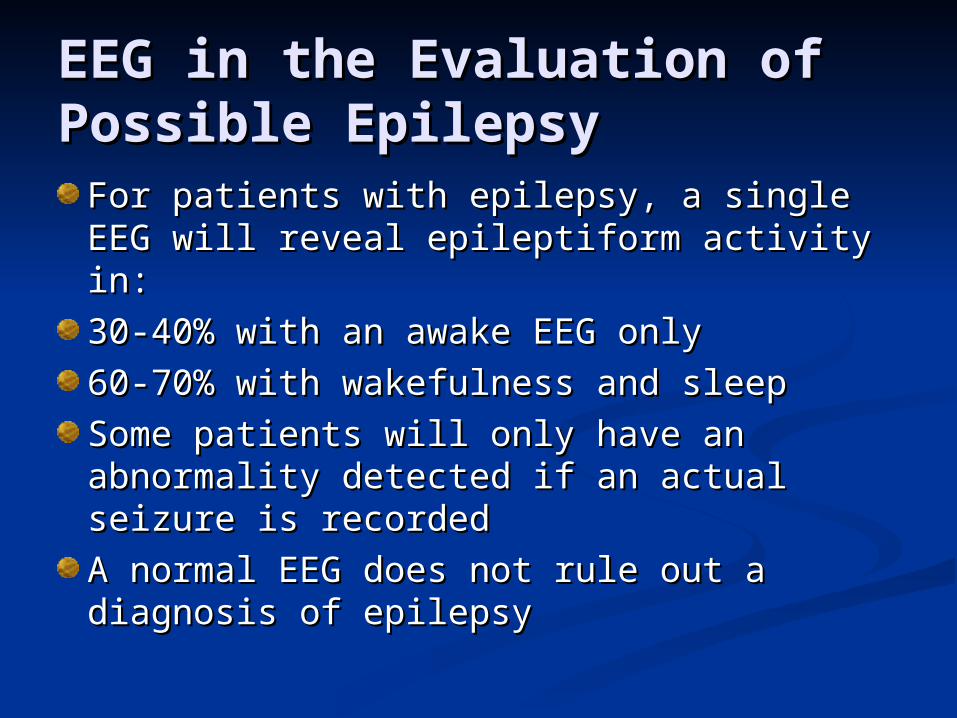
EEG in the Evaluation of EEG in the Evaluation of Possible EpilepsyPossible Epilepsy
For patients with epilepsy, a single EEG For patients with epilepsy, a single EEG will reveal epileptiform activity in:will reveal epileptiform activity in:
30-40% with an awake EEG only30-40% with an awake EEG only
60-70% with wakefulness and sleep60-70% with wakefulness and sleep
Some patients will only have an Some patients will only have an abnormality detected if an actual abnormality detected if an actual seizure is recordedseizure is recorded
A normal EEG does not rule out a A normal EEG does not rule out a diagnosis of epilepsydiagnosis of epilepsy

EEG Monitoring in EEG Monitoring in Critical CareCritical Care
Many patients with head injury, any form of Many patients with head injury, any form of encephalopathy, or severe illness are at risk encephalopathy, or severe illness are at risk for seizuresfor seizures
Patients who are mechanically ventilated are Patients who are mechanically ventilated are often sedated and pharmacologically paralyzed often sedated and pharmacologically paralyzed and seizures can only be diagnosed with EEGand seizures can only be diagnosed with EEG
The diagnosis of nonconvulsive status The diagnosis of nonconvulsive status epilepticus can only be detected and epilepticus can only be detected and monitored with EEGmonitored with EEG
Monitoring progression of coma and Monitoring progression of coma and potentially cerebral deathpotentially cerebral death

11 y/o boy with severe cardiomyopathy on ECMO following cardiac electromechanical disassociation
Fp1-F7
F7-T3
T3-T5
T5-O1
Fp2-F8
F8-T4
T4-T6
T6-O2
Fp1-F3
F3-C3
C3-P3
P3-O1
Fp2-F4
F4-C4
C4-P4
P4-O2
1 sec 50 µV

11 y/o boy with severe cardiomyopathy on ECMO with right temporal electrographic seizure
Fp1-F7
F7-T3
T3-T5
T5-O1
Fp2-F8
F8-T4
T4-T6
T6-O2
Fp1-F3
F3-C3
C3-P3
P3-O1
Fp2-F4
F4-C4
C4-P4
P4-O2
1 sec 50 µV

Focal Status EpilepticusFocal Status Epilepticus
Fp1-F7F7-T3T3-T5T5-O1Fp2-F8F8-T4T4-T6T6-O2Fp1-F3F3-C3C3-P3P3-O1Fp2-F4F4-C4C4-P4P4-O2
1 sec 50 µV
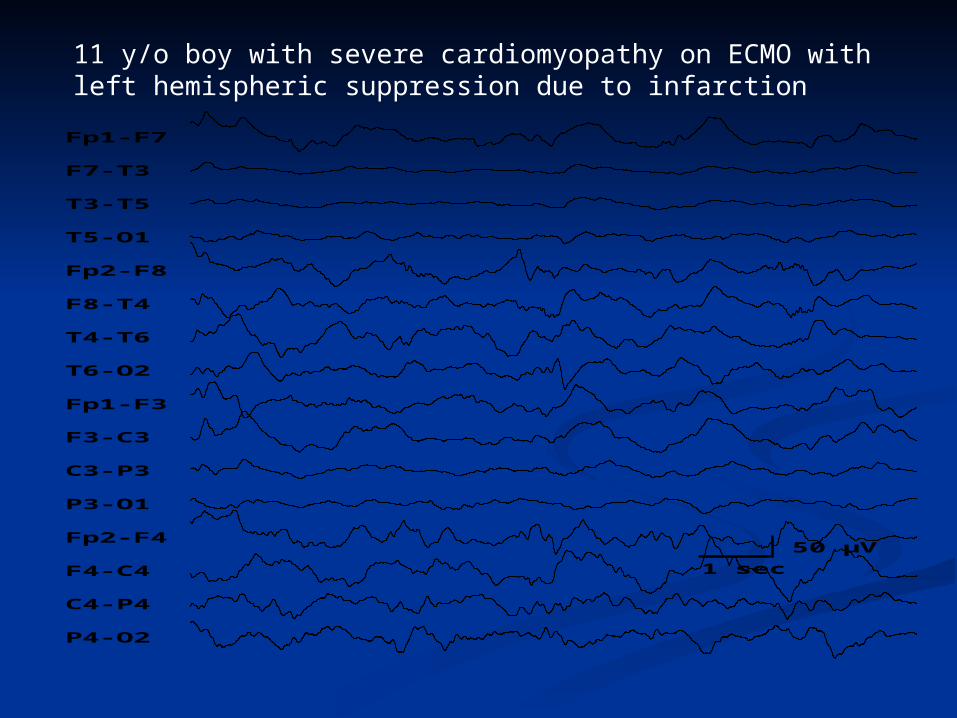
11 y/o boy with severe cardiomyopathy on ECMO with left hemispheric suppression due to infarction
Fp1-F7
F7-T3
T3-T5
T5-O1
Fp2-F8
F8-T4
T4-T6
T6-O2
Fp1-F3
F3-C3
C3-P3
P3-O1
Fp2-F4
F4-C4
C4-P4
P4-O2
1 sec 50 µV

EEG Monitoring and EEG Monitoring and Epilepsy SurgeryEpilepsy Surgery
20% of patients with epilepsy cannot 20% of patients with epilepsy cannot be controlled with medicationsbe controlled with medications
Focal onset seizures can sometimes Focal onset seizures can sometimes be selected and treated with surgical be selected and treated with surgical resection of the epileptogenic focusresection of the epileptogenic focus
Multiple methods are can be Multiple methods are can be employedemployed

Clinical CaseClinical Case8.5 year old boy with onset of seizures at age 78.5 year old boy with onset of seizures at age 7Seizures begin with a tingling sensation in the Seizures begin with a tingling sensation in the R hand followed by extension and posturing of R hand followed by extension and posturing of the R armthe R armSeizures were never completely controlled Seizures were never completely controlled with about 1 seizure per week for the first year with about 1 seizure per week for the first year December, 2001: Seizures began to December, 2001: Seizures began to dramatically increasedramatically increaseJanuary-March, 2002: Numerous seizures per January-March, 2002: Numerous seizures per day with up to 100 in a single day, and day with up to 100 in a single day, and episodes of status epilepticus lasting up to 1 episodes of status epilepticus lasting up to 1 hourhour

Typical SeizureTypical Seizure

EEG: Recorded SeizureEEG: Recorded Seizure
*Fp1-F3
*F3-C3
*C3-P3
*P3-O1
Fp2-F4
F4-C4
C4-P4
*P4-O21 sec
50 µV

*Fp1-F3
*F3-C3
*C3-P3
*P3-O1
Fp2-F4
F4-C4
C4-P4
*P4-O2
1 sec 50 µV

*Fp1-F3
*F3-C3
*C3-P3
*P3-O1
Fp2-F4
F4-C4
C4-P4
*P4-O2
1 sec 50 µV

MRI FindingsMRI Findings

3D-MRI Image3D-MRI Image

3D-MRI with Coronal Cut3D-MRI with Coronal Cut

Craniotomy with Lesion Craniotomy with Lesion LocalizationLocalization

Grid PlacementGrid Placement
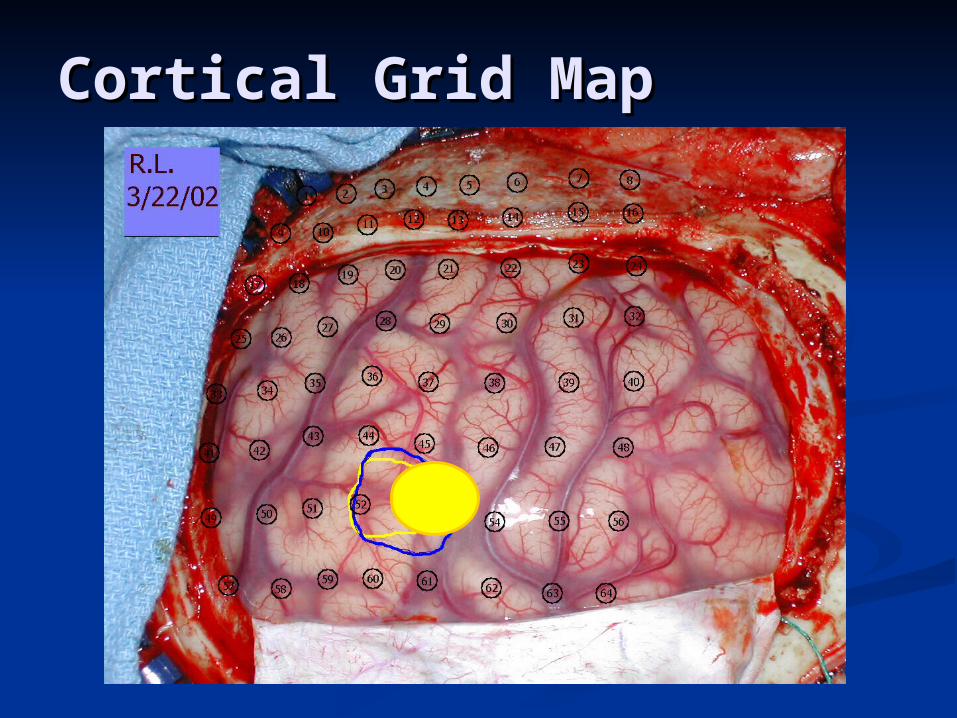
Cortical Grid MapCortical Grid Map

Craniotomy ClosureCraniotomy Closure
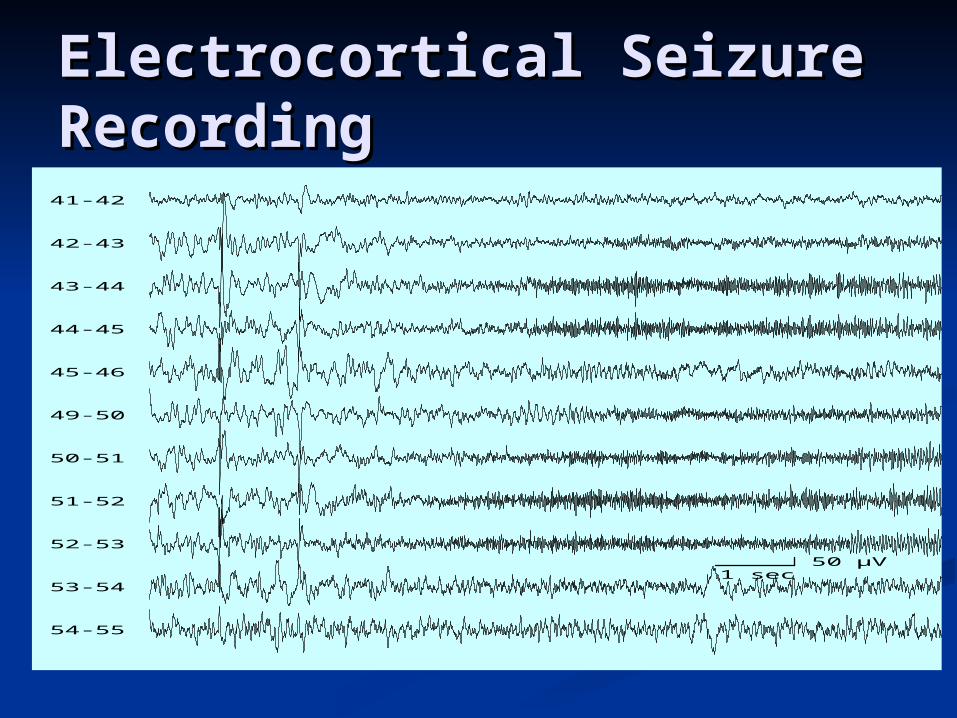
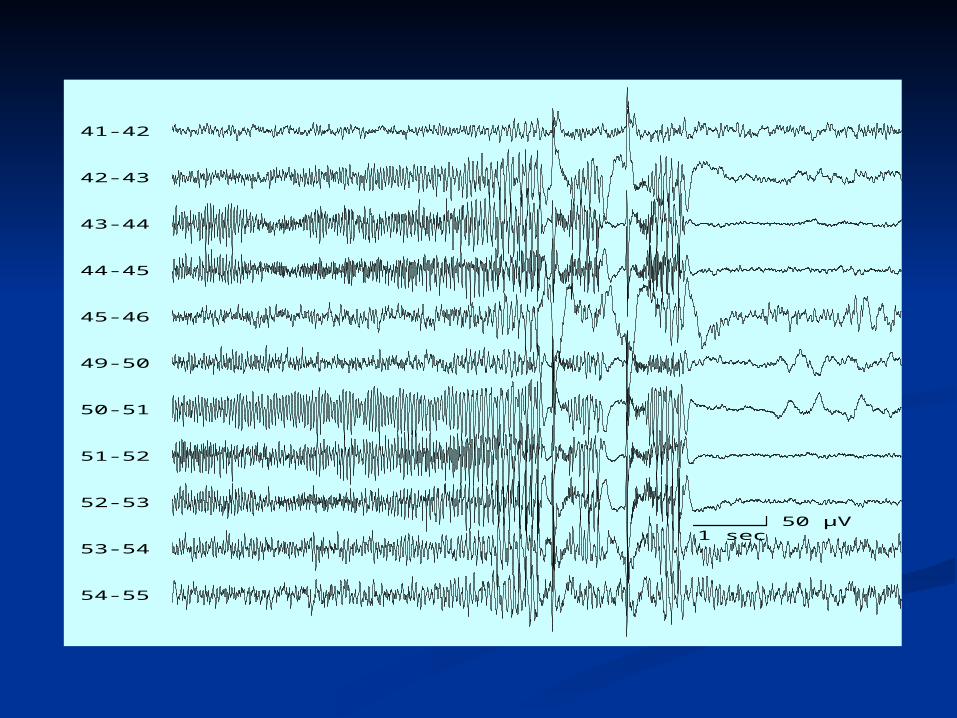
Electrocortical Seizure Electrocortical Seizure Recording Recording
41-42
42-43
43-44
44-45
45-46
49-50
50-51
51-52
52-53
53-54
54-55
1 sec 50 µV
41-42
42-43
43-44
44-45
45-46
49-50
50-51
51-52
52-53
53-54
54-55
1 sec 50 µV

41-42
42-43
43-44
44-45
45-46
49-50
50-51
51-52
52-53
53-54
54-55
1 sec 50 µV
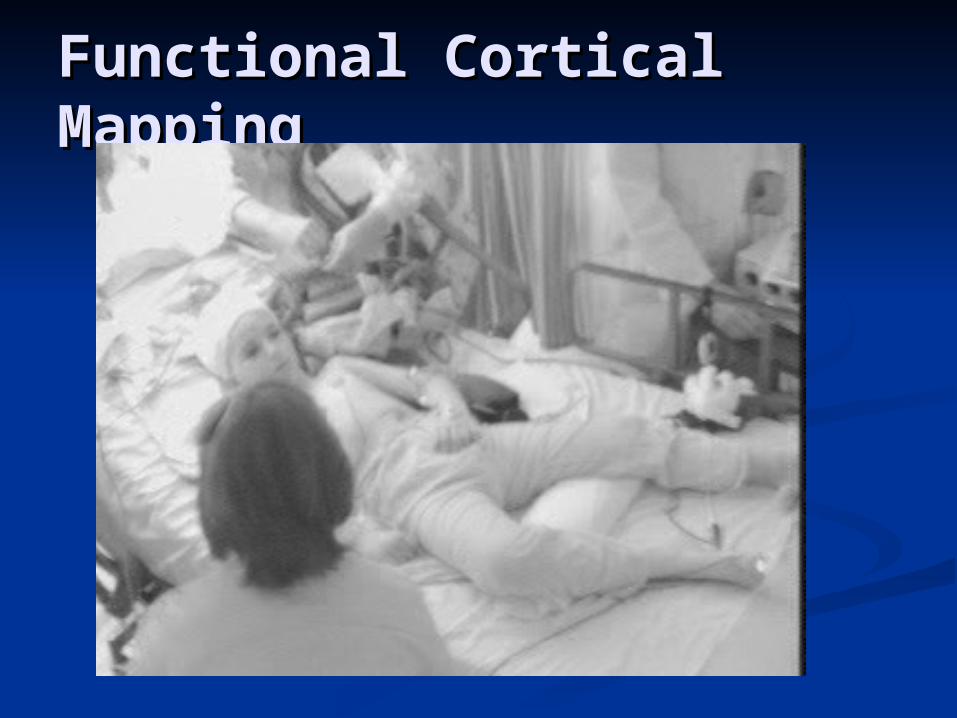
Functional Cortical Functional Cortical MappingMapping
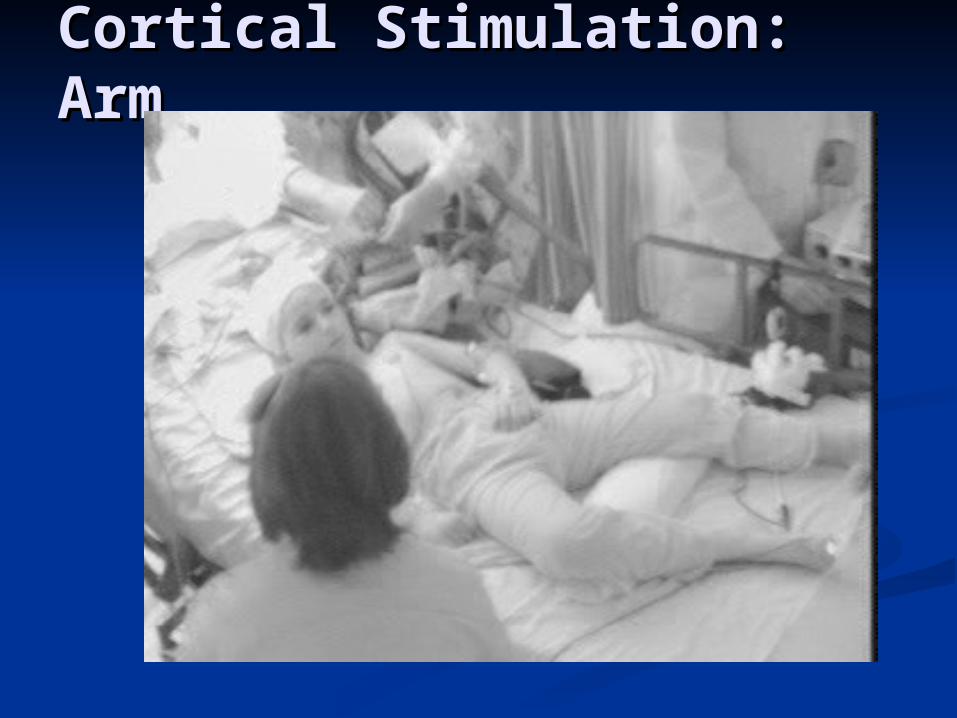
Cortical Stimulation: Cortical Stimulation: ArmArm

Functional Cortical MapFunctional Cortical Map

Cortical ResectionCortical Resection

Second Surgery: Stereotactic Lesion Second Surgery: Stereotactic Lesion
LocalizationLocalization
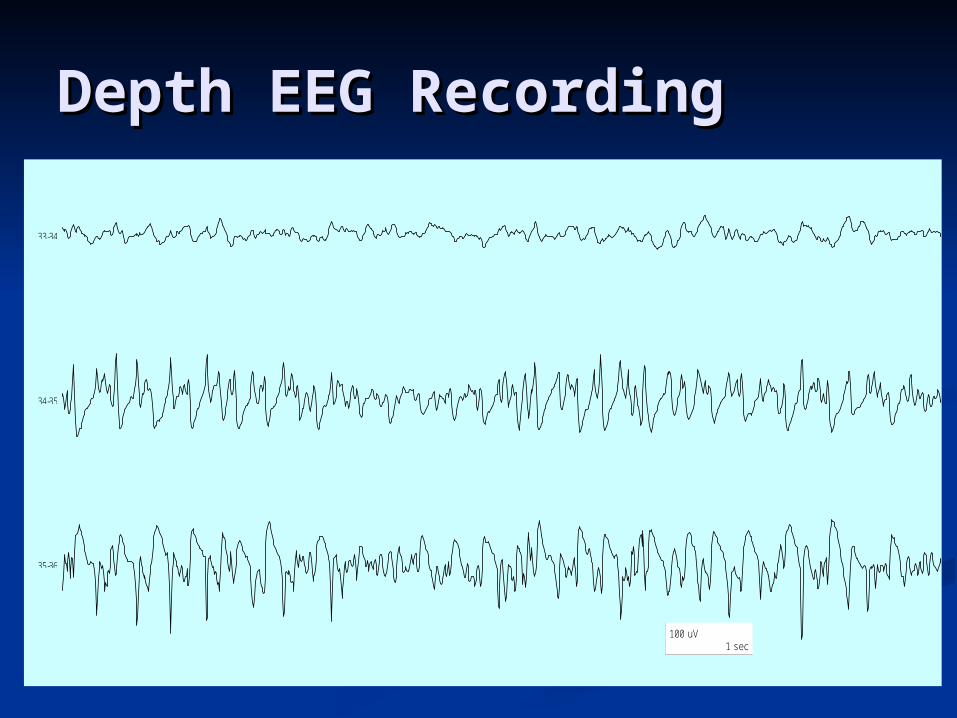
Depth EEG RecordingDepth EEG Recording
33-34
34-35
35-36
100 uV1 sec


OutcomeOutcome

FP1-F7
F7-T5
T5-O1
FP1-F3
F3-P3
P3-O1
Fp2-F4
F4-P4
P4-O2
Fp2-F8
F8-T6
T6-O2
1 sec 50 µV
2 month old with Enterococcal meningitis with anelectrographic seizure discharge, maximal right frontal