understanding driver anger and aggression: … · understanding driver anger and aggression:...
TRANSCRIPT

TSpace Research Repository tspace.library.utoronto.ca
Understanding driver anger and aggression: Attributional theory in the driving
environment
Wickens, C. M., Wiesenthal, D. L., Flora, D. B., & Flett, G. L.
Version Post-Print/Accepted Manuscript
Citation (published version)
Wickens, C. M., Wiesenthal, D. L., Flora, D. B., & Flett, G. L. (2011). Understanding driver anger and aggression: Attributional theory in the driving environment. Journal of Experimental Psychology: Applied, 17(4), 354-370, doi: https://dx.doi.org/10.1037/a0025815.
Publisher’s Statement This article may not exactly replicate the authoritative document published in the APA journal. It is not the copy of record.
How to cite TSpace items
Always cite the published version, so the author(s) will receive recognition through services that track citation counts, e.g. Scopus. If you need to cite the page number of the TSpace version (original manuscript or accepted manuscript) because you cannot access the published version, then cite the TSpace version in addition to the published version using the permanent URI (handle) found on the record page.

Attributional Theory 1
Running head: ATTRIBUTIONAL THEORY IN THE DRIVING ENVIRONMENT
Understanding Driver Anger and Aggression: Attributional Theory in the Driving Environment
Christine M. Wickens, David L. Wiesenthal, David B. Flora, & Gordon L. Flett
York University
Author Note
Christine M. Wickens, David L. Wiesenthal, David B. Flora, Gordon L. Flett,
Department of Psychology, York University.
Christine M. Wickens is now at the Social and Epidemiological Research Department,
Centre for Addiction and Mental Health.
This research was supported by an Ontario Graduate Scholarship, a Social Sciences and
Humanities Research Council of Canada Doctoral Fellowship, and a Canadian Transportation
Research Forum Student Scholarship awarded to Dr. Wickens. This manuscript is based on
research conducted by Dr. Wickens in partial fulfillment of the PhD requirements of York
University. The authors wish to thank Professor C. Ward Struthers whose guidance in the
development of the research contributed significantly to its success. The authors would also like
to thank Amanda Near and Anabel Maldonado for their assistance with data entry.
Correspondence concerning this article should be addressed to Christine M. Wickens,
Centre for Addiction and Mental Health, 33 Russell Street, Toronto, Ontario, M5S 2S1, Canada.
Email: [email protected]
Attributional Theory 2
Abstract
Two studies tested the applicability of Weiner’s (1995, 1996, 2001, 2006) attributional model of
social conduct to roadway environments. This model highlights the role of inferences of
responsibility after making causal judgments for social transgressions. Study 1 employed written
scenarios where participants were asked to imagine themselves driving on a major highway. The
degree of controllability and intentionality of the driving act was manipulated experimentally by
altering the specific event-related details provided to the participants. Study 2 extended this
research to life events by having participants complete on-line driving diaries every 2 days,
identifying their most negative/upsetting encounter with another motorist. The most anger-
provoking event was selected from among 4 diary entries and participants were asked to respond
to a questionnaire similar to that used in Study 1. Path analyses in both studies generally
supported predictions derived from Weiner’s model; the association between perceived
controllability, intentionality, and dispositional locus of causality of the negative driving event
and subsequent anger was mediated by perceptions of responsibility. Additional results in Study
2 suggested that low perceived controllability, intentionality, and dispositional locus of causality
were associated with reduced perceived responsibility, which, in turn, facilitated feelings of
sympathy. Anger was associated with aggressive responses to the offending driver, whereas
sympathy was associated with prosocial responses. Recommendations were offered for improved
driver safety, including the development of attributional retraining programs to combat self-
serving attributional biases, teaching novice drivers about both formal and informal roadway
communication, and the promotion of forgiveness among drivers.

Attributional Theory 3
Understanding Driver Anger and Aggression:
Attributional Theory in the Driving Environment
One of the primary contributing factors to motor vehicle collisions is aggressive driving
behavior (Lawton, Parker, Stradling, & Manstead, 1997; Wells-Parker et al., 2002), which
includes various dangerous driving actions such as tailgating, cutting off other vehicles, and
speeding. According to statements given at the U.S. Congress at a hearing of the Committee on
Transportation and Infrastructure in 1997, aggressive driving was estimated to be involved in
50% of all motor vehicle collisions (Snyder, 1997), one third of all personal injuries, and two
thirds of all fatalities resulting from motor vehicle crashes (Martinez, 1997).
Although factors internal to the aggressive driver have been found to contribute to
aggressive driving behavior, including personality variables (Lajunen & Parker, 2001; Lawton et
al., 1997), mood (Arnett, Offer, & Fine, 1997), and the experience of stress (Hennessy &
Wiesenthal, 1999, 2001), there is often a precipitating driving event that elicits aggressive
behavior. Much aggressive driving displayed on the roadways is the result of driver anger and
retaliation for a perceived driving offense (Hennessy & Wiesenthal, 2002; Neighbors, Vietor, &
Knee, 2002; Parker, Lajunen, & Summala, 2002; Wickens, Wiesenthal, Hall, & Roseborough,
2011; Wickens, Wiesenthal, & Rippey, 2005). Theories of attribution may provide some insight
regarding aspects of driver behavior or the roadway environment that elicit aggression and
minimize feelings of sympathy and compassion. Attributions emphasizing the responsibility of
others and not the self play a role in anger and aggressive driving behaviors, which may be
explained by Weiner’s attribution model and its recent extension to social motivation and moral
emotions reflecting sympathy for others (see Weiner, 1995, 1996, 2001, 2006).
Theories of Attribution and Driving

Attributional Theory 4
Theories of attribution depict the process by which individuals explain the events around
them, traditionally focusing on perceived causality of behaviors and events (Fincham & Jaspars,
1980). These theories have provided highly similar, yet distinct, explanations for the process of
attribution (e.g., Heider, 1944, 1958; Jones & Davis, 1966; Kelley, 1967). As these theories have
developed, they have been extended to include subsequent emotions and behaviors resulting
from specific attributions made (e.g., Feather, 1996, 1999; Fincham & Roberts, 1985; Shaver,
1985; Shultz & Darley, 1991). In an early application of attributional theory, Knapper and
Cropley (1978, 1981) recognized that imputed inferences and perceptions about offensive drivers
were primary determinants of affective and behavioral responses.
Feather and Deverson (2000) examined the impact of responsibility judgments on
feelings related to punishment using written scenarios that manipulated elements of the driving
context (the gender of the offending driver, the presence or absence of mitigating circumstances,
and the moral worth of the offending motorist) but that ended with the same punishment.
Participants’ ratings of the offending motorist’s responsibility for the punishment (and
presumably for the collision) were related to ratings of the deservingness and perceived
harshness of the penalty, which influenced affective reactions to the perpetrator.
Britt and Garrity (2006) asked drivers to recall when they had experienced specific anger-
provoking events. The events included being tailgated, being cut off and forced to brake, and
being stuck behind a slow driver in the passing lane. Participants then responded to questions
regarding their attributions, emotions, and behaviors in response to each event. The attributional
items were taken from Fincham and Bradbury’s (1992) model and included causal attributions of
locus (the cause rests with something about the actor), stability (the cause for the actor’s
behavior is not likely to change in the future), and globality (the reason for the actor’s behavior
Attributional Theory 5
pervades across other areas of his or her life). Overall, Britt and Garrity (2006) found that
stability was the most effective causal dimension as it significantly predicted anger and
aggression in all driving scenarios. Locus and globality failed to predict anger or aggressive
behavior in any of the scenarios. Blame attributions were important for both anger and
aggression in the tailgating scenario. Hostile attributions played a role in the anger and
aggression responses to the slow driver scenario and the anger response to the cut-off scenario.
Taken as a whole, these results highlight the importance of attributional theory to the study of
driver anger and aggression.
The Current Study
Thus far, researchers have focused on various components of these extended attributional
models, including examinations of the operation of diverse variables determining causal
attributions and judgments of responsibility (e.g., Arkkelin, Oakley, & Mynatt, 1979; McKillip
& Posavac, 1975), how these causal attributions and responsibility judgments predict emotion
(e.g., Britt & Garrity, 2006; Feather & Deverson, 2000) and aggressive behavior (e.g., Britt &
Garrity, 2006), and how anger is a necessary precursor to aggression (e.g., Neighbors et al.,
2002; Nesbit, Conger, & Conger, 2007; Parker et al., 2002). Yet there has been very little
research that has assessed how all of these components function together in the context of
driving. Application and assessment of a full attributional model to driver behavior would
address this issue.
One attributional model that might be particularly relevant to the driving context is
Weiner’s (1995, 1996, 2001, 2006) attributional theory of social conduct, which is one of the
most all-encompassing attributional models. The application of this model to social
transgressions involves making an inference of responsibility after the transgressor has engaged

Attributional Theory 6
in behavior that is perceived as reflecting internal and controllable causes stemming from the
transgressor (see Weiner, 2001). Although Weiner’s model has been applied to a wide variety of
specific contexts, the general theory posits that attribution includes cognitive, affective, and
behavioral components. The cognitive elements are described as determinants of affective
responses, while affective responses are depicted as determinants of behavioral responses.
In the case of an individual who experiences a personal transgression, the victim will
seek to determine the cause of that infraction. Within the cognitive stage of the process, the
victim will assess various dimensions of the perceived cause of the transgression, forming the
basis for a subsequent judgment or inference of the transgressor’s responsibility for the harmful
act (see Weiner, 2001). Responsibility, in turn, contributes to negative emotions such as feelings
of anger. Although Weiner (2001) did not explicitly identify responsibility as a mediator, it is
indicated clearly in this framework that the inference of responsibility follows attributional
processing and judgments. As seen in Figure 1, Weiner (1979, 1985, 1995, 1996, 2001, 2006)
has identified several causal dimensions including controllability, intentionality, locus of
causality, stability, and globality. In applying the theory to a specific content domain, most
researchers have focused on a subset of only two or three of these dimensions. Controllability of
the event addresses whether the harmful act was under the transgressor’s control or whether it
was a preventable event. Intentionality speaks to whether or not the transgressor’s actions were
deliberate or inadvertent. Locus of causality reflects whether the harmful act was caused by
something internal versus external to the transgressor. The stability dimension defines the cause
as variant or invariant over time. Finally, the globality dimension is similar to stability; however,
where stability examines temporal generalization, globality examines stimulus generalization.
Using these dimensions, the victim will make a judgment of responsibility. Greater perceptions

Attributional Theory 7
of controllability, intentionality, stability, and globality, and a stronger perception of internal or
dispositional locus of causality, will lead the victim to judge the transgressor as responsible for
the harmful act.
In the subsequent affective stage of the attribution process, a judgment of responsibility
will evoke feelings of anger, whereas a judgment of minimal responsibility will evoke feelings of
sympathy or concern for the transgressor (Weiner, 2001). In the behavior stage of the process,
anger can motivate an aggressive reaction to the harmful act, whereas sympathy or concern can
motivate prosocial behavior. In addition, Weiner’s model has also been extended to include an
inhibitory process whereby anger can inhibit prosocial behavior, and sympathy can inhibit
aggressive behavior; however, this secondary process will not be assessed in the current study.
Weiner’s (1995, 1996, 2001, 2006) attributional model has been used to promote more
positive emotional and behavioral reactions to interpersonal transgressions (Struthers, Dupuis, &
Eaton, 2005), victims of natural disasters (Marjanovic, Greenglass, Struthers, & Faye, 2009), and
stigmatized persons (Weiner, Perry, & Magnusson, 1988). Yet despite its clear relevance, the
model has seldom been examined in traffic psychology. A simpler version of this model that
included only measures of intentionality, anger, and aggressive behavior was successfully
applied to the driving context using a scenario-based self-report study (Vallières, Bergeron, &
Vallerand, 2005). This study did not examine other causal dimensions, the responsibility
judgment, or positive emotions and behaviors, all of which are important components of
Weiner’s model. Even independently, some of these missing constructs may prove valuable in
the study of driver behavior, yet they have been virtually ignored in the driving literature. For
instance, although positive encounters may be less frequent in the roadway environment than
negative encounters, or at least less frequently recalled due to an availability heuristic (Tversky
Attributional Theory 8
& Kahneman, 1974), the model could suggest ways to increase the frequency of positive
roadway behavior.
To our knowledge, the current work represents the first attempt to apply Weiner’s (1995,
1996, 2001, 2006) attributional model, in its entirety, to transgressions in driver behavior.
Included in this research purpose was an assessment of perceived responsibility as a mediator of
the relationship between causal attributions and driver emotions, which has not been investigated
in the few previous studies of attributions and driving. The study also included an assessment of
how attributional theory can account for positive emotions and behaviors in the driving context,
which has also been neglected by prior applications of attributional theory to the roadway
environment. Study 1 employed a laboratory-based methodology, whereas Study 2 used the
recall of an anger-provoking situation experienced by a sample of drivers. It was hypothesized
that the model could account for the various constructs, with the possible exception of the
positive emotion and behavior components (see Figure 1).
Study 1
The use of fictional or hypothetical scenarios presented through either the printed word or
audio playback has been the most commonly used method in driver-attribution research (e.g.,
Arkkelin et al., 1979; Feather & Deverson, 2000; Vallières et al., 2005). Scenarios allow the
maximum range of attributional, emotional, and behavioral responses to be studied. When
initiating a new line of research, it is important to understand the range of possible responses
before narrowing focus on any particular issue. Thus, the first study was designed to examine
Weiner’s model (1995, 1996, 2001, 2006) across all levels of causal attribution. A scenario was
constructed involving a driver being cut off on the highway. The cutoff scenario was chosen
since it has been identified as the most potentially anger-provoking driver offense (Britt &
Attributional Theory 9
Garrity, 2006; Wickens et al., 2005, 2011). Two of the five causal dimensions in Weiner’s model
(i.e., controllability and intentionality) were selected for experimental manipulation as a single
study cannot examine all causal dimensions. In previous applications of Weiner’s model, the
dimensions of controllability and intentionality were the most frequently used across situational
domains, and Weiner (2001) emphasized the role of intention and controllability judgments in
determining responsibility for social transgressions. Although Weiner (1995, 1996) makes
distinctions among the causal dimensions and provides examples when the presence of one
dimension can occur in the absence of another, it is often common for these attributions to be
positively correlated (Anderson, 1983), perhaps because it is difficult for perceivers to
differentiate these concepts. Nonetheless, it is likely that a full range of scores in one causal
dimension (e.g., controllability) will be reflected by a full range of scores in the other dimensions
(e.g., locus of causality). These causal dimensions were manipulated by altering the situational
information about the cutoff behavior.
All causal dimensions were expected to be positively correlated. Even in the case of
controllability and intentionality, where the presence and absence of these dimensions were
systematically controlled and fully balanced, a positive correlation was anticipated due to fine
distinctions that might be difficult to make. More attributions of controllability, intentionality,
stability, and globality, and a more person-focused locus of causality, were expected to be
associated with stronger judgments of responsibility. Greater perceived responsibility was
expected to predict more anger and less sympathy toward the driver. Anger was hypothesized to
predict greater anticipated aggressive responding, and sympathy was expected to predict more
anticipated prosocial responding. In addition, negative correlations between anger and sympathy
and between aggressive and prosocial behavior were anticipated.
Attributional Theory 10
Method
Participants
Participants were undergraduate students at a large, urban Canadian university. A total of
240 participants completed the study; however, two surveys were spoiled and 22 participants
lacking driver’s licenses were excluded. The remaining sample consisted of 64 men and 152
women. The mean age of participants was 22.10 years (SD = 4.07), and participants reported
having possessed a driver’s licence for a mean of 5.06 years (SD = 3.96) and driving a mean of
4.05 days per week (SD = 2.47).
Measures and procedures
A 2 2 (two levels of controllability by two levels of intentionality) between-subjects
design was employed, where participants were asked to read a written driving scenario and to
imagine themselves experiencing the situation. In each condition, the main story line was the
same. Participants were asked to imagine that they were travelling in the center lane of a multi-
lane highway. In their rearview mirror, and then their left side-view mirror, they notice another
vehicle slowly overtaking them in the passing lane. When the vehicle finally overtakes them in
the left lane, the driver of this vehicle suddenly pulls in front of them, cutting them off and
forcing them to suddenly brake.
The situational context of this negative driving incident was experimentally manipulated
to suggest the presence or absence of controllability and the presence or absence of
intentionality. In a fully-crossed research design, participants were randomly assigned to one of
four conditions (i.e., controllability – intentionality [C-I], controllability – no intentionality [C-
NI], no controllability – intentionality [NC-I], no controllability - no intentionality [NC-NI]). In
the C-I condition, participants were told only that the other driver signalled once just as the
Attributional Theory 11
vehicle pulled directly in front of them. In the C-NI condition, participants were told that there
was a construction sign indicating that the left lane would end. Just as they both came over the
crest of a hill, the left lane ended and the other driver suddenly pulled in front of them. In the
NC-I condition, participants were told that they both came over the crest of a hill and suddenly a
pothole was visible in the left lane. The other driver suddenly pulled directly in front of them.
Finally, in the NC-NI condition, participants were told that the other vehicle’s rear right tire
suddenly blew out and the driver pulled directly in front of them.
After reading and imagining themselves in the assigned driving scenario, participants
responded to questions regarding causal dimensions, judgment of responsibility, and anticipated
emotions and behaviors. The causal dimensions included in the questionnaire were
controllability, intentionality, locus of causality, stability, and globality. Controllability and
intentionality items also served as a manipulation check. Anticipated emotions included anger
and sympathy/concern, and the anticipated behaviors included aggressive behavioral responses
and prosocial behavioral responses. All questionnaire items were designed specifically for the
current study. Respondents rated each item on a 7-point scale. Labels for scale anchor points
varied across the items. Given the exploratory nature of the research, aggressive behavior items
incorporated a full range of possible aggressive driver responses, including more minor
expressions (e.g., yelling at the other driver) as well as more extreme aggressive episodes (e.g.,
getting out of the vehicle ready to engage physically with the other driver). Previous research has
tended to focus on less aggressive responding (e.g., Britt & Garrity, 2006), as more extreme
forms of aggression are rarely reported.

Attributional Theory 12
Results
Exploratory factor analysis and reliability assessment
A series of exploratory factor analyses was conducted to explore the dimensional
structure of the questionnaire. A limitation of this type of analysis is that it is data-driven as
opposed to theory-driven, but this is a necessary and acceptable approach when developing a
questionnaire for a novel line of research. The items were divided into manipulated and
unmanipulated causal dimensions, causal judgment, emotions, and behaviors, as dictated by the
proposed attributional model. Ordinary least squares estimation was used, and because factors
were expected to be highly correlated, a promax rotation was applied.
Based on scree plots and parallel analyses, three of the factor analyses confirmed the
hypothesized number of factors (i.e., two factors for manipulated causal dimensions [interfactor
correlation = .50; see Table 1], one factor for causal judgement [see Table 2], and two factors for
emotions [interfactor correlation = -.51; see Table 3]). Focusing on the unmanipulated causal
dimensions, the locus of causality, stability, and globality items all loaded onto the same factor.
Given the important theoretical distinctions between them, the weaker stability and globality
items were deleted from further analysis, which resulted in the emergence of a single factor (see
Table 4). In terms of the behavioral items, the factor analysis identified distinctions between
minor aggressive behaviors (e.g., yelling, gesturing), major aggressive behaviors (e.g., getting
out of your vehicle to physically engage the other driver), and prosocial behaviors (e.g., offer
assistance to the other driver if it is needed further down the road). The major aggressive
behavior items were highly skewed and comprised most univariate outliers noted during the
screening of the data. As most participants indicated minimal likelihood of engaging in these
more extreme forms of aggressive responding, these items were eliminated from the analysis,

Attributional Theory 13
leaving the less extreme aggressive behaviors and the prosocial behaviors (interfactor correlation
= -.21; see Table 5). One of the prosocial behavior items (i.e., “How likely is it that you would
gesture/signal to the other driver that everything is okay?”) had a pattern coefficient of only .25.
Although it could be argued that this low value might have warranted removing the item from
the scale, it taps an important theoretical concept and was thus retained.
As expected, all bivariate correlations between factors were statistically significant (p <
.01) in the expected direction, ranging from -.22 to .79 (see Table 6). The internal consistency of
the scales constructed based on the factor analysis was assessed using coefficient alpha. As seen
in Table 6, a majority of reliability estimates were well above the recommended minimum of .70
for exploratory research (Nunnally & Bernstein, 1994).
Manipulation check
Two two-way ANOVAs assessed the effectiveness of the experimental manipulation.
The presence versus absence of control and intent served as the independent variables, while
controllability scores and intentionality scores were dependent variables (see Figure 2).
The ANOVA of controllability scores revealed a significant main effect for the presence
versus absence of control, F(1,212) = 116.89, p < .01, η2 = .36, and a significant main effect for
the presence versus absence of intent, F(1,212) = 10.27, p < .01, η2 = .05. It also resulted in a
significant interaction effect, F(1,212) = 7.30, p < .01, η2 = .03. The ANOVA of intentionality
scores revealed a significant main effect for the presence versus absence of intent, F(1,212) =
28.41, p < .01, η2 = .12, and a significant main effect for the presence versus absence of control,
F(1,212) = 33.07, p < .01, η2 = .14. It also resulted in a significant interaction effect, F(1,212) =
10.15, p < .01, η2 = .05. The main effect of the presence or absence of control for the
controllability scores and the main effect of the presence or absence of intent for the

Attributional Theory 14
intentionality scores were consistent with predictions. The interaction effects were not
unexpected, as these causal dimensions might be assumed by perceivers to co-occur, resulting in
the presence of only one dimension producing attributions of the other dimension. For instance,
in the absence of control, the NC-I group reported higher controllability scores than the NC-NI
group (see Figure 2). However, when focusing on the intentionality scores, the NC-I group
reported similar intentionality scores to both intent-absent groups (NC-NI and C-NI), suggesting
that the NC-I manipulation may not have been successful in its implication of the presence of
intent.
Path Analysis
Path analysis, a type of structural equation modeling that involves only observed
variables, was used to allow simultaneous estimation of all hypothetical relationships in
Weiner’s (1995, 1996, 2001, 2006) model, which is more efficient than conducting a series of
separate regression analyses and allows for comprehensive assessment of overall model fit (see
Kline, 2005). Mardia’s measure of multivariate kurtosis was 7.66, indicating moderate levels of
non-normality (Mardia, 1970). Hence, the path analysis was conducted using maximum
likelihood estimation with the Satorra-Bentler corrected model fit statistics and robust standard
errors (Satorra & Bentler, 1994, 2001) as implemented with Mplus 5.2. Only two cases with
missing data were deleted listwise. The proposed model was estimated along with several direct
paths that were expected to be mediated fully by one other variable in the model. For instance,
anger was regressed onto controllability, locus of causality, and intentionality, although full
mediation through responsibility was expected to make these paths nonsignificant.
Nonsignificant paths not part of Weiner’s model were deleted in a step-by-step fashion,

Attributional Theory 15
proceeding from the smallest to the largest nonsignificant values. This systematic process
allowed for more thorough testing of mediation and improved model parsimony.
With all direct paths included, the chi-square test for the initial model was significant,
χ2(8) = 28.90, p < .01; however, this test is overly sensitive to both correlation magnitude and
sample size (Kline, 2005). The model fit was adequate based on the values of the CFI (.97) and
the SRMR (.03), although the RMSEA (.11) was indicative of poor fit (e.g., MacCallum,
Browne, & Sugawara, 1996). For the final model with nonsignificant direct paths removed (see
Figure 3, which includes standardized path estimates), the RMSEA (.10) improved slightly,
indicating mediocre fit, whereas the other fit indices were virtually identical to the initial model,
χ2(11) = 32.99, p < .01, CFI = .96, SRMR = .04. The step-by-step deletion of nonsignificant
paths mediated by one other variable led to the deletion of three direct paths; however,
responsibility did not fully mediate the relationships between the causal dimensions of
intentionality and locus of causality and anger, nor did responsibility fully mediate the
relationship between the three causal dimensions and sympathy. Neither the hypothesized
relationship between responsibility and sympathy nor the residual correlation between aggressive
and prosocial behavior were significant. Because these non-significant paths were hypothesized
relationships, they were retained in the final model.
In light of the finding that responsibility did not fully mediate the relationship between
the causal dimensions of intentionality and locus of causality and the anger emotion, partial
mediation was tested using the product of z-score approach in the Prodclin2 software
(MacKinnon, Fritz, Williams, & Lockwood, 2007). This method produces a 95% confidence
interval for the mediated effect, which indicates mediation at a .05 level of significance if the
confidence interval does not include zero. Results of these mediation tests revealed that
Attributional Theory 16
responsibility partially mediated the relationship between the causal dimensions of intentionality
and locus of causality and the anger outcome. Responsibility did not mediate the relationship
between any of the causal dimensions and the sympathy outcome.
Overall, squared multiple correlations (R2) indicated that the model accounted for 69% of
the variance in responsibility, 44% of the variance in sympathy, 41% of the variance in anger,
40% of the variance in aggressive behavior, and 28% of the variance in prosocial behavior.
Gender differences on the primary variables of interest were assessed, but none were found.
The model also could be estimated using the manipulated variables of controllability and
intentionality (i.e., membership in the controllability vs. no-controllability group and
membership in the intentionality vs. no-intentionality group); however, in light of the possibly
unsuccessful manipulation of intentionality in the NC-I scenario, the path analysis using the
continuous ratings of these constructs was preferred. The alternative model also fit the data well,
χ2(12) = 19.48, p = .08, CFI = .99, RMSEA = .05, SRMR = .04, and was highly consistent with
the Study 1 model, producing only a few differences. Specifically, the relationship between
intentionality and responsibility was not significant (standardized path coefficient b* = .03, p =
.53). The relationship between responsibility and sympathy was significant (b* = -.23, p < .01),
and responsibility partially mediated the relationship between both controllability and locus of
causality and sympathy (b* = -.24, p < .01 and b* = -.28, p < .01, respectively).
Discussion
Although the majority of factors and their relevant factor loadings were as expected, a
few changes to the scales were required. The factor analysis of unmanipulated causal dimensions
identified the need to remove stability and globality items from the analysis. Although clear
theoretical distinctions between these constructs and locus of causality can be made, the

Attributional Theory 17
statistical differences between the constructs within the current scenario were minimal. As
previous research using these constructs has clearly demonstrated (Britt & Garrity, 2006; Islam
& Hewstone, 1993; Weiner, Russell, & Lerman, 1978), these causal dimensions and the
distinctions between them are important to attributional theory. Still, not all types of attributions
will be important in all situations. Britt and Garrity (2006) found that different types of causal
attribution were more influential in certain types of driving offenses. In their assessment, hostile
and blame attributions differentially predicted anger and aggression depending on the specific
driving incident in question (tailgating, cut-off, or slow driver). Attributions of stability
accounted for unique variance in all driving scenarios, whereas locus and globality attributions
failed to account for any unique variance in any driving scenario.
It may be necessary for researchers to identify and focus on those attributional constructs
that they think are most relevant to the topic of study. In driver psychology, it might be suggested
that stability and globality are not particularly relevant, as they both address aspects of
consistency. Stability addresses temporal consistency, asking whether the abusive motorist drives
offensively all the time. Globality addresses situational consistency, asking whether the abusive
motorist behaves offensively in other areas of his or her life. Yet we are unlikely to encounter an
offensive driver on or off the road following the negative event. Thus, it may be more relevant to
consider the dimensions of controllability, intentionality, and locus of causality. As well,
globality may not be easily translated into a causal dimension that has explanatory power for the
driving context. It may be that the perception of situational consistency is better conceptualized
as a temperament or personality characteristic on the part of the victim driver, taking the form of
pessimism, cynicism, or attributional style.
Attributional Theory 18
Regardless of which causal dimensions are most relevant to the driving context, because
they are all conceptually similar, it is likely that they account for common variance in driver
anger and aggression. If controllability and intentionality had been included in Britt and Garrity’s
(2006) study, then perhaps stability would not have been such a strong predictor across all
scenarios. The inclusion of intentionality might also have altered the amount of variance
accounted for by hostile attributions. These considerations highlight the importance of basing
empirical driving-related research on established attributional theory and giving serious thought
to how each of its components might best be applied to driver psychology. As expected, the
results of the exploratory factor analysis also indicated the need to eliminate the most extreme
aggressive behavior items, as very few participants reported any anticipation of engaging in these
behaviors, leading to strongly positively skewed distributions. Although exploratory factor
analysis is a necessary method in developing a novel line of research, further study is needed to
cross-validate exploratory scale construction.
The manipulation check confirmed that perceived controllability was greater in the
control-present driving scenarios than in the control-absent driving scenarios, and that perceived
intentionality was greater in the intention-present versus intention-absent scenarios. On the other
hand, a comparison of the intentionality scores for the NC-I group to the intent-absent groups
(NC-NI and C-NI) revealed no differences in perceived intentionality, suggesting that the
manipulation may not have been entirely successful for that condition. It could be argued that the
intentionality score for the NC-I group might be expected to be slightly less than the
intentionality score of the C-I group, as the situation described in this scenario is more
ambiguous. The fact that the intentionality score for the NC-I group did not differ from the NC-
NI group suggests a failure of the manipulation. Participants in the NC-I group read about an

Attributional Theory 19
offending driver who drove over the crest of a hill and was suddenly faced with a pothole in the
road. The driver chose to avoid the pothole by cutting off the participant in an adjacent lane. This
scenario was designed to suggest the absence of controllability, as the appearance of the pothole
over the crest of the hill was entirely unforeseeable and uncontrollable. Yet the scenario was also
designed to suggest the presence of intent, as the driver’s avoidance of the pothole by cutting off
the participant was a conscious decision and he or she could have chosen to drive over the
pothole instead. It seems that the participants in this study considered the offending motorist’s
avoidance of the pothole to be a necessary or reflexive action as opposed to a reasoned choice.
They may also have considered the response of the offending driver to be one that they
themselves would have made, which might have altered their attribution of intentionality.
Nonetheless, the manipulation failure on this one cell in the ANOVA was not entirely ruinous, as
there was still a wide range of scores on the intentionality scale.
The path analysis indicated that Weiner’s (1995, 1996, 2001, 2006) model generally fit
the data; however, a few revisions were necessary. As expected, controllability, intentionality,
and locus of causality were positively related to responsibility. The strength of the relationship
between intentionality and responsibility was not as strong as the relationship between the other
two causal dimensions and responsibility, which may have been the result of the NC-I
manipulation failure. As expected, anger was positively predicted by responsibility, but contrary
to expectation, sympathy was not associated with perceptions of responsibility, in contrast to
predictions outlined by Weiner. Responsibility was also expected to mediate fully the
relationship between the causal dimensions and emotional responses, although only one such
path was fully mediated. Specifically, responsibility fully mediated the relationship between
controllability and anger. Intentionality and locus of causality were positively related to anger,

Attributional Theory 20
and responsibility partially mediated this relationship. All three causal dimensions were
negatively related to sympathy, controlling responsibility. As expected, aggressive behavior was
positively predicted by anger and prosocial behavior was positively predicted by sympathy. The
residuals of anger and sympathy were negatively correlated, but contrary to expectation, the
residuals of aggressive and prosocial behavior were not correlated.
Although responsibility is a principal aspect of Weiner’s (1995, 1996, 2001)
conceptualization of the relationship between attributions and aggressive behavior, others have
questioned its central role (Feather & Deverson, 2000). Driver behavior researchers have chosen
not to study responsibility (e.g., Britt & Garrity, 2006; Takaku, 2006; Vallières et al., 2005),
treating the causal dimensions as components of, rather than antecedents of, the more
encompassing inference of personal responsibility. The results of the current study suggest that
responsibility as a separate cognitive process can play a meaningful role in the driving context,
as the relationship between controllability and anger was fully mediated by responsibility. The
finding that responsibility only partially mediated the relationship between the causal dimensions
of intentionality and locus of causality, and the anger emotion, suggests that the intervening role
of responsibility may not be absolute. The lack of a significant relationship between
responsibility and sympathy, despite significant relationships between the three causal
dimensions and both responsibility and sympathy, leads to further questioning of the role of
causal judgment in the application of attributional theory to driving. Future research may
demonstrate that the construct of responsibility is less necessary for the study of driver
aggression, as the fast-paced roadway fails to provide sufficient opportunity to cognitively
process an independent judgment of responsibility. It may be more appropriate to treat
responsibility as an automatic implication of perceived causal dimensionality. Applications of
Attributional Theory 21
Weiner’s model to other contexts have used this approach, combining the causal dimensions and
a responsibility inference within a single variable (e.g., Struthers, Eaton, Mendoza, Santelli, &
Shirvani, 2010; Greitemeyer, Rudolph, & Weiner, 2003). Future research may also refine the
more multifaceted construct of responsibility judgment used here and identify the feature most
relevant to the driving context. Theoretical distinctions can be drawn between responsibility,
blame, and deserved punishment (Weiner, 1995), which may influence the role of responsibility
judgment in the driver’s attributional process.
Study 2
Study 2 was designed to examine Weiner’s (1995, 1996, 2001, 2006) model within the
context of life events and experiences. Whereas Study 1 presented a hypothetical driving
scenario, Study 2 asked participants to consider an anger-provoking event they had experienced.
Britt and Garrity (2006) asked participants to recall specific driving events from their past, but it
is possible that participants may not have been recalling details of the event but rather
confabulating with stereotype-based information. Study 2 used a driving diary methodology to
further evaluate the applicability of Weiner’s model within the context of life experiences. Study
2 was deemed essential in order to examine the generalizability of the findings of Study 1, as
well as allow for the possibility that certain results from Study 1 (e.g., the lack of an association
between perceived responsibility and sympathy) were due, at least in part, to the use of
hypothetical scenarios rather than life experiences.
The nature of the negative driving events reported was expected to be very diverse and it
was unclear how this diversity would impact the usefulness of the causal dimensions in the
model. Applying the behavioral items from Study 1 - particularly the prosocial behavior items -
to Study 2 also posed several problems. These challenges necessitated testing a revised version

Attributional Theory 22
of Weiner’s (1995, 1996, 2001, 2006) model. This alternate model substituted thoughts about
engaging in a particular behavior for the behaviors themselves.
Method
Participants
To take part in this research study, participants were required to have held a class G2 (the
level of graduated licensing at which new drivers are permitted to drive independently) or G
Ontario driver’s license for at least 1 year, drive at least 4 days per week on average, and have
Internet access from home. Fifty participants were recruited through advertisements posted
across the university’s main campus, and an additional 152 participants were recruited through
an undergraduate participant pool; thus, 202 participants were assembled. Two respondents were
eliminated for careless responding and 1 respondent was eliminated because he had previously
participated in a similar study that might result in biased responding. The remaining sample
consisted of 58 men and 141 women. The mean age of participants was 23.24 years (SD = 7.17),
and participants reported having possessed a driver’s licence for a mean of 6.04 years (SD =
5.74).
Measures and procedures
Participants completed a total of four online driving diaries, once every 2 days. On the
morning of the day that their diary entry was to be submitted, participants received an e-mail
containing a link to the online diary which asked them to describe a negative driving event
involving another motorist, experienced during the previous 2 days. They were asked to describe
the nature of the event, where it took place, how the encounter made them feel, and what they
did after or in response to the event. Participants rated the negativity and severity of the event
and the extent to which they felt anger toward the other driver on a 7-point Likert-type scale.

Attributional Theory 23
Participants were instructed that if they had not driven in the past 48 hours, or if they did not
drive a sufficient distance to experience even a minor annoyance on the roadway, to submit their
diary but respond with “not applicable” to all open-ended questions and with “1” to all scales.
Participants who did not submit a diary entry received a prompting e-mail each morning.
After all four diaries had been submitted, respondents were sent another link for the final
on-line survey which was focused on the most upsetting and negative driving event with the
highest Likert-type rating of anger toward the other driver reported in the four diaries. If multiple
entries had the same score on this scale, the rating of negativity of the event broke the tie. If
multiple entries had identical scores for both anger and negativity, perceived severity of the
event was used to break the tie.
Participants were instructed to write a short paragraph describing this upsetting event
(i.e., what happened, how did you feel, what did you do). Participants were then asked to
complete a questionnaire that was almost identical to the one presented to participants in Study 1.
The items were revised so that they were not specific to being cut off by another motorist, but
rather were applicable to any number of offensive driving behaviors. The behavioral items were
altered so that they asked about behaviors committed rather than behavioral responses that
drivers anticipated committing. Revisions to the three prosocial behavior items were not
straightforward. Two of the items involved highly unlikely hypothetical events during the critical
incident (i.e., offering personal assistance to the driver, calling police or a tow truck to assist the
driver). The elimination of these items would have left only one item to measure prosocial
behavior (i.e., gesturing to the other driver that everything is okay). In addition, not knowing in
advance what types of events would be reported and what opportunities for aggression would

Attributional Theory 24
emerge, it was difficult to determine how appropriate the aggressive behavior items would be in
the current study.
In response to these limitations, two new sets of constructs were added to the
questionnaire: aggressive thought (five items) and prosocial thought (three items). These
constructs included the same types of behaviors as did Study 1 and asked what participants
considered doing in response to the offending driver. Thus, aggressive and prosocial thought
items generally used the phrasing “To what extent did you THINK ABOUT…?”, whereas the
aggressive and prosocial behavior items used the phrasing “To what extent DID you…?”. An
exception to this phrasing was made to two of the three prosocial thought items, which retained
the same format as the prosocial behavior items in Study 1. These items involved hypothetical
events that would not likely be spontaneously considered by participants in the driving
environment.
Results
Diary entries
For the first diary entry, nine participants indicated that they had not encountered a
negative driving event involving another motorist. For the second, third, and fourth diary entries,
13, 42, and 35 participants, respectively, reported not experiencing a negative driving event.
Thus, a majority of drivers encountered at least one negative event involving another motorist
within a 48-hr period. Across all four diary entries, an average of 88% of participants reported at
least a minor anger-provoking event within that time frame.
Post diary survey
Only two participants described a critical incident not included in one of the four diary
entries. One of these participants noted that the critical event took place on the morning that the
Attributional Theory 25
participant received the link for the final survey. Five participants ignored instructions and
focused on driving altercations involving multiple vehicles, and two participants focused on
driving altercations involving atypical vehicles (e.g., bus, tractor trailer); they were nonetheless
retained in the analysis as there were few of them. The mean level of anger felt toward the other
driver in the critical incident was 5.45 (SD = 1.49). For approximately 76% of the sample, their
reported anger toward the other driver was ranked 5 or higher on the 7-point scale. The mean
perceived negativity of the critical incident was 5.27 (SD = 1.43) and the mean perceived
severity was 4.37 (SD = 1.78). The most common type of event identified as the critical incident
was being cut off (i.e., a driver changes lanes in front of you without ensuring a safe distance
between his/her rear bumper and your front bumper) or nearly sideswiped by another vehicle
(i.e., a driver adjacent to you attempts to move into your lane), both of which involve an unsafe
lane change. A diverse array of other types of events were also reported, including a motorist
running a red light or stop sign, tailgating, highbeaming, driving too slowly, or blocking the
participant from merging or changing lanes.
Exploratory factor analysis of aggressive and prosocial thoughts
Given that the aggressive-thought and prosocial-thought scales were new, an exploratory
factor analysis examined their dimensionality (see Table 7), using the same approach as in Study
1. As expected, all aggressive thought items loaded most strongly on the first factor. In terms of
the prosocial thought items, two items loaded very strongly onto the second factor, whereas the
third loaded onto both factors weakly. Given that the content of this item was the basis for the
only prosocial behavior item remaining in this study (i.e., gesturing to the other driver that
everything is okay) and that there were only two other items in the prosocial thought construct,
this one item was retained for content validity. Without it, prosocial thought would have
Attributional Theory 26
consisted exclusively of helping behavior. By retaining the item, a more thorough replication of
the original questionnaire and model could be conducted in the second study. The factors were
moderately correlated in the expected directions (interfactor correlation = -.18). Table 8 contains
a bivariate correlations analysis and reliability estimates (along with means and standard
deviations) of all variables included in Study 2.
Path analysis
The observed variables were not normally distributed. Mardia’s measure of multivariate
kurtosis was 3.31 for the thoughts model and 5.26 for the behaviors model, indicating moderate
non-normality (Mardia, 1970). To find potential multivariate outliers, Mahalanobis distance was
calculated twice, once for the set of variables to be included in the thoughts model and once for
the set of variables to be included in the behaviors model. Four multivariate outliers were
identified, three of which were common to both models. These four cases were deleted from the
dataset, which led to an additional case being qualified as a multivariate outlier in the behaviors
model. Deleting this case left a total of 194 participants for further analysis.
Given the moderate non-normality of the data, the path analysis for Study 2 again
employed the Satorra-Bentler corrected model fit statistics and robust standard errors. As in
Study 1, the proposed models were estimated along with several direct paths that were expected
to be mediated by one other variable in the model. Nonsignificant paths not part of Weiner’s
(1995, 1996, 2001, 2006) model were deleted in a step-by-step fashion.
In the initial thoughts model, with all direct paths included, the chi-square test, χ2(8) =
10.04, p = .26, indicated that the model had a good fit to the data. Other fit indices corroborated
this finding (CFI = .99, RMSEA = .04, SRMR = .03). In the final thoughts model, with
nonsignificant direct paths removed, most of the fit indices improved slightly, χ2(14) = 13.89, p =
Attributional Theory 27
.46, CFI = 1.00, RMSEA = .00, SRMR = .04. The step-by-step removal of nonsignificant paths
led to the deletion of six direct paths from the model; however, responsibility did not fully
mediate the relationships between the causal dimensions of controllability and intentionality and
the sympathy outcome. In addition, the hypothesized residual correlation between aggressive and
prosocial thought was not significant. As this relationship was part of the hypothesized model, it
was retained in the final model presented in Figure 4, which includes standardized path
estimates. In light of the fact that responsibility did not mediate fully the relationship between the
causal dimensions of controllability and intentionality and the sympathy outcome, partial
mediation was again tested using the product of z-score approach. Results indicated that
responsibility partially mediated these relationships (p < .05). Overall, squared multiple
correlations indicated that the model accounted for 39% of the variance in responsibility, 27% of
the variance in anger, 27% of the variance in sympathy, 36% of the variance in aggressive
thought, and 8% of the variance in prosocial thought.
In the initial behaviors model, with all direct paths included, the chi-square test was
significant, χ2(8) = 29.03, p < .01, and most of the other fit indices suggested an inadequate fit
(CFI = .93, RMSEA = .12, SRMR = .05). With the non-significant direct paths removed, the fit
indices improved slightly, χ2(14) = 34.77, p < .01, CFI = .93, RMSEA = .09, SRMR = .06. In
total, six direct paths were deleted from the model. As with the thoughts model, responsibility
did not mediate fully the relationships between the causal dimensions of controllability and
intentionality and the sympathy outcome. Subsequent tests for partial mediation were significant
(p < .05). The hypothesized residual correlation between aggressive and prosocial behavior was
significant but positive. Finally, the path from sympathy to prosocial behavior was not
significant, but because it was hypothesized as part of the original model, this path was retained

Attributional Theory 28
in the final model (see Figure 5 for standardized path estimates). Squared multiple correlations
indicated that the model accounted for 9% of the variance in aggressive behavior and less than
1% of the variance in prosocial behavior. Potential gender differences in the primary variables of
interest were assessed, but none were found.
Discussion
Overall, the results strongly support a successful replication of the laboratory-based
findings of Study 1 with the diary methodology of Study 2. A review of the diary entries
revealed that a majority of drivers encountered at least one negative event involving another
motorist within a 48-hr period. Over the course of the study, approximately three out of every
four participants in the sample experienced a negative driving event that caused them to rate their
anger toward the other motorist as 5 or higher on a 7-point scale. Demand characteristics may
have contributed to the high prevalence of anger-provoking encounters, as participants were
recruited specifically for involvement in a study of negative driving events. Nonetheless, these
findings are consistent with previous reports that estimate anger to be a frequent occurrence on
roadways (Mesken, Hagenzieker, Rothengatter, & de Waard, 2007; Neighbors et al., 2002). The
content of participants’ most negative and upsetting driving events from the previous week were
quite varied and included behaviors such as cutting off and sideswiping other motorists,
tailgating, excessively slow driving, running red traffic lights or stop signs, and blocking merges
or lane changes. The most frequently reported negative driving event was being cut off or nearly
sideswiped by another vehicle, which is consistent with previous research (Britt & Garrity, 2006;
Wickens et al., 2005, 2011).
A modified model was developed for Study 2, due to the difficulty of interpolating the
questionnaire from Study 1 to a questionnaire tapping the more personal meaning of driving

Attributional Theory 29
events. This new model (i.e., the thoughts model) removed behavioral responses from Weiner’s
(1995, 1996, 2001, 2006) theory and replaced them with behavioral thoughts (i.e., behavioral
options that the driver considered while driving). These thoughts were designed to closely
parallel the behavioral items tested in Study 1, which asked what behaviors participants
anticipated performing were they to find themselves in the hypothetical scenario. Drivers’ angry
thoughts about retaliating verbally or physically against an offending driver are strongly
correlated with driving-related aggression (Deffenbacher, Petrilli, Lynch, Oetting, & Swaim,
2003; Deffenbacher, White, & Lynch, 2004).
The modified thoughts model fit the data well. As predicted, the three causal dimensions
were all positively correlated, although the strength of these correlations was weaker than in
Study 1. As predicted, all three causal dimensions were significantly related to responsibility.
Interestingly, the strength of the relationship between intentionality and responsibility in Study 2
(b* = .19) was very similar to the parallel finding in Study 1 (b* = .14), suggesting that the NC-I
manipulation failure may not have affected the strength of the relationship in Study 1. It is
possible that for some participants, a lack of intention was perceived as negligence or as a lack of
foresight on the part of the offending driver, and that this lack of intention was associated with a
judgment of the offending driver as responsible for the negative event.
As predicted, responsibility was positively associated with anger and negatively
associated with sympathy. Although findings for sympathy are at variance with the
nonsignificant finding from Study 1, these data are in keeping with meta-analytic findings
linking low perceived responsibility with greater feelings of sympathy (Rudolph, Roesch,
Greitemeyer, & Weiner, 2004). Collectively, these data suggest that it is best to predict the
attributional antecedents of sympathy in a more experimentally representative context, but more

Attributional Theory 30
importantly, the data provide support for Weiner’s (2006) extended attributional model of social
motivation and moral emotions.
Also as predicted, responsibility fully mediated the relationship between all three causal
dimensions and anger. Responsibility also fully mediated the relationship between locus of
causality and sympathy. The relationships between the two remaining causal dimensions
(controllability and intentionality) and sympathy were only partially mediated. As expected,
aggressive thought was positively predicted by anger, and prosocial thought was positively
predicted by sympathy. As expected, the residuals of anger and sympathy were negatively
correlated. Contrary to predictions, but similar to the results of Study 1, there was no residual
correlation between aggressive and prosocial thought. The correlations among variables in Study
2 were smaller than in Study 1, and the variance in each of the endogeneous variables accounted
for by the model was less, which is not surprising given the more varied nature of driving events
addressed and the lack of experimental control characterizing Study 2. The greatest declines in
variance accounted for in Study 1 versus Study 2 were responsibility (Study 1 R2 = .69, Study 2
R2 = .39) and prosocial thought (Study 1 R2 = .28, Study 2 R2 = .08).
The parameter estimates of the behaviors model were essentially the same as those of the
thoughts model, although differences could be seen with the behavioral constructs. Aggressive
behavior seemed to fit well within the behaviors model, but this was not so for the prosocial
behavior construct. Specifically, the relationship between sympathy and prosocial behavior was
not significant, and the correlation between aggressive and prosocial behavior was significant,
but in a positive direction. This suggests that the measure of prosocial behavior may have been
inadequate. The items used to measure prosocial behavior in Study 1 were very limited, and were
often based on hypothetical events (e.g., offering personal assistance to the driver), making

Attributional Theory 31
revision of these items impossible for Study 2. Attributional theory may still prove useful in
promoting prosocial driver behaviors, but the current research focus on negative events likely
hampered the investigation of positive behavior.
Another noteworthy difference between the thoughts and behaviors models is the strength
of the relationship between anger and aggressive thought versus behavior. In the case of thought,
the standardized regression coefficient was .60 and in the case of behavior, it was .30. In
addition, the amount of variance accounted for by the model was greater for aggressive thought
(R2 = .36) than for aggressive behavior (R2 = .09). Clearly, the thoughts model more closely
replicated the conditions of Study 1, in which the standardized regression coefficient between
anger and aggressive behavior was .63 and the model accounted for 40% of the variance in
aggressive behavior. It is possible that the lower regression coefficient in the thoughts model
compared with the behaviors model in Study 2 reflects the fact that drivers do not enact all of the
behaviors they consider. The mean scores for aggressive thought (4.46) and aggressive behavior
(2.64) support this interpretation. Fortunately, given the low frequency of driver anger expressed
on roadways, drivers usually inhibit their aggressive thoughts.
Given the strong correlations between thoughts and behaviors, future research may
consider revising the model to include paths from thoughts to behaviors. Such a model would be
a hybrid of Weiner’s (1995, 1996, 2001, 2006) model and the theory of planned behavior (TPB;
Ajzen, 1985), which addresses the link between behavioral intentions and actions. Given the
weakness of the prosocial behavior construct in the current study, such a model was not tested
here.

Attributional Theory 32
General Discussion: Future Research and Applications
Overall, the findings of the current research support Weiner’s (1995, 1996, 2001, 2006)
attributional model of responsibility for social transgressions in a context that has not been used
thus far to test this model. The causal dimensions provide a good means of classifying various
types of offensive driver behavior, and the model, as a whole, provides a reliable means of
predicting driver anger and aggression. With the exception of the behaviors model in Study 2,
these studies also suggest that the model may provide a means of accounting for sympathy and
prosocial behavior in the driving environment, although these constructs will need further
attention before they can be fully understood. Differences between the thoughts and behaviors
models in Study 2 were informative. The stronger relationship between anger and aggressive
thought versus behavior, and the greater amount of variance within aggressive thought versus
behavior that was accounted for by the model, could be interpreted as reflecting the fact that
individuals do not enact all behavioral responses in their repertoire. Studies examining the
relationship between intentions and behaviors across a diversity of contexts (e.g., condom use,
healthy eating and exercise habits, smoking cessation, students’ study habits, participation in
collective action) have demonstrated a similar finding (Armitage & Conner, 2001). Overall, the
results of these two studies provide the necessary foundation for continued application of
Weiner’s model to the driving context and provide a framework to guide that research.
Future Research to Address the Limitations of the Current Study
Expanding the methodological repertoire
Expanding the methodology used to study driver attributions is essential to the
advancement of this research. The written scenarios of Study 1 may have differed in ways
beyond the intended levels of perceived controllability and intentionality. Moreover, the

Attributional Theory 33
questionnaire methodology used in both studies may have inflated anger ratings through
rumination (Rusting & Nolen-Hoeksema, 1998), threatening the studies’ external validity.
Simulator technology offers great potential in studying the attribution process in vivo, and would
permit testing using physiological, as well as behavioral, measures of driver anger and
aggression. The importance of studying driver anger and aggression using multiple techniques is
particularly important in light of recent findings that the empirically demonstrated relationship
between driver anger and aggression is subject to common method variance (Nesbit et al., 2007).
It might also be possible to utilize implicit measures of attributional tendencies or attitudes to
overcome the limitations of self-report data. The Implicit Association Test (IAT) has just begun
to be used in driving-related research (e.g., Hatfield, Fernandes, Faunce, & Job, 2008; Sibley &
Harré, 2009a, 2009b) and may be able to inform the study of attributional processing in the
driving context.
Applying the model to drivers in other jurisdictions and to drivers with more experience
It will also be important to ensure that Weiner’s (1995, 1996, 2001, 2006) model applies
to all driver behavior and not just to the behavior of young Canadian drivers comprising the
majority of the present sample. Cross-cultural research has found both similarities and
differences in self-reported aggressive driving behavior. Across cities or countries, drivers may
attribute offensive behavior differently (Özkan, Lajunen, Parker, Sümer, & Summala, 2010). In a
similar vein, novice motorists are typically overconfident about their driving skills (Mynttinen et
al., 2009). Many young drivers believe that they engage in less risky driving than their peers
(Harré, Brandt, & Houkamau, 2004) and are less likely than their peers to be involved in a
collision (Glendon, Dorn, Davies, Matthews, & Taylor, 1996; Matthews & Moran, 1986).
Although optimism biases are prevalent among all age groups, some studies have suggested that
Attributional Theory 34
this bias is particularly pronounced among young people in the driving context (Harré et al.,
2004; Matthews & Moran, 1986). Overly positive misperceptions about one’s own driving skills
and abilities may serve to reduce one’s tolerance for the objectionable behavior of other road
users (Jiang, Li, & Liu, 2008). Risky and aggressive driving is far less prevalent among older,
more experienced motorists (Lajunen & Parker, 2001; Smart, Mann, & Stoduto, 2003).
Future Research of Other Relevant Factors and Models
Future research will also need to consider other factors and variables that might impact
the cognitive-emotional-behavioral sequence identified in Weiner’s (1995) model. Stereotypes,
for example, have already been found to impact the responsibility judgments for drivers involved
in a motor vehicle collision (Davies & Patel, 2005). It might be worthwhile to determine how
stereotypes about any number of driver characteristics might impact attributions for near-
collisions or other negative driving encounters. Does age, gender, or ethnicity affect driving-
related attributions? Horn-honking latency in response to a vehicle stopped at a green traffic light
has been found to differ based on the perceived degree of the offending driver’s experience (via
the presence versus absence of a learner’s permit sticker; Yazawa, 2004), suggesting that
perceptions of the offending driver’s experience may impact responsibility judgments, anger, and
aggression.
Future research may also assess how individual difference or personality variables
influence Weiner’s (1995, 1996, 2001, 2006) model. Weiner (1995) has suggested that those
high in trait aggression are likely to possess a hostile attribution bias that influences their
inferences about the responsibility of perceived offenders. Are there other individual difference
variables impacting the cognitive-emotional-behavioral sequence outlined by Weiner? Research
has already identified impulsivity (Wickens, Toplak, & Wiesenthal, 2008), narcissism (Lustman,

Attributional Theory 35
Wiesenthal, & Flett, 2010), Type A behavior (Miles & Johnson, 2003), trait anger (Deffenbacher
et al., 2004; Lajunen & Parker, 2001; Mesken et al., 2007; Nesbit et al., 2007), trait driver stress
(Hennessy & Wiesenthal, 2001), and the Big Five personality traits (i.e., extraversion,
agreeableness, conscientiousness, neuroticism, openness; Miles & Johnson, 2003; Sümer,
Lajunen, & Özkan, 2005) as predictors of driver anger and/or aggression.
It seems reasonable to assume that an extension of Weiner’s (1995, 1996, 2001, 2006)
model or a more integrative framework will need to be considered in order to account for the
influence of personality and other relevant constructs. Alternative models of driver behavior
(e.g., Ajzen’s, 1985, theory of planned behavior, Matthews’s, 2002, transactional model of driver
stress and fatigue) have included environmental stressors, coping ability, and subjective norms in
the development of driver aggression. Within the aggression context, the General Aggression
Model (GAM; Anderson & Bushman, 2002) is a highly comprehensive framework that may help
to incorporate all of these constructs and models of driver behavior. Weiner’s model and the
GAM can be combined in a potentially meaningful manner. Within the GAM, continued
research using Weiner’s model would allow for a thorough understanding of the precise nature of
causal attributions and judgments of responsibility as they relate to driver anger and aggression,
and an understanding of why certain driving behaviors are perceived as more offensive than
others.
Attributional Theory as a Means to Improved Driver Safety
Drivers need to be reminded that, like themselves, other motorists may also make
unintended errors that are atypical of their usual driving behavior (Baxter, Macrae, Manstead,
Stradling, & Parker, 1990; Herzog, 1994). Drivers also need to be encouraged to make the effort
to look for possible situational determinants of seemingly offensive driver behavior (Ellwanger,

Attributional Theory 36
2007). Conversely, drivers need to consider that their own driving behaviors may be perceived as
offensive, and may elicit anger and/or aggression from other road users (Baxter et al., 1990;
Herzog, 1994). When recognizing that other motorists suffer from the same attributional biases
as themselves, drivers may be more likely to acknowledge their own driving error and to
communicate its unintended nature (e.g., with a wave), thereby reducing the likelihood that the
victim motorist will respond with anger and/or aggression (Ellwanger, 2007). It may also be
beneficial for young drivers to realize that they may overestimate their own driving skills and
abilities.
Researchers have suggested initiating education campaigns and driver training programs
designed to sensitize drivers to their misperceptions and attributional biases (Baxter et al., 1990;
Ellwanger, 2007; Harré et al., 2004; Herzog, 1994; McKenna & Albery, 2001). For instance, the
public service campaign entitled ‘Give ‘em A Brake’ encourages courtesy and patience for road
construction workers (Ellwanger, 2007). It asks drivers to view construction delays as necessary
and legitimate rather than the result of apathetic and unmotivated construction crews. By altering
drivers’ perceptions of, and attributions, for the delays, the campaign may be reducing the
amount of stress experienced by motorists, and reducing the likelihood of aggressive behavior
endangering motorists and construction crews. Similar campaigns could be developed to alter
driver perceptions of, and attributions for, the negative driving behaviors and errors committed
by other motorists. Likewise, driver attribution training programs could be developed and
focused on making drivers aware of their cognitive biases in explaining their own and others’
driver behaviors. Reminding motorists of their own driving errors has been shown to reduce
anger in response to an offensive driving event (Takaku, 2006). Training programs could also
focus on teaching drivers about how to communicate their intentions both before (e.g., using lane

Attributional Theory 37
change and turn signals) and after (e.g., waving to indicate an apology or a sign of gratitude) a
driving maneuver in order to reduce the chances of a miscommunication escalating into an
aggressive episode. This may be particularly worthwhile given Renge’s (2000) finding that
novice drivers encounter more difficulty than experienced drivers in comprehending informal
signals sometimes used in the driving environment (e.g., flashing headlights as a signal of
thanks). Finally, the positive association between anger and aggression demonstrated in this
research suggests that anger management training may prove beneficial for those drivers who
allow their anger to escalate to aggressive behavior.

Attributional Theory 38
References
Ajzen, I. (1985). From intentions to actions: A theory of planned behavior. In J. Kuhl & J.
Beckmann (Eds.), Action control: From cognition to behavior (pp. 11–39). Berlin:
Springer-Verlag.
Anderson, C. A. (1983). The causal structure of situations: The generation of plausible causal
attributions as a function of type of event situation. Journal of Experimental Social
Psychology, 19, 185-203. doi:10.1016/0022-1031(83)90037-9
Anderson, C. A., & Bushman, B. J. (2002). Human aggression. Annual Review of Psychology,
53, 27-51. doi:10.1146/annurev.psych.53.100901.135231
Arkkelin, D., Oakley, T., & Mynatt, C. (1979). Effects of controllable versus uncontrollable
factors on responsibility attributions: A single-subject approach. Journal of Personality
and Social Psychology, 37, 110-115. doi:10.1037/0022-3514.37.1.110
Armitage, C. J., & Conner, M. (2001). Efficacy of the Theory of Planned Behaviour: A meta-
analytic review. British Journal of Social Psychology, 40, 471-499.
doi:10.1348/014466601164939
Arnett, J. J., Offer, D., & Fine, M. A. (1997). Reckless driving in adolescence: ‘State’ and ‘trait’
factors. Accident Analysis and Prevention, 29, 57-63. doi:10.1016/S0001-
4575(97)87007-8
Baxter, J. S., Macrae, C. N., Manstead, A. S. R., Stradling, S. G., & Parker, D. (1990).
Attributional biases and driver behavior. Social Behavior, 5, 185-192.
Britt, T. W., & Garrity, M. J. (2006). Attributions and personality as predictors of the road rage
response. British Journal of Social Psychology, 45, 127-147.
doi:10.1348/014466605X41355

Attributional Theory 39
Davies, G. M., & Patel, D. (2005). The influence of car and driver stereotypes on attributions of
vehicle speed, position on the road and culpability in a road accident scenario. Legal and
Criminological Psychology, 10, 45-62. doi:10.1348/135532504X15394
Deffenbacher, J. L., Petrilli, R. T., Lynch, R. S., Oetting, E. R., & Swaim, R. C. (2003). The
Driver’s Angry Thoughts Questionnaire: A measure of angry cognitions when driving.
Cognitive Therapy and Research, 27, 383-402. doi:10.1023/A:1025403712897
Deffenbacher, J. L., White, G. S., & Lynch, R. S. (2004). Evaluation of two new scales assessing
driving anger: The Driving Anger Expression Inventory and the Driver’s Angry Thoughts
Questionnaire. Journal of Psychopathology and Behavioral Assessment, 26, 87-99.
doi:10.1023/B:JOBA.0000013656.68429.69
Ellwanger, S. J. (2007). Strain, attribution, and traffic delinquency among young drivers:
Measuring and testing general strain theory in the context of driving. Crime &
Delinquency, 53, 523-551. doi:10.1177/0011128706295991
Feather, N. T. (1996). Reactions to penalties for an offense in relation to authoritarianism,
values, perceived responsibility, perceived seriousness, and deservingness. Journal of
Personality and Social Psychology, 71, 571-587. doi:10.1037/0022-3514.71.3.571
Feather, N. T. (1999). Values, achievement, and justice: Studies in the psychology of
deservingness. New York, NY: Kluwer Academic/Plenum Publishers.
Feather, N. T., & Deverson, N. H. (2000). Reactions to a motor-vehicle accident in relation to
mitigating circumstances and the gender and moral worth of the driver. Journal of
Applied Social Psychology, 30, 77-95. doi:10.1111/j.1559-1816.2000.tb02306.x
Attributional Theory 40
Fincham, F. D., & Bradbury, T. N. (1992). Assessing attributions in marriage: The Relationship
Attribution Measure. Journal of Personality and Social Psychology, 62, 457-468.
doi:10.1037/0022-3514.62.3.457
Fincham, F. D., & Jaspars, J. M. (1980). Attribution of responsibility: From man the scientist to
man as lawyer. In L. Berkowitz (Ed.), Advances in experimental social psychology (Vol.
13, pp. 81-138). New York, NY: Academic. doi:10.1016/S0065-2601(08)60131-8
Fincham, F. D., & Roberts, C. (1985). Intervening causation and the mitigation of responsibility
for harm doing: The role of limited mental capacities. Journal of Experimental Social
Psychology, 21, 178-194. doi:10.1016/0022-1031(85)90014-9
Glendon, A. I., Dorn, L., Davies, D. R., Matthews, G., & Taylor, R. G. (1996). Age and gender
differences in perceived accident likelihood and driver competences. Risk Analysis, 16,
755-762. doi:10.1111/j.1539-6924.1996.tb00826.x
Greitemeyer, T., Rudolph, U., & Weiner, B. (2003). Whom would you rather help: An
acquaintance not responsible for her plight or a responsible sibling? The Journal of Social
Psychology, 143, 331-340. doi:10.1080/00224540309598448
Harré, N., Brandt, T., & Houkamau, C. (2004). An examination of the actor-observer effect in
young drivers’ attributions for their own and their friends’ risky driving. Journal of
Applied Social Psychology, 34, 806-824. doi:10.1111/j.1559-1816.2004.tb02572.x
Hatfield, J., Fernandes, R., Faunce, G., & Job, R. F. S. (2008). An implicit non-self-report
measure of attitudes to speeding: Development and validation. Accident Analysis and
Prevention, 40, 616-627. doi:10.1016/j.aap.2007.08.020
Heider, F. (1944). Social perception and phenomenal causality. Psychological Review, 51, 358-
374. doi:10.1037/h0055425

Attributional Theory 41
Heider, F. (1958). The psychology of interpersonal relations. New York: John Wiley & Sons,
Inc.
Hennessy, D. A., & Wiesenthal, D. L. (1999). Traffic congestion, driver stress, and driver
aggression. Aggressive Behavior, 25, 409-423. doi:10.1002/(SICI)1098-
2337(1999)25:6<409::AID-AB2>3.0.CO;2-0
Hennessy, D. A., & Wiesenthal, D. L. (2001). Gender, driver aggression, and driver violence: An
applied evaluation. Sex Roles, 44, 661-676. doi:10.1023/A:1012246213617
Hennessy, D. A., & Wiesenthal, D. L. (2002). The relationship between driver aggression,
violence, and vengeance. Violence and Victims, 17, 707-718.
Herzog, T. A. (1994). Automobile driving as seen by the actor, the active observer, and the
passive observer. Journal of Applied Social Psychology, 24, 2057-2074.
doi:10.1111/j.1559-1816.1994.tb00574.x
Islam, M. R., & Hewstone, M. (1993). Intergroup attributions and affective consequences in
majority and minority groups. Journal of Personality and Social Psychology, 64, 936-
950. doi:10.1037/0022-3514.64.6.936
Jiang, L., Li, Y., & Liu, X. (2008). The effects of motor impulsiveness and optimism bias on
risky driving behavior in Chinese urban areas. Proceedings of the 11th International
IEEE Conference on Intelligent Transportation Systems, Beijing, China (pp. 605-609).
Downloaded from http://www.asmemesa.org/itsc08/ITSC2008/papers/0113.pdf January
4, 2011.
Jones, E. E., & Davis, K. E. (1966). From acts to dispositions: The attribution process in person
perception. In L. Berkowitz (Ed.), Advances in experimental social psychology (Vol. 2,
pp. 219-266). New York, NY: Academic. doi:10.1016/S0065-2601(08)60107-0
Attributional Theory 42
Kelley, H. H. (1967). Attribution theory in social psychology. In D. Levine (Ed.), Nebraska
Symposium on Motivation (Vol. 15, pp. 192-240). Lincoln, NE: University of Nebraska
Press.
Kline, R. B. (2005). Principles and practice of structural equation modeling. New York: The
Guilford Press.
Knapper, C. K., & Cropley, A. J. (1978). ‘Towards a social psychology of the traffic
environment’. In D. F. Burkhardt & W. H. Ittelson (Eds.), Environmental assessment of
socioeconomic systems (pp. 263-278). New York: Plenum.
Knapper, C. K., & Cropley, A. J. (1981). Social and interpersonal factors in driving. In G. M.
Stephenson & J. M. Davis (Eds.), Progress in applied social psychology (Vol. 1, pp. 191-
220). Chichester, England: John Wiley & Sons, Ltd.
Lajunen, T., & Parker, D. (2001). Are aggressive people aggressive drivers? A study of the
relationship between self-reported general aggressiveness, driver anger and aggressive
driving. Accident Analysis and Prevention, 33, 243-255. doi:10.1016/S0001-
4575(00)00039-7
Lawton, R., Parker, D., Stradling S. G., & Manstead, A. S. R. (1997). Predicting road traffic
accidents: The role of social deviance and violations. British Journal of Psychology, 88,
249-262. doi:10.1111/j.2044-8295.1997.tb02633.x
Lustman, M., Wiesenthal, D. L., & Flett, G. L. (2010). Narcissism and aggressive driving: Is
inflated self-esteem a road hazard? Journal of Applied Social Psychology, 40, 1423-1449.
doi:10.1111/j.1559-1816.2010.00624.x

Attributional Theory 43
MacCallum, R. C., Browne, M. W., & Sugawara, H. M. (1996). Power analysis and
determination of sample size for covariance structure modeling. Psychological Methods,
1, 130-149. doi:10.1037/1082-989X.1.2.130
MacKinnon, D. P., Fritz, M. S., Williams, J., & Lockwood, C. M. (2007). Distribution of the
product confidence limits for the indirect effect: Program PRODCLIN. Behavior
Research Methods, 39, 384-389. doi:10.3758/BF03193007
Mardia, K.V. (1970). Measures of multivariate skewness and kurtosis with applications.
Biometrika, 57, 519-530. doi:10.1093/biomet/57.3.519
Marjanovic, Z., Greenglass, E. R., Struthers, C. W., & Faye, C. (2009). Helping following
natural disasters: A social-motivational analysis. Journal of Applied Social Psychology,
39, 2604-2625. doi:10.1111/j.1559-1816.2009.00540.x
Martinez, R. (1997). The statement of the Honourable Ricardo Martinez, M.D., Administrator,
National Highway Traffic Safety Administration before the Subcommittee on Surface
Transportation, Committee on Transportation and Infrastructure, U.S. House of
Representatives, July 17, 1997.
Matthews, G. (2002). Towards a transactional ergonomics for driver stress and fatigue.
Theoretical Issues in Ergonomics Science, 3, 195-211. doi:10.1080/14639220210124120
Matthews, M. L., & Moran, A. R. (1986). Age differences in male drivers’ perception of
accident risk: The role of perceived driving ability. Accident Analysis and Prevention, 18,
299-313. doi:10.1016/0001-4575(86)90044-8
McKenna, F. P., & Albery, I. P. (2001). Does unrealistic optimism change following a negative
experience? Journal of Applied Social Psychology, 31, 1146-1157. doi: 10.1111/j.1559-
1816.2001.tb02667.x

Attributional Theory 44
McKillip, J., & Posavac, E. J. (1975). Judgments of responsibility for an accident. Journal of
Personality, 43, 248-265. doi:10.1111/j.1467-6494.1975.tb00705.x
Mesken, J., Hagenzieker, M. P., Rothengatter, T., & de Waard, D. (2007). Frequency,
determinants, and consequences of different drivers’ emotions: An on-the-road study
using self-reports, (observed) behavior, and physiology. Transportation Research Part F,
10, 458-475. doi:10.1016/j.trf.2007.05.001
Miles, D. E., & Johnson, G. L. (2003). Aggressive driving behaviors: are there psychological and
attitudinal predictors?. Transportation Research Part F, 6, 147-161. doi:10.1016/S1369-
8478(03)00022-6
Mynttinen, S., Sundström, A., Koivukoski, M., Hakuli, K., Keskinen, E., & Henriksson, W.
(2009). Are novice drivers overconfident? A comparison of self-assessed and examiner-
assessed driver competences in a Finnish and Swedish sample. Transportation Research
Part F, 12, 120-130. doi:10.1016/j.trf.2008.09.002
Neighbors, C., Vietor, N. A., & Knee, C. R. (2002). A motivational model of driving anger and
aggression. Personality and Social Psychology Bulletin, 28, 324-335. doi:
10.1177/0146167202286004
Nesbit, S. M., Conger, J. C., & Conger, A. J. (2007). A quantitative review of the relationship
between anger and aggressive driving. Aggression and Violent Behavior, 12, 156-176.
doi:10.1016/j.avb.2006.09.003
Nunnally, J. C., & Bernstein, I. H. (1994). Psychometric theory (3rd ed.). Toronto: McGraw-Hill,
Inc.

Attributional Theory 45
Özkan, T., Lajunen, T., Parker, D., Sümer, N., & Summala, H. (2010). Symmetric relationship
between self and others in aggressive driving across gender and countries. Traffic Injury
Prevention, 11, 228-239. doi:10.1080/15389581003788864
Parker, D., Lajunen, T., & Summala, H. (2002). Anger and aggression among drivers in three
European countries. Accident Analysis and Prevention, 34, 229-235. doi:10.1016/S0001-
4575(01)00018-5
Renge, K. (2000). Effect of driving experience on drivers’ decoding process of roadway
interpersonal communication. Ergonomics, 43, 27-39. doi:10.1080/001401300184648
Rudolph, V., Roesch, S. C., Greitemeyer, T., & Weiner, B. (2004). A meta-analytic review of
help giving and aggression from an attributional perspective: Contributions to a general
theory of motivation. Cognition and Emotion, 18, 815-848.
doi:10.1080/02699930341000248
Rusting, C. L., & Nolen-Hoeksema, S. (1998). Regulating responses to anger: Effects of
rumination and distraction on angry mood. Journal of Personality and Social Psychology,
74, 790-803. doi:10.1037/0022-3514.74.3.790
Satorra, A., & Bentler, P. M. (1994). Corrections to test statistics and standard errors in
covariance structure analysis. In A. von Eye & C. C. Clogg (Eds.), Latent variables
analysis: Applications for developmental research (pp. 399-419). Thousand Oaks, CA:
Sage Publications, Inc.
Satorra, A., & Bentler, P. M. (2001). A scaled difference chi-square test statistic for moment
structure analysis. Psychometrika, 66, 507-514. doi:10.1007/BF02296192
Shaver, K. G. (1985). The attribution of blame: Causality, responsibility, and blameworthiness.
New York: Springer-Verlag.

Attributional Theory 46
Shultz, T. R., & Darley, J. M. (1991). An information-processing model of retributive moral
judgments based on “legal reasoning”. In W. M. Kurtines & J. L. Gewirtz (Eds.),
Handbook of moral behavior and development – Volume 2: Research (pp. 247-278).
Hillsdale, NJ: Lawrence Erlbaum Associates, Publishers.
Sibley, C. G., & Harré, N. (2009a). The impact of different styles of traffic safety advertisement
on young drivers’ explicit and implicit self-enhancement biases. Transportation Research
Part F, 12, 159-167. doi:10.1016/j.trf.2008.11.001
Sibley, C. G., & Harré, N. (2009b). A gender role socialization model of explicit and implicit
biases in driving self-enhancement. Transportation Research Part F, 12, 452-461.
doi:10.1016/j.trf.2009.08.006
Smart, R. G., Mann, R. E., & Stoduto, G. (2003). The prevalence of road rage: Estimates from
Ontario. Canadian Journal of Public Health, 94, 247-250.
Snyder, D. F. (1997). Statement of David F. Snyder, Assistant General Counsel, American
Insurance Association, representing advocates for highway and auto safety before the
Subcommittee on Surface Transportation, Committee on Transportation and
Infrastructure, U.S. House of Representatives, July 17, 1997.
Struthers, C. W., Dupuis, R., & Eaton, J. (2005). Promoting forgiveness among co-workers
following a workplace transgression: The effects of social motivation training. Canadian
Journal of Behavioural Science, 37, 299-308. doi:10.1037/h0087264
Struthers, C. W., Eaton, J., Mendoza, R., Santelli, A., G., & Shirvani, N. (2010). The
interrelationship among injured parties' attributions of responsibility, appraisal of the
appropriateness to forgive the transgressor, forgiveness, and repentance. Journal of
Applied Social Psychology, 40, 970-1002. doi:10.1111/j.1559-1816.2010.00607.x

Attributional Theory 47
Sümer, N., Lajunen, T., & Özkan, T. (2005). Big five personality traits as the distal predictors of
road accident involvement. In G. Underwood (Ed.). Traffic and transport psychology:
Theory and application – Proceedings of the ICTTP 2004 (pp. 215-227). New York:
Elsevier.
Takaku, S. (2006). Reducing road rage: An application of the dissonance-attribution model of
interpersonal forgiveness. Journal of Applied Social Psychology, 36, 2362-2378.
doi:10.1111/j.0021-9029.2006.00107.x
Tversky, A. & Kahneman, D. (1974). Judgment under uncertainty: Heuristics and biases.
Science, 185, 1124-1131. doi:10.1126/science.185.4157.1124
Vallières, E. F., Bergeron, J., & Vallerand, R. J. (2005). The role of attributions and anger in
aggressive driving behaviors. In G. Underwood (Ed.). Traffic and transport psychology:
Theory and application – Proceedings of the ICTTP 2004 (pp. 181-190). New York:
Elsevier.
Weiner, B. (1979). A theory of motivation for some classroom experiences. Journal of
Educational Psychology, 71, 3-25. doi:10.1037/0022-0663.71.1.3
Weiner, B. (1985). An attributional theory of achievement motivation and emotion.
Psychological Review, 92, 548-573. doi:10.1037/0033-295X.92.4.548
Weiner, B. (1995). Judgments of responsibility: A foundation for a theory of social conduct. New
York: The Guilford Press.
Weiner, B. (1996). Searching for order in social motivation. Psychological Inquiry, 7, 199-216.
doi:10.1207/s15327965pli0703_1
Attributional Theory 48
Weiner, B. (2001). Responsibility for social transgressions: An attributional analysis. In B. F.
Malle, L. J. Moses, & D. A. Baldwin (Eds.), Intentions and intentionality (pp. 331-344).
Cambridge, MA: MIT Press.
Weiner, B. (2006). Social motivation, justice, and the moral emotions: An attributional
approach. Mahwah, NJ: Erlbaum.
Weiner, B., Perry, R. P., & Magnusson, J. (1988). An attributional analysis to reactions of
stigmas. Journal of Personality and Social Psychology, 55, 738-748. doi:10.1037/0022-
3514.55.5.738
Weiner, B., Russell, D., & Lerman, D. (1978). Affective consequences of causal ascriptions. In J.
H. Harvey, W. J. Ickes, & R. F. Kidd (Eds.), New directions in attribution research (Vol.
2, pp. 59-88). Hillsdale, NJ: Erlbaum.
Wells-Parker, E., Ceminsky, J., Hallberg, V., Snow, R. W., Dunaway, G., Suiling, S., et al.
(2002). An exploratory study of the relationship between road rage and crash experience
in a representative sample of US drivers. Accident Analysis and Prevention, 34, 271-278.
doi:10.1016/S0001-4575(01)00021-5
Wickens, C. M., Toplak, M. E., & Wiesenthal, D. L. (2008). Cognitive failures as predictors of
driving errors, lapses, and violations. Accident Analysis and Prevention, 40, 1223-1233.
doi:10.1016/j.aap.2008.01.006
Wickens, C. M., Wiesenthal, D. L., Hall, A., & Roseborough, J. (2011). Driver anger on the
information superhighway: A final report. Proceedings of the 21st Canadian
Multidisciplinary Road Safety Conference, Halifax, Nova Scotia. Retrieved from
http://www.carsp.ca/documents/139

Attributional Theory 49
Wickens, C. M., Wiesenthal, D. L., & Rippey, K. (2005). Motorists’ perceptions of aggressive
driving: A comparative analysis of Ontario and California drivers. In D. A. Hennessy &
D. L. Wiesenthal (Eds.), Contemporary issues in road user behavior and traffic safety
(pp. 23-36). Hauppauge, NY: Nova Science Publishers.
Yazawa, H. (2004). Effects of inferred social status and a beginning driver’s sticker upon
aggression of drivers in Japan. Psychological Reports, 94, 1215-1220.
doi:10.2466/pr0.94.3c.1215-1220

Attributional Theory 50
Table 1
Study 1: Factor Structure and Pattern Coefficients of Controllability and Intentionality Items
Factor Structure Factor Pattern
Intended Factor and Item Factor 1 Factor 2 Factor 1 Factor 2
1. Controllability: Would you say that the main
reason for the other driver cutting you off was: Not
Controllable by the Driver (=7)…Controllable by
the Driver (=1)
.79 .43 .77 .05
2. Controllability: Do you believe the cause of the
event (i.e., the cause of the other driver cutting you
off) was beyond the driver’s power?: Very much
so (=1)…Not at all (=7)
.88 .51 .83 .10
3. Controllability: Do you think this driving event
(i.e., the other driver cutting you off) was
controllable?: Very much so (=7)…Not at all (=1)
.88 .40 .90 -.04
4. Controllability: Do you think this driving event
(i.e., the other driver cutting you off) was
preventable?: Not at all (=1)…Very much so (=7)
.83 .32 .89 -.13
5. Controllability: Do you believe that the other
driver could have easily avoided cutting you off?:
Very much so (=7)…Not at all (=1)
.79 .45 .76 .07
6. Intentionality: Do you believe that the other
driver intended to cut you off?: Very much so
(=7)…Not at all (=1)
.43 .86 .01 .86
7. Intentionality: Do you think the other driver
deliberately cut you off?: Not at all (=1)…Very
much so (=7)
.39 .91 -.09 .96
8. Intentionality: I think the other driver cut me off
by accident: Very much so (=1)…Not at all (=7)
.54 .79 .20 .68
9. Intentionality: I think the other driver cut me off
on purpose: Very much so (=7)…Not at all (=1)
.41 .88 -.04 .90
Factor 1 Factor 2

Attributional Theory 51
Variance accounted for 47% 43%
Note. The factor structure matrix contains the bivariate correlations of the items with the factors.
The factor pattern matrix contains the regression coefficients, indicating the relative importance
of the item to the factor with all other items separated out.

Attributional Theory 52
Table 2
Study 1: Factor Pattern Coefficients of Responsibility Items
Intended Factor and Item Factor
1. Responsibility: Do you think the driver was to
blame for cutting you off?: Not at all (=1)…Very
much so (=7)
.81
2. Responsibility: How responsible was the driver
for cutting you off?: Extremely responsible (=7)…
Not at all responsible (=1)
.64
3. Responsibility: How accountable do you think
the driver was for cutting you off?: Not at all
accountable (=1)…Extremely accountable (=7)
.81
4. Responsibility: Do you think the driver should
answer for this event (i.e., for cutting you off)?:
Very much so (=7)… Not at all (=1)
.41
Variance accounted for 47%
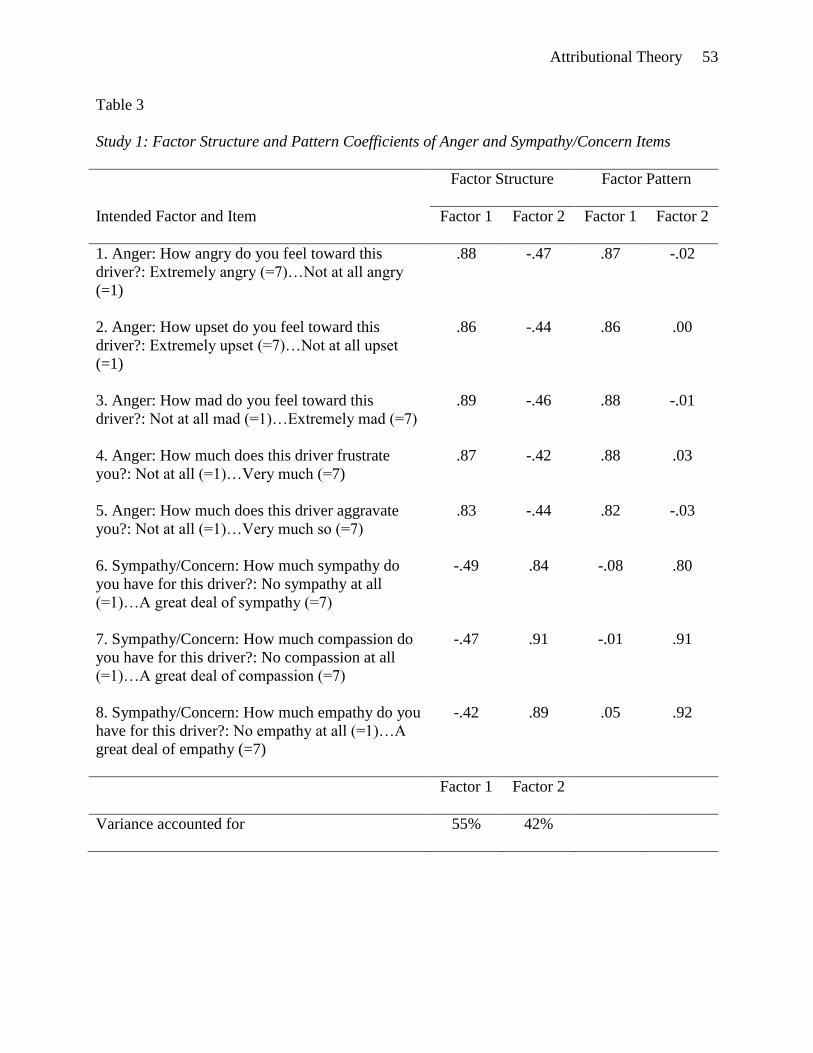
Attributional Theory 53
Table 3
Study 1: Factor Structure and Pattern Coefficients of Anger and Sympathy/Concern Items
Factor Structure Factor Pattern
Intended Factor and Item Factor 1 Factor 2 Factor 1 Factor 2
1. Anger: How angry do you feel toward this
driver?: Extremely angry (=7)…Not at all angry
(=1)
.88 -.47 .87 -.02
2. Anger: How upset do you feel toward this
driver?: Extremely upset (=7)…Not at all upset
(=1)
.86 -.44 .86 .00
3. Anger: How mad do you feel toward this
driver?: Not at all mad (=1)…Extremely mad (=7)
.89 -.46 .88 -.01
4. Anger: How much does this driver frustrate
you?: Not at all (=1)…Very much (=7)
.87 -.42 .88 .03
5. Anger: How much does this driver aggravate
you?: Not at all (=1)…Very much so (=7)
.83 -.44 .82 -.03
6. Sympathy/Concern: How much sympathy do
you have for this driver?: No sympathy at all
(=1)…A great deal of sympathy (=7)
-.49 .84 -.08 .80
7. Sympathy/Concern: How much compassion do
you have for this driver?: No compassion at all
(=1)…A great deal of compassion (=7)
-.47 .91 -.01 .91
8. Sympathy/Concern: How much empathy do you
have for this driver?: No empathy at all (=1)…A
great deal of empathy (=7)
-.42 .89 .05 .92
Factor 1 Factor 2
Variance accounted for 55% 42%

Attributional Theory 54
Note. The factor structure matrix contains the bivariate correlations of the items with the factors.
The factor pattern matrix contains the regression coefficients, indicating the relative importance
of the item to the factor with all other items separated out.
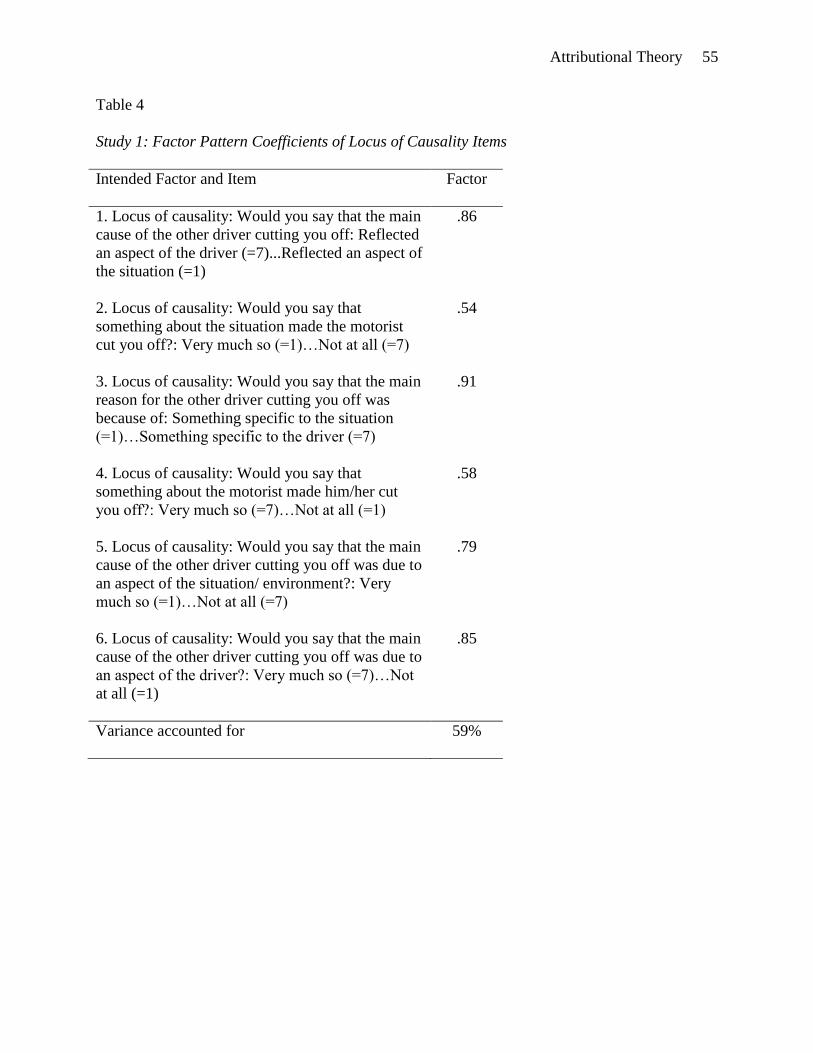
Attributional Theory 55
Table 4
Study 1: Factor Pattern Coefficients of Locus of Causality Items
Intended Factor and Item Factor
1. Locus of causality: Would you say that the main
cause of the other driver cutting you off: Reflected
an aspect of the driver (=7)...Reflected an aspect of
the situation (=1)
.86
2. Locus of causality: Would you say that
something about the situation made the motorist
cut you off?: Very much so (=1)…Not at all (=7)
.54
3. Locus of causality: Would you say that the main
reason for the other driver cutting you off was
because of: Something specific to the situation
(=1)…Something specific to the driver (=7)
.91
4. Locus of causality: Would you say that
something about the motorist made him/her cut
you off?: Very much so (=7)…Not at all (=1)
.58
5. Locus of causality: Would you say that the main
cause of the other driver cutting you off was due to
an aspect of the situation/ environment?: Very
much so (=1)…Not at all (=7)
.79
6. Locus of causality: Would you say that the main
cause of the other driver cutting you off was due to
an aspect of the driver?: Very much so (=7)…Not
at all (=1)
.85
Variance accounted for 59%

Attributional Theory 56
Table 5
Study 1: Factor Structure and Pattern Coefficients for Minor Aggressive and Prosocial Behavior
Items
Factor Structure Factor Pattern
Intended Factor and Item Factor 1 Factor 2 Factor 1 Factor 2
1. Minor aggressive behavior: How likely is it that
you would use your horn and/or flash your lights?:
Not at all likely (=1)…Extremely likely (=7)
.45 -.01 .47 .09
2. Minor aggressive behavior: How likely is it that
you would swear at and/or verbally abuse the other
driver?: Extremely likely (=7)…Not at all likely
(=1)
.82 -.19 .82 -.02
3. Minor aggressive behavior: How likely is it that
you would yell at the other driver?: Not at all
likely (=1)…Extremely likely (=7)
.87 -.15 .87 .03
4. Minor aggressive behavior: How likely is it that
you would gesture (e.g., wave your fist, “give
him/her the finger”) at the other driver?:
Extremely likely (=7)…Not at all likely (=1)
.87 -.22 .86 -.04
5. Minor aggressive behavior: How likely is it that
you would tailgate/follow closely the other driver
in order to teach him/her a lesson?: Not at all
likely (=1)…Extremely likely (=7)
.51 -.29 .47 -.19
6. Prosocial behavior: How likely is it that you
would gesture/signal to the other driver that
everything is okay?: Not at all likely
(=1)…Extremely likely (=7)
-.18 .28 -.13 .25
7. Prosocial behavior: If you saw this driver in
need of assistance further down the road, how
likely is it that you would call to get this driver
help (e.g., tow truck, police)?: Extremely likely
(=7)…Not at all likely (=1)
-.17 .96 .03 .97
8. Prosocial behavior: How likely is it that you
would stop your vehicle and offer assistance to
-.15 .86 .03 .86

Attributional Theory 57
this driver if it were needed further down the
road?: Not at all likely (=1)…Extremely likely
(=7)
Factor 1 Factor 2
Variance accounted for 34% 25%
Note. The factor structure matrix contains the bivariate correlations of the items with the factors.
The factor pattern matrix contains the regression coefficients, indicating the relative importance
of the item to the factor with all other items separated out.

Attributional Theory 58
Table 6
Study 1: Bivariate Correlations and Reliability Analysis
1. 2. 3. 4. 5. 6. 7. 8.
1. Controllability -
2. Intentionality .49 -
3. Locus of
causality
.74
.65
-
4. Responsibility .79 .57 .74 -
5. Anger .53 .54 .57 .57 -
6. Sympathy -.62 -.50 -.59 -.57 -.51 -
7. Aggressive
behavior
.36
.44
.48
.43
.63
-.40
-
8. Prosocial
behavior
-.45
-.31
-.40
-.28
-.28
.53
-.22
-
Number of items
5 4 6 4 5 3 5 3
Coefficient a
.92 .92 .89 .75 .94 .91 .83 .70
Mean
4.73 3.23 3.64 4.49 4.48 3.12 3.50 3.57
SD
1.42 1.52 1.32 1.27 1.40 1.33 1.39 1.45
Note. All correlations are significant at p ≤ .01.
a N = 214.
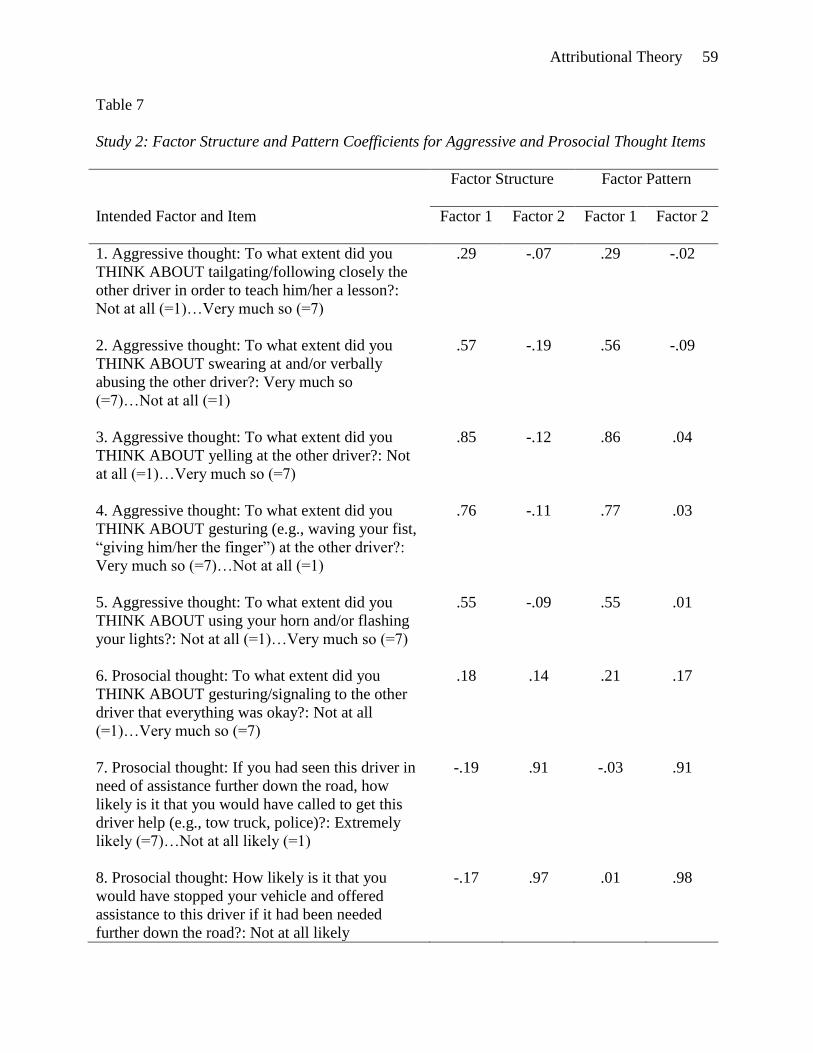
Attributional Theory 59
Table 7
Study 2: Factor Structure and Pattern Coefficients for Aggressive and Prosocial Thought Items
Factor Structure Factor Pattern
Intended Factor and Item Factor 1 Factor 2 Factor 1 Factor 2
1. Aggressive thought: To what extent did you
THINK ABOUT tailgating/following closely the
other driver in order to teach him/her a lesson?:
Not at all (=1)…Very much so (=7)
.29 -.07 .29 -.02
2. Aggressive thought: To what extent did you
THINK ABOUT swearing at and/or verbally
abusing the other driver?: Very much so
(=7)…Not at all (=1)
.57 -.19 .56 -.09
3. Aggressive thought: To what extent did you
THINK ABOUT yelling at the other driver?: Not
at all (=1)…Very much so (=7)
.85 -.12 .86 .04
4. Aggressive thought: To what extent did you
THINK ABOUT gesturing (e.g., waving your fist,
“giving him/her the finger”) at the other driver?:
Very much so (=7)…Not at all (=1)
.76 -.11 .77 .03
5. Aggressive thought: To what extent did you
THINK ABOUT using your horn and/or flashing
your lights?: Not at all (=1)…Very much so (=7)
.55 -.09 .55 .01
6. Prosocial thought: To what extent did you
THINK ABOUT gesturing/signaling to the other
driver that everything was okay?: Not at all
(=1)…Very much so (=7)
.18 .14 .21 .17
7. Prosocial thought: If you had seen this driver in
need of assistance further down the road, how
likely is it that you would have called to get this
driver help (e.g., tow truck, police)?: Extremely
likely (=7)…Not at all likely (=1)
-.19 .91 -.03 .91
8. Prosocial thought: How likely is it that you
would have stopped your vehicle and offered
assistance to this driver if it had been needed
further down the road?: Not at all likely
-.17 .97 .01 .98
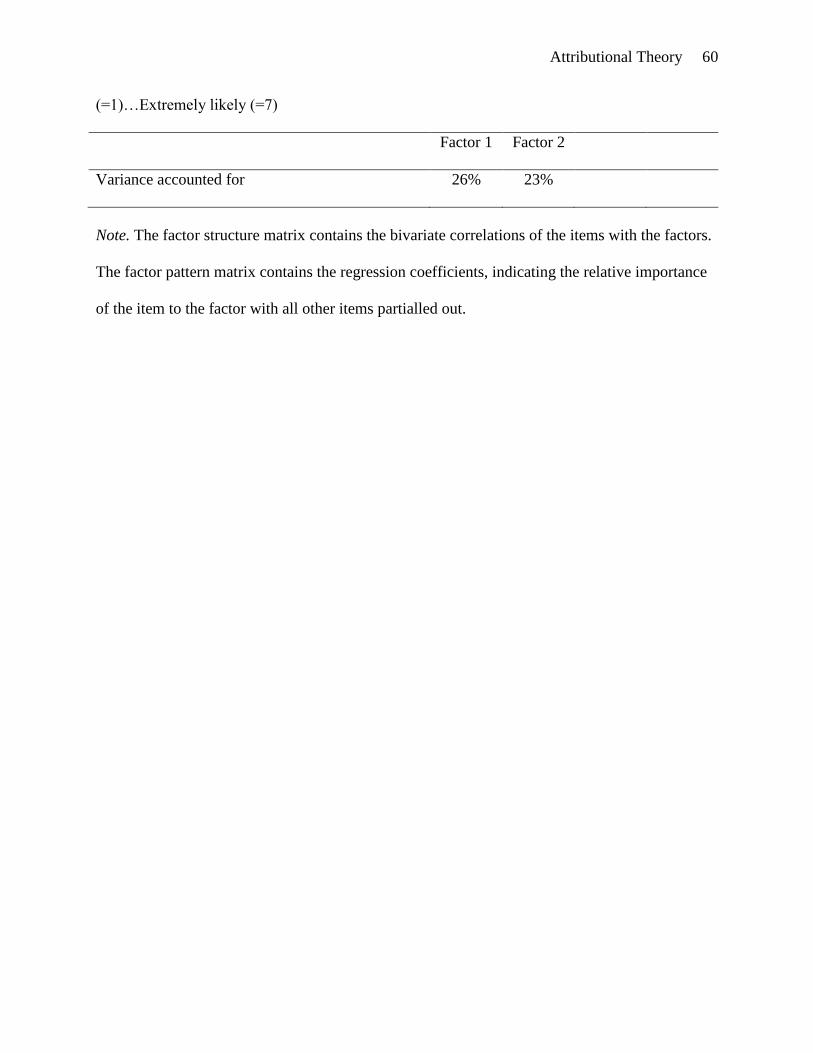
Attributional Theory 60
(=1)…Extremely likely (=7)
Factor 1 Factor 2
Variance accounted for 26% 23%
Note. The factor structure matrix contains the bivariate correlations of the items with the factors.
The factor pattern matrix contains the regression coefficients, indicating the relative importance
of the item to the factor with all other items partialled out.

Attributional Theory 61
Table 8
Study 2: Bivariate Correlations and Reliability Analysis
1. 2. 3. 4. 5. 6. 7. 8. 9. 10.
1. Controllability -
2. Intentionality .15* -
3. Locus of
causality
.38**
.30**
-
4. Responsibility .51** .33** .48** -
5. Anger .27** .25** .25** .52** -
6. Sympathy -.41** -.34** -.33** -.42** -.44** -
7. Aggressive
thoughts
.14
.20**
.12
.30**
.60**
-.19**
-
8. Prosocial
thoughts
-.20**
-.20**
-.16*
-.14
-.08
.27**
-.04
-
9. Aggressive
behavior
-.09
.12
.09
.09
.31**
.03
.57**
.10
-
10. Prosocial
behavior
-.27**
.08
-.13
-.13
.02
.08
.12
.32**
.38**
-
Number of items
5 4 6 4 5 3 5 3 5 1
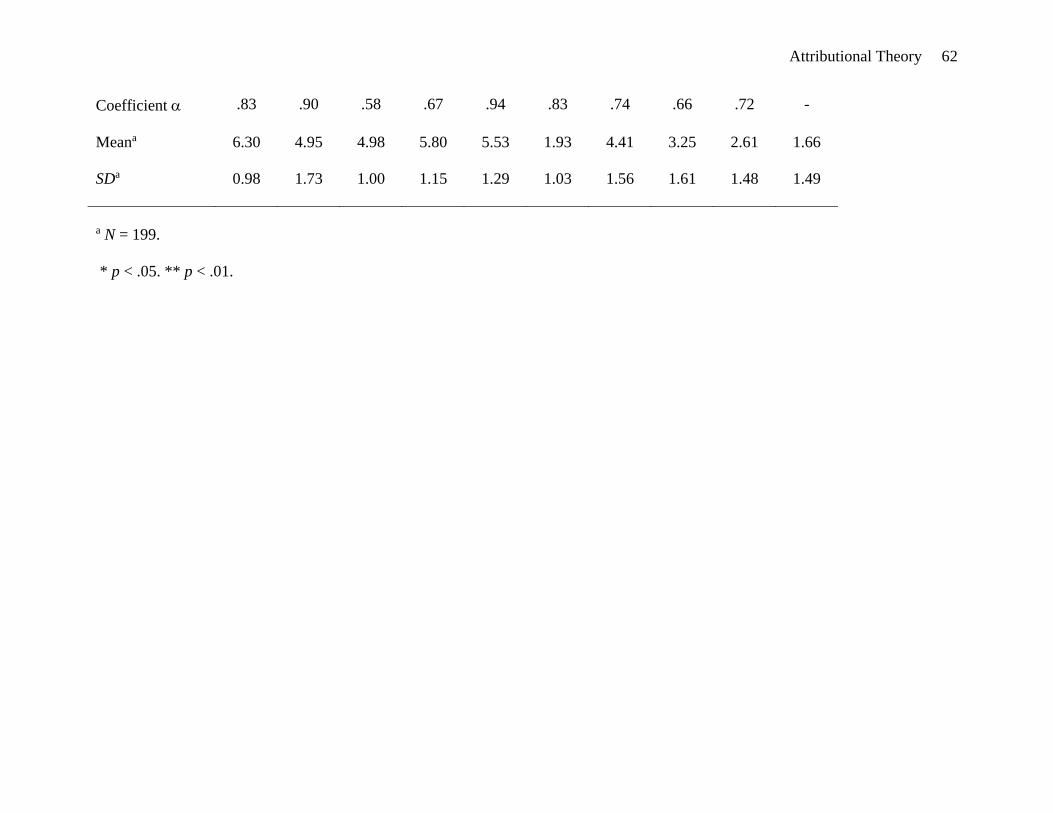
Attributional Theory 62
Coefficient
.83 .90 .58 .67 .94 .83 .74 .66 .72 -
Meana
6.30 4.95 4.98 5.80 5.53 1.93 4.41 3.25 2.61 1.66
SDa
0.98 1.73 1.00 1.15 1.29 1.03 1.56 1.61 1.48 1.49
a N = 199.
* p < .05. ** p < .01.

Attributional Theory 63
Figure 1. Weiner’s attributional theory of social conduct.
Aggressive Behavior
Controllability
Intentionality
Locus of Causality
Responsibility
Anger
Sympathy Prosocial Behavior
Stability
Globality
CAUSAL DIMENSIONS
CAUSAL JUDGMENT
EMOTIONAL RESPONSES
BEHAVIORAL RESPONSES
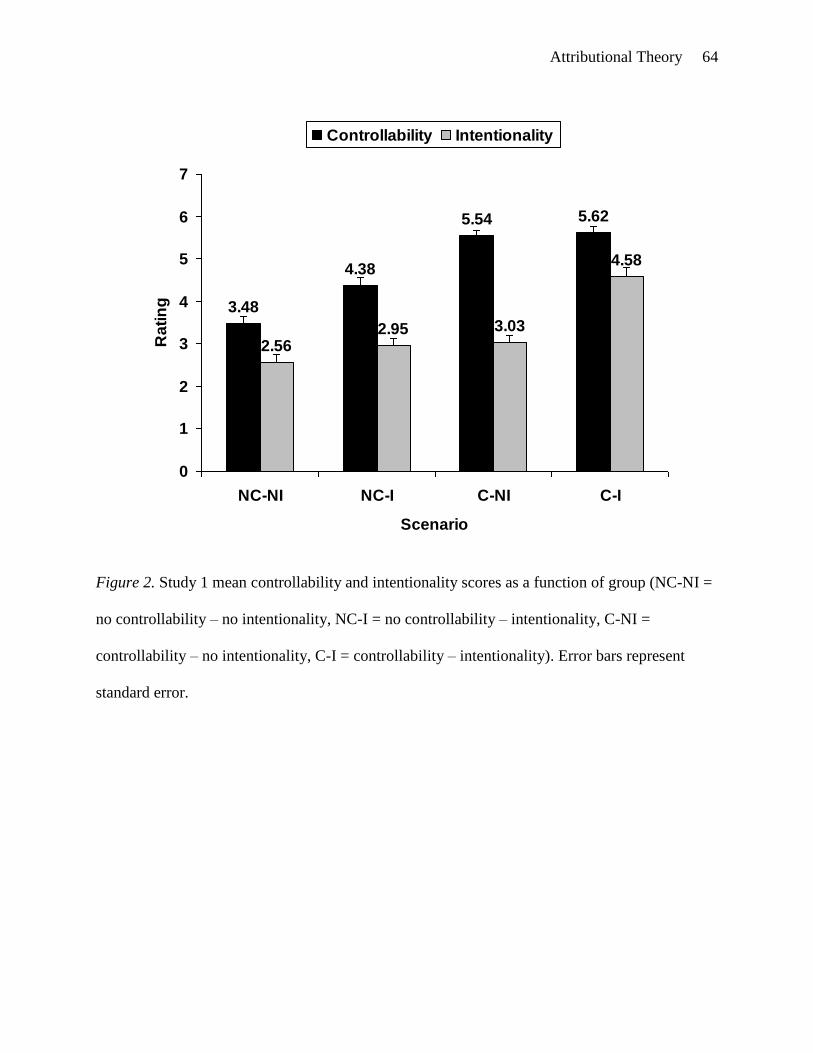
Attributional Theory 64
4.38
5.54 5.62
2.562.95 3.03
4.58
3.48
0
1
2
3
4
5
6
7
NC-NI NC-I C-NI C-I
Scenario
Ra
tin
g
Controllability Intentionality
Figure 2. Study 1 mean controllability and intentionality scores as a function of group (NC-NI =
no controllability – no intentionality, NC-I = no controllability – intentionality, C-NI =
controllability – no intentionality, C-I = controllability – intentionality). Error bars represent
standard error.

Attributional Theory 65
Figure 3. Study 1 attribution model. Standardized coefficients are reported (N = 214).
* p < .05. ** p < .01.
.53**
Aggressive Behavior Controllability
Intentionality
Locus of Causality
Responsibility
Prosocial Behavior
e1 .49**
e2
Anger
e3
Sympathy
e4
.74**
.65**
.25**
.14*
.54**
-.34**
.25**
-.18**
.21*
-.19*
.27**
-.07
.63**
-.17* -.02
e5
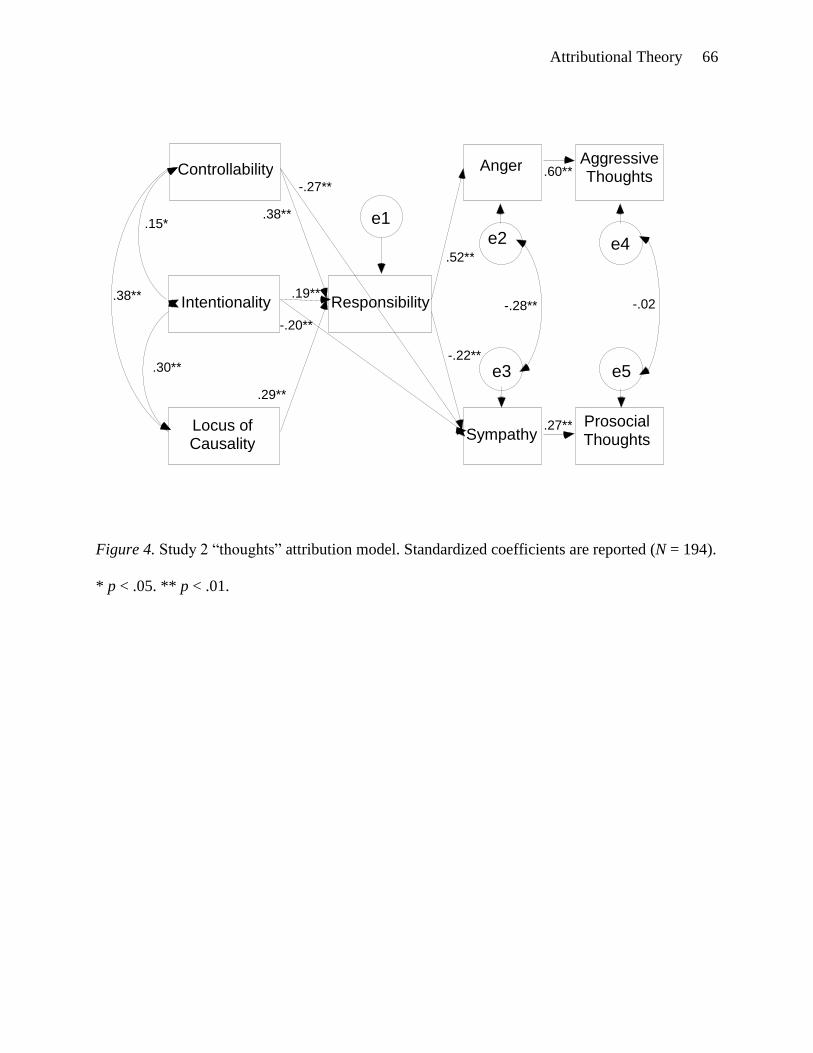
Attributional Theory 66
Figure 4. Study 2 “thoughts” attribution model. Standardized coefficients are reported (N = 194).
* p < .05. ** p < .01.
.27**
Aggressive Thoughts Controllability
Intentionality
Locus of Causality
Responsibility
Prosocial Thoughts
e1 .15*
e2
Anger
e3
Sympathy
e4
.38**
.30**
.29**
.19**
.38**
-.27**
-.20**
.52**
-.22**
.60**
-.28** -.02
e5
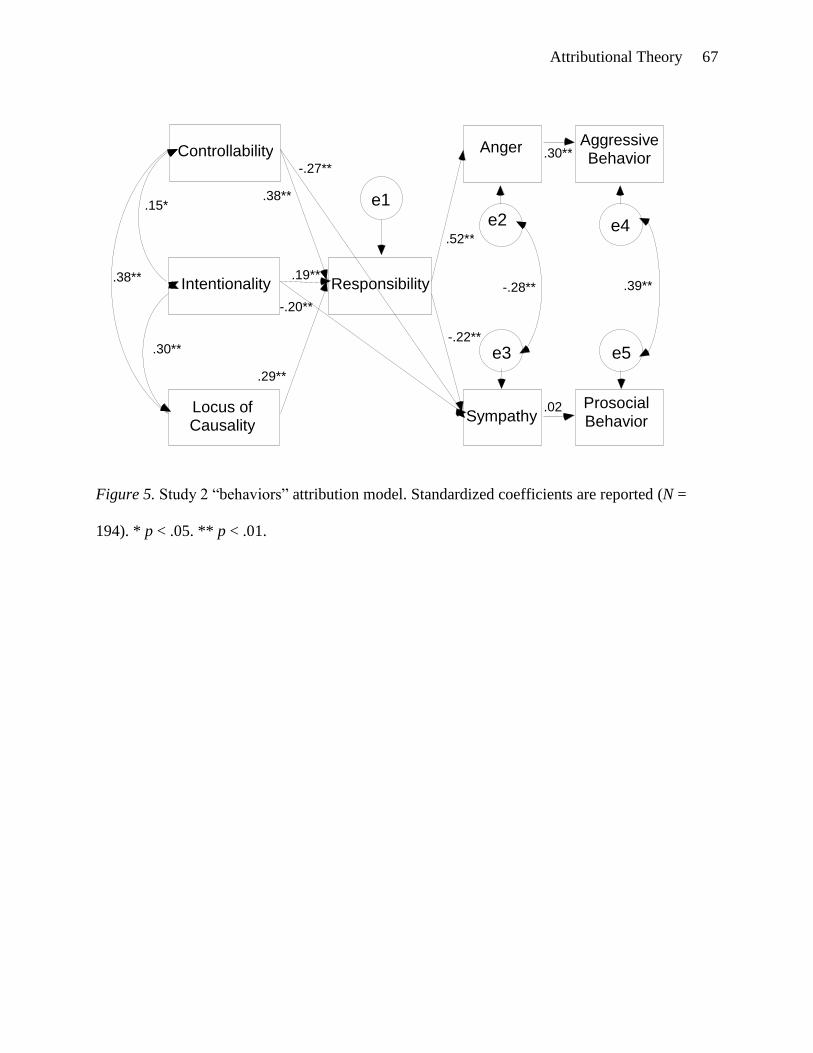
Attributional Theory 67
Figure 5. Study 2 “behaviors” attribution model. Standardized coefficients are reported (N =
194). * p < .05. ** p < .01.
.02
Aggressive Behavior Controllability
Intentionality
Locus of Causality
Responsibility
Prosocial Behavior
e1 .15*
e2
Anger
e3
Sympathy
e4
.38**
.30**
.29**
.19**
.38**
-.27**
-.20**
.52**
-.22**
.30**
-.28** .39**
e5