understanding china’s external portfolio china’s external portfolio brad w. setser and arpana...
TRANSCRIPT

W O R K I N G P A P E R
China’s $1.5 Trillion Bet Understanding China’s External Portfolio
Brad W. Setser and Arpana Pandey May 2009 Update

The Council on Foreign Relations (CFR) is an independent, nonpartisan membership organization, think tank, and publisher dedicated to being a resource for its members, government officials, busi-ness executives, journalists, educators and students, civic and religious leaders, and other interested citizens in order to help them better understand the world and the foreign policy choices facing the United States and other countries. Founded in 1921, CFR carries out its mission by maintaining a diverse membership, with special programs to promote interest and develop expertise in the next generation of foreign policy leaders; convening meetings at its headquarters in New York and in Washington, DC, and other cities where senior government officials, members of Congress, global leaders, and prominent thinkers come together with CFR members to discuss and debate major in-ternational issues; supporting a Studies Program that fosters independent research, enabling CFR scholars to produce articles, reports, and books and hold roundtables that analyze foreign policy is-sues and make concrete policy recommendations; publishing Foreign Affairs, the preeminent journal on international affairs and U.S. foreign policy; sponsoring Independent Task Forces that produce reports with both findings and policy prescriptions on the most important foreign policy topics; and providing up-to-date information and analysis about world events and American foreign policy on its website, CFR.org. The Council on Foreign Relations takes no institutional position on policy issues and has no affilia-tion with the U.S. government. All statements of fact and expressions of opinion contained in its pub-lications are the sole responsibility of the author or authors. For further information about CFR or this paper, please write to the Council on Foreign Relations, 58 East 68th Street, New York, NY 10065, or call the Director of Communications at 212.434.9400. Visit CFR’s website, www.cfr.org. Copyright © 2009 by the Council on Foreign Relations®, Inc. All rights reserved. Printed in the United States of America. This paper may not be reproduced in whole or in part, in any form beyond the reproduction permit-ted by Sections 107 and 108 of the U.S. Copyright Law Act (17 U.S.C. Sections 107 and 108) and excerpts by reviewers for the public press, without express written permission from the Council on Foreign Relations. For information, write to the Publications Office, Council on Foreign Relations, 58 East 68th Street, New York, NY 10065.
1
Introduction
This paper was originally published in January 2009. The May update incorporates quarter one 2009 data on China’s foreign reserves, the Treasury International Capital (TIC) capital flows data for De-cember, January, and February, and the results of the June 2008 survey of foreign portfolio invest-ment in the United States. The June 2008 survey indicated that China bought fewer Treasury bonds and more equities than the authors estimated in the January paper.
China reported $1.95 trillion in foreign exchange reserves at the end of March 2009. This is by far the largest stockpile of foreign exchange in the world: China holds roughly two times more reserves than Japan, and four times more than either Russia or Saudi Arabia. Moreover, China’s true foreign portfolio exceeds its disclosed foreign exchange reserves. At the end of March, the State Administra-tion of Foreign Exchange (SAFE)—part of the People’s Bank of China (PBoC)—managed close to $2.1 trillion: $1.95 trillion in formal reserves and $184 billion in “other foreign assets.” China’s state banks and the China Investment Corporation (CIC), China’s sovereign wealth fund, together man-age another $200 billion or so. This puts China’s total holdings of foreign assets at $2.3 trillion. That is over 50 percent of China’s gross domestic product (GDP), or roughly $2,000 per Chinese inhabi-tant.
The authors estimate based on U.S. data that China holds $1.5 trillion in U.S. assets, implying that dollar assets constitute at least 65 percent of China’s aggregate portfolio, and probably somewhat more. China held close to $760 billion of Treasury bonds (including short-term bills) at the end of March 2009, another $489 billion of agency (Fannie Mae, Freddie Mac, Ginnie Mae, and Federal Home Loan Bank) bonds, $121 billion of U.S. corporate bonds, $104 billion of U.S. equities, and $41 billion in deposits. China holds additional dollar deposits in the international banking system as well as dollar-denominated bonds issued by institutions like the World Bank and other governments.
The pace of growth of China’s foreign assets clearly slowed in the fourth quarter of 2008 and the first quarter of 2009. But it slowed after a period of unprecedented growth. From the middle of 2007 to the middle of 2008, China likely added over $700 billion to its foreign portfolio. That is more than the combined increase in the foreign assets of the world’s oil-exporting countries over the same time period. As a result, China’s government is now by far the largest creditor of the United States: the U.S. data suggests that China lent around $400 billion (roughly $35 billion a month) to the United States in 2008. Never before has a relatively poor country lent out so much money to a relatively rich country. And never before has the United States relied on a single country’s government for so much financing.
China’s outsized impact on global capital flows is a relatively recent development—one directly tied to China’s policy of managing its exchange rate against the dollar. In the 1990s, China did not have to intervene in the currency market on a huge scale to maintain its peg to the dollar. From 1995 onward the dollar, and thus the renminbi, generally was appreciating and China’s overall trade sur-plus remained modest. Direct investment inflows were offset by other kinds of capital outflows. In

2
2000, for example, China added only $15 billion to its reserves. The dollar’s post-2002 depreciation was combined with tight fiscal policy and limits on domestic lending by the state banks to offset the inflationary impact of China’s depreciated currency. This resulted in a large increase in China’s trade and current account surplus. The current account surplus reached 11 percent of China’s GDP in 2007—and its expansion drove most of the growth in China’s reserves.
The enormous growth of China’s reserves also reflected increased capital inflows into China. Sig-nificant speculative inflows began to emerge in 2003—when the dollar’s depreciation began to gen-erate expectations that China would not retain its dollar peg. The scale of those speculative inflows, however, increased dramatically over the course of 2007 and the first part of 2008. China, which was experiencing inflationary pressures, allowed the renminbi to appreciate against the dollar. Moreover, it did not match the U.S. rate cuts that followed the August 2007 subprime crisis. So long as Chinese interest rates were higher than U.S. interest rates, the renminbi was appreciating against the dollar and Chinese growth far exceeded U.S. growth, speculators found holding the renminbi more attrac-tive than holding the dollar. This has clearly changed in the fourth quarter of 2008. China’s growth has decelerated rapidly. The foreign exchange market now anticipates that the renminbi will depre-ciate against the dollar—in part because of the dollar’s surprising recent appreciation. Speculative inflows have turned into outflows, bringing down the pace of growth in the foreign assets of China’s government.
However, the global slump hasn’t brought China’s surplus down. So far, the fall in China’s import bill has exceeded the fall in its exports, as China has benefited from the fall in commodity prices. So long as China continues to run a large current account surplus, the basis for ongoing growth in Chi-na’s reserve remains. Should speculative outflows slow, reserve growth should resume. China’s im-pact on the global flow of funds remains hard to overstate.
This paper aims to summarize current knowledge about the size and composition of China’s ex-ternal portfolio in order to get a better sense of China’s impact on global markets. The methodology is simple: it compares Chinese data on holdings of foreign assets with U.S. data on China’s holdings of U.S. assets. However, the data sources on both sides of the ledger—China’s stated foreign ex-change reserves and the U.S. Treasury’s monthly data on Chinese purchases—understate China’s true reserves and its true purchases of U.S. assets. Consequently, the authors have adjusted China’s reserves data for China’s hidden reserves and adjusted the U.S. Treasury International Capital data for China’s purchases through London and Hong Kong. These adjustments, incidentally, have a big-ger impact on data from mid-2004 to mid-2008 than on the current data; the reallocation of China’s portfolio toward safe assets (specifically, short-term Treasury bills) after the Lehman crisis has meant that an unusually high fraction of China’s purchases of U.S. assets shows up directly in the U.S. Trea-sury International Capital data.

3
Secrets of SAFE and the CIC
China’s foreign exchange reserves totaled $1.95 trillion at the end of March 2009.1 Among China watchers—though not among the broader public or the market—it is well known that China’s cen-tral bank also holds a large quantity of foreign assets that is not reported as part of its reserves.
The “other foreign assets”2—a line item in the PBoC’s balance sheet—rose from $14 billion ($13.8 billion) in June 2007 to an astounding $219 billion in June 2008. They fell to $184 billion at the end of February, with most of the fall coming in October. The authors assume that these assets remained roughly constant in March. Adding these foreign assets to China’s stated reserves bring the PBoC’s disclosed foreign assets to approximately $2.14 trillion at the end of the first quarter of 2009 (see Figure 1).
Figure 1: Chinese Foreign Assets (including hidden reserves)
Sources: SAFE and PBoC.

4
The PBoC’s “other foreign assets” correspond with the mandatory reserves that China’s banks are holding in dollars. Since August 2007, China’s commercial banks have been required to deposit re-serves in the form of foreign exchange. These funds are counted as external assets in the PBoC’s bal-ance sheet and seem to be managed by SAFE—not by the commercial banks. As a result, they are, for all intents and purposes, foreign exchange reserves. When the reserve requirement rose, the PBoC’s “other foreign assets” rose. Now that the reserve requirement is falling, “other foreign assets” are fall-ing. December is an exception; the large fall in the reserve requirement wasn’t matched by a fall in the PBoC’s other foreign assets, as the bank’s renminbi reserve requirement was apparently reduced.
The PBoC also reports (on its Mandarin-language site) the aggregate data on the state banks for-eign currency balance sheet. As Figure 2 shows, from mid-2007 onward, the change in the line item “purchases and sales of foreign exchange”3 corresponds closely with the growth in the PBoC’s other foreign assets. This almost certainly reflects the currency hedges China’s state banks received in ex-change for holding a portion of their mandatory reserves in dollars. In effect, the state banks bought dollars—reducing China’s reported reserve growth—with a portion of their mandatory reserves and placed those reserves on deposit at the central bank, where they were reported as other foreign as-sets. The state banks in return received protection against any future currency moves.
Figure 2: Increase in Central Banks’ “Other Foreign Assets” vs. Increase in “Purchases and Sales” of Foreign Exchange
Sources: PBoC and authors’ estimates.
5
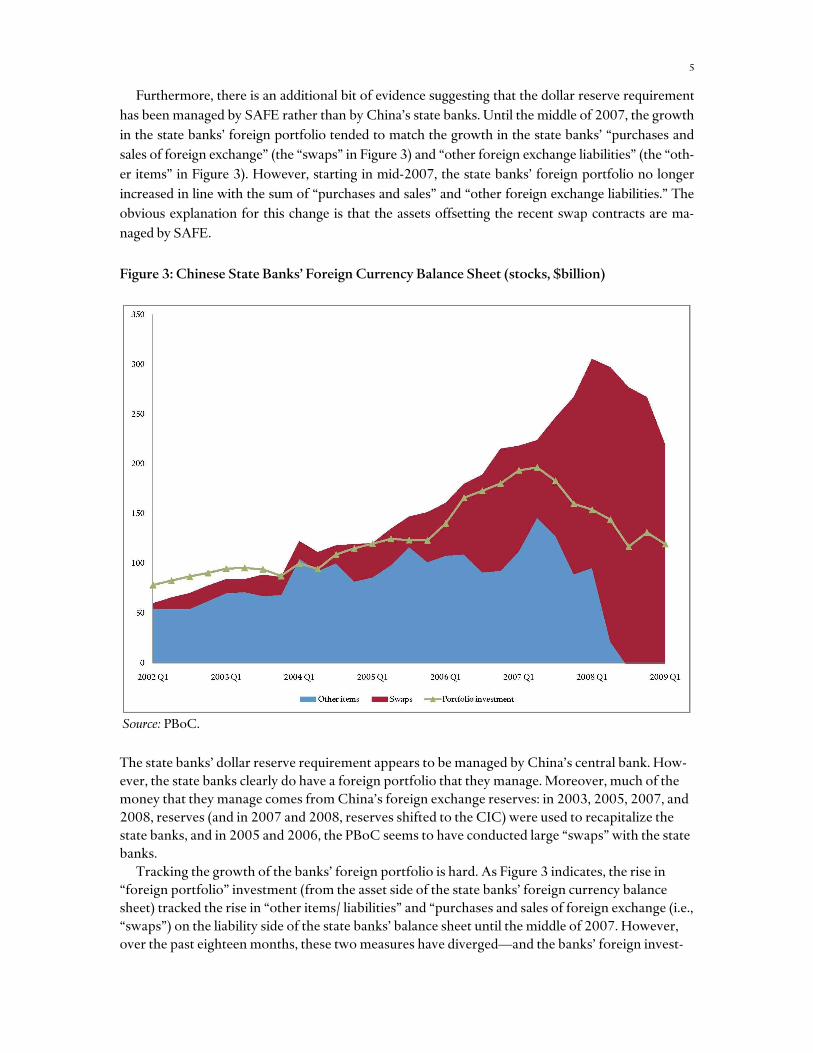
Furthermore, there is an additional bit of evidence suggesting that the dollar reserve requirement has been managed by SAFE rather than by China’s state banks. Until the middle of 2007, the growth in the state banks’ foreign portfolio tended to match the growth in the state banks’ “purchases and sales of foreign exchange” (the “swaps” in Figure 3) and “other foreign exchange liabilities” (the “oth-er items” in Figure 3). However, starting in mid-2007, the state banks’ foreign portfolio no longer increased in line with the sum of “purchases and sales” and “other foreign exchange liabilities.” The obvious explanation for this change is that the assets offsetting the recent swap contracts are ma-naged by SAFE.
Figure 3: Chinese State Banks’ Foreign Currency Balance Sheet (stocks, $billion)
Source: PBoC. The state banks’ dollar reserve requirement appears to be managed by China’s central bank. How-ever, the state banks clearly do have a foreign portfolio that they manage. Moreover, much of the money that they manage comes from China’s foreign exchange reserves: in 2003, 2005, 2007, and 2008, reserves (and in 2007 and 2008, reserves shifted to the CIC) were used to recapitalize the state banks, and in 2005 and 2006, the PBoC seems to have conducted large “swaps” with the state banks.
Tracking the growth of the banks’ foreign portfolio is hard. As Figure 3 indicates, the rise in “foreign portfolio” investment (from the asset side of the state banks’ foreign currency balance sheet) tracked the rise in “other items/ liabilities” and “purchases and sales of foreign exchange (i.e., “swaps”) on the liability side of the state banks’ balance sheet until the middle of 2007. However, over the past eighteen months, these two measures have diverged—and the banks’ foreign invest-

6
ment portfolio has fallen significantly (it fell from a peak of $196 billion in quarter two of 2007 to around $131 billion at the end of quarter four of 2008 and $119 billion in quarter one of 2009). On the other hand, the PBoC’s data also show a rise in the state banks (net) position with overseas counterparties—which suggests that some of the funds freed by the sale of foreign securities in the state banks’ investment portfolio has been retained abroad.
At the end of March, the PBoC’s data shows the state banks hold $119 billion in foreign portfo-lio investments and have a $80 billion net position from “business with overseas counterparties” (with roughly $100 billion in assets and $20 billion in liabilities). This implies total offshore hold-ings of up to $200 billion. At the start of the PBoC’s data on the foreign currency position—in ear-ly 2002—the state banks had roughly $80 billion in debt securities and $50 billion in (net) business with overseas counterparties. Some of these investments could reflect funds the Bank of China was then managing for the State Administration of Foreign Exchange. To avoid double counting, the authors’ measure of the “hidden” reserves in the state banks is consequently the change in the sum of the banks’ foreign securities portfolio and their net business with overseas counterparties since the first quarter of 2002. This is more likely to understate than to overstate the foreign exchange managed by the state banks, and thus more likely to understate than overstate China’s total foreign assets. The authors effectively have assumed the state banks have managed around $100 billion of China’s reserves from 2002 on.4
In 2007 China also created the China Investment Corporation to manage a portion of China’s foreign assets. Dedicated bond sales raised 1.550 trillion renminbi, or $207.9 billion, for the CIC5.
However, $67 billion of this total was used to purchase Central Huijin—the PBoC’s bank recapitali-zation vehicle. This effectively was a domestic transaction. It did, however, reduce the funds the CIC had to invest abroad. In the fourth quarter of 2007, the CIC injected $20 billion into China Devel-opment Bank (CDB) and another $3 billion into China Everbright Bank—and it recently injected another $19 billion into the Agricultural Bank of China (ABC). This left the CIC with roughly $100 billion to invest abroad. In 2007 it took significant equity stakes in Blackstone (a U.S. private equity fund) and Morgan Stanley—and in 2008 it contributed to a private equity fund managed by J. C. Flowers & Co. All have performed badly. But the majority of its assets apparently were held in mon-ey market funds (including the ill-fated Reserve Primary Fund) and bank deposits.
Table 1: Estimated Foreign Assets of China’s Government (in U.S. $billions)
Quarter One 2009
FX Reserves (managed by SAFE) $1,953
“Other foreign assets” of PBoC (managed by SAFE) $184
State banks $70–$2006
CIC (excluding assets managed by state banks) $90–$100
Total $2,297–$2,437
Sources: PBoC, SAFE, and authors’ estimates.
The effect of these shifts show up clearly in Figure 4, which plots the twelve-month change in the foreign assets of the People’s Bank of China. There is a noticeable dip in late 2003—when $45 billion was shifted to the state banks. There is a second dip in 2006, when the PBoC’s foreign assets failed to grow along with China’s current account surplus. There is another dip in the first quarter of 2008,

7
when the CIC likely bought a substantial sum of foreign exchange from the PBoC. The fall in the fourth quarter of 2008, by contrast, reflects a sudden slowdown in the actual pace of foreign asset growth, as private capital started to move out of China.
Figure 4: Reserve Growth (PBoC, rolling 12-month sums)
Sources: PBoC and authors’ estimates.
Adjusting for changes in the state banks’ foreign portfolio and the transfer of foreign exchange to the CIC data smoothes out some of the gaps—and presents a more accurate picture (the authors hope) of the growth in China’s foreign portfolio.

8
Figure 5: Chinese Foreign Asset Growth, Including State Banks and CIC (rolling 12-month sums, $billion)
Sources: PBoC, SAFE, and authors’ estimates.
These calculations imply that China added over $700 billion to its foreign assets during its peak period of accumulation. From the end of September 2007 to the end of September 2008, – SAFE’s portfolio increased by $630 billion ($660 billion after adjusting for valuation losses)
—$470 billion from reserves and $160 billion from the increase in other foreign assets; – The CIC’s foreign portfolio increased by $95 billion—with most of the increase coming in the
first quarter; and – The states banks that were reducing their foreign portfolio investments after the August 2007
subprime crisis reduced their total foreign holdings by roughly $20 billion. The main potential source of error in this calculation comes from the state banks. This, though, is a
fairly modest potential source of error. China’s foreign asset growth from September 2007 to September 2008 certainly topped $650 billion—and is unlikely to have exceeded $750 billion (See figure 6).
Since September, China’s accumulation of foreign assets has clearly slowed. Over the last four quarters, from quarter two 2008 to quarter one 2009: – Reported reserves increased by $271.5 billion and other foreign assets rose by $42.1 billion, for a
net increase of only $313.6 billion. After adjusting for changes in the value of China’s existing euros, pounds, yen and other nondollar reserve assets, China’s central bank likely added $427 bil-

9
lion to its foreign portfolio—as the euro’s fall against the dollar offset some of the underlying in-crease in SAFE’s foreign portfolio.
– The CIC’s foreign portfolio fell by $19 billion, as the transfer of funds to the China Development Bank and the Agricultural Bank of China exceeded new inflows (this calculation assumes that the CIC received a bit of foreign exchange in the second quarter of 2008).
– The state banks’ foreign portfolio fell by $12 billion, with—based on the PBoC’s data—the banks selling their foreign securities portfolio despite the transfer of foreign exchange from the CIC.
The flows associated with the state banks—along with the precise timing of the transfer of funds
to CIC—are the largest potential source of effort. But there is no doubt that the pace of China’s for-eign asset growth has slowed.
Figure 6: Chinese Foreign Asset Growth: Two Estimates (rolling 12-month sums, $billion)
Sources: PBoC and authors’ estimates.

10
Following China’s Money
Tracking the growth in China’s foreign portfolio is far easier than tracking changes in the composi-tion of China’s foreign portfolio. China’s reported reserves still account for the majority of its foreign assets—and it reports data on its total reserves every quarter. China’s net international investment position data provides—with a long lag—additional data on China’s other foreign assets. By contrast, no Chinese data set provides any insight into the composition of China’s foreign portfolio.
Tracking changes in the composition of China’s foreign portfolio consequently requires using data from the U.S. Treasury—which reports on foreign portfolio investment in U.S. securities. No comparable data series exists for the euro zone or the UK—China’s European portfolio has to be inferred from the gap between its U.S. portfolio and China’s total portfolio. As both estimates are subject to inaccuracy—and China clearly holds some yen, won, Hong Kong dollars, Canadian dol-lars, and Australian dollars—there is a large margin of error.
Moreover, the monthly U.S. data on China’s purchases of U.S. debt is incomplete. The monthly U.S. data only registers the initial sale of a U.S. security to a foreign investor—not any subsequent sales. As China is thought to purchase U.S. debt through third countries like the UK, the monthly data consequently understates China’s true purchases. Guessing China’s U.S. portfolio in turn re-quires estimating just how many of the Treasury bonds, agency bonds, and equities sold by American investors to private investors in various financial centers—notably UK and Hong Kong—have then been sold on to China.
Fortunately, the United States produces two data sets that can be used to estimate China’s hold-ings—the monthly data on China’s purchases and the annual survey of foreign portfolio holdings of U.S. securities. Over the past few years, the annual survey of foreign portfolio investment in the United States has indicated a far larger rise in China’s holdings of Treasury and agency bonds than implied by summing up China’s monthly purchases. The recently released June 2008 survey data was no exception: it revised up China’s holdings of Treasury bonds, agency bonds, and equities. While the survey data does provide vital clues about China’s holdings of U.S. securities, it is by no means a per-fect estimate. For example, the survey data—for reasons that are explained later—doesn’t seem to capture China’s full holdings of U.S. corporate bonds. Both the June 2007 and June 2008 surveys showed a smaller rise in China’s corporate bond portfolio than the monthly flow data implied. The survey data nonetheless provides the basis for setting a lower limit on China’s U.S. holdings. We know that China held $521.9 billion in long-term treasuries and another $13.2 billion in short-term treasuries in June 2008. The monthly Treasury International Capital (TIC) data since then sug-gests that China has bought an additional $209 billion of treasuries, bringing its total holdings up to $744 billion. The June 2008 survey indicates that China held $527.1 billion in long-term agencies and another $16.9 billion in short-term agencies. It has since sold $45 billion, reducing its total hold-ings of agencies to $499 billion. China also has $48 billion in bank deposits.
The June 2008 survey also indicates that China held $26.2 billion in long-term corporate bonds and $99.5 billion in equities. The February TIC data indicates that since then it has bought $1 billion

11
of corporate bonds and sold $0.4 billion of equities, bringing its holdings of corporate bonds to at least $27 billion and its holdings of equities to $99 billion. The $1.4 trillion in Chinese investment in the United States that can be identified in the U.S. data is around 62 percent of China’s total estimated portfolio. That is likely to too low though, as it is like-ly that the survey isn’t picking up all of China’s holdings—in particular its holdings of corporate bonds. The authors consequently believe that the United States’ true share of China’s broad portfolio is above 65 percent, and that the dollar’s share would be a bit higher than that.
Since June 2008, an unusually large share of China’s purchases have shown up in the monthly TIC data, as China has been buying little other than Treasury bills. The U.S. data currently provides a rea-sonably accurate picture of China’s total holdings.
However, over most of the past several years, the survey data has indicated that China bought more U.S. securities than implied by summing up the flows in the monthly TIC data. Using the monthly TIC data to get an accurate real-time picture of China’s holdings of U.S. assets in the period in between the surveys consequently has required estimating the likely revisions to the U.S. data. Re-cent survey data has tended to revise the holdings of the UK, and to a lesser degree, Hong Kong, down even as China’s holdings have been revised up.
The authors’ model of China’s current portfolio effectively adds some Hong Kong and UK pur-chases to China’s recorded purchases. To estimate the size of the needed adjustment, the authors ex-amined the pattern of past revisions for the survey data. First the authors looked at how the survey data revised up China’s Treasury holdings and then an estimate was produced that redistributed some purchases from the UK and Hong Kong to China to match the adjustment that comes from the survey. As Table 3 indicates, the June 2007 survey revised China’s holdings of Treasury bonds up by $73.8 billion and agency bonds up by $70.2. The June 2008 survey revised China’s holdings of Trea-sury bonds up by only $28.3 billion and agency bonds up by a significant $85.6 billion. Based on this revision, it is estimated that between mid-2006 and mid-2007, China accounted for 59 percent of Treasury purchases through London and 92 percent of agency purchases through London and Hong Kong. From mid-2007 onward, however, China accounted for only 12 percent of Treasury purchas-es through London and 56 percent of agency purchases through London and Hong Kong. China, consequently, bought significantly fewer treasuries from the middle of 2007 to the middle of 2008 than the authors estimated in January on the basis of the June 2007 survey. China however, remained a large buyer of agencies.
Table 3: Survey Revisions of China’s Holdings of U.S. Assets ($billion)
June 2006 June 2007 June 2008 Treasury bonds (including short-term)
+$36.9 +$73.8 +$28.3
Agency bonds (including short-term)
+$49.5 +$70.2 +$85.6
Corporate bonds -$5.9 -$62.3 -$42.7 Equities +$1.6 +$24.3 +$59.5 Total +$82.1 +$106.6 +$97.1 Total excluding corporate bonds
+$88 +$168.3 +$156.6
Source: TIC.

12
The authors’ methodology for estimating China’s current holdings of U.S. corporate bonds (a cat-egory that includes asset-backed securities that are not guaranteed by one of the agencies/ government sponsored enterprises) is—bizarrely—the opposite of the methodology for estimating China’s current holdings of U.S. Treasury and agency bonds. While the survey data revises China’s holdings of treasuries and agencies up, it tends to revise China’s holdings of corporate bonds down. The authors consequently estimated China’s current holdings of long-term corporate bonds by simp-ly summing up China’s net purchases over the past five years. This misses amortization payments that have reduced China’s holdings over time—but it also misses any purchases through offshore financial centers.
While this methodology seems ad hoc, the authors believe that it is reasonable. China seems to make use of U.S. custodians6—including the Federal Reserve Bank of New York—for the majority of its Treasury and agency portfolio. However, the New York Fed doesn’t offer custodial services for corporate bonds—and for its corporate portfolio, China likely makes use of a non-American custo-dian.
Figure 7: Estimated U.S. Share of China’s Portfolio ($billion)
Sources: TIC and authors’ estimates.
This would explain why China’s corporate bond holdings disappear from the U.S. survey data, as the survey only captures bonds held by U.S. custodians. Total Chinese purchases of U.S. corporate bonds in the TIC data over the past four years add up to around $130 billion—a sum that likely pro-vides a more realistic baseline for evaluating China’s exposure to riskier U.S. debt than the $26.3 bil-

13
lion total in the June 2008 survey. The survey data indicates that China only purchased $1.3 billion in corporate bonds between mid-2007 and mid-2008, whereas the TIC data indicates that China bought about $45 billion during this period. The data suggests that China hasn’t been using a U.S. custodian since 2006. The June 2006 survey data suggests that China has sold about $32 billion of long-term corporate bonds while the monthly TIC data implies about $77 billion of purchases.
One side note: it is possible that a disproportionate share of Chinese purchases of U.S. corporate bonds (a balance-of-payments category that includes all “private” U.S. asset-backed securities”) came from Chinese state banks. If so, that would imply large purchases—more than what shows up in the U.S. data—in 2006, a year when “private” Chinese actors added $100 billion to their foreign debt portfolio. After mid-2007, state banks scaled back their holdings of portfolio debt— presumably as a result of the large losses they incurred on their portfolio. However, total purchases of corporate bonds remained significant until August. That suggests that SAFE continued to buy corporate bonds after the state banks scaled back.
Finally, the survey data indicates that China held $99.5 billion of U.S equities at the end of June 2008, up over $70 billion from the end of June 2007. China’s purchase of equity in Blackstone and Morgan Stanley shows up clearly in the U.S. data. But that is only about $8 billion in total purchases. Most of the remaining $62 billion did not show up directly in the monthly TIC data.
However, the pattern of survey revisions suggests that most of China’s equity purchases took place through Hong Kong. The June 2008 survey data revised Hong Kong’s equity holdings down by $44 billion even as it increased China’s holdings by around $60 billion. Close examination of the TIC data shows that Hong Kong’s purchases of U.S. equities surged in the spring of 2007, and large pur-chases through Hong Kong didn’t come to an end until July 2008. Moreover, the rise in purchases of U.S. equities through Hong Kong—a rise that coincided with reports that SAFE’s Hong Kong sub-sidiary bought stakes in Australian banks and a host of British firms—preceded the creation of the China Investment Corporation. It consequently seems likely that from January 2007, China’s leader-ship authorized SAFE to increase the share of its portfolio invested in equities at the same time that it created the CIC.

14
Figure 8: Increase in Risk Appetite Preceded Transfer of Funds to CIC (12-month change in adjusted stock, $billion)
Sources: TIC, PBOC, and authors’ estimates.
Of course, the market value of China’s equities has fallen significantly since June. SAFE reportedly
doesn’t mark its bond or equity portfolio to market. The authors’ estimates for China’s equity hold-ings reflect SAFE’s practices—not the portfolio’s current market value. If the authors marked the value of China’s equities down, they also would need to mark the value of China’s reserves down.
All this sleuthing produces an estimate of China’s total holdings of U.S. assets of around $1.523 trillion at the end of February 2009—around 66 percent of China’s total estimated portfolio.

15
Table 2: Chinese Holdings of U.S. Assets (end February 2009, $billion)
Known U.S. holdings
Estimated U.S. holdings
Bank deposits $48. 4 $48.4 Treasury bonds (including short-term) $744 $752 Agency bonds (including short-term) $499 $495 Corporate bonds $27.3 $124 Equities $99.1 $104 Total $1,418 $1,523 Chinese foreign assets (estimate) $2,297 $2,297 U.S. share (estimate) 62 percent 66 percent
Sources: U.S. Treasury data, authors’ estimates.
China’s dollar exposure should be a little higher. For example, China holds dollar-denominated bonds issued by Costa Rica. It also has some dollars on deposit in the global banking system that will not show up in the U.S. data. There is a risk, though, that changes in the way China is managing its reserves—and the huge rise in China’s T-bill portfolio suggests something has changed—are leading the authors either to overestimate or to underestimate China’s holdings. The surge in Chinese de-mand for treasuries in the fall of 2008 and the associated rise in the implied dollar share of China’s portfolio is, for example, potentially evidence that the authors’ methodology understated China’s purchases from mid-2007 to mid-2008 (Figure 9). One potential explanation for the sharp rise is simple: China shifted funds over to private fund managers before September and then pulled its funds out of private management after Lehman’s collapse. The June 2008 survey indicated that China held very few assets in U.S. funds, whether equity mutual funds or money market funds. That is at odds with press reports that suggest that the China Investment Corporation kept the majority of its foreign portfolio in cash and cash-equivalents, including U.S. money market funds. For example, the CIC’s $5 billion investment in the Reserve Primary fund—the fund that famously “broke the buck” in the fall of 2008—exceeds all recorded Chinese holdings of “funds” in the June 2008 U.S. data. The period of 2007 to 2008 was marked by huge institutional changes in the way China manages its for-eign assets—changes that made it harder to track the growth in China’s portfolio. However, there is little doubt China now holds an enormous quantity of U.S. bonds.

16
Figure 9: China’s Estimated U.S. Holdings
Sources: TIC and authors’ estimates.

17
China Now Accounts For a Majority of Official Flows
China’s purchases can be compared to both total foreign purchases of U.S. assets and to total pur-chases of U.S. assets by “official” investors (central banks and sovereign funds). The U.S. data tends to understate total official purchases. However, the same methodology that also allows the estima-tion of Chinese purchases can also be applied to official purchases. The same assumption is made that was made for China: a lot of “private” demand for treasuries and agencies from the UK and Hong Kong should be reattributed to central banks.7
This methodology passes an obvious test—it is consistent, broadly speaking, with the Fed’s cus-todial data (see Figure 10).
Figure 10: Estimated Purchases of U.S. Treasury and Agency Bonds vs. FRBNY Custodial Accounts (12-month sum, $billion)
Sources: TIC, FRBNY, and authors’ estimates.

18
The authors also adjusted the data for Japan and the Asian oil exporters—the balance-of-payments category in the U.S. data that corresponds with the Gulf—to allow easy comparison to the adjusted Chinese data. The data for the Gulf—even after the adjustment—almost certainly understates the Gulf’s true impact on the market over much of this period, as it doesn’t capture the increase in money managed by private fund managers for Gulf-based investors.
The resulting data can be presented in a host of different ways. At the suggestion of Peter Good-man of the New York Times, the authors opted to present the data as average monthly purchases rather than as a twelve-month sum, as that allows easy comparison with the monthly trade deficit. Using the average over twelve months of data has the advantage of smoothing out the volatility in high-frequency indicators; using the average over a shorter period, though, can better capture impor-tant swings. Neither measure is perfect.
Three things jump out. First, official demand for treasuries and agencies has, over the past twelve months, almost matched the U.S. trade deficit. That is likely to change soon, as global reserve growth slowed sharply in the fourth quarter. But there is little doubt that official demand for U.S. assets allowed the United States to sustain large deficits for about a year after private demand for U.S. assets collapsed. Think August 2007 to August 2008 (see Figure 11).
Figure 11: Average Monthly Official Purchases of Treasuries and Agencies vs. U.S. Trade Deficit (rolling 12-month averages, $billion)
Sources: TIC, BEA, PBoC, and authors’ estimates.

19
Second, China now accounts for both a very large share of all official purchases and a large share of the total financing the United States needs to sustain its trade and current account deficits. In an average month, Chinese purchases of treasuries and agencies have provided about half of the financ-ing the United States needs to sustain its trade deficit (in the absence of private outflows). Looking ahead, it is possible that China will soon account for a larger share of total flows—as the overall defi-cit is shrinking while China’s trade surplus remains large (see Figure 12).
Figure 12: Average Monthly Chinese Purchases of U.S. Treasuries and Agencies vs. U.S. Trade Deficit (rolling 12-month averages, adjusted data, $billion)
Sources: TIC, BEA, and authors’ estimates.
Third, available data suggests that China has scaled up its investment in Treasury bills and bonds quite significantly over the past few months even as China’s reserve growth has slowed. In October alone, China added at least $68 billion to its Treasury portfolio while reducing its exposure to other kinds of U.S. debt. In the fourth quarter, China bought $122 billion of treasuries—almost all short-term bills—while reducing its holdings of agency bonds by $35 billion. TIC data is only available through February, but the New York Federal Reserve’s custodial data indicates that foreign central banks—including SAFE—continue to shift away from agencies toward treasuries throughout the first quarter. This shift is only starting to show up in data that averages estimated purchases over the past twelve months. It shows up clearly, though, in a plot of estimated average purchases over the past three months (see Figure 13). Between September and December, average monthly purchases of treasuries and agencies exceeded $40 billion. This shift almost certainly reflects a decision by China’s

20
government to move away from risky assets after Lehman’s default and a series of politically embar-rassing losses on China’s investments in U.S. and European financial institutions.
During these months, China’s purchases on U.S. assets exceeded the increase in the foreign assets
of China’s government, strong evidence that China was reallocating its portfolio away from risky asset toward treasuries—and from private custodians to the New York Federal Reserve. In January and February, China’s purchases slowed—and have been broadly in line with China’s reserve growth. China’s rhetoric questioning the safety of its dollar assets hasn’t been matched by a realloca-tion of its portfolio away from the dollar. Available data suggest a shift away from “risk” assets and agencies toward treasuries—not a shift away from all dollar assets.
Figure 13: Estimated Average Monthly Demand for Selected U.S. Assets vs. Average Growth in China’s Foreign Assets (valuation adjusted, rolling 3-month average, $billion)
Sources: TIC and authors’ estimates.
21
Conclusion
This paper aims to identify the true scale of China’s external assets and its likely U.S. portfolio, and thus to provide a benchmark for assessing the impact of China’s reserve management on American and indeed global financial markets. The stunning growth of China’s reserves and scale of purchases of U.S. securities over the past several years in some sense speaks for itself: never before has a coun-try as poor as China provided so much financing to a country as rich as the United States, and never before has a country that values its independence as highly as the United States relied so heavily on a single country’s government for financing. Chinese purchases in 2008 drew close to $400 billion, over half the net inflow needed to sustain the U.S. current account deficit.
From 2000 to the middle of 2008, China had to buy an ever-increasing quantity of foreign assets to keep its currency from rising, and consequently the scale of financing that China’s government provided to the United States—properly measured—almost continuously increased. That simple story—faster Chinese foreign asset growth propelling rising purchases of treasuries and agency bonds (and some experiments with riskier assets)—has grown more complex. Over the past few months, China’s reserve growth slowed dramatically in the fourth quarter, as speculative capital fled China. It remained subdued in the first quarter of 2009. But the underlying basis for China’s reserve growth remains. China’s trade surplus rose in the fourth quarter, as China’s import bill fell faster than its exports. Its trade surplus in the first quarter of 2009 exceeded its surplus of the first quarter of 2008. China looks set to run a significant trade surplus in 2009; the dramatic fall in commodity prices will reduce China’s import bill, offsetting falling exports to the United States and Europe. Should the current speculative outflows from China subside, China’s underlying trade surplus would once again push China’s reserves up—and the growth in China’s dollar reserves would once again provide a large share of the financing needed to sustain the United States’ still-large current account deficit. If a large U.S. fiscal stimulus leads the world out of its current slump, the U.S. current account deficit could even start to expand once again.
The overarching issue, then, is whether it makes sense to try to maintain, over time, a global finan-cial system based on the ongoing Chinese resistance to a stronger Chinese currency and correspond-ing growth in China’s reserves. The authors’ answer is no. China already has far more reserves than it needs to secure its own financial stability given its modest external debts and regulated capital ac-count.
China’s government has already invested a substantial share of its national savings in U.S. Trea-sury and agency bonds on terms that imply large losses at China’s central bank. Over time, China’s large current account surplus suggests that the renminbi will ultimately appreciate against the dollar even if the dollar’s unexpected rise and China’s sharp slowdown have temporarily created pressure for the renminbi to depreciate.8 Shifting those reserves to euros or another currency is not likely to help: the renminbi should appreciate over time against the euro, not just against the dollar. Nor can China realistically rely on exports to drive its future growth even if the global economy re-covers from its current slump. During the past eight years, China’s exports increased by a factor of

22
over five. They are not likely to increase at a comparable rate over the next eight. Supporting exports
rather than domestic consumption has diminishing returns. So far China’s financing of the United
States has come on exceedingly generous terms—and been remarkably stable. But nothing guaran-tees that China will always be willing to extend new financing—and rollover maturing debts—on
similar terms, or that China will not argue that the scale of its financing should give it influence over
U.S. policy choices. The longer the United States relies on Chinese financing to avoid necessary ad-justment—one where it pays for its imports with exports rather than debt—the harder the transition
is likely to be. The United States has recently discovered the risks of its own internal financial imbalances,
notably an over-indebted household sector. The world’s remaining financial imbalances continue to pose similar risks. Creating a more financially balanced global economy will be difficult so long as China’s government continues to peg tightly to the dollar and add large sums to its foreign assets. And so long as China’s macroeconomic policy mix produces large surpluses, there will be large defi-cits elsewhere in the global economy—whether in the United States or somewhere else. Rebalancing will be complicated if the United States and other larger deficit countries provide more macroeco-nomic stimulus in the downturn than the larger surplus countries. It should be possible to find a more stable basis for global growth, one that doesn’t require a still-poor country to provide financing to far wealthier countries indefinitely.

23
Endnotes
1. For reserve size, see the SAFE website, http://www.safe.gov.cn/model_safe_en/tjsj_en/tjsj_detail_en.jsp?ID=3030300000000000 0,17&id=4. 2. See “Balance Sheet of Monetary Authority” on PBoC’s Mandarin-language website for 2008 data, http://www.pbc.gov.cn/ diaochatongji/tongjishuju/gofile.asp?file=2008S04.htm. The data for the English-language website only goes back to 2007. 3. See “Summary of Sources and Uses of Funds of Financial Institutions” (in foreign currency) on the PBoC’s Mandarin-language website, http://www.pbc.gov.cn/diaochatongji/tongjishuju/gofile.asp?file=2008S02.htm. 4. “Other items” surged in the first quarter of 2004, just after the PBoC shifted $45 billion of reserves to Central Huijin in December 2003. These reserves were subsequently used to finance the recapitalization of the Bank of China and China Commercial Bank. An additional $15 billion was used to recapitalize the Industrial and Commercial Bank of China in the second quarter of 2005. $20 billion was shifted to the China Development Bank from the CIC in quarter four 2008, and $19 billion was shifted to Agricultural Bank of China in quarter one 2009. Liabilities from “the purchases and sales of foreign exchange” surged in quarter four of 2005 and in 2006, just as the state banks’ foreign investment portfolio surged. China’s balance-of-payments data also show a surge in private purchases of foreign long-term debt, and its net international investment position indicates a comparable rise in private holdings of foreign debt. Private holdings rose from $116.7 billion at the end of 2005 to $227.1 billion—an increase of over $110 billion (somewhat more than the state banks’ foreign portfolio investment in the PBoC data). 5. See http://www.amadaninternational.com/reports/TheCreationoftheChinaInvestmentCorporation.pdf. 6. The authors cheated a bit. The revisions associated with the last survey imply that the official sector accounts for 140 percent of the UK’s Treasury purchases and 210 percent of the UK and Hong Kong’s Treasury purchases from mid-2006 to mid-2007. This reflect-ed a world in which official reserve growth was strong and private demand for “safe” U.S. assets was modest. Blindly forecasting similar revisions to the data from mid-2007 to mid-2008—given the strong increase in the UK’s purchases—would imply exception-ally large flows. While the increase in global reserve growth implies some increase in official purchases, the authors opted to scale down the adjustment—at the risk of understating total official purchases. 7. While expectations that the renminbi will appreciate against the dollar over the next year have dissipated as the global and Chinese economies have slowed, China’s large and still-growing current account surplus, its rapid productivity growth, and the trajectory of other Asian economies as they developed all suggest future appreciation.

24
About the Authors
Brad Setser is a fellow for geoeconomics at the Council on Foreign Relations. Arpana Pandey is a research associate for geoeconomics at the Council on Foreign Relations.