understanding cation e ects in electrochemical co reduction
TRANSCRIPT

1
Understanding Cation Effects in Electrochemical CO2 ReductionStefan Ringe1,2,a,b, Ezra L. Clark3,4,b, Joaquin Resasco5, Amber Walton3, Brian Seger4, Alexis T. Bell3, KarenChan6,c)1)SUNCAT Center for Interfacial Science and Catalysis, Department of Chemical Engineering, Stanford University,
Stanford, California 94305, United States2)SUNCAT Center for Interface Science and Catalysis, SLAC National Accelerator Laboratory, Menlo Park, California,
94025, United States3)Joint Center for Artificial Photosynthesis, Lawrence Berkeley National Laboratory, Berkeley, CA 94720, United
States4)Surface Physics & Catalysis (SurfCat), Department of Physics, Technical University of Denmark5)Department of Chemical Engineering, University of California, Santa Barbara, Santa Barbara, California 93117,
United States6)CatTheory Center, Department of Physics, Technical University of Denmark, Kongens Lyngby 2800, Denmark
(Dated: 11 June 2019)
a) Electronic mail: [email protected] b) Contributed equally to this work. c) Electronic mail: [email protected]
Electronic Supplementary Material (ESI) for Energy & Environmental Science.This journal is © The Royal Society of Chemistry 2019

2
S1. CONTINUUM MODELING
The MPB equation for a 1:1 electrolyte (z:z and 1:z for Figure S17) is given in ref.1 and was solved in this workusing the finite element package COMSOL Multiphysics R© .2 An 80µm cell length was used with a maximum elementsize of 8µm. The double layer region was then more accurately resolved by a fine grid of maximum element sizeof 0.1 A. We then solve the MPB equation on a fine two-dimensional parameter space of PZC and ion size a andinterpolate this space using rectangular bivariate splines. This provides us with a continuous representation of thesurface charge density as a function of the parameters σ(φM,PZC, a).
0.8 0.6 0.4 0.2M, PZC vs. SHE (V)
5
10
15
a (Å
)
-29-2
7-25
-23-21-19
-17-1
5
-13
-27.5-25.7-23.9-22.1-20.3-18.5-16.7-14.9-13.1-11.2
(C/
cm2 )
FIG. S1. Contour plot of the σ(φM,PZC, a) function as obtained for a 1:1 electrolyte using the MPB model with Cgap = 25µF/cm2
and φM=-1 V vs. RHE (pH = 7). Gray points denote points at which the MPB equation was explicitly solved, the contour isthe spline interpolated function.
S2. DENSITY FUNCTIONAL THEORY CALCULATIONS
Density functional theory calculations of reaction energetics were carried out with a periodic plane-wave imple-mentation and ultrasoft pseudopotentials using QUANTUM ESPRESSO version 6.13 interfaced with the AtomisticSimulation Environment (ASE).4 We applied ultra-soft pseudopotentials and the BEEF-vdW functional, which pro-vides a reasonable description of van der Waals forces while maintaining an accurate prediction of chemisorptionenergies.5 Spin-polarized calculations were performed using plane-wave and density cutoffs of 500 and 5000 eV, re-spectively, as well as a Fermi-level smearing width of 0.1 eV. In general, adsorption energies were evaluated usingsymmetric (adsorbates on both sides of the slab) four-layered 3×3 supercells with all but a single outer layer on bothsides constrained, 20 A separation of the surface slabs, and [4×4×1] Monkhorst-Pack k-point grids.6
The SCCS implicit solvation model as implemented in the Environ QUANTUM ESPRESSO module7 was used tomodel the presence of implicit water using the “fitg03” parameters for water (in a.u.: ρmin = 0.0001, ρmax = 0.005as well a (α + γ) = 11.5 dyn/cm). The surface charge density was modulated in order to simulate the response ofadsorbate free energies to the presence of an electric double layer fields. A planar counter charge with a slab separationof 5 A was applied to neutralize the simulation cell. A parabolic correction was applied in the Environ calculations todecouple the electrostatic interaction between the periodically repeated slabs.
The bulk dielectric permittivity in the solvation model was set to εb = 6ε0, where ε0 is the vacuum permittivity.This value was rationalized by the following considerations. At elevated surface charge densities, the water layer closeto Ag8,9 and most metal electrodes10–13 is ice-like, i.e. highly constrained exhibiting a low dielectric permittivity. The

3
dielectric permittivity dependence on an applied electric field has been suggested to follow the Booth model:14
εb(|E|) = n2 + (εb(0)− n2)3
γ|E|
(coth(γ|E| − 1
γ|E|
), (S1)
with n ≈ 1.33 the optical refractive index of water and γ = 144 A/V the critical field parameter. Values were takenfrom ref.15 The Booth model has been proven valid by molecular dynamics16,17 and lattice Monte Carlo simulations.18
Inserting this expression into the plate capacitor equation:
|E| = σ
εb(|E|), (S2)
we can then solve this non-linear equation for the electric field using a surface charge density of -20µC/cm2 that arisestypically in our simulations at -1 V vs. RHE at Ag electrodes. The Booth model then gives us a value of around 6 forthe relative dielectric permittivity. This low value agrees with recent experimental observations.13,19,20 We thereforeperformed all following DFT calculations using this value.
All structures at all surface charge densities were relaxed using a BFGS line search algorithm until force componentswere less than 0.03 eV/A. *CO2 and *OCCO could only be stabilized with at least -1 e surface charge correspondingto around -20µC/cm2. We therefore extrapolated the free energy for smaller surface charge densities using the -1 eoptimized geometry and single point calculations as described below representing an extrapolation along the diabate.
For the free energy diagram of CO production at Ag, zero-point energy and finite temperature corrections in theharmonic oscillator approximation were evaluated from the adsorbate vibrations at the Ag(111) surface at zero surfacecharge density using ASE. In the case of *CO2 , we used the optimized structure at -1 e of surface charge. We furtherapplied an energy correction of 0.33 eV to the energy of CO2,(g) that was determined from fits to experimental gas
phase reaction energetics.5.In the case of CO adsorption at Pt, we evaluated vibrations in the harmonic oscillator approximation from the
*CO vibrations. The coverage was varied by using differently sized unit cells and keeping the k-point density constant([4×4×1] Monkhorst-Pack k-point grids for the 3×3 unit cell6)
S3. SURFACE CHARGE DENSITY DEPENDENCE OF ADSORBATES
Table S1 and the following figures show the surface charge dependence of formation energies of reaction intermediateswithout consideration of zero-point energy and finite temperature corrections. The pc-Ag surface charge dependencewas taken from the (111) facet.
TABLE S1: Parabolic fits of ∆E(σ) = ∆E(σ = 0) + aσσ + bσσ, thesurface charge density dependence of CO2R reaction intermediate for-mation energies at different surfaces. *OCCO was referenced to 2×CO(g), *COOH to CO2(g) and H2(g), all remaining adsorbates to theirgas phase equilvalent.
adsorbate metal facet counter charge dH ∆E(σ = 0) aσ bσ(A) (eV) (10−2 eV·cm2/µC) (10−4eV·[cm2/µC]2)
*CO2 Ag 111 PCC 5.0 0.76 2.86 -5.24*CO2 Ag 110 PCC 5.0 0.76 3.17 -6.55*CO2 Ag 100 PCC 5.0 0.64 2.77 -6.42*CO2 Ag 211 PCC 5.0 0.86 4.11 -4.28*CO2 Ag 111 PCC 4.0 0.76 2.21 -7.62*CO2 Ag 111 LPB 5.0 0.76 3.22 -3.30*COOH Ag 111 PCC 5.0 0.84 1.01 -4.33*COOH Ag 110 PCC 5.0 0.64 1.37 -2.03*COOH Ag 211 PCC 5.0 0.65 1.12 -5.37*CO Ag 111 PCC 5.0 -0.08 -0.60 -1.51*CO Ag 110 PCC 5.0 -0.20 -0.36 -1.63*CO Ag 211 PCC 5.0 -0.21 -0.33 -2.13
*CO Cu 111 PCC 5.0 -0.49 -0.38 -1.1

4
*CO Cu 100 PCC 5.0 -0.72 0.026 0.44*CO Cu 211 PCC 5.0 -0.74 -0.045 -0.55*OCCO Cu 111 PCC 5.0 0.083 2.64 -1.86*OCCO Cu 100 PCC 5.0 -0.37 3.93 0.25
*CObr Pt 111 PCC 5.0 -0.63 0.83 -0.84*COt Pt 111 PCC 5.0 -0.62 -0.58 -0.077
A. CO2@Silver
Fig. S2 shows the surface charge density dependence of CO2 at various Ag facets. We were able to stabilize CO2
for all surface charges less or equal -1 e, which corresponds to a surface charge density of around -20µC/cm2 for the3×3 unit cells that we used. In order to estimate the CO2 adsorption energy at small surface charge densities, weapplied two different extrapolation methods. As seen from the picture both methods agree in the the limit of largesurface charge densities, but deviate substantially at smaller surface charge density. In the parabolic extrapolationcase, we parabolically interpolated the relaxed CO2 adsorption energy values at high surface charge density and usedthe fit function to extrapolate to smaller surface charge density regions. At zero charge, the parabolic method predictsCO2 to be stable at the surfaces, in contrast to our observation of desorbing CO2. The single point extrapolationmethod in contrast follows the diabate of the CO2 adsorbate more strictly predicting a non-stable CO2 geometry atzero surface charge density. We therefore apply it in the paper as we think it provides a more realistic estimate of theCO2 binding energy at small surface charge density.
FIG. S2. Surface charge density dependence of CO2 adsorption energy for the three Ag facets (111), (110) and (211). Shownare two ways to extrapolate the CO2 binding energy to smaller surface charge densities, where CO2 is not stable under standardconditions. The single point extrapolation method uses the optimized geometry at a total charge of -1 e (=-23 – -24µC/cm2) andperforms single point calculations to approximate the energy at smaller surface charge densities. The parabolic extrapolationuses a parabolic fit of the relaxed high surface charge density geometries to extrapolate the energy. Filled circles indicate pointswhere both the bare slab as well as the adsorbate+slab could be relaxed at the elavated surface charge density. Filled diamondsin contrast show points where single point calculations have been performed for the adsorbate+slab calculation using the -1 erelaxed charge calculation.
Fig. S4 shows the impact of different counter charge representations on the surface charge dependence. As obviousfrom the figure, the surface charge depedence is nearly fully independent of the chosen counter charge representation.The reason for this is that the main effect of the field stabilization comes from the vertical components of the electricfield on the surface which are similar at a fixed surface charge density.

5
20 10 0 10Surface Charge Density ( C/cm2)
0.5
0.0
0.5
1.0
CO2 A
dsor
ptio
n En
ergy
(eV) PCC, dH = 4Å
PCC, dH = 5ÅLPB
FIG. S3. Surface charge density dependence of the *CO2 adsorption energy at the Ag(111) facet. Shown are different ioniccounter charge representations, either as planar counter charge (PCC) at two different distances dH from the surface or asapproximated with the linearized Poisson-Boltzmann (LPB) model.
B. Other adsorbates @Silver
20 10 0 10Surface Charge Density ( C/cm2)
0.0
0.2
0.4
0.6
0.8
1.0
H Ad
sorp
tion
Ener
gy (e
V) 111
FIG. S4. Surface charge density dependence of the *H adsorption energy at the Ag(111) facet.

6
20 10 0 10Surface Charge Density ( C/cm2)
0.5
0.4
0.3
0.2
0.1
0.0
0.1
CO A
dsor
ptio
n En
ergy
(eV)
111110211
FIG. S5. Surface charge density dependence of the *CO adsorption energy relative to CO(g) for the three Ag facets (111), (110)and (211).
20 10 0 10Surface Charge Density ( C/cm2)
0.0
0.2
0.4
0.6
0.8
1.0
COOH
Ads
orpt
ion
Ener
gy (e
V)
111110211
FIG. S6. Surface charge density dependence of the *COOH formation energy relative to CO2(g) for the three Ag facets (111),(110) and (211).

7
C. Copper
20 10 0 10Surface Charge Density ( C/cm2)
1.0
0.5
0.0
0.5
OCCO
Ads
orpt
ion
Ener
gy (e
V)
111100
FIG. S7. Surface charge density dependence of the *OCCO formation energy relative to 2 CO(g) molecules at the (111) and(100) Cu facets. The (211) facet was found to be particularly difficult to numerically converge and is therefore not shown. The*OCCO adsorption energy was extrapolated via single point calculations for all total charges at surface charges >-1.0 e (=-20– -24µC/cm2).
20 10 0 10Surface Charge Density ( C/cm2)
0.8
0.6
0.4
CO A
dsor
ptio
n En
ergy
(eV)
111100211
FIG. S8. Surface charge density dependence of the *CO formation energy relative to CO(g) at the (111), (100) and (211) Cufacets.

8
D. Platinum
40 20 0 20Surface Charge Density ( C/cm2)
1.0
0.8
0.6
CO
Adso
rpti
on E
nerg
y (
eV
)
CObr
COt
FIG. S9. Surface charge density dependence of the *CO formation energy at bridge and top sites relative to CO(g) of thePt(111) surface.
E. Free Energy Diagrams
Free energy diagrams were constructed using the surface charge density dependent formation energies of the previoussection. Mapping from surface charge density to experimental applied potential was performed using the Robinboundary contitions and the MPB model with K+ as a cation. The Computational Hydrogen Electrode (CHE)21
was applied to further model the effect of the changing electrostatic potential of electrons in the metal electrode andthe pH. Figure S10 shows the electric field-free and corrected free energy diagrams for CO2 to CO reduction. Weconsidered also the (211) surface as a typical stepped facet but applied the (111) PZC due to the relatively smalldensity of steps on a typical poly-crystalline surface.
2.0
1.0
0.0
1.0
G(eV) 0.0
2.0
1.0
0.0
1.0
0.0
1.0
w/o field corrections w/ field corrections
CO2(g) CO2(g)
*CO2 *CO2 *COOH*COOH
*CO
CO(g) CO(g)
*CO
Ag(111)Ag(100)Ag(211)
FIG. S10. Surface charge uncorrected (“w/o field correcitons”) and corrected (“w/ field corrections”) free energy diagram forCO2 reduction at different Ag surfaces and -0.4 V (solid) and -1 V (dashed) vs. RHE.

9
S4. POTENTIAL OF ZERO CHARGE CALCULATIONS
A. PZC of pc-Ag
We found the experimentally measured PZC of poly-crystalline Ag to vary in a range of 0.1 V likely due to differencesin the experimental fabrication process.22 We therefore decided to evaluate a theoretical estimate for the PZC basedon theoretical equilibrium crystal shapes according to the following equation:
φM,PZC(pc−Ag) =0.65 · φM,PZC(Ag(322)) + 0.2 · φM,PZC(Ag(100))
0.65 + 0.2. (S3)
The pre-factors in front of the (322) and (100) facets were taken from the equilibrium crystal shape of Ag from ref.23.Due to a lack of the experimental PZC of the (322) facet, the PZC’s of both the (322) and the (100) facet werecalculated using the Vienna ab initio Simulation Package (VASP).24,25 In particular, we use the implicit solvationpackage VASPsol26 which uses a solvent parametrization that predicts the PZC of metals when using the RPBEfunctional27 in good agreement with experiment.28 The original solvation parameters from ref.26 were used with τparameter in the solvation model set to zero. 1×1 symmetric unit cells with at least 5 metal layers and 100 Aslabseparation were cut from the bulk optimized fcc lattice and used without further relaxation. PAW pseudo-potentialswere further applied. The PZC was obtained from the Fermi level corrected by the Fermi shift (vacuum reference) andvalues of φM,PZC(Ag(100) = -0.66 V (experimental value: -0.62122) and φM,PZC(Ag(322)) = -0.56 V were obtained.
B. PZC of *CO covered Pt(111)
The PZC of the *CO covered Pt(111) was determined using the Environ implicit solvation package7 within QUAN-TUM ESPRESSO3. We used the fitg03 parameter set presented in ref.7. The *CO coverage was varied by varying theunit cell size, the k-point density was chosen as [12×12×1] for the 1×1 unit cell and kept constant for larger unit cells.7 layers of metal atoms were used with a periodic slab separation of 30 A. The BEEF-vdW xc-functional was furtherapplied with energy and density cutoffs of 500 eV and 5000 eV, respectively, as well as ultrasoft pseudo-potentials.The slabs were fully relaxed in a similar way as described for the surface charge density dependent calculations above.
10 15 20 25 30 35 40 45 50*CO Coverage (%)
0.50
0.25
0.00
0.25
0.50
0.75
1.00
1.25
1.50
Pote
ntia
l of Z
ero
Char
ge v
s. ba
re sl
ab (V
)
bridgetop
FIG. S11. PZC of *CO covered Pt(111) relative to the bare Pt(111) surface as a function of *CO coverage.

10
S5. CAPACITANCE MEASUREMENTS
The measured complex impedance was fitted by different circuit models. The RC circuit impedance is e.g. givenby
Z = R+1
iωCdl, (S4)
where R is the solution resistance in series with the double layer capacitance and ω is the circular frequency. The RQcircuit introduces a constant phase element instead:
Z = R+1
(iω)αQ, (S5)
where using an α 6= 1 can be understood as introducing frequency dispersion in the capacitance or making thecapacitance less ideal leading to a non-vertical line in the Nyquist plot (cf. Figure S12 and S13).
150 160 170 180 190Re(Z) ( )
0
500
1000
1500
2000
-Im(Z
) ()
5.0 Hz
5001.1 Hz
5.0 Hz
5001.1 Hz
-0.19 V vs. RHE
0.81 V vs. RHE
0.4 0.2 0.0 0.2 0.4 0.6 0.8Voltage vs. RHE (V)
20
25
30
35
40
C dl (
F/cm
2 )
K +
Na +
FIG. S12. Left: Imaginary vs. real part of the impedance plotted at various frequencies. Filled circles depict experimentaldata, diamonds the predictions of the RC circuit model. Right: Double layer capacitance as a function of applied potential.
150 160 170 180 190 200Re(Z) ( )
100
101
102
103
-Im(Z
) ()
5.0 Hz
5001.1 Hz
5.0 Hz
5001.1 Hz
-0.19 V vs. RHE
0.81 V vs. RHE
0.25 0.00 0.25 0.50 0.75Voltage vs. RHE (V)
20
25
30
35
40
Q (
F/cm
2 s1 )
K +
Na +
0.0 0.2 0.4 0.6 0.8Voltage vs. RHE (V)
0.96
0.97
0.98
0.99
FIG. S13. Left: Imaginary vs. real part of the impedance plotted at various frequencies. Filled circles depict experimentaldata, diamonds the predictions of the RQ circuit model. Center: Q-constant phase element, Right: constant phase exponentα as a function of applied potential. Colors and symbols are as in Figure S12
We also tested more circuits including for example an adsorption resistance, but did not find any influence of thison the capacitance.

11
S6. ION CORRELATION WITH HYDRATED ION RADII
3.25 3.50 3.75 4.00 4.25 4.50 4.75 5.00Hydrated Cation Radius (Å)
4
5
6
7
8
Effe
ctiv
e In
terfa
cial C
atio
n Ra
dius
(a/2
) (Å)
LiNa
KRbCs
TBATEATMA
TPA
FIG. S14. Correlation of determined interfacial cation radii with bulk electrolyte hydrated cation radii.
S7. CO ADSORPTION @ PT
0 20 40 60 80 100Coverage (%)
0
1
2
3
4
5
6
(cm
/C)
satu
ratio
n co
vera
ge
bridge
top
FIG. S15. Stark tuning rate of *CO at the bridge and top site at Pt(111) under electrochemical conditions.
S8. CATION EFFECTS ON CO PRODUCTION @ AG(110)
Figure S16 shows the CO production rate at the different Ag surfaces. The data is here explicitly also shown withreference to Li+ to show the deviation in the data for this cation. Li+ is in particular difficult to treat experimentally,because atomically larger cations adsorb stronger and impurities therefore contribute nonequivalently more to theobserved activity. Chelex resin can also not be used with Li-based electrolytes (due to Na contamination). Thismeans the initial purity of the Li+ electrolyte is lower and that it is susceptible to inadvertent contamination.

12
( )
Ag(110)
3.03.54.04.55.05.50.0
2.5
5.0
7.5
10.0
12.5
15.0
Li Na KRb CsK2.0 1.0
Effective Interfacial Cation Radius (a/2) (Å)
FIG. S16. CO partial current density at Ag(110), Ag(111) and poly-crystalline Ag at -1 V vs. RHE for different cationsnormalized to the CO current density in the Li+ case. The Li+ data point of CO current density at Ag(110) exhibited ananomalously low partial current density of CO correlating with a large partial current density increase of the HER. The dashedline illustrates that this leads to a constant shift of all data points of the other cations. We also plotted the Ag(110) datarelative to Na+ as in the main paper.

13
S9. CATION EFFECT PREDICTION
1234567Effective Interfacial Cation Radius (Å)
10 1
100
101
102
103
104j(A
z+
)/j(L
i+)
ZnBeMg
CaSr
BaPb
Al
La
LiNa
KCsNH4
Rb
Li Na KRb Cs
1:11:2
1:32:12:2
3:3 2:4
FIG. S17. Prediction of cation effects at the example of electrocatalytic CO2 reduction on Ag(111) at -1 V vs. RHE usingthe determined interfacial ion size correlation for hydrated ions with the ionic crystal radius. The figure depicts the predictedCO partial current density for 0.1 M AxB electrolytes having a cation:anion charge ratio of z:zx as a function of the effectiveinterfacial cation size relative to Li+ as a cation. The empty circles represents data that was experimentally measured withinthis study.
S10. EXPERIMENTAL DATA FOR CO2R@AG FACETS
FIG. S18. Experimental polarization curves for CO2R and HER at the (111) surface facet in 0.1 M bicarbonate solution.
14
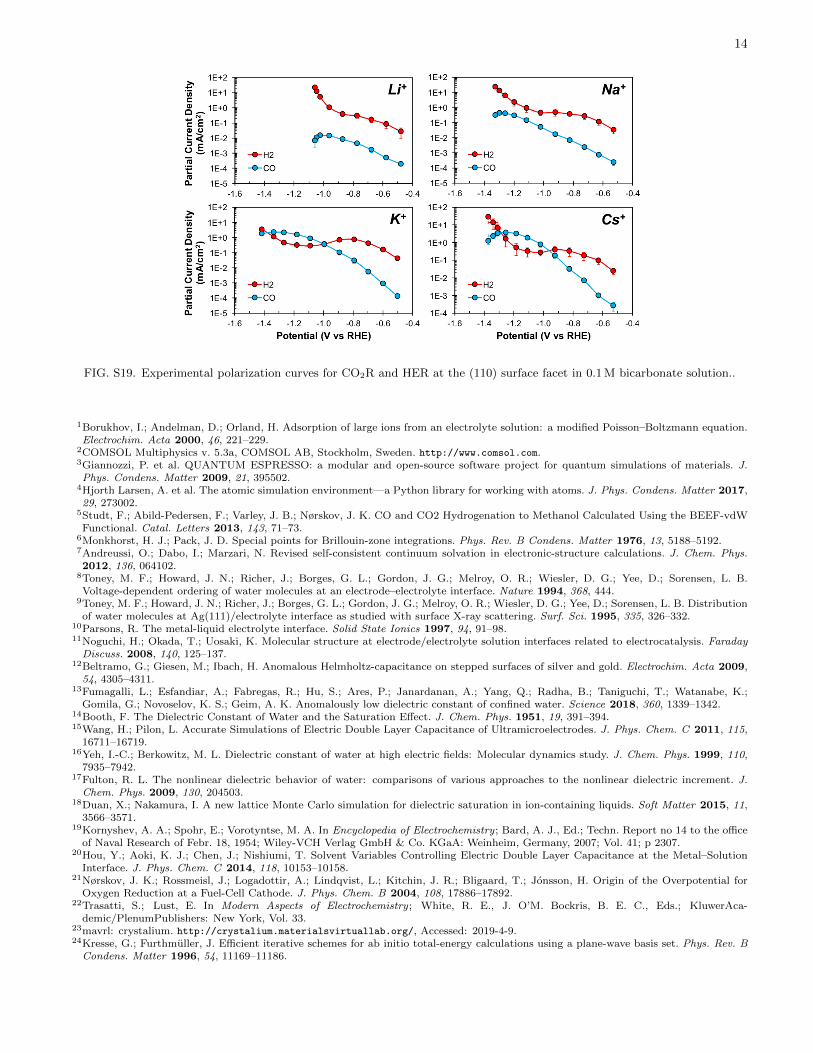
FIG. S19. Experimental polarization curves for CO2R and HER at the (110) surface facet in 0.1 M bicarbonate solution..
1Borukhov, I.; Andelman, D.; Orland, H. Adsorption of large ions from an electrolyte solution: a modified Poisson–Boltzmann equation.Electrochim. Acta 2000, 46, 221–229.
2COMSOL Multiphysics v. 5.3a, COMSOL AB, Stockholm, Sweden. http://www.comsol.com.3Giannozzi, P. et al. QUANTUM ESPRESSO: a modular and open-source software project for quantum simulations of materials. J.Phys. Condens. Matter 2009, 21, 395502.
4Hjorth Larsen, A. et al. The atomic simulation environment—a Python library for working with atoms. J. Phys. Condens. Matter 2017,29, 273002.
5Studt, F.; Abild-Pedersen, F.; Varley, J. B.; Nørskov, J. K. CO and CO2 Hydrogenation to Methanol Calculated Using the BEEF-vdWFunctional. Catal. Letters 2013, 143, 71–73.
6Monkhorst, H. J.; Pack, J. D. Special points for Brillouin-zone integrations. Phys. Rev. B Condens. Matter 1976, 13, 5188–5192.7Andreussi, O.; Dabo, I.; Marzari, N. Revised self-consistent continuum solvation in electronic-structure calculations. J. Chem. Phys.2012, 136, 064102.
8Toney, M. F.; Howard, J. N.; Richer, J.; Borges, G. L.; Gordon, J. G.; Melroy, O. R.; Wiesler, D. G.; Yee, D.; Sorensen, L. B.Voltage-dependent ordering of water molecules at an electrode–electrolyte interface. Nature 1994, 368, 444.
9Toney, M. F.; Howard, J. N.; Richer, J.; Borges, G. L.; Gordon, J. G.; Melroy, O. R.; Wiesler, D. G.; Yee, D.; Sorensen, L. B. Distributionof water molecules at Ag(111)/electrolyte interface as studied with surface X-ray scattering. Surf. Sci. 1995, 335, 326–332.
10Parsons, R. The metal-liquid electrolyte interface. Solid State Ionics 1997, 94, 91–98.11Noguchi, H.; Okada, T.; Uosaki, K. Molecular structure at electrode/electrolyte solution interfaces related to electrocatalysis. FaradayDiscuss. 2008, 140, 125–137.
12Beltramo, G.; Giesen, M.; Ibach, H. Anomalous Helmholtz-capacitance on stepped surfaces of silver and gold. Electrochim. Acta 2009,54, 4305–4311.
13Fumagalli, L.; Esfandiar, A.; Fabregas, R.; Hu, S.; Ares, P.; Janardanan, A.; Yang, Q.; Radha, B.; Taniguchi, T.; Watanabe, K.;Gomila, G.; Novoselov, K. S.; Geim, A. K. Anomalously low dielectric constant of confined water. Science 2018, 360, 1339–1342.
14Booth, F. The Dielectric Constant of Water and the Saturation Effect. J. Chem. Phys. 1951, 19, 391–394.15Wang, H.; Pilon, L. Accurate Simulations of Electric Double Layer Capacitance of Ultramicroelectrodes. J. Phys. Chem. C 2011, 115,
16711–16719.16Yeh, I.-C.; Berkowitz, M. L. Dielectric constant of water at high electric fields: Molecular dynamics study. J. Chem. Phys. 1999, 110,
7935–7942.17Fulton, R. L. The nonlinear dielectric behavior of water: comparisons of various approaches to the nonlinear dielectric increment. J.Chem. Phys. 2009, 130, 204503.
18Duan, X.; Nakamura, I. A new lattice Monte Carlo simulation for dielectric saturation in ion-containing liquids. Soft Matter 2015, 11,3566–3571.
19Kornyshev, A. A.; Spohr, E.; Vorotyntse, M. A. In Encyclopedia of Electrochemistry; Bard, A. J., Ed.; Techn. Report no 14 to the officeof Naval Research of Febr. 18, 1954; Wiley-VCH Verlag GmbH & Co. KGaA: Weinheim, Germany, 2007; Vol. 41; p 2307.
20Hou, Y.; Aoki, K. J.; Chen, J.; Nishiumi, T. Solvent Variables Controlling Electric Double Layer Capacitance at the Metal–SolutionInterface. J. Phys. Chem. C 2014, 118, 10153–10158.
21Nørskov, J. K.; Rossmeisl, J.; Logadottir, A.; Lindqvist, L.; Kitchin, J. R.; Bligaard, T.; Jonsson, H. Origin of the Overpotential forOxygen Reduction at a Fuel-Cell Cathode. J. Phys. Chem. B 2004, 108, 17886–17892.
22Trasatti, S.; Lust, E. In Modern Aspects of Electrochemistry; White, R. E., J. O’M. Bockris, B. E. C., Eds.; KluwerAca-demic/PlenumPublishers: New York, Vol. 33.
23mavrl: crystalium. http://crystalium.materialsvirtuallab.org/, Accessed: 2019-4-9.24Kresse, G.; Furthmuller, J. Efficient iterative schemes for ab initio total-energy calculations using a plane-wave basis set. Phys. Rev. BCondens. Matter 1996, 54, 11169–11186.

15
25Kresse, G.; Furthmuller, J. Efficiency of ab-initio total energy calculations for metals and semiconductors using a plane-wave basis set.Comput. Mater. Sci. 1996, 6, 15–50.
26Mathew, K.; Hennig, R. G. Implicit self-consistent description of electrolyte in plane-wave density-functional theory. 2016,27Hammer, B.; Hansen, L. B.; Nørskov, J. K. Improved adsorption energetics within density-functional theory using revised Perdew-Burke-
Ernzerhof functionals. Phys. Rev. B Condens. Matter 1999, 59, 7413–7421.28Goodpaster, J. D.; Bell, A. T.; Head-Gordon, M. Identification of Possible Pathways for C-C Bond Formation during Electrochemical
Reduction of CO2: New Theoretical Insights from an Improved Electrochemical Model. J. Phys. Chem. Lett. 2016, 7, 1471–1477.