understanding car parks, crime and cctv: evaluation ... · understanding car parks, crime and cctv:...
TRANSCRIPT

UNDERSTANDING CAR PARKS,CRIME AND CCTV:
EVALUATION LESSONS FROM SAFER CITIES
NICK TILLEY
POLICE RESEARCH GROUPCRIME PREVENTION UNIT SERIES PAPER NO. 42LONDON: HOME OFFICE POLICE DEPARTMENT
Editor: Gloria LaycockHome Office Police Research Group
50 Queen Anne’s GateLondon SWlH 9AT

© Crown Copyright 1993First Published 1993
Crime Prevention Unit Papers
The Home Office Police Research Group (PRG) was formed in 1992 to carry out andmanage research relevant to the work of the police service and Home Office PolicyDivisions. One of the major Police Department divisions which acts as customer forthe PRG is the Home Office Crime Prevention Unit which was formed in 1983 topromote preventive action against crime. It has a particular responsibility todisseminate information on crime prevention topics.
The object of the present series of occasional papers is to present research material in away which should help and inform practitioners, whose work can help reduce crime.
ISBN 0-86252-935-2
(ii)

Foreword
The Safer Cities Programme is a Home Office crime prevention initiative whichcurrently operates through 20 projects in England. The projects provide financial andother support for a wide variety of local crime prevention schemes. This report is thefirst ‘thematic’ study of such schemes. The effectiveness of closed circuit television(CCTV) in car parks was chosen for study reflecting the importance of controllingcar-related offending and the increasing interest in CCTV as a crime managementtool.
The results are encouraging and suggest that CCTV can, in certain circumstances,make a useful contribution to crime control. But perhaps one of the most valuablelessons from the report is the illustration of the need to consider the precise reasonswhy CCTV might help to prevent crime in a particular case. As the report shows,even with a relatively simple measure such as CCTV there are a variety of ways inwhich it could contribute to crime control. Which of these ways is most relevant willoften depend on local circumstances and the nature of the local car crime problem.This thought provoking report valuably brings out the need to consider theseinteractions carefully if value for money in crime prevention is to be achieved and ifwe are to learn from experience.
I M BURNSDeputy Under Secretary of StateHome OfficeJanuary 1993
(iii)

Acknowledgements
Each of the car parks included in this study was visited and discussed with localpersonnel administering the systems. I am grateful to all those who patiently answeredquestions about them. I should also like to thank those in Safer Cities projects whohelped assemble the data analysed here. They were uncomplaining in responding torequests to chase up information. They also kindly commented on those parts of anearlier draft relating to car parks to which they had contributed funding. Finally, PaulEkblom, Gloria Laycock, Ray Pawson, Ken Smalldon and Barry Webb read completeearlier versions of the paper, and made many invaluable suggestions for improvementsin style and substance.
Nick TilleyPolice Research GroupDecember 1992.
Nick Tilley is a reader in Sociology at Nottingham Trent University and currently onSecondment to the Police Research Group.
(iv)

Contents
Foreword
Acknowledgements
List of Tables
List of Figures
1. Introduction
2. Theory and method in evaluating the effects of CCTVThe mechanisms whereby CCTV may impact on car crimeContext, CCTV and car crimeContext and mechanismEvaluationThematic Studies
3. ResultsHartlepoolHullLewishamBradfordCoventryWolverhampton
4. Conclusion
Appendix
References
Crime Prevention Unit Papers
Page
iii
iv
vi
vii
1
334567
88
1214151821
23
26
30
32
(v)

4
5
A l
A2
A3
A4
List of tables
Table No. Caption
1 Changes in rate of car crime in Albion Street Car Park,Hull, before and after installation of CCTV
2 Theft from cars in the John Street Car Parks, adjacent carparks and local streets, and Bradford City Centre Sub-Division before and after installation of CCTV
3 Theft of cars in the John Street Car Parks, adjacent carparks and local streets and Bradford City Centre Sub-Division before and after installation of CCTV
Changes in car crime rates and crime prevention measures,Coventry car parks
Car Crime at Bilston Leisure Centre before and afterinstallation of CCTV
Page
13
17
17
20
22
Quarterly figures for theft of motor vehicles from Hartlepoolcar parks Jan 1989-Sept 1992 26
Quarterly figures for theft from motor vehicles in Hartlepoolcar parks January 1989 to September 1992. 27
Changes in car crime in Coventry, overall and in citycentre council car parks 28
Car crime rates in selected Coventry car parks 1987-1992,January to August of each year 28
(vi)

List of figures
Figure No. Caption Page
1 Mechanism, context and outcome-pattern 3
2 Three quarter moving averages for theft of cars in Hartlepool,showing the total (scaled to 1/20), CCTV covered, and non-CCTV covered car parks, 1989-1992. 10
3 Three quarter moving averages for theft from cars in Hartle-pool, showing the total (scaled to 1/20), CCTV covered, andnon-CCTV covered car parks, 1989-1992. 11
4 Map of John Street, including car parks and surroundingstreets. 16
5 January to August rates of theft of and theft from cars inCoventry overall (scaled to 1/10), and in council run publiccar parks, 1987-1992. 18
A l Graphical representation of data presented in Tables 4 andA4, concerning car crime in individual car parks in Coventry. 29
(vii)
1. Introduction
The most recent figures available (July 1991 – June 1992) at the time of writing showvehicle crime accounting for 28% of all recorded offences in England and Wales(Home Office 1992), an increase of 7% over the previous year. There were 571,700thefts of motor vehicles. The 1992 British Crime Survey finds that 99% of such theftsare reported and 93% recorded, the highest rates for any offence category examined(Mayhew and Aye Maung 1992). The number of recorded thefts from vehicles stoodat 931,300, and the British Crime Survey estimates that 53% of such thefts arereported, and 32% eventually recorded by the police. Hope (1987), using data fromthe 1984 British Crime Survey, shows that the highest vulnerability to all car crime isfound on the street close to drivers’ homes. However, a substantial amount of crimeoccurs in car parks. Webb, Brown and Bennett (1992) indicate that British CrimeSurvey data show that 22% of thefts of cars and 20% of thefts from cars take place inprivate or municipal car parks, though there are substantial local variations. Theygive figures of 40% for thefts of vehicles in Nottingham and 39% for thefts fromvehicles in Derbyshire which were reported to the police during one week in 1991.
Car crime in general including that in car parks in particular is clearly a serious issue.One aspect of the problem can be addressed by designing cars to make them lessvulnerable (Mayhew, Clarke, and Hough 1980; Southall and Ekblom 1985), forexample by installing improved steering locks, better door locks, identity marks, andcar alarms, and by encouraging the public to activate security devices where fitted,and to remove clearly attractive items from sight where possible. Mayhew and AyeMaung (1992) show that the highest rate of increase in offences from 1981 to 1991,both for police recorded crime and for British Crime Survey data, is that of attemptedthefts of and from vehicles, with figures of 336% and 395% respectively. ‘This’, theystate ‘suggests not only that car thieves are more active, but that cars have becomebetter protected whether by manufacturers or owners.’ Another aspect of car crime isaddressed in attempts to divert or discourage the potential car criminal, thoughresearch is needed to establish the effectiveness of measures aimed at this. A thirdaspect of the problem relates to the environment in which the offence takes place.Poyner & Webb (1991) examine the effect of the design and layout of residentialareas on car crime. There has been some research into the management and organis-ation of car parks and how this may impact on patterns of crime (Laycock & Austin1992; Webb, Brown and Bennett 1992). Findings suggest that variations in thesetting in which the car is parked are associated with different crime rates.
Little systematic evidence, however, has been collected on the impact of changes inthe physical environment on car crime, and in particular on the effectiveness ofCCTV in reducing it. Poyner (1992) reports a study of The University of Surrey inGuildford, where he found a significant decrease in thefts from cars in the year inwhich CCTV was installed as compared to the previous year — from 92 in 1985 to 31in 1986, but a much smaller decrease in thefts of cars — from 15 to 12. This paper
1

focuses on the rather more extensive experience of Safer Cities schemes where CCTVhas been installed in public car parks.
It may seem obvious to some that CCTV has the potential to reduce car crime, andtherefore that to discuss the whys and wherefores of it is superfluous. Yet CCTV doesnot create a physical barrier directly stopping car crime. Policy makers and crimeprevention practitioners need to be clear concerning exactly what it is about CCTVwhich might lessen car crime and in what circumstances the potential can mosteffectively and economically be released. We begin, therefore, with a brief theoreticaldiscussion of what will be referred to as the mechanisms through which and contextsin which CCTV may lead to a reduction in car crime in car parks.
2

2. Theory and Method in Evaluating the Effects of CCTV
Following Pawson & Tilley (1992), in which a general account of the evaluationmethodology exemplified here is given, we begin with a brief explanation of key terms— ‘mechanism’, ‘context’ and ‘outcome-pattern’. These are employed throughout thispaper, where usage will further clarify their meaning.
In a given context, a particular crime prevention measure fires one or more causalmechanisms, which produce a particular outcome-pattern. Mechanism questions askwhat it is about a crime prevention measure which may lead it to have an outcome-pattern in a particular context. Context questions ask about the conditions needed fora crime prevention measure to fire its (potential) causal mechanism/s to produce anoutcome-pattern. Outcome-pattern questions ask what the practical effects are ofcausal mechanisms being fired in given contexts. This is represented in diagrammaticform in Figure 1.
Figure 1: Mechanism, context and outcome pattern.
The mechanisms whereby CCTV may impact on car crime
What is it, then, about CCTV which makes car crime less likely? There are severalpossibilities. Consider the following:
a) CCTV reduces car crime by making it more likely that present offenders will becaught, stopped, removed, punished and deterred.
b) CCTV reduces car crime by deterring potential offenders who will not wish torisk apprehension and conviction by the evidence captured on videotape orobserved by an operator on a screen on which their behaviour is shown.
c) The presence of CCTV leads to increases in usage of car parks, because driversfeel less at risk of victimisation. Increased usage enhances natural surveillancewhich deters potential offenders, who feel they are at increased risk of apprehen-sion in the course of criminal behaviour.
3

d)
e)
f)
g)
h)
i)
CCTV allows for the effective deployment of security staff/police officers towardsareas where suspicious behaviour is occurring. They then act as a visible presencedeterring potential offenders. They may also apprehend actual offenders redhanded and disable their criminal behaviour.
The publicity given to CCTV and to its usage in catching offenders is received bypotential offenders who avoid the increased risk they believe to be associatedwith committing car crimes in car parks. The perceived risks of offending exceedthe perceived benefits, and offending either ceases or is displaced by place oroffence.
CCTV, and signs indicating that it is in operation symbolise efforts to take crimeseriously and to reduce it. The potential offender perceives crime to be moredifficult or risky and is deterred.
Those car crimes which can be completed in a very short space of time will be lessreduced than those which take more time, as the offender calculates the timetaken for police or security officers to come or the probability that panningcameras will focus in on him/her.
CCTV and notices indicating that it is in operation remind drivers that their carsare vulnerable, and they take greater care to lock them, to operate any securitydevices, and to remove easily stolen items from view.
Cautious drivers, who are sensitive to the possibility that their cars may bevulnerable and are habitual users of various security devices, use and fill those carparks with CCTV and thereby drive out those who are more careless, whosevulnerable cars are stolen from elsewhere.
The imaginative reader may be able to think of other ways (or ‘mechanisms’) in whichCCTV may impact on patterns of car crime. It is also clearly possible that more thanone mechanism may operate simultaneously — crime prevention may be ‘overdeter-mined’ by CCTV. Finally and most importantly the mechanisms fired by CCTV andtheir efficacy will be context-bound. Just as the potential diversity of mechanismsfired by CCTV needs to be illustrated, so does the variety of contexts for car crimeprevention in car parks.
Context, CCTV and Car Crime
To state the perfectly obvious, neither car parks nor car crimes are all alike. Ourinterest lies in such contextual variations which have significance for the crimereduction mechanisms which may be fired by CCTV. Here are a few examples:
a) A given rate of car crime may result from widely differing prevalence ofoffending. For example if there are 1000 incidents per annum, this may be byanything from a single very busy offender to as many as 1000 offenders, or stillmore if they operate in groups. A mechanism leading to disablement of theoffender (as in [a] above) holds potential promise according to the offender-offence ratio.
4

b)
c)
d)
e)
A long stay car park may have an enormous influx of vehicles between eight andeight-thirty in the morning when it becomes full up. It may then empty betweenfive and six in the evening. If the dominant CCTV fired mechanism turns out tobe increased confidence and usage (as in [c] above) then this will have littleimpact because the pattern of usage is already high with little movement,dictated by working hours not fear of crime. If, however, the car park is little used,but with a very high per user car crime rate then the increased usage mechanismmay lead to an overall increase in numbers of crimes but a decreased rate per use.
Cars parked in the CCTV blind spots in car parks will be more vulnerable if themechanism is increased chances of apprehension through evidence on videotape(as in [b] above), but not if it is through changed attributes/security behaviour ofcustomers (as in [h] or [i] above).
The local patterns of motivation of offenders, together with the availability ofalternative targets of car crime, furnish aspects of the wider context for displace-ment to car crimes elsewhere, whatever crime reduction mechanisms may befired by CCTV in the specific context of a given car park (for a recent discussionopening up issues of motivation and vehicle choice, see Clarke and Harris 1992).
In an isolated car park with no security staff and the police at some distance away,the deployment of security staff/police as a mobile and flexible resource to detercar crime (as in [d] above) is not possible.
Context and mechanism
It is clear that CCTV may fire a number of mechanisms. It should also be pointed outthat the way CCTV is implemented will affect its mechanism firing potential. Forexample, if resources are not available for watching monitors at the time events areoccurring, some mechanisms cannot be fired (for example the dispatch of security/police). If the quality of the pictures is too poor to allow the identification ofoffenders, then conviction through video evidence is not possible and crime preven-tion outcome- patterns springing from that cannot be fired. Moreover, the mechan-isms fired with certain forms of implementation can be expected to yield only shortterm crime reducing outcome patterns. If, thus, the mechanism is deterrence via a risein perceived risk which is not rooted in real risk increase, then, in the absence ofperiodic reinforcements, many offenders may come to appreciate that they can safelyresume their criminal behaviour, and the crime rate will then increase (cf Austin1988).
Which potential crime reducing mechanisms are fired turns on context and im-plementation. A well designed scheme with greatest promise for success will be one inwhich effective mechanism firing will be tailored to the context in which it isoccurring.
5

Evaluation
Some readers may now be asking if baldly stated questions about whether CCTV doesor does not reduce car crime are meaningful. They are absolutely right to do so. Whatwe need to ask instead is this, ‘Under what initial circumstances (context) and howcan CCTV be used (mechanism) to reduce specified car crimes and for how long(outcome-pattern)?’ Addressing the issue in this way will enable us to begin to fleshout what can be achieved using CCTV, and promises helpful results for those wishingto address car crime problems in particular car parks. The overall potential of CCTVcan only be progressively uncovered over time by a series of studies to deal with thevarious aspects of this question. The study reported here will merely scratch at theissues. It will permit more informed judgments about the present potential of CCTVto fire mechanisms and reduce some forms of car crime in given contexts. It will alsocast doubt on the plausibility of a number of mechanisms presumed to play a part.
Having recast the evaluation question, how does one go about answering it? The cluesare already there. At the level of the scheme, what is needed is first, a clearspecification of the mechanism or mechanisms it is intended to try to fire; second, ananalysis of how the CCTV will be operated in order to fire its mechanism/s; third, aspecification of what pattern of outcomes is expected (across time, space, offence typeetc); and fourth the instituting of measurements tailored to capture those expectedoutcome-patterns, and in some cases the mechanisms deemed to have been fired. Itwill be important also to monitor the implementation of the CCTV to check that it isbeing operated in accordance with the potential mechanism-firing as conceived inthe scheme. In devising the scheme, its operation will obviously be tailored to thecontext (which also needs to be monitored) in an effort to achieve the intendedresult.
Monitoring and evaluation, as here specified, are closely tied to mechanism-firing,context and expected outcome-patterns. It may well be that there is uncertainty overwhich mechanism/s are fired with what precise effects. Provided that this is thoughtthrough in advance, this does not matter. Indeed it is to be welcomed, for it creates theopportunity to arbitrate between or measure the relative contributions of differentmechanisms. It is important, finally, to remember to consider unintended as well asintended features of outcome-patterns which might be expected from contextuallyspecified mechanism-firing.
It is hoped that this section highlights the importance of theory for developing andevaluating crime prevention schemes. Without some theory a scheme can have noshape, and its evaluation no direction, The scheme constitutes an hypothesis aboutsocial change, held, however implicitly, in the minds of those designing and im-plementing the scheme. By doing W (implementing a given measure) in situation X(a particular social and physical context) we affect underlying process Y (fire a causalmechanism) which will produce intended effect Z (lead to an outcome-pattern inwhich crime is reduced). Unless we can make fairly precise statements about W, X, Y
6
and Z our evaluation efforts will be ill directed and our outcome measures poorlyfocused. We shall learn little, if anything, that is of value. Evaluation needs to betheory driven.
Thematic studies
A thematic investigation takes a number of schemes and attempts to sift through themechanism/context patterns which are emerging. Thematic studies are parasitic onscheme data of a minimum standard. With a sufficient number of schemes, however,even if there are weaknesses in the data and provided these are not identical across theschemes, some provisional conclusions can be drawn from repeated patterns wherethese are identified. In the best circumstances research would work the other wayround: a framework of actions, mechanisms, contexts and expected outcome-patternswould be theoretically specified and then empirically tested. We are a long way fromthat even with something as simple as CCTV in car parks.
7
3. Results
For six Safer Cities schemes (or suites of schemes) in which CCTV has played a majorpart in efforts to reduce car crime sufficient data were available for incorporation intothis thematic evaluation. The schemes are in Hartlepool, Hull, Bradford, Lewisham,Coventry and Wolverhampton.
Hartlepool
The centre of Hartlepool is circled with car parks, used by both shoppers and workers.Almost all of these are surveilled by CCTV. The only exceptions are some floors in amulti-storey car park. Most of the cameras are tilt, pan and zoom and have an infra redfacility. Thus, they are highly versatile. They can be used day and night for broadsurveillance of wide areas, and can also be used to home in in detail on some specificcar, person or event. Each camera may be surveilled by another. Hence both tam-pering and malfunctions can be observed and appropriate remedial action arranged.
The control room is staffed day and night throughout the year. There is thus no timewhen the cameras are not in operation with a person able to arrange the dispatch ofpolice or security personnel as they judge appropriate. There is a staff of seven securityofficers in all (not all of whom, of course, are on duty at any one time) who can bemobilised and whose daily round is shaped by what they learn of needs from themember of staff in the control room. There is a line from the control room to thepolice station, from which officers can be summoned when required.
The images from all the cameras are stored in encrypted form on a single tape, which isretained for a period before re-use in the event that it might contain evidence whichcan subsequently be used in prosecutions. Re-running the tapes requires, of course, adedicated machine to decode the images. The images carry a running date and time,allowing precise pinpointing of the events displayed. The presence of the cameras isprominently advertised in the car parks in which they operate. A few well publicisedconvictions have followed from the observation of offences on video. The chiefsecurity officer had appeared in court to give an account of what he had seen on thescreen. Also defence lawyers had come to view what had been recorded on someoccasions, following which they had advised clients that their case was weak, and notworth defending.
The above description makes clear that the CCTV system in Hartlepool has beenimplemented in a way which fires several potential crime reducing casual mechan-isms. The efficacy of security personnel as visible capable guardians is increased asCCTV informs their deployment. Signs, well publicised convictions and the cameras
8

themselves remind the potential offender of the risks of apprehension, especially inregard to offences which cannot be quickly completed. The signs also remind cardrivers to leave their vehicles secure. Moreover the pattern of usage of the car park haschanged, furnishing a greater throughput of shopper/parkers in some parts who arepotential observers/guardians. Ample space means that it is unlikely that morecautious drivers are excluding those who are less so.
The data available on the scheme relate to the overall patterns of various car crimes.Unfortunately, as with other work described below, they have not enabled disaggre-gation of effects by homing in on different patterns which would be expectedaccording to the operation of the mechanisms fired. Moreover, the introduction of apayment scheme in October 1989, shortly before installation of CCTV in April 1990,further muddies the picture. Except for one small car park, with 150 spaces (of the1,700 in all), all non-CCTV car parks were also non charge car parks. The paymentscheme potentially fired at least two crime reducing mechanism: first the occasionalpresence of ticket wardens acting as visible guardians; and second the reduced usage ofthe car parks by employees, creating more short term parking and more surveillanceby users. The conjectured outworkings of this potential crime reducing measure couldin principle be compared with those of the CCTV, looking to detailed intra-schemeoutput variations which would follow from alternative mechanism operations. This,though, is possible only in a limited way with the data collected.
The overall pattern of crime rate changes emerges clearly when looking at the movingaverage. Figure 2 shows a three quarter moving average for theft of cars from bothCCTV-covered and non-CCTV covered car parks in Hartlepool from 1989 to 1992,together with available equivalent scaled (1/20) figures for Hartlepool as a whole(from January 1990). The curves are subject to smoothing both from the use ofmoving averages and from the best fit line drawn. They disregard, thus, the quarterlyfluctuation found in the raw figures for the car parks (for these, see Table Al in theappendix). Prior to CCTV installation (and after introduction of the paymentscheme), there is a decline in thefts of cars in both those car parks which came to becovered by CCTV and those not so covered. The downward trend continues in carparks where CCTV was installed but is reversed in the others. The upward swing innon-CCTV car parks in the early stages closely corresponds to that for theft of cars inHartlepool as a whole, though a clear divergence is seen from the third quarter of1990, for which no plausible explanation came to light.
The marked relative advantage of CCTV covered car parks in relation to theft of carsclearly declines over time and there are signs that the underlying local trends begin tobe resumed. This pattern has been found in relation to property marking (Laycock1992), and more generally fits with the ‘life cycle‘ of crime prevention initiativesidentified by Berry and Carter ( 1992). It may, of course, be that there was sometemporary displacement from the CCTV to non-CCTV car parks.
9

Figure 2: Three quarter moving averages for theft of cars in Hartlepool, showingthe total (scaled to 1/20), CCTV covered and non-CCTV covered car parks,1989-1992.
~ CCTV car pks + No CCTV car pks + All H’pool/20Note: The payment scheme was introduced in October 1989 (at the start of the quarter marked4QP), and the CCTV system was installed in April 1990 (at the start of the quarter marked2QC). Given that moving averages are shown the preceding quarter begins to reflect any changefollowing from these initiatives.
10
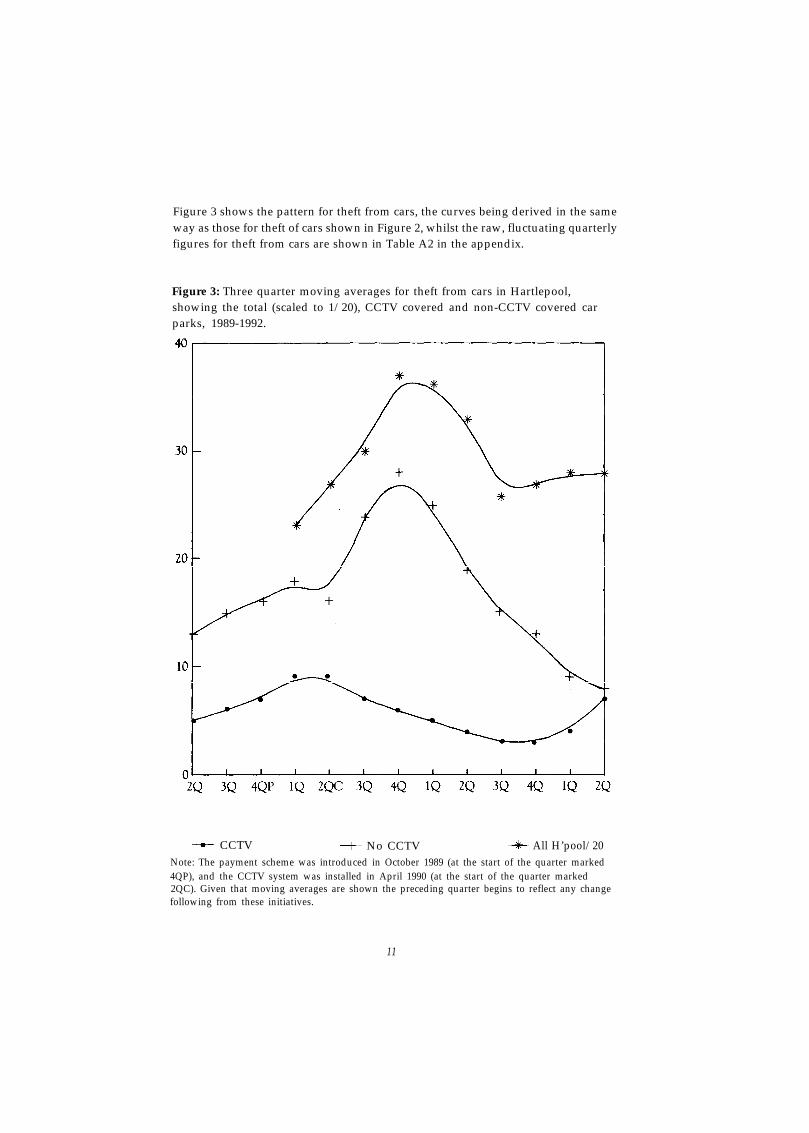
Figure 3 shows the pattern for theft from cars, the curves being derived in the sameway as those for theft of cars shown in Figure 2, whilst the raw, fluctuating quarterlyfigures for theft from cars are shown in Table A2 in the appendix.
Figure 3: Three quarter moving averages for theft from cars in Hartlepool,showing the total (scaled to 1/20), CCTV covered and non-CCTV covered carparks, 1989-1992.
- CCTV + No CCTV + All H’pool/20Note: The payment scheme was introduced in October 1989 (at the start of the quarter marked4QP), and the CCTV system was installed in April 1990 (at the start of the quarter marked2QC). Given that moving averages are shown the preceding quarter begins to reflect any changefollowing from these initiatives.
11
In the car parks covered by CCTV we see a rather more gradual decline in theft fromcars than in the case of theft of cars. This is followed by an increase, which begins tomirror the pattern shown for all Hartlepool car crime. In the short term followinginstallation of CCTV the pattern of theft from cars in non-CCTV car parks matchesremarkably closely the scaled (1/20) pattern for overall theft from cars in Hartlepool,with which that in CCTV-covered car parks is in marked contrast. No plausibleexplanation emerged for the divergence discernible from late 1991 in the pattern fornon-CCTV covered car parks in comparison with that for CCTV covered car parksand the overall trend in Hartlepool.
The clear relative advantage for CCTV covered car parks in relation to patterns oftheft from cars lasts for three quarters following installation. There is again someevidence for the life cycle of crime prevention measures which we noted in relation totheft of cars in Hartlepool.
A reduction in both theft of and theft from cars can thus be seen to have occurred inthe short term following installation of CCTV in some car parks in Hartlepool. Thiscontrasts with the pattern in car parks in which CCTV was not installed and inHartlepool overall, where car crime increased. The downward trend in CCTVcovered car parks, however, was followed by an increase, with signs that this isbeginning to mirror the underlying local trend.
In addition to its use for enhancing the security of car parks, the CCTV in Hartlepoolhas also been put to other crime control purposes, which had neither been plannednor anticipated when the scheme was first mooted. The cameras can be and aredirected to sites where and when trouble is expected, for example to the exits of nightclubs around closing time, to those places where young people congregate both in thedaytime and at night and might be expected to cause trouble, and to the streets tocontrol crowds when there are popular football matches. They have also been used inconjunction with the police to mount special operations in relation to various crimes.The cameras appear to be popular with the police, public, and commercial organis-ations alike. There was no evidence of resistance from anyone to their deployment oruse (cf Honess & Charman 1992).
Hull
In Hull CCTV has been introduced to the Albion Street car park. As in Hartlepool,the monitors are continuously observed. The cameras are also tilt, pan and zoom, withthe versatility which comes from this. Albion is a flat car park, all of which can besurveilled with the cameras. Again as in Hartlepool, the dated and timed images arerecorded in encrypted form, with storage for a period in the event of a need to reviewthe tape for evidential purposes. If necessary, there is a facility in Hull (which is notpresent in Hartlepool) for producing a hard still copy of a frozen image from thescreen. The cameras are routinely controlled and monitors observed by employees ofHull Borough Council, though there is a facility for transmission to the police eitherwith or without their direct control of the cameras. The police can thus be apprised ofsituations in which they might usefully intervene, and can also make their own
12

judgement on the basis of what they can see from the CCTV. The controller of theCCTV can also call on mobile security officers to attend the car park if necessary.
In the Hull car park, both prior to and since the installation of CCTV prepayment wasrequired and attendants’ presence to deal with this has not changed. CCTV wasoperational from November 1991, with the police link in place from December 1991.The figures for recorded car crime changes are given in Table 1. This shows significantreductions in damage to cars (by 45%), in theft of cars (by 88.9%) and in theft fromcars (by 76.3%) in Albion street car park, comparing equivalent seven month periodsbefore and after installation of CCTV. These improvements took place in a contextin which over the same periods in Hull city centre as a whole theft of cars fell by only6%, from 430 to 406, whilst theft from cars rose by 3%, from 961 to 988.
Table 1: Changes in rate of car crime in Albion Street Car Park, Hull, before andafter installation of CCTV
1/11/90-30/6/91 1/11/91-30/6/92 Change
Damage to 11 6 -45%vehicle
Theft of 27 3 -88.9%vehicle
Theft from 38 9 -76.3%vehicle
Comparing February to June 1991 with the corresponding period for 1992, usage ofthe car park between 8.00 am and 6.00 pm increased from 98,663 to 107,064. The rateof usage of other municipal car parks decreased, though some cars may have beensyphoned off to a private multi-storey car park which reduced its fees at the same time,substantially undercutting the council. There is, in this, some evidence that instal-lation of CCTV has if anything increased the rate at which Albion Street wouldotherwise have been used, though the change is not so great that it could plausibly bea mechanism through which the car crime rate reductions would have been effected.What the increased daytime usage may suggest is that the introduction of CCTV hasreduced fear of crime in this car park. It is not clear what if any displacement to carcrime elsewhere there has been. The Hull data do not allow us to clarify themechanism through which car crime has been reduced, beyond saying that usagechanges and natural human surveillance does not seem to have played a part. Thus,we do not know what it is about the CCTV set-up which has led to the reduction incar crime.
13

Usage of CCTV for surveillance purposes has proved a more politically sensitive issuein Hull than in Hartlepool. A published Code of Practice for the Monitoring of CloseCircuit Television regulates the use of the facility. This prohibits, on pain of disciplin-ary action or dismissal, disclosure of matters which are confidential. It also setsconditions for the transfer to the police of transmitted pictures and camera control,and procedures for the use of material in court. Those council officials controllingCCTV at present, which covers a bus station as well as the car park, are aware of itspotentially greater use and are discussing the possibility of its extension to the RailwayStation Car Park. They also see its use for other crime control purposes and havealready worked with the police in relation to drugs offences. Their view is thatextension would be inevitable in changed political circumstances.
Lewisham
The Lewisham scheme operates in a station car park, and is run by the the localtraders’ association. As with Hartlepool and Hull, the car park is pay and display, withno permanent attendant, though tickets are apparently checked very regularly sothere is some official presence. This was so during the year prior to the installation ofCCTV and has remained so since. The system differs from the Hartlepool and Hullschemes in several respects. There are three fixed lens, unadjustable cameras as well asone dummy camera. These cover not quite all the car park. When in automatic modeno-one watches the monitor on which events in the car park are displayed, but theyare recorded to tape on which time and date are superimposed. Thus it is possible toreview tapes if necessary. However, playback does not produce sufficient clarity ofdefinition to make the identification of individuals or reading of number platespossible. Indeed, even viewed ‘live’ one would be hard pressed to recognise aparticular individual, and it is not straightforward to discern number plates. Eveneighteen months after its installation, no arrests have followed from use of theequipment. The monitor and video equipment is located in the basement of a localbusiness, whose proprietor is Chairman of the traders’ association and who casuallywatches the screen as he works. Volunteers also drop in periodically to watch themonitor, and this has led to the police being called out although at the time of writingit was estimated that this had not happened for four to five months. Where there havebeen incidents the tape has been handed to the police, though their use of thematerial is unknown – it was thought unlikely that it was used, and it had certainly ledto no identifiable action. The businessman in whose basement the equipment sitsconscientiously maintains continuous recording, even during bank holidays, when hemakes a special visit to the shop to change tapes. He is convinced of its usefulness.
Notices indicating operation of the equipment are displayed fairly prominently in thecar park. The equipment was installed and began use in April 1991. From April 1st toJuly 1990, there were twenty-four recorded auto-crimes, whereas in the correspon-ding period following installation of the equipment in 1991, there were only six. Datawere not available for Lewisham as a whole, within whose police area the car park islocated, but background patterns are unlikely to explain such a dramatic fall.
14

Assuming the reduction is real, it is clear that the mechanism effecting this reductionhas not been removal of offenders, since none has been caught through the CCTV.They have also played a negligible role in mobilizing police or security staff. Theoutcome figures for this scheme are small, but if the apparent reduction in car crime isreal then the mechanism would seem to be their perceived potential, as assessed bywould-be car criminals, or their impact on the security behaviour of users rather thanthrough other mechanisms described above. This may be reinforced by efforts of thelocal beat officer to disseminate local knowledge of its presence and its ability toidentify people in his work in a junior school which is next to the car park. Followingits commissioning during crime prevention week in 1991, there was substantialpublicity about the scheme in the local newspaper. This was not altogether positive,expressing some anxiety about the introduction of ‘big brother’. That said it will haveserved to communicate the presence of CCTV to local potential offenders and mayhave had a deterrent effect. The negative publicity has since died away.
The arrangements for this scheme are very economical. Beyond the initial instal-lation costs of £13,053 in 1991, very little expense has been incurred. Lewishamborough council pays the cost of electricity for the cameras and the silversmith paysthe cost of the electricity for the monitor and video recorder. The platform used to putup and later take down the Christmas Lights is also used to reach the cameras and toclean them.
Bradford
John Street Car Park lies in the centre of Bradford. It is multi-story, has had CCTVinstalled on each floor, and there are signs prominently placed round the car parkindicating its operation. Lighting has been improved and the walls painted. It washoped, when the cameras were first installed in July 1991, that one of them on the topfloor would also cover the adjacent Simes Street and Rawson Street surface car parks.
In the event, because the designated camera lacked the power to do so, an additionalcamera specifically for this purpose was attached to the side of the John Street car parkin March 1992. The monochrome CCTV images are stored as in Hartlepool and Hull.In a control room for a variety of CCTV installations in Bradford, where hard copycan also be made, screens are watched daily from 6.30am to the following 3.30am bymembers of a dedicated team. No convictions have arisen specifically from this work.The John Street multi-storey and other surface car parks are all pay and display, andwere so before the security upgrade.
The following data, in Tables 2 and 3, compare the thefts of and thefts from carsduring the twelve months prior to the installation of CCTV in John Street in July1991 with the corresponding figures for the succeeding twelve months. The changesin the John Street Car Park figures are then compared with those for the surroundingstreets, where parking also occurs, as well as with rates for the Simes and RawsonStreet car parks, and finally with Bradford City Centre Sub-Division as a whole.
15
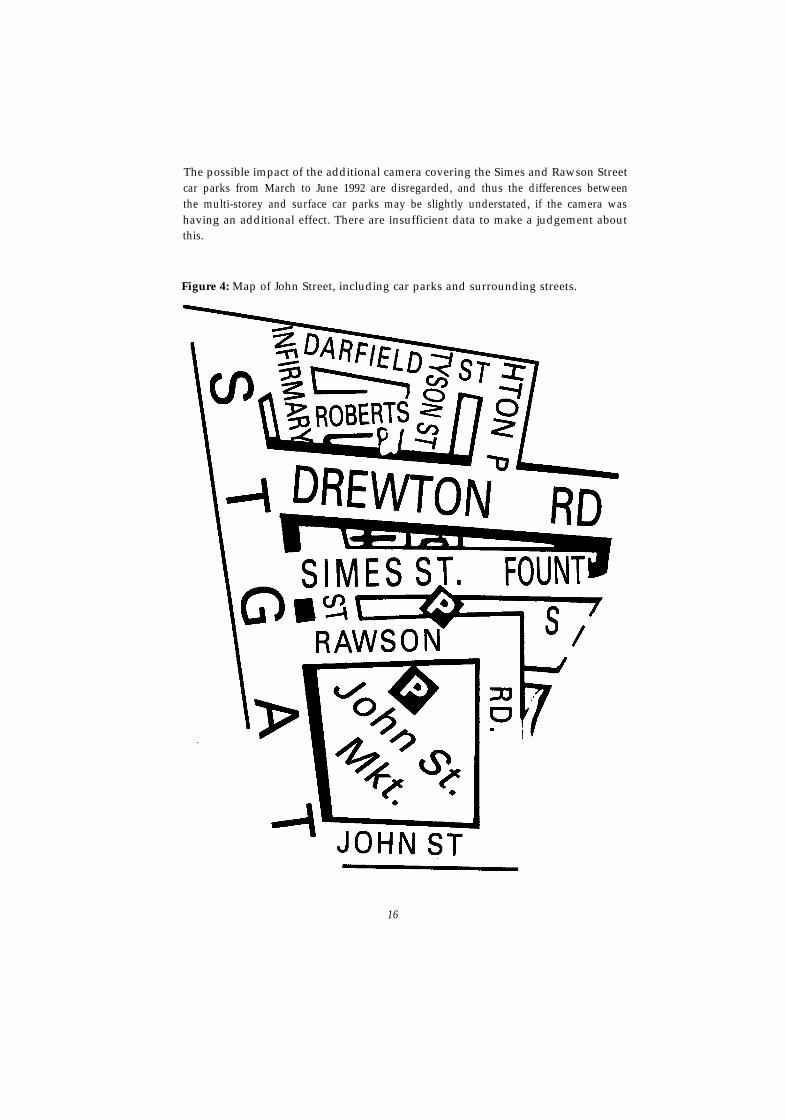
The possible impact of the additional camera covering the Simes and Rawson Streetcar parks from March to June 1992 are disregarded, and thus the differences betweenthe multi-storey and surface car parks may be slightly understated, if the camera washaving an additional effect. There are insufficient data to make a judgement aboutthis.
Figure 4: Map of John Street, including car parks and surrounding streets.
16

Table 2: Theft from cars in the John Street Car Parks, adjacent car parks andlocal streets, and Bradford City Centre Sub-Division before and after installationof CCTV.
Table 3: Theft of cars in the John Street Car Parks, adjacent car parks and localstreets, and Bradford City Centre Sub-Division before and after installation ofCCTV.
It can be seen that the John Street Car Park has enjoyed a substantial reduction inboth theft from (by 68%) and theft of cars (by 43%) in the twelve month followinginstallation of CCTV and other associated security upgrading. This is in markedcontrast with the surface car parks and local streets where there has been someincrease in these car crimes, and with the city centre sub-division where car crime hasalso risen.
As elsewhere, it is clear that the mechanism effecting crime reduction here cannot beactual apprehension of offenders because no-one was arrested, nor is it deployment ofsecurity personnel, since these were not conveniently at hand. The range of workundertaken, including CCTV, painting and lighting improvements, may have in-creased the perceived risk to potential offenders at least for the period of crimereduction identified here.
17

In Bradford, CCTV has been adapted for surveillance of streets with no significantlocal opposition.
Coventry
The car park superintendent in Coventry has taken a particular interest in car crime.He is a member of the local Crime Prevention Panel, and has worked closely with thepolice in attempting to control car crime in his car parks, recently with funding fromSafer Cities. Over the years, a wide variety of measures has been adopted in various carparks. These include reduction in the height of walls and cutback of foliage toimprove surveillance, erection of high fencing to restrict access by foot, painting andlighting upgrades to improve visibility and reduce fear, as well as installation ofCCTV together with signs alerting those in the car parks that it is in operation.CCTV monitors are continuously watched in the daytime and evening, but notthrough the night. Video recordings are made and kept as in other areas in the eventof requests from the police to view them, and there are facilities for making hard copyof particular images.
Figure 5: January to August rates of theft of and theft from cars in Coventryoverall (scaled to 1/10), and in council run public car parks, 1987-1992.
I
18

Meticulous crime records are kept and efforts are made to improve security in the lightof emerging car crime patterns. The apparent overall effect on rates of theft of cars inCoventry is striking. Theft from cars has proved much more difficult to control, asFigure 5 indicates (see also Table A3 in the Appendix).
The higher of the bottom two lines in Figure 5 shows the changing rate of theft of carsin Coventry in January to August of each year from 1987 to 1992, scaled to one tenth.The very bottom line shows the number of thefts of cars in Coventry in council runpublic car parks over the same periods. It is clear that after initial similar falls, the linesdiverge, theft of cars increasing in Coventry overall, but decreasing in the car parks.Table A3 reinforces the point. It shows that the percentage of all thefts of cars inCoventry, which are from public council car parks, declines annually, beginning at9.2% in 1987, and ending at 2.7% in 1992.
The top two lines in Figure 5 relate to theft from cars. The higher of the two at thebeginning and end of the graph relates to theft from cars in Coventry as a whole forJanuary to August each year from 1987 to 1992, scaled to one tenth. The lower of thetop two lines relates to theft from cars in the council run public car parks. The patternis much less clear than it is for theft of cars, reflecting greater fluctuation in theft fromcars, which is accentuated in the case of offences committed in the car parks. TableA3 does not indicate the same steady decline in the proportion of thefts from carsoccurring in these car parks as it does for theft of cars.
Five car parks, which jointly are responsible for about two thirds of the public carpark related crime in Coventry, are examined in greater detail: Barracks, BondStreet, Fairfax, Greyfriars, and Whitefriars. The year by year changes in their carcrime rates, and the security related improvements which have been made in them,can be seen in Table 4. This is quite complex, containing a wide range of data. Whilstfor 1987 the base numbers of incidents are shown, in subsequent years percentagechanges are given. These compare January to August figures with those for the sameperiod in the immediately preceding year. For example, the 47% increase in theft ofcars, noted in relation to Barracks Car Park (the column headed BAR) in January toAugust 1989, compares the number of incidents in that year with the number in thesame period in 1988. In the appendix, Table A4 gives the raw figures from which thecalculations have been made; it shows that the number of thefts of cars from BarracksCar park rose from 15 in 1988 to 22 over the equivalent months in 1989. Table 4 alsoindicates that the car park was painted in 1989 (’P’), and had two cameras installed aspart of a CCTV surveillance system in 1988 (2C). Some readers may find clearer thegraphical representation of the changes identified in these tables in Figure A1 in theappendix.
19

Table 4: Changes in car crime rates and crime prevention measures, Coventry carparks.
Note: TO=theft of; TF=theft from; L=lighting upgrade; P=painting; F=fencing; C=number ofCCTV cameras; BAR=Barracks (surface, short stay, pay on exit, 1029 spaces); BON=Bond St.(surface, short stay, pay and display, 415 spaces); COX=COX St. (surface, long stay, pay anddisplay, 354 spaces); FAI=Fairfax St. (multi-storey, short stay, pay on exit, 318 spaces);GRE=Greyfriars (surface, short stay, pay and display, 138 spaces); WHI=Whitefriars (surface,long stay, pay and display, 140 spaces); figures have been marked where either base numberinvolved in calculating change is less than 10.
20

It is not easy to discern precise patterns in these data, in part because information onthe months in which improvements were made was not available. However, a numberof points emerge:
a)
b)
c)
d)
e)
f)
Theft of and theft from cars appear to vary independently. At 15 points thedirection of change differs between theft of and theft from, whilst in theremaining 14 the direction of change is the same (in one instance there was nochange in theft from and an increase in theft of cars).
Theft from cars has a more erratic pattern that theft of cars.
Overall, a much greater impact has been had on theft of than on theft from cars.
There is no clear, sustained pattern of reduction following individual securityimprovements for particular car parks.
The overall impact on the openness of car parks to crime because of attention tothe issue may be more important than individual measures taken.
Whitefriars car park saw a dramatic reduction in theft of and theft from cars in1991, largely sustained in 1992, following a broad approach as indicated togetherwith systematic efforts to enhance surveillance through regular trimming ofbushes.
Wolverhampton
In late February 1991 CCTV (with pan, tilt and zoom facilities) was installed to thecar park at the rear of Bilston Leisure Centre, where signs stating that it is in operationare displayed. During the day the single camera overlooks the car park, of which thereis no natural surveillance. The images are beamed through to a monitor which sitsbehind the centre’s reception desk. Outside opening hours the camera is directed tothe roof of the building which had been used as a way to break in. The CCTV imagesare also recorded 24 hours a day in the event of the police needing them. Noconvictions have been secured on the basis of observations made possible throughCCTV.
Table 5 compares the month by month figures for theft of and theft from cars for theyears before and after installation of CCTV. A very slight reduction in theft of carscan be seen (from 11 to 9), and a much greater one in theft from cars (from 28 to 15).In considering these figures it is worth noting, a) that in the subdivision as a wholetheft from vehicles decreased by 3% in the period in question, while theft of themincreased by 3%; b) usage of the leisure centre decreased by 28%; and c) the brief spateof thefts from cars in December 1990 has a high and possible distorting impact on theapparent pattern.
For part of the year we also have data on the times when offences were committed. Ofthe 22 car crimes committed immediately before installation of CCTV 17 wererecorded before 8.00pm and 5 after that time. Of 13 car crimes after CCTV
21

Table 5: Car Crime at Bilston Leisure Centre before and after installation ofCCTV.
installation 5 were recorded before 8.00pm and 8 later in the evening. This mayplausibly suggest that CCTV could be playing a part in inhibiting car crime duringthat time of the day when the camera is beamed at the car park, but not when it isdirected at the roof. This would suggest that those involved in committing car crimesare persuaded of the potential of CCTV to apprehend them, and are sufficientlyattentive to its operation to take advantage of periods when it could not, in principle,have that use.
22

4. Conclusion
The data from Bradford, Lewisham, Coventry, Hartlepool, Hull and Wolverhamptonpresented above provide quite strong evidence, consistent with Poyner (1992), thatschemes deploying CCTV have generally led to reductions in various categories of carcrime. It is more difficult on the basis of the available data to make a judgement aboutwhat it is about CCTV and its various modes of operation which have had that effectin the contexts described. It is also not possible to estimate what displacement ofoffences by place, type or time has occurred. The following look the most promisingconjectures:
1. Although matters might change, and rapid improvements are certainly beingmade in systems, it is not presently essential that CCTV be technically highlysophisticated to have an impact on crime in car parks (though this might ofcourse be necessary for other crimes in different settings), nor is continuoussurveillance of monitors necessary. In few cases in the systems examined here,would it be easy quickly to obtain a sufficiently sharp image to make an offenderrecognizable. Moreover, with the exception of Hartlepool, it would be unlikelythat sight of an offender would lead to prompt deployment of security personnelto try and catch them in the act or drive them away.
2. Since only a negligible number of arrests have followed from the installation ofCCTV the removal of offenders does not constitute the mechanism throughwhich CCTV currently reduces car crime. It is difficult to conceive of a situ-ation in which technical wizardry will be married to a sufficiently large popu-lation of camera manipulators and police or security guards to obtain recogniz-able images of significant numbers of offenders, to identify them, to find them andfinally to prosecute them. Nevertheless, CCTV, with other situational measures,can alter the perceived patterns of opportunity for crime in car parks as sites forcar crime, and lead to a reduction or redistribution of offences.
3. The effect of CCTV appears to be enhanced when it is installed alongside othercomplementary measures, raising its credibility as a source of increased risk topotential offenders. Additional measures may include other physical alterationssuch as lighting, fencing and painting (as in Bradford, Coventry, and Hull); thedeployment of visible security personnel (as in Hartlepool); publicity of thepotential for offender identification (as in Lewisham); and the broadcasting ofsuccesses, where they can be claimed (as in Hartlepool). The effects are mostequivocal, where enhancement was least (as in Wolverhampton). In Poyner’sGuildford study (1992) of short term impact, other measures were adoptedimmediately preceding implementation of CCTV (lighting improvement andfoliage cut-back), there were (unusually) arrests attributable to CCTV, and aloudspeaker facility enabled security guards to shout warnings. All this may havecombined to indicate to the potential offender that risks were increasing as carcrime was being attended to. The assignment of effects to CCTV in reducingtheft from cars in the car park covered and the idea that these have spilt over to
23

the car park not covered by CCTV are premature. They assume particular causalmechanisms which may not be those which operated.
4. AS with many other crime prevention efforts, if and when the real potential ofCCTV to lead to apprehension loses credibility amongst car criminals, the effectwill begin to fade, though by highly publicised (over)-statement of successesperiodic effectiveness may be reestablished. There is some evidence, where thereare data over a long period as in Hartlepool, that CCTV installation to reducecrime follows the life cycle of initiatives identified by Berry and Carter (1992). Ifrates begin to increase system credibility might be reasserted through specialefforts by the police to apprehend offenders and to ensure through appropriatepublicity that any part CCTV might have played is communicated to prospectiveoffenders.
5. The evaluation of crime prevention initiatives ideally needs to go beyond thecomparison of one year before and one year after patterns. This raises questionsover individual cases, such as some of those reported here, as it does of Poyner’sstudy. There are questions of impact maintenance which need both theoreticalexplication and empirical study. In this case in particular the relative long termeffectiveness of ‘all systems’ (large-scale once for all security upgrades), and ‘dripfeed’ (episodic injections of new crime prevention activity) approaches need tobe addressed. Provision for awards for secured car parks (HOCPC 1992) aresuggestive of an all systems approach. There is certainly evidence here for theeffectiveness of packages of measures. However, it may be a mistake to assumethat a single major blitz will have a sustained effect if the crime inhibitingmechanism amounts to persuading potential offenders of increased risk. The lifecycle model, for which there is also some evidence, suggests that highly publi-cised periodic injections of crime prevention effort may be more effective. Theappropriate choice between all systems, particular intervention mixes and pat-terns of drip feed depends on the (context specific) mechanisms through whicheffects are mediated.
6. Theft of and theft from cars seem to have contrasting patterns. Motivations areunlikely to be the same. Moreover, problems for those committing the offencewill be different. Escape on foot is clearly possible for theft from, but not for theftof cars. Moreover, theft of may take rather longer than theft from cars. The crimeprevention problems differ accordingly. CCTV’S prospects, as currently im-plemented, look better for theft of than theft from cars. Notwithstanding thisgeneral pattern, there are, of course, examples wherein the short term theft fromseems to have decreased more than theft of cars. Fixed CCTV cameras, beamedat pedestrian egresses, might usefully be tried to see whether this could increaseperceived risk amongst those committing crime on foot, and have an impact ontheft from cars.
7. Extension of the use of CCTV from car crime reduction efforts to other crimeprevention or detection purposes appears common when technically feasible.Apart from some initial civil liberties worries expressed by local politicians and
24

newspapers, this has been accomplished with minimal objections, and none fromthe general public, confirming the findings of Honess and Charman (1992).
The discussion towards the beginning of this paper constitutes a research agenda. Itcan be seem that, though a little progress has been made, there is scope for more work.What can be said at this stage with some confidence is that CCTV can play a part, inconjunction with other measures, in reducing car crime, especially theft of cars. It is,however, no panacea. Coventry furnishes an instructive example of what can beachieved with sustained broadly based efforts to address the issue over a number ofyears.
Finally, turning from CCTV and car parks in particular to crime prevention evalu-ation efforts more generally, it should be clear that post hoc evaluations of this kindwill have built-in limitations related to the data which have been collected, giventhat opportunities for retrospective reconstruction of evidence will normally be verylimited. Informative scheme level evaluations, it is suggested, are most effectivelyconducted in terms of the mechanism, context and outcome-pattern frameworkoutlined earlier in this paper. This will enable evaluation data collection to be sharplyfocused on particular outcome-patterns, and monitoring to be focused on salientfeatures of context and scheme delivery. If schemes are evaluated in this way thematicstudies of suites of schemes can be made more instructive.
Just how uninformative weakly conceived scheme evaluations can be, when aggre-gated, is shown in the Dutch experience, where 200 projects were looked at followinga five year crime prevention programme (Polder 1992). This study concluded a) thatcrime prevent ion efforts need to be large enough to have an impact; b) that someproblems may be too serious to achieve results with prevention; and c) that strategieschosen make a difference, in particular increasing the effort needed and perceivedprobability of sanction can deter potential offenders. There is no quarrel with this,only that more specific findings might be hoped for. If series of schemes and theirassociated evaluations are performed in the way suggested here and are then alsoorientated to one another, cumulative understanding of what can work in whatcircumstances can be hoped for. The longer term pay off will be more economical andmore effective crime prevention.
No-one needs to be unduly defensive because we cannot prove that effects followfrom our interventions. Proof is not possible in the hardest of the hard sciences. Theyare all, as Popper (1972) has convincingly argued, irredeemably fallible. A fortiori,no-one can sensibly expect proofs outside the laboratory in the pragmatic world ofdeveloping responses to crime, where there are many specific and thorny evaluationproblems (Ekblom 1990). All that can be hoped for is movement towards bettertheories informing better practice, and that can only happen if evaluations areperformed well.
25

Appendix
Table A1: Quarterly figures for theft of motor vehicles from Hartlepool car parksJanuary 1989-September 1992
26
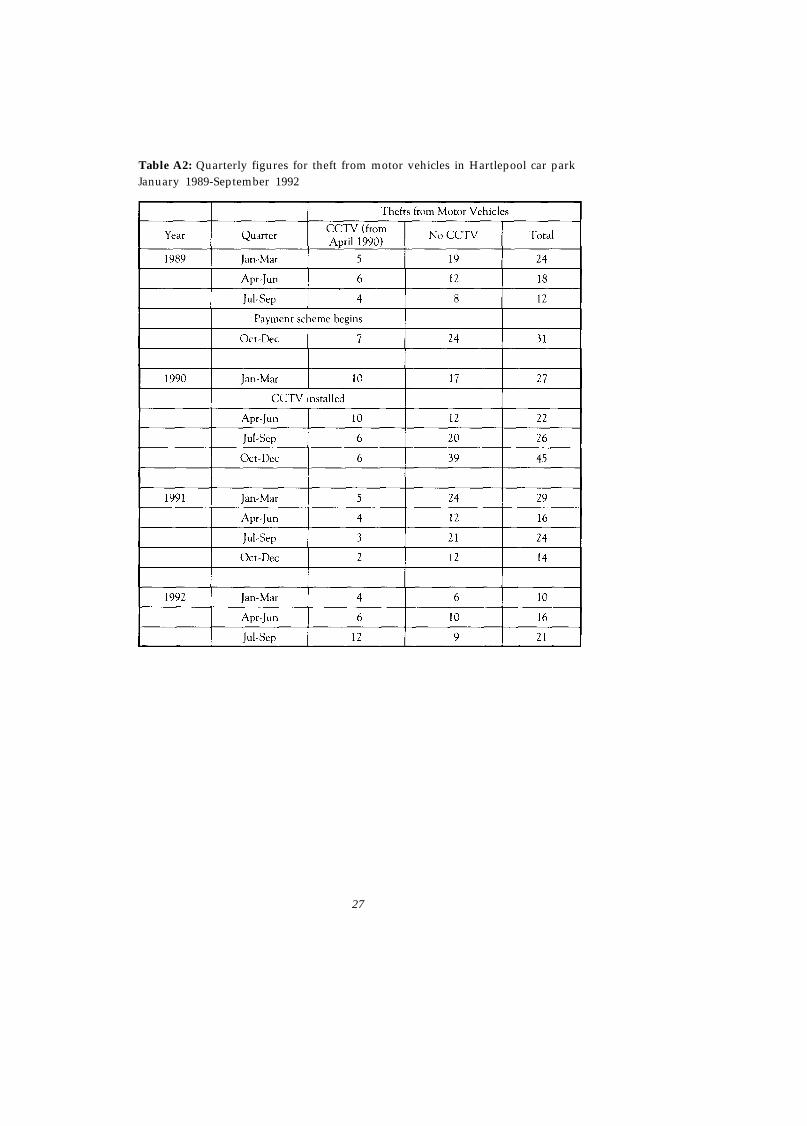
Table A2: Quarterly figures for theft from motor vehicles in Hartlepool car parkJanuary 1989-September 1992
27

Table A3: Changes in car crime in Coventry, overall and in city centre councilcar parks
Table A4: Car crime rates in selected Coventry car parks 1987-1992, January toAugust of each year.
Note: BAR=Barracks; BON=Bond St.; COX=COX St; FAI=Fairfax St.; GRE=Greyfriars;WHI=Whitefriars.
28

Figure A1: Graphical representation of data presented in Tables 4 and A4,concerning car crime in individual car parks in Coventry.
29

References
Austin, C. (1988) The Prevention of Robbery at Building Society Branches, CrimePrevention Unit Paper 14. London: Home Office.
Berry, G. & Carter, M. (1992) Assessing Crime Prevention Initiatives: the first steps,Crime Prevention Unit Paper 31. London: Home Office.
Clarke, R & Harris, P. (1992) ‘The rational choice perspective on the targets ofautomobile theft’, Criminal Behaviour and Mental Health, Vol 2, pages 25-42.
Ekblom, P. (1990) ‘Evaluating crime prevention: the management of uncertainty’, inKemp, C. (ed) Current Issues in Criminological Research, vol 2. Bristol: Bristol Centrefor Criminological Research.
Home Office (1992) Home Office Statistical Bulletin. London: Home Office.
HOCPC (1992) Secured Car Parks.
Hope, T. (1987) ‘Residential aspects of autocrime’, Research Bulletin, No 23, pages28-33.
Honess, T. & Charman, E. (1992) Closed Circuit Television in Public Places, CrimePrevention Unit Paper 35. London: Home Office.
Laycock, G. (1992) ‘Operation identification, or the power of publicity’, in Clarke,R. (ed) Situational Crime Prevention: Successful Case Studies. New York, Harrow andHeston.
Laycock, G. & Austin, C. (1992) ‘Crime Prevention in Parking Facilities’, SecurityJournal, Vol 3, pages 154-159.
Mayhew. P, Clarke, R, & Hough, M. (1980) ‘Steering column locks and car theft’,in Clarke, R. & Mayhew, P. (eds) Designing out Crime. London: HMSO.
Mayhew, P. & Aye Maung, N. (1992) Surveying crime: findings from the 1992British Crime Survey’, Research Findings, No 2, Home Office Research and StatisticsDepartment.
Pawson, R. & Tilley, N. (1992) ‘Re-evaluation: rethinking research on correctionsand crime’, Yearbook of Correctional Education, pages 1-31.
Polder, W. (1992) ‘Crime Prevention in the Netherlands: pilot projects evaluated’,Dutch Penal Law and Policy 07.
Popper, K. (1972) Objective Knowledge, Oxford: The Clarendon Press.
30

Poyner (1992) ‘Situational crime prevention in two parking facilities’ in Clarke, R.(ed) Situational Crime Prevention: Successful Case Studies. New York, Harrow andHeston.
Poyner, B, & Webb, B. (1991) Crime Free Housing. Oxford: ButterworthArchitecture.
Southall, D. & Ekblom, P. (1986) Designing for Car Security: towards a crime free car.Crime Prevention Unit Paper 4. London: Home Office.
Webb, B., Brown, B., & Bennett, K. (1992) Preventing Car Crime in Car Parks.Crime Prevention Unit Paper 34. London: Home Office.
31

Police Research Group Crime Prevention Unit Series
1. Reducing Burglary: a study of chemists’ shops. Gloria Laycock. 1985. v+7pp.(0 86353 154 8).
2. Reducing Crime: developing the role of crime prevention panels. Lorna J. F.Smith and Gloria Laycock. 1985. v+14pp. (0 86252 189 0).
3. Property Marking: a deterrent to domestic burglary? Gloria Laycock. 1985.v+25pp. (0 86252 193 9).
4. Designing for Car Security: towards a crime free car. Dean Southall and PaulEkblom. 1986. v+25pp. (0 86252 222 6).
5. The Prevention of Shop Theft: an approach through crime analysis. PaulEkblom. 1986. v+19pp. (0 86252 237 4).
6. Prepayment Coin Meters: a target for burglary. Nigel Hill. 1986. v+15pp.(0 86252 245 5).
7. Crime in Hospitals: diagnosis and prevention. Lorna J. F. Smith. 1987. v+25pp.(0 86252 267 6).
8. Preventing Juvenile Crime: the Saffordshire Experience. Kevin Heal and GloriaLaycock. 1987. v+29pp. (0 86252 297 8).
9. Preventing Robberies at Sub-Post Offices: an evaluation of a security initiative.Paul Ekblom. 1987. v+34pp. (0 86252 300 1).
10. Getting the Best out of Crime Analysis. Paul Ekblom. 1988. v+38pp. (0 86252307 8).
11. Retail Crime: Prevention through Crime Analysis. John Burrows. 1988.v+30pp. (0 86252 313 3).
12. Neighbourhood Watch in England and Wales: a locational analysis. SohailHusain. 1988. v+63pp. (0 86252 314 1).
13. The Kirkholt Burglary Prevention Project, Rochdale. David Forrester, MikeChatterton and Ken Pease with the assistance of Robin Brown. 1988. v+34pp.(0 86252 333 8).
14. The Prevention of Robbery at Building Society Branches. Claire Austin. 1988.v+18pp. (0 86252 337 0).
15. Crime Prevention and Racial Harassment in Asian-run Small Shops: the scopefor prevention. Paul Ekblom and Frances Simon with the assistance of SnehBirdi. 1988. v+54pp. (0 86252 348 6).
16. Crime and Nuisance in the Shopping Centre: a case study in crime prevention.Susan Phillips and Raymond Cochrane. 1988. v+32pp. (0 86252 358 3).
17. The Prevention of Fraud. Michael Levi. 1988. v+19pp. (0 86252 359 1).18. An Evaluation of Domestic Security Surveys. Gloria Laycock. 1989. v+33pp.
(0 86252 408 3).19. Downtown Drinkers: the perceptions and fears of the public in a city centre.
Malcolm Ramsey. 1989. v+23pp. (0 86252 419 9).20. The Management and Prevention of Juvenile Crime Problems. Barrymore
Cooper. 1989. v+63pp. (0 86252 420 2).
32

21. Victim Support and Crime Prevention in an Inner-City Setting. Alice Sampsonand Graham Farrell. 1990. v+27pp. (0 86252 504 7).
22. Lagerland Lost? An experiment in keeping Drinkers off the street in centralCoventry and elsewhere. Malcolm Ramsey. 1990. v+38pp. (0 86252 520 9).
23. The Kirkholt Burglary Prevention Project: Phase II. David Forrester,Samantha Frenz, Martin O’Connell and Ken Pease. 1990. v+51pp. (0 86252).
24. Probation Practice in Crime Prevention. Jane Geraghty. 1991. v+45pp.(0 86252 605 1).
25. Lessons from a Victim Support Crime Prevention Project. Alice Sampson.1991. v+41pp. (0 86252 616 7).
26. The Prevention of Cheque and Credit Card Fraud. Michael Levi, Paul Bisselland Tony Richardson. 1991. v+52pp. (0 86252 633 7).
27. Making Crime Prevention Pay: initiatives from business. John Burrows. 1991.v+50pp. (0 86252 629 9).
28. The Influence of Street Lighting on Crime and Fear of Crime. Stephen Atkins,Sohail Husain and Angele Storey. 1991. v+59pp. (0 86252 668 X).
29. The Effect of Better Street Lighting on Crime and Fear: a Review. MalcolmRamsay with the assistance of Rosemary Newton. 1991. v+48pp. (0 86252 670 1).
30. Reducing Crime on the London Underground. Barry Webb and Gloria Laycock.1992. v+30pp, (0 86252 688 4).
31. Assessing Crime Prevention Initiatives: The First Steps. Geoff Berry and MikeCarter. 1992. v+46pp. (0 86252 823 2).
32. Tackling Car Crime. Barry Webb and Gloria Laycock. 1992. v+32pp. (0 86252832 1).
33. Car Theft in England and Wales: The Home Office Car Theft Index. GeorgeHoughton. 1992. v+36pp. (0 86252 712 0).
34. Preventing Car Crime in Car Parks. Barry Webb, Ben Brown and KatherineBennett. 1992. v+40pp. (0 86252 708 2)
35. Closed Circuit Television in Public Places. Terry Honess and ElizabethCharman. 1992 v+41pp. (0 86252 711 2).
36. Multiple Victimisation. Racial Attacks on an East London Estate. AliceSampson and Coretta Phillips. 1992 v+33pp. (0 86252 736 8).
37. Theft and Loss from UK Libraries: A National Survey. John Burrows and DianeCooper. 1992. v+56pp. (0 86252 777 5).
38. Safer Cities and Community Safety Strategies. Nick Tilley. 1992. v+41pp.(0 86252 763 5).
39. Community Service and Crime Prevention: the Cheadle Heath Project.Mary Barker, Ken Pease and Barry Webb. 1992. v+36pp. (0 86252 769 4).
40. Car Crime and Young People on a Sunderland Housing Estate. Eileen Spencer.1992 v+34pp. (0 86252 790 2).
41. Developing Police Crime Prevention Management and Organisational Change.Valerie Johnston, Joanna Shapland and Paul Wiles. 1993, v+31pp.(0 86252 910 7).
33