understanding asynchronous code thomas lieber
TRANSCRIPT

Understanding Asynchronous Code
by
Thomas Lieber
B.S.E. Computer Science, Princeton University (2009)
Submitted to the Department of Electrical Engineering and ComputerScience
in partial fulfillment of the requirements for the degree of
Master of Science
at the
MASSACHUSETTS INSTITUTE OF TECHNOLOGY
June 2013
© Massachusetts Institute of Technology 2013. All rights reserved.
Author . . . . . . . . . . . . . . . . . . . . . . . . . . . . . . . . . . . . . . . . . . . . . . . . . . . . . . . . . . . . . . . .Department of Electrical Engineering and Computer Science
May 22, 2013
Certified by. . . . . . . . . . . . . . . . . . . . . . . . . . . . . . . . . . . . . . . . . . . . . . . . . . . . . . . . . . . .Robert C. Miller
Associate ProfessorThesis Supervisor
Accepted by . . . . . . . . . . . . . . . . . . . . . . . . . . . . . . . . . . . . . . . . . . . . . . . . . . . . . . . . . . .Leslie Kolodziejski
Chair, Department Committee on Graduate Students

2
Understanding Asynchronous Code
by
Thomas Lieber
Submitted to the Department of Electrical Engineering and Computer Scienceon May 22, 2013, in partial fulfillment of the
requirements for the degree ofMaster of Science
Abstract
JavaScript on the web is difficult to debug due to its asynchronous and dynamicnature. Traditional debuggers are often little help because the language’s idioms relyheavily on non-linear control flow via function pointers. The aim of this work is tocreate a debugging interface that helps users understand complicated control flowin languages like JavaScript. This thesis presents a programming editor extensioncalled Theseus that uses program tracing to provide real-time in-editor feedback sothat programmers can answer questions quickly as they write new code and interactwith their application. Theseus augments the call graph with semantic edges thatallow users to make intuitive leaps through program traces, such as from the start ofan asynchronous network request to its response. Participants in lab and classroomstudies found Theseus to be a usable replacement for traditional breakpoint andlogging tools, though no significant difference was found in their ability to completeprogramming tasks.
Thesis Supervisor: Robert C. MillerTitle: Associate Professor
3

Acknowledgments
My advisors Rob Miller and Joel Brandt. Max Goldman, Katrina Panovich, Elena
Agapie, Elena Glassman, Juho Kim. All of UID, really. Henry Lieberman. Erek
Speed, Stephie Wu, Ruben Perez, and Calvin Lewis for being pretty much sane. Ge
Wang and Perry Cook for being pretty much insane. Nick Bryan, Jeff Mickey. Mom,
Adrienne, Grandma, and the rest of my family and friends. Moxie.
This work was supported in part by Adobe, and by the National Science Foun-
dation under award number SOCS-1111124. Any opinions, findings, conclusions, or
recommendations in this thesis are the author’s, and they do not necessarily reflect
the views of the sponsors.
a little further down the line,
another little piece of mind
4

Contents
1 Introduction 9
1.1 Motivation & Problem . . . . . . . . . . . . . . . . . . . . . . . . . . 9
1.2 Theseus . . . . . . . . . . . . . . . . . . . . . . . . . . . . . . . . . . 10
1.3 Benefits . . . . . . . . . . . . . . . . . . . . . . . . . . . . . . . . . . 12
1.4 Specific Contributions . . . . . . . . . . . . . . . . . . . . . . . . . . 13
1.5 Organization of This Document . . . . . . . . . . . . . . . . . . . . . 13
2 Related Work 14
2.1 Interrogative Debugging . . . . . . . . . . . . . . . . . . . . . . . . . 15
2.2 Answering Reachability Questions . . . . . . . . . . . . . . . . . . . . 15
2.3 Omniscient Debuggers . . . . . . . . . . . . . . . . . . . . . . . . . . 16
2.4 Control Flow Visualization . . . . . . . . . . . . . . . . . . . . . . . . 17
2.5 Collecting Program Traces . . . . . . . . . . . . . . . . . . . . . . . . 18
3 User Interface 20
3.1 Call Counts & Reachability Coloring . . . . . . . . . . . . . . . . . . 20
3.2 Structured, Retroactive Logging . . . . . . . . . . . . . . . . . . . . . 22
3.2.1 Asynchronous Links . . . . . . . . . . . . . . . . . . . . . . . 24
3.3 Usage Scenario . . . . . . . . . . . . . . . . . . . . . . . . . . . . . . 25
3.3.1 Discussion . . . . . . . . . . . . . . . . . . . . . . . . . . . . . 26
4 System Design 27
4.1 Trace Collection with fondue . . . . . . . . . . . . . . . . . . . . . . . 27
5
4.1.1 Nodes: Signposts of Execution Flow . . . . . . . . . . . . . . . 28
4.1.2 Source Code Transformations . . . . . . . . . . . . . . . . . . 30
4.1.3 Capturing Variable Values . . . . . . . . . . . . . . . . . . . . 33
4.1.4 Accessing the Trace . . . . . . . . . . . . . . . . . . . . . . . . 34
4.2 Debugging with Theseus . . . . . . . . . . . . . . . . . . . . . . . . . 35
4.2.1 Node.js . . . . . . . . . . . . . . . . . . . . . . . . . . . . . . 35
4.2.2 Chrome . . . . . . . . . . . . . . . . . . . . . . . . . . . . . . 36
5 Evaluation 37
5.1 Lab Study . . . . . . . . . . . . . . . . . . . . . . . . . . . . . . . . . 37
5.1.1 Methods . . . . . . . . . . . . . . . . . . . . . . . . . . . . . . 38
5.1.2 Results . . . . . . . . . . . . . . . . . . . . . . . . . . . . . . . 43
5.2 Node.js Mini-Course . . . . . . . . . . . . . . . . . . . . . . . . . . . 53
5.2.1 Observations . . . . . . . . . . . . . . . . . . . . . . . . . . . 54
6 Conclusions & Future Work 59
A Source Code From the Lab Study 65
A.1 Task T2: du . . . . . . . . . . . . . . . . . . . . . . . . . . . . . . . . 65
A.2 Task T3: Laggy AJAX UI . . . . . . . . . . . . . . . . . . . . . . . . 65
A.2.1 index.html . . . . . . . . . . . . . . . . . . . . . . . . . . . . . 65
A.2.2 main.js (included from index.html) . . . . . . . . . . . . . . . 67
A.3 Task T4: Real-Time Chat . . . . . . . . . . . . . . . . . . . . . . . . 68
A.3.1 app.js (Node.js server code) . . . . . . . . . . . . . . . . . . . 68
A.3.2 index.html . . . . . . . . . . . . . . . . . . . . . . . . . . . . . 69
A.3.3 main.js (included on index.html) . . . . . . . . . . . . . . . . 70
A.4 Task T5: Faulty Auto-Complete . . . . . . . . . . . . . . . . . . . . . 71
A.4.1 app.js (Node.js server) . . . . . . . . . . . . . . . . . . . . . . 71
A.4.2 index.html . . . . . . . . . . . . . . . . . . . . . . . . . . . . . 74
6
List of Figures
1-1 Screenshot of Theseus in action . . . . . . . . . . . . . . . . . . . . . 10
3-1 Screenshot of Theseus in action . . . . . . . . . . . . . . . . . . . . . 21
3-2 Screenshot of call counts and reachability coloring . . . . . . . . . . . 21
3-3 How the structured log is constructed . . . . . . . . . . . . . . . . . . 24
4-1 System design overview . . . . . . . . . . . . . . . . . . . . . . . . . . 28
5-1 Types of values programmers inspect while debugging . . . . . . . . . 48
5-2 Node.js course activity . . . . . . . . . . . . . . . . . . . . . . . . . . 56
7

List of Tables
4.1 fondue’s JavaScript function naming convention . . . . . . . . . . . . 29
5.1 Lab study pre-survey questionnaire . . . . . . . . . . . . . . . . . . . 39
5.2 Summary of lab study results . . . . . . . . . . . . . . . . . . . . . . 43
5.3 Actions performed by users during the Canvas Painter task . . . . . . 49
5.4 Actions performed by users during the du task . . . . . . . . . . . . . 50
5.5 Actions performed by users during the Laggy AJAX UI task . . . . . 51
5.6 Actions performed by users during the Chat task . . . . . . . . . . . 51
5.7 Actions performed by users during the Name Directory task . . . . . 52
5.8 Node.js course detailed activity summary . . . . . . . . . . . . . . . . 57
8

Chapter 1
Introduction
1.1 Motivation & Problem
The process of writing and debugging code involves asking a multitude of questions
about how the code works [14, 25]. Most of the work a computer does is invisible and
virtually instantaneous, so many of those questions are mundane, but frequent, such
as what values a certain variable has taken. Since code is often vast and complex,
many of the questions concern reachability, such as whether any network operations
happen downstream of a particular function call. A 2008 survey found that many of
the questions programmers ask were difficult to answer with the debugging tools of
the time, and there is reason to believe that we still have a long way to go [25].
Two of the most commonly used debugging tools are print statements and break-
points. Those interfaces are simple, general, and make it possible to answer many
day-to-day programming questions. However, they have many problems. Both re-
quire users to modify the program before the interesting part of the code runs in
order to use them. They also don’t scale well with the complexity of the code un-
der consideration. Viewing program state from a breakpoint is like examining a film
frame by frame, and crafting useful log statements can be like crafting a second user
interface to an application.
Thankfully, researchers have created tools that are better designed to address
the questions programmers ask of their code. Several will be described in the next
9

Figure 1-1: Screenshot of Theseus in action. The call counts next to the fetch() function
and ‘error’ callback function have been selected, populating the log with all their invocations.
chapter. Although they usually make it easier to answer questions that are otherwise
difficult to answer, they often complement breakpoints and log statements rather than
replace them. They add to the complexity of an IDE without simplifying it. The aim
of my research is to create a single interface that can answer the difficult questions
without being too cumbersome to answer the easy ones as well.
1.2 Theseus
Theseus is the implementation of those ideas that will be discussed in this thesis. It is
designed for debugging JavaScript, a dynamic language that is popular but not well
supported by debugging tools. JavaScript’s idioms encourage the use of callbacks for
everything from asynchronous event handlers to synchronous array iteration. Call-
backs cause control flow to branch often and become difficult to follow. Theseus is
an extension for the Brackets code editing environment1 and can be used to debug1http://brackets.io/
10

JavaScript running in the Node.js stand-alone virtual machine2 or the Chrome web
browser3.
Theseus consists of two interfaces for understanding program behavior. The first is
a layer on top of the code editor to show which paths of the code have been executed.
The other is a call tree for showing how those paths interact. See Figure 1-1 for what
Theseus looks like during a typical debugging session.
When the user examines the source code for an application that is currently run-
ning with the Theseus debugger, the code is redrawn to reflect the execution history of
the program so far. Code that has never been executed is given a darker background
so that it can be readily identified. A small widget is placed in the gutter of the text
editor adjacent to every function definition, showing the number of times that func-
tion has been called. When clicked, adds that function to the active query . When
functions in the query have been called, a log panel appears showing information
about all invocations of those functions, including the data they accepted as param-
eters and the data they returned. The log is structured like a call tree. Invocations
which are nested beneath other invocations of functions in the query will be nested
that way in the log. The caller/callee relationship is extended to include asynchronous
connections, such as functions that return callback functions and invocations of those
callback functions.
The information in the interface is based on a program trace that is collected
in real time, so the log is populated retroactively when the user modifies the query,
and updates as new information comes in. Formerly unexecuted code lights up im-
mediately upon being executed. Call counts update as they are invoked. Callbacks
for delayed network events appear under the corresponding requests as the responses
arrive.
Theseus also allows the inspection of multiple programs at once. This is most
useful when the programs are related, such as a client and server. Call counts are
shown in the source code for both, and when the active query contains functions from2http://nodejs.org/3https://www.google.com/chrome/
11

client and server, timestamps are used to order them chronologically in the same log.
Less naive strategies are described in Chapter 6, Conclusions & Future Work.
1.3 Benefits
Theseus allows programmers to watch their code execute. They can determine
whether a function has been called simply by pulling up its source code. Since the
information updates in real time, they can verify that the timing and frequency with
which functions are called matches what they expect. Furthermore, reachability col-
oring enables users skimming a source file to easily find the relevant portions of the
code, since they will be grayed out.
Theseus makes it simple to inspect the values of parameters and return values.
Formatting print statements and hitting a breakpoint at the right time are unneces-
sary because Theseus automatically displays all of the data flowing in and out of the
function when it is added to the query. The information comes from the program
trace, so the program does not need to be restarted, nor the function re-run, in order
to inspect any of those values.
Theseus unties callback knots into structured call trees. Theseus’ logs allow
programmers to inspect data upstream and downstream of any function call, even
up and down chains of events. When those chains of events interleave, such as in a
server that performs long-running operations to satisfy requests, the log’s entries are
grouped by request if the request handler is part of the query (for an example with
streams, see Figure 1-1).
In short, Theseus reduces the preparation and orchestration required to inspect
the run-time behavior of code. In our user studies, we found that users appreciated
the ability to get a summary of how the code has run with a glance at the editor, and
the ability to inspect the data flow through one or more functions just by clicking
them. My hope is that with a streamlined interface, programmers will inspect more
often, guess less, and understand code more quickly.
12

1.4 Specific Contributions
This thesis demonstrates the feasibility, benefits, and usability of real-time code cov-
erage information in the form of call counts and the coloring of dead code. I have
released Theseus, a Brackets editor extension for debugging JavaScript, under an
open source license.
Furthermore, lab and classroom studies were used to validate the interface ideas.
Lab study participants found the interface to be easy to use and worthy of recom-
mendation to friends, commenting that this is the way debuggers should work. The
study provided information on the types of information programmers seek to gather
with existing debuggers, which can be used in the future to inform the creation of
debuggers that choose values for inspection automatically, as does Theseus.
Lastly, I also present a method for augmenting a JavaScript call tree automati-
cally with edges for asynchronous (event registration/activation) links by detecting
common forms of event registration, and describe how it might be improved with
modification to the virtual machine. The current method can be implemented with
simple abstract syntax tree (AST) rewriting rules as the code is instrumented for trace
collection. An algorithm for walking the call tree (which is now a directed acyclic
graph) is also presented.
1.5 Organization of This Document
Chapter 2 discusses related work, from debugging tools to program trace collection
techniques. Chapter 3 presents the Theseus interface and design process. Chapter
4 describes the system’s implementation and relevant algorithms. Chapter 5 covers
our lab study and experiences deploying Theseus in a tutorial setting with college
students. Chapter 7 concludes the thesis and describes future work.
13

Chapter 2
Related Work
In 1997, Henry Lieberman lamented the 30-year stagnation of debugging tools, point-
ing out that many programmers still named “inserting print statements” as their
debugging technique of choice [18]. As we discovered in our lab study, print state-
ments still play a significant role, though programmers felt embarrassed to admit
it. However, debugging interfaces designed with human psychological limitations in
mind have become more common. Field work and lab studies such as [25, 14] have
identified the types of questions programmers ask while programming, measured how
much time they spend answering them, and called attention to the areas where pro-
grammers need the most help. Theseus may be used to answer at least 40% of the
types of questions programmers asked during Sillito’s studies that they found were
not supported by existing tools, including:
• How is control getting (from here to) here?
• Why is not control reaching this point in the code?
• Which execution path is being taken in this case?
• Under what circumstances is this method called or exception thrown?
• How does the system behavior vary over these types or cases?
• Where should this branch be inserted or how should this case be handled?
14

• What will be (or has been) the direct impact of this change?
In this section I will describe some of the relevant interfaces and techniques that
have been created to answer these and other questions programmers ask. I will also
describe how each project relates to the work of this thesis. The selection is broad,
including projects that serve as inspiration in addition to those that have similar
approaches, in order to accurately portray the context in which this research was
carried out.
2.1 Interrogative Debugging
Whyline is a debugging interface that helped Alice programmers fix bugs nearly 8
times faster than than programmers without it [10] and made Java programmers
more than twice as fast [11]. It is an example of an interrogative debugger that works
by collecting a program trace and generating a list of “why did” and “why didn’t”
questions the user might have about their program’s behavior. Questions can be
about various aspects of a program, such as the user interface (“Why is this text
blue?”) or an object’s fields (“Why didn’t the value of x change?”). Answers are
generated using program slicing and presented as chains of events in the code, such
as an event firing, a value being changed, and the wrong branch of a conditional
statement being taken.
The main difference between Whyline and Theseus is when they would be used.
Whyline helps locate the code that is relevant to a particular change, while Theseus
visualizes the behavior of the code at that location. For example, if Whyline led a
user to the if-statement that they need to change to add a feature, then Theseus
could visualize the code paths that would be affected by making a change there.
2.2 Answering Reachability Questions
Reacher focuses on reachability questions, those that require “reasoning about causal-
ity, ordering, type membership, repetition, and choice” [13, 14, 15]. LaToza and My-
15
ers identified those questions as among the most time-consuming for people to answer
because existing tools could only answer them indirectly. Users ask Reacher about
the relationship between several functions and Reacher presents a compact graph rep-
resentation of those functions’ connectivity, such as which functions call one another
directly or indirectly, whether one function calls another in a loop or within a condi-
tional, and the temporal ordering of two calls that happen in sequence. It relies on
static analysis instead of program traces, so it can answer questions such as “In what
cases might this function be called?” but not “In what cases has this function been
called?” for a given run of a program, as does Theseus.
Stacksplorer [7] and Blaze [12] focus on answering simple reachability questions
during program change tasks, specifically finding possible callers and callees of the
function currently being edited. The primary difference between these two projects
is how much of the stack they show at a time. Stacksplorer shows callers on the
left of the code editor and callees on the right. Blaze shows an entire code path
end-to-end so that users can quickly navigate callers and calles that are several levels
removed from the focused function. Both rely on static analysis for that data. Both
helped developers perform maintenance tasks faster and with higher success rates
than without them, though neither helped significantly more than the other.
2.3 Omniscient Debuggers
Step debuggers allow users to understand control flow by slowing the computer down
so that it takes things one step at a time. One common limitation of step debuggers is
that they usually only show the current program state and cannot step backwards. By
inspecting program traces instead of running processes, omniscient debuggers allow
users to move forward and backward in time. ZStep is an example of an omniscient
debugger [19]. With ZStep, a user can step forward and backward by line or expres-
sion, but also in other ways, such as to the point when any given expression was
evaluated, to the next time the GUI was updated, or to when a particular screen
element was drawn. Several other omniscient debuggers allow users to make similar
16

non-linear jumps. An omniscient debugger for Java called TOD allows users to jump
back to the time that a variable was changed by clicking a “why?” link next to its cur-
rent value in a variables panel [22]. JIVE is a debugger that highlights the portions of
a program’s timeline where a variable’s values fell within a particular range [3]. Users
can step through the code from any of those points. Finally, IntelliTrace is a tool that
allows users to index into a program trace by selecting the corresponding event, such
as a UI event or an exception [21]. Navigating a program trace by jumping between
key points allows users to rapidly jump to the point of the execution that corresponds
with a bug, or, when the time of interest is unknown, to skim the program’s history
more quickly than step-by-step. They have also been used to create more helpful
stack traces, such as JavaScript stack traces that cross event boundaries [24], and
even client-server boundaries [20].
Most of the edges used to navigate the trace in those projects don’t exist in the call
graph even though they do exist in the programmer’s mind. In pilot tests of Theseus,
I noticed that when I did not call out the asynchronous edges in a call graph as
special, users didn’t perceive them as special. A person looking at the idiomatic
JavaScript code for a callback function wants to be able to step into it, and Theseus
makes the connection. With a step debugger that doesn’t support that kind of leap,
the programmer needs to recognize the situation as one which the debugger doesn’t
support and change strategies.
2.4 Control Flow Visualization
Software visualization has a long history [9], from Lieberman’s representation of func-
tion calls as 3-dimensional objects [17] to LogoMedia, which allowed users to find bugs
by sonifying program execution [2]. One of the most influential for Theseus was the
essay “Learnable Programming”, in which Bret Victor outlines several of the features
he believes a learnable programming environment and language should have [26]. He
presents a way of visualizing control flow by displaying intermediate values in a panel
displayed alongside the code. Each line contains a semantically appropriate visual-
17
ization of a value being computed on that line, such as a notched, rotated circle to
represent an angle stored as a number. The list of past values extends to the right
and a scrubber along that axis changes the output to match the currently selected
moment in time. Gaps in the timeline can indicate lines that were skipped when an
alternate branch was taken. This technique works well for visualizing code behavior
within a single function, and Theseus’ log is an attempt to scale the idea to multiple
functions (albeit with relatively impoverished visualizations of the values themselves).
Theseus’ technique for displaying historical values in a log sacrifices code locality since
the information appears in a separate panel.
VELD has a similar intent to Victor’s interface, but uses a different approach [23].
VELD lets users choose their own level of abstraction by visualizing user-created
events. For example, to investigate lock contention, a user instruments their code to
generate events for when a lock is used and visualizes those events with VELD.
DejaVu is a similar project with a narrower domain, real-time video processing [8].
DejaVu associates the values of variables with the frame of video being processed so
that users can inspect the values by scrubbing to different points in the video. Widgets
displaying those values are placed on a canvas along with drawings, programmers’
notes, and intermediate versions of the images being processed. Each canvas the user
creates is a hand-made slice of the program’s state.
2.5 Collecting Program Traces
Recording complete program traces has historically been difficult, though feasible [22].
Timelapse (Brian Burg, currently in review1) promises self-contained, fully-replayable
traces of entire web pages within WebKit browsers [1]. The instrumentation library
for Theseus is limited in that it does not record changes to the structure of the web
page. Timelapse’s more complete program traces would allow Theseus to keep the
web page in sync with the debugging session, as when using ZStep.
Theseus uses a handful of routines specific to the Theseus interface for querying1Timelapse http://homes.cs.washington.edu/~burg/projects/timelapse/
18

the program trace, but several higher-level approaches to accessing trace data have
been researched. Caffeine [6] and JavaTA [4] are Prolog-based languages that can
search for call paths matching a set of predicates. PTQL is a variant of SQL designed
for querying traces as if they were stored in a relational database [5]. There is also a
Self-like syntax for executing queries over objects in the heap [16]. Building on the
ideas of those projects would make it easier to port Theseus to other languages and
environments, and allow users to write their own queries over the call graph.
19
Chapter 3
User Interface
The primary interface in Theseus is the code itself, which Theseus augments with
real-time information about its execution: call counts and reachability coloring. The
secondary interface is a panel that appears at the bottom of the window for displaying
call trees when a query is active. Figure 3-1 shows a typical session in which the user
determines which calls to fetch() resulted in a call to the error callback by adding
both to the active query. The following sections will discuss each of the features of
this interface in detail, followed by an example usage scenario.
3.1 Call Counts & Reachability Coloring
As soon as Theseus detects that the code being viewed in the editor is also being exe-
cuted somewhere on the local machine (in Chrome, Node.js, or both simultaneously),
Theseus adds call counts to the left of every function definition and begins coloring
all the code according to whether it has been called.
The call counts appear in the gutter next to the first line of every function defi-
nition, where the line number and breakpoint indicator would normally reside. The
rounded rectangle containing the number, called a pill, is gray when the count is
zero, but turns blue when the number is greater than zero. The pills turn dark blue
when the mouse moves over them so that the user knows they can be clicked (which
opens the log—see the next section). The counts update in approximately real time,
20

Figure 3-1: Screenshot of Theseus in action. The call counts next to the fetch() function
and ‘error’ callback function have been added to the active query, populating the log with all
their invocations.
Figure 3-2: Screenshot of call counts and reachability coloring. The fetch() function and
the ‘data’ and ‘error’ callback functions have been invoked once each, but the ‘end’ callback
handler has not.
21

updating at approximately 10 Hz.
When the call count for a function is zero, the background color of its source code
is changed to a dark gray. Since inline function definitions are common in JavaScript,
the coloring only extends from the first character to the last character of the function
definition. The ‘end’ callback in Figure 3-2 demonstrates this. The coloring changes
back to normal as soon as the call count is incremented.
In early prototypes, I sought to create an interface for answering the most challeng-
ing reachability questions first. Unfortunately, while it was possible to answer many
questions with those interfaces, it was very difficult to teach others how. I scaled
back the scope until I reached an interface that presented no difficulty to uninitiated
users: call counts and reachability coloring. The interface lost any notion of the order
functions were called in relative to one another unless the user happened to be look-
ing at the call counts just as they changed, but gained learnability. It could still be
used for answering simple reachability questions, since call counts in a callback chain
would all be equal if everything worked, and decrease near the end of the chain when
there was a breakdown. Call counts also turned out to be convenient click targets for
activating Theseus’ log.
3.2 Structured, Retroactive Logging
When a call count pill is clicked, that function is added to the active query. The query
matches any invocations in the call graph of any of those functions. The matched
invocations are displayed in a log panel that appears automatically whenever the
query is non-empty. Invocations that have already occurred are added to the log
immediately, as if they had been in the query from the start, and new invocations are
added as they occur.
The log is laid out like a call tree, an outline of the program’s execution featuring
only the functions in the query. An invocation will be displayed as a direct descendant
of another invocation if it was called directly, or if there is a call chain connecting
them with no other invocations in the query results between them.
22

The entry in the log for every invocation includes all of the values passed into and
out of the function on that invocation. That includes arguments that were passed in,
arguments that were added beyond the list of declared arguments, the return value
if an explicit return statement was reached, and the exception that was thrown if
one was thrown. To minimize the amount of noise in the log, information that can
be assumed, such as the default return value of undefined of functions that have no
return statements, is not displayed.
Arrays and objects are summarized with strings like [Array:2] and [Object],
but the keys and values they contain can be inspected in place by clicking their name
or the disclosure triangle that appears just to its left. Vertical space is made so that
they can all be shown at once. Nested arrays and objects behave the same way. The
depth that they can be explored is capped by technical limitations as described in
Chapter 4, System Design.
Each log entry also has a button labeled ‘Backtrace’ that will temporarily replace
the log with a list of all the invocations that were on the stack at the time the function
was called. Their entries also display input and output values.
In earlier prototypes, the query was ordered. If the user clicked the pill for function
A, then clicked the pill for function B, then only call chains that passed through
function A then function B would be matched. The call counts reflected the number
of log items that would be added if you clicked them (i.e. the number of times the
function was called downstream of the current query). This caused more trouble
than it was worth. Every time a function was added to the query, it put the interface
into a new mode. If the user clicked a pill and then became interested in a different
function, they had to remove the old function from the query in order to see all the
information about the new function. However, relaxing the ordering constraint clears
up most of those issues though it can result in additional clutter in the log, and when
the number of call paths that go through a pair of functions is required, the user must
count them instead of relying on the call counts in the pills.
23

Figure 3-3: How the structured log is constructed. Left: a flat, chronological log, as you
would get by adding print statements. Right: a structured log shows the call tree. In this
example, download() calls getJSON (not in the log), passing a callback handler for when the
download finishes. The responses come back out of order and would require the programmer to
deduce which response goes with which request, but the structured log treats the asynchronous
operation as a synchronous call for visualization.
3.2.1 Asynchronous Links
In the log, asynchronous calls are treated like direct calls. For example, if one function
kicks off an asynchronous operation, such as registering a callback, then each invo-
cation of that callback will be treated as if it were a descendant of the function that
created it. When an invocation is nested beneath another due to this kind of asyn-
chronous relationship, the child is tagged with the word ‘async’ like the ‘getJSON’
handler in Figure 3-3.
Having a call tree structure doesn’t change the ordering of synchronous calls, but
it can change the order of asynchronous calls relative to one another. This makes the
Theseus interface presented here inappropriate for debugging race conditions, but
ways to solve this problem are discussed in Chapter 6, Conclusions & Future Work.
The invocations are, however, sorted chronologically relative to their siblings.
A choice must be made about where to put an invocation that is both a syn-
chronous and asynchronous descendant of other invocations in the log. This could
happen if the function that kicks off an asynchronous operation and the function that
calls it are both in the active query. Currently, Theseus shows that invocation in a
single location, though the alternative of showing the log entries in both locations
24

with pointers to each other may also be a good choice.
3.3 Usage Scenario
As a demonstration of how Theseus can be used to rapidly understand asynchronous
code, in this section, we show an example code authoring session. Max’s task is to
add JavaScript to a web page so that when a search button is clicked, the page will
download search results via AJAX and display them on the page.
Max begins by connecting an event handler to a search button. Once he has
entered the code to the best of his ability, he wants to verify that he made no mistakes.
To do so, Max reloads the page, clicks the search button, and returns to the IDE.
The coloring and call counts indicate that the code that registered the event handler,
and the event handler itself, were both executed.
Next, Max needs to request the search results. He arrives at the code below by
customizing a snippet he finds on the web. Max refreshes the page and clicks the
search button again. From the coloring of the source code, he sees right away that
the success event handler was never called.
To figure out why, Max adds an empty error handler and saves the file. When he
clicks the button again, he sees that the error handler was indeed called. He couldn’t
remember what arguments would be passed to the handler, but it doesn’t matter. He
25

clicks the pill next to the error handler, which adds the invocation of the error
handler to the timeline so he can inspect the arguments.
Max skims the arguments and sees that the string Not Found was passed as the
third argument. This calls his attention to a typo in the URL (serch instead of
search). He fixes it, refreshes the page, and verifies that the problem is fixed with a
glance at the source code when all the call count pills turn blue except for the error
handler.
To display the search results, Max needs to know what data is passed to the
AJAX callback. He clicks the pill next to the callback function. He inspects
the arguments to discover that the first argument contains the array of results. He
gives a name to that argument in the source code and writes the code to display it
on the page.
3.3.1 Discussion
Theseus provides several forms of feedback that would have been difficult or tedious for
Max to gather without it. He can see whether lines of code had executed using color,
instead of sprinkling the file with breakpoints, log statements, or calls to alert().
He can correlate page events, such as AJAX responses, with events in his code. He
can inspect the values of variables without explicitly instrumenting them ahead of
time.
26

Chapter 4
System Design
Theseus consists of an extension for the Brackets editor, two modules that the exten-
sion uses to communicate with Chrome and Node.js, the JavaScript instrumentation
library that is embedded in an HTTP proxy server and Node.js module loader, and
the trace-collecting code that gets injected into the programs being debugged. The
system is small, about 3,000 lines of code, half of which are devoted to the interface.
It’s also modular. The JavaScript instrumentation library fondue is packaged sepa-
rately and has a stand-alone API. The composition of the system is summarized in
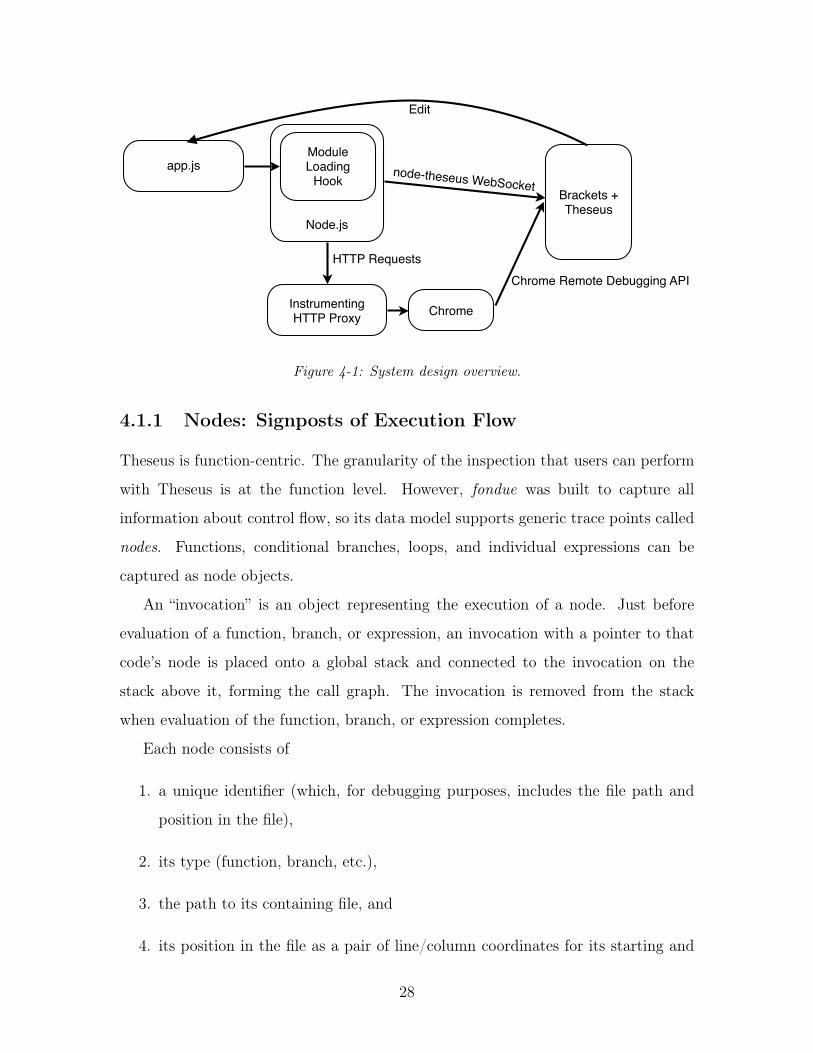
Figure 4-1.
4.1 Trace Collection with fondue
fondue is the instrumentation library that was built to support Theseus’ interface1.
It has two components. The first is the code that modifies JavaScript source code to
add hooks for capturing function calls, the values of expressions, etc. The second
is the code that fondue prepends to the modified JavaScript that uses the hooks to
collect trace data. That latter defines a global object named tracer with functions
for collecting the trace (traceReturnValue(), traceFunCall(), etc) and accessing
the trace data (trackLogs(), backtrace(), etc).1Named ‘fondue’ because it’s more pleasant to think of instrumentation as covering code in a
delicious melted cheese than clogging it up with code that makes it run more slowly.
27
ChromeInstrumentingHTTP Proxy
app.js
Node.js
Module Loading
HookBrackets + Theseus
HTTP Requests
node-theseus WebSocket
Chrome Remote Debugging API
Edit
Figure 4-1: System design overview.
4.1.1 Nodes: Signposts of Execution Flow
Theseus is function-centric. The granularity of the inspection that users can perform
with Theseus is at the function level. However, fondue was built to capture all
information about control flow, so its data model supports generic trace points called
nodes. Functions, conditional branches, loops, and individual expressions can be
captured as node objects.
An “invocation” is an object representing the execution of a node. Just before
evaluation of a function, branch, or expression, an invocation with a pointer to that
code’s node is placed onto a global stack and connected to the invocation on the
stack above it, forming the call graph. The invocation is removed from the stack
when evaluation of the function, branch, or expression completes.
Each node consists of
1. a unique identifier (which, for debugging purposes, includes the file path and
position in the file),
2. its type (function, branch, etc.),
3. the path to its containing file, and
4. its position in the file as a pair of line/column coordinates for its starting and
28
Example JavaScript Generated Function Name
function foo() { } foo
(function foo() { }) foo
var foo = function () { } foo
{ foo: function () { } } foo
var bar = { foo: function () { } } bar.foo
Bar.prototype = { foo: function () { } } Bar.foo
Bar.prototype.foo = function () { } Bar.foo
obj.on('event', function () { }) (‘event’ handler)
setTimeout(function () { }, 100) (timer handler (100ms))
setTimeout(function () { }, expr) (timer handler)
bar(function () { }) (‘bar’ callback)
baz.bar(..., function () { }, ...) (‘bar’ callback)
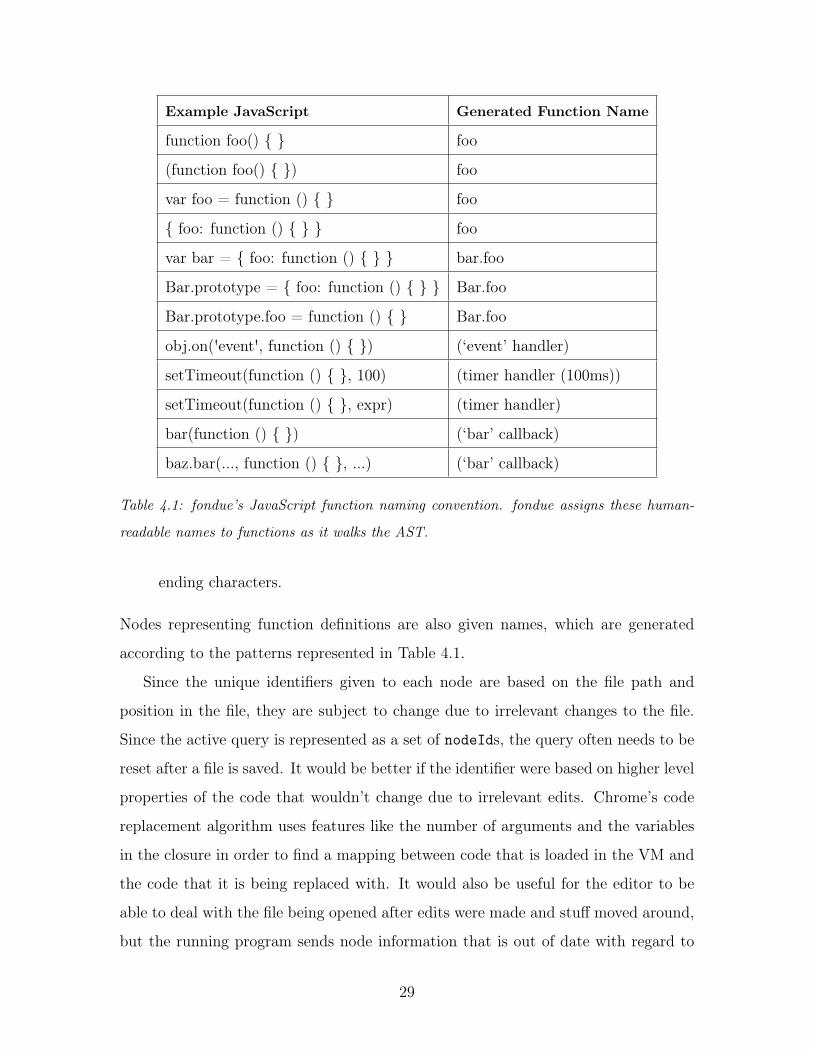
Table 4.1: fondue’s JavaScript function naming convention. fondue assigns these human-
readable names to functions as it walks the AST.
ending characters.
Nodes representing function definitions are also given names, which are generated
according to the patterns represented in Table 4.1.
Since the unique identifiers given to each node are based on the file path and
position in the file, they are subject to change due to irrelevant changes to the file.
Since the active query is represented as a set of nodeIds, the query often needs to be
reset after a file is saved. It would be better if the identifier were based on higher level
properties of the code that wouldn’t change due to irrelevant edits. Chrome’s code
replacement algorithm uses features like the number of arguments and the variables
in the closure in order to find a mapping between code that is loaded in the VM and
the code that it is being replaced with. It would also be useful for the editor to be
able to deal with the file being opened after edits were made and stuff moved around,
but the running program sends node information that is out of date with regard to
29

where things are in the text.
4.1.2 Source Code Transformations
To collect information about how a block of code executes, fondue wraps it with code
that traces how control flow arrived, passed through, and exited the block. The details
are different depending on the type of node. The following two sections show how it
works for function definitions, function calls, as they are the most intricate. Instru-
menting branches works like instrumenting function definitions, and instrumenting
expressions works like instrumenting function calls, so the details for those have been
omitted. The third section shows how function creation is used to add asynchronous
edges to the call graph.
Function Definitions
To capture the run-time call graph, fondue adds calls to a tracer object upon function
entry and exit. To demonstrate, here is a simple JavaScript function definition:
func t i on foo (a , b) {
var c = a + b ;
re turn c ;
}
fondue’s transformation will add a call to tracer.traceEnter() to the beginning
of the function’s body, passing along a unique identifier for the function, an object
containing the values of all the named arguments, a copy of the entire arguments
array, and a reference to the function’s call context (this). The original function body
will be wrapped in a try block to capture any exceptions. If an exception is thrown,
tracer.traceExceptionThrown() is called with a reference to all local variables
(including function arguments) and the exception, then the exception will be re-
thrown. If the function exits without a return statement, tracer.traceExit() will
be called with a reference to all local variables. Any return statements in the function
body are rewritten to pass the returned value to tracer.traceReturnValue() first.
30

This is what the code looks like after being processed:
func t i on foo (a , b) {
t r a c e r . t raceEnter ({
"nodeId " : "/Users /tom/ s r c / fondue/x . j s −1−0−4−1",
vars : { a : a , b : b } ,
arguments : Array . prototype . s l i c e . apply ( arguments ) ,
t h i s : t h i s
} ) ;
t ry {
var c = a + b ;
re turn t r a c e r . traceReturnValue ( c ) ;
} catch ( e ) {
t r a c e r . traceExceptionThrown ({
"nodeId " : "/Users /tom/ s r c / fondue/x . j s −1−0−4−1",
vars : { "a" : a , "b" : b , c : c }
} , e ) ;
throw e ;
} f i n a l l y { ;
t r a c e r . t r a c eEx i t ({
"nodeId " : "/Users /tom/ s r c / fondue/x . j s −1−0−4−1",
vars : { a : a , b : b , c : c }
} ) ;
}
}
The nodeId is only passed to tracer.traceExceptionThrown() and tracer.traceExit()
for sanity checking. It could otherwise be derived by checking the top invocation on
the stack.
31

Function Calls
Theseus also remembers the call site from which a function was called. For example,
in this function, bar() is called two times and baz.bar called once:
f unc t i on foo (a , b) {
bar ( a ) ;
bar (b ) ;
baz . bar ( a + b ) ;
}
fondue would know which invocation of bar was generated from which call site
due to the transformation it performs on each function call. Instead of calling
the function directly, the code will be rewritten to pass the function pointer to
tracer.traceFunCall() along with a nodeId representing the call site. When the
function has a context assigned (baz.bar above is executed in the baz context), that
object is passed as well. The function body above would change to look like this:
t r a c e r . t raceFunCal l ({
func : bar ,
nodeId : "/Users /tom/ s r c / fondue/x . j s−2−1−2−7"
}) ( a ) ;
t r a c e r . t raceFunCal l ({
func : bar ,
nodeId : "/Users /tom/ s r c / fondue/x . j s−3−1−3−7"
}) ( b ) ;
t r a c e r . t raceFunCal l ({
t h i s : baz ,
property : "bar " ,
nodeId : "/Users /tom/ s r c / fondue/x . j s−4−1−4−15"
}) ( a + b ) ;
tracer.traceFunCall would push an invocation for the call site’s node onto
the stack, then call the function, setting its context explicitly if a value for this is
32

provided.
Function Creation
Event callbacks are usually registered in JavaScript by providing a reference to a
callback function. Often the callback functions are defined inline, as in this example
that displays an alert after 1 second. The callback function is passed as the first
argument to setTimeout:
f unc t i on foo ( ) {
setTimeout ( func t i on ( ) {
a l e r t ( ' done ! ' ) ;
} , 1000 ) ;
}
fondue will connect invocations of the callback function to the invocation of foo in
which the callback function was created. That information is captured by wrapping
all function expressions in calls to tracer.traceFunCreate like this:
t r a c e r . traceFunCreate ( func t i on ( ) {
// t h i s f unc t i on body would a l s o be instrumented
a l e r t ( ' done ! ' ) ;
})
At run-time, tracer.traceFunCreate copies a reference to the invocation that is
currently on top of the stack (the caller) and returns a shim containing a reference to
the parent function and the callback function in its closure. When the shim is called,
it saves a reference to the original parent invocation in tracer, then calls the original
callback function. tracer.traceEnter will see the asynchronous caller and add an
edge to it in the call graph in addition to the invocation that is on top of the stack.
4.1.3 Capturing Variable Values
fondue’s call graph must store any values that the user might want to inspect later,
such as function arguments and return values. Since JavaScript objects are mutable,
33

if fondue stored only a reference, then the log entries generated after a mutation
would reflect the new state of the object instead of the state at the time of the
original invocation. To cope with that problem, fondue generates a shallow copy of
all objects that it stores in the call graph. Creating copies is an expensive operation
so the copies are only one level deep. If the user requests to inspect a nested object
reference in Theseus, they are shown an error message. We are investigating ways to
bypass this restriction.
4.1.4 Accessing the Trace
tracer offers a handful of public methods for accessing the trace data:
• trackNodes(), newNodes(handle)
• trackHits(), hitCountDeltas(handle)
• trackLogs(query), logDelta(handle)
• backtrace(invocationId, range)
These methods accept and return plain JavaScript objects (objects containing
only primitive data types that can be natively serialized) so that the arguments and
return values can be easily transmitted as JSON (JavaScript Object Notation, the
most convenient serialization format for JavaScript objects).
Since Theseus updates most information in real-time, the API is designed around
a cursor design pattern: the track* functions return handles which can be used
to periodically request updated information. As soon as a handle is created, tracer
searches the execution history for all the information that satisfies the query that has
been generated so far. From then on, information is added to the result set as the
program runs. That results in overhead during execution proportional to the number
of active handles, but allows every request for updated information to be satisfied by
sending the data that has been saved so far and clearing the data associated with
that handle. By default, Theseus polls these API functions 10 times per second to
update the user interface.
34

trackNodes() & newNodes(handle) are used for retrieving information about all
the nodes (functions, call sites, etc.) that exist in the instrumented program. Theseus
uses this information to color dead code and place call counts. trackHits() &
hitCountDeltas(handle) are used for retrieving the number of times that functions
have been called. The data is returned as an object whose keys are nodeIds and the
values are the number of times that the node has been reached since the last call to
hitCountDeltas().
trackLogs(query) is the first function that accepts options, namely the list of
nodeIds for which to retrieve log entries. Every time the user changes the active
query by clicking the call count next to a function definition, Theseus releases the
old log handle (if there was one) and calls trackLogs() with the new set of nodeIds.
logDelta() returns enough information to construct the log described in the previous
chapter: a unique identifier for the invocation, the identifier for the parent invocation
(if there was one and it is also in the query) the unique identifier of the node, the
time at which the invocation occurred, and for functions, the arguments, return value,
thrown exception, and context, if they are present. The log entries are always sent in
chronological order.
backtrace returns an array of the nodes in a backtrace for the given invocation
identifier. Backtraces cannot change over time, so this function does not return a
handle.
4.2 Debugging with Theseus
4.2.1 Node.js
Users launch their scripts with the node-theseus command-line tool instead of with
node directly. The node-theseus wrapper adds a hook to the Node.js module loading
system to process all included JavaScript files with the fondue library as they are
loaded.
35

node-theseus also listens for WebSocket2 connections, which the editor exten-
sion periodically attempts to establish. When a connection is established, the editor
sends requests consisting of the name of one of the tracer functions (trackNodes,
trackHits, etc) and an array of the arguments to pass to that function. node-theseus
invokes the function with those arguments and sends the result back. Data is serial-
ized over the connection as JSON.
4.2.2 Chrome
The Theseus extension for Brackets comes bundled with an HTTP proxy server that
rewrites the JavaScript contained on any page with fondue. It has two modes of
operation. In one mode, the server serves a directory of static files from the user’s
computer. In the other mode, Theseus redirects all requests to another HTTP server
running at a fixed address and port. Client and server can be debugged with the same
Theseus instance by running the server with node-theseus and using the HTTP
request forwarding mode to view the instrumented web page in Chrome.
The Brackets editor has a feature called Live Development, which uses Chrome’s
Remote Debugging API3 to connect to an open tab so that changes to CSS that
users make in the editor are reflected immediately in the browser, among other live
coding features. The Remote Debugging API also supports features for opening a
debugging connection to the page’s JavaScript virtual machine. Theseus uses the
ability to evaluate JavaScript expressions and retrieves the result to communicate
with the global tracer object inserted onto the page by the proxy server.
2http://dev.w3.org/html5/websockets/3https://developers.google.com/chrome-developer-tools/docs/debugger-protocol
36

Chapter 5
Evaluation
Theseus was developed as a series of prototypes over the course of a year, beginning at
Adobe during the summer of 2012, and then at MIT for the following academic year.
Theseus was designed iteratively using feedback from pilot tests and its design varied
wildly during the first few months. In the spring of 2013, Theseus finally reached a
level of maturity such that it became worthwhile to perform a more in-depth studies.
This chapter describes a lab study and a classroom study that we performed on
the latest version of the software that has been presented in this thesis.
5.1 Lab Study
We conducted a lab study in order to answer several questions about how JavaScript
programmers would use and perceive the utility of Theseus, and to determine whether
Theseus could serve as an adequate replacement. Specifically, the study was designed
to shed light on the five questions listed below. The first three questions concern the
ways in which we think Theseus would make programmers more efficient:
RQ1. How would programmers find correspondences between code and program be-
havior with Theseus?
RQ2. How would programmers use Theseus to find where chains of callbacks break
down?
37

RQ3. Would programmers use Theseus’ structured log sort through tangled control
flow problems?
The answer to the fourth question would shed light on what information Theseus
should show by default in the log:
RQ4. How frequently do users inspect local variables, closure variables, and global
variables?
5.1.1 Methods
We recruited 7 participants to a 90-minute lab study in which they completed pro-
gramming tasks for $30 in compensation. The participants were all male undergradu-
ate and graduate students of MIT. We screened the participants for JavaScript ability
using a questionnaire whose results are shown in Table 5.1. During the study, the
subjects were given 5 programming tasks: two 20-minute tasks and three 5-minute
tasks. To facilitate within-subjects comparison, each participant was assigned to the
Theseus or control condition for each task independently (but always with 2 tasks in
one condition and 3 in the other). Subjects completed all of their control tasks first
(using Chrome Developer Tools), then all of the Theseus tasks (during which most
Chrome Developer Tools were disallowed1).
Participants completed the tasks on a provided MacBook Pro laptop with an
external mouse in addition to the built-in trackpad. The screen was recorded, but
not audio. Participants were asked to think aloud during the 20-minute programming
tasks, but told to work as quickly as possible without worrying about communicating
their thoughts during the 5-minute tasks.
The five tasks were as follows:
T1: Canvas Painter (20 minutes). Subjects were given the static HTML source
code for a browser-based drawing site2 with approximately 2,000 lines of JavaScript1Users were allowed to use the DOM inspector and network request inspector, but not the break-
point debugger or console, the tools Theseus is meant to replace.2http://caimansys.com/painter/ Accessed 2013-05-19.
38

Subject Age Gender Programming
Ability
JavaScript
Ability
Freq. of
JavaScript Use
S1 24 M q q tq q q q q q t Daily
S2 23 M q q tq q q q q tq Daily
S3 20 M q q tq q q q tq q Few days/wk.
S4 29 M q q q q t q q q tq Few days/wk.
S5 24 M q q q q t q q q tq Few days/mo.
S6 21 M q q q q t q q tq q Few days/mo.
S7 39 M q q q q t q q tq q Not recently
Table 5.1: Lab study pre-survey questionnaire. Programming Ability and JavaScript Ability
are on a 5-point scale, with 1 labeled “Novice” and 5 labeled “Expert”.
spread across 8 files. The line drawing tool required users to click and hold the
mouse to draw lines. Participants were asked to change the program so that
users could draw lines by clicking once at the start point and again at the end
point of the line. As a painting application, Canvas Painter’s event handling
code was complex and the drawing logic spread across multiple files, making
this task an appropriate test for RQ1.
T2: du (20 minutes). Subjects were given the skeleton for a Node.js command-line
tool for calculating the total size of all files in a directory. The straight-forward
implementation (calling du recursively for sub-directories) results in a thick
web of callbacks that are very difficult to understand using breakpoints or log
statements, making this task an appropriate test for RQ3.
T3: Laggy AJAX UI (5 minutes). Subjects were given an HTML file containing
25 lines of JavaScript that downloaded JSON from the server and displayed it
in a popup. Subjects were asked to determine why it took so long for the popup
to appear after clicking a button. The problem was a hard-coded delay in the
server before it would deliver a response. We anticipated that being able to
watch the code coloring change as the code executed with Theseus might allow
39

users to quickly narrow down the asynchronous step that took the most time,
addressing RQ2.
T4: Real-Time Chat (5 minutes). Subjects were given the code for the server
(33 lines of Node.js) and client (31 lines of JavaScript on a web page) of a
real-time chat site. The page was opened in two tabs and subjects were asked
why messages from one tab did not appear in the other. The problem was that
the name of the message used to transmit chat messages was different on the
sending end from the receiving end, testing RQ2.
T5: Faulty Auto-Complete (5 minutes). Subjects were given the code for both
the server (80 lines of Node.js) and client (63-line HTML file that was mostly
JavaScript) of page that showed auto-completed search results from an address
book. Subjects were asked why the results never displayed. The problem was
a logic error on the client while processing the results. Most of the client code,
where the error resided, was written inside one long function so that participants
would be unable to inspect the offending variables with Theseus (which only
allows inspecting parameters and return values). The breakdown of the event
chain from the button click, to querying the server, to processing the results, to
displaying the results, again tested RQ2.
The source code provided to the participants for tasks T2–T5 can be found in
Appendix A.
We asked participants to use the Chrome Developer Tools in the control con-
dition regardless of their usual programming environment. To determine whether
this affected their usual debugging strategies, we asked “What would you have done
differently to solve those problems if you were on your own computer?” after they
completed the control condition tasks.
Logging Interface Actions
To answer RQ4, and to have a succinct summary of how each subject completed each
task, the observer manually recorded all of the debugging-related user interface actions
40
that the participants performed in both the control and experimental conditions.
Some of the commands were common to both environments (editing the source code,
adding a call to console.log(), etc.), but some were specific to Chrome Developer
Tools and Theseus. Care was taken to choose actions that could be reliably counted
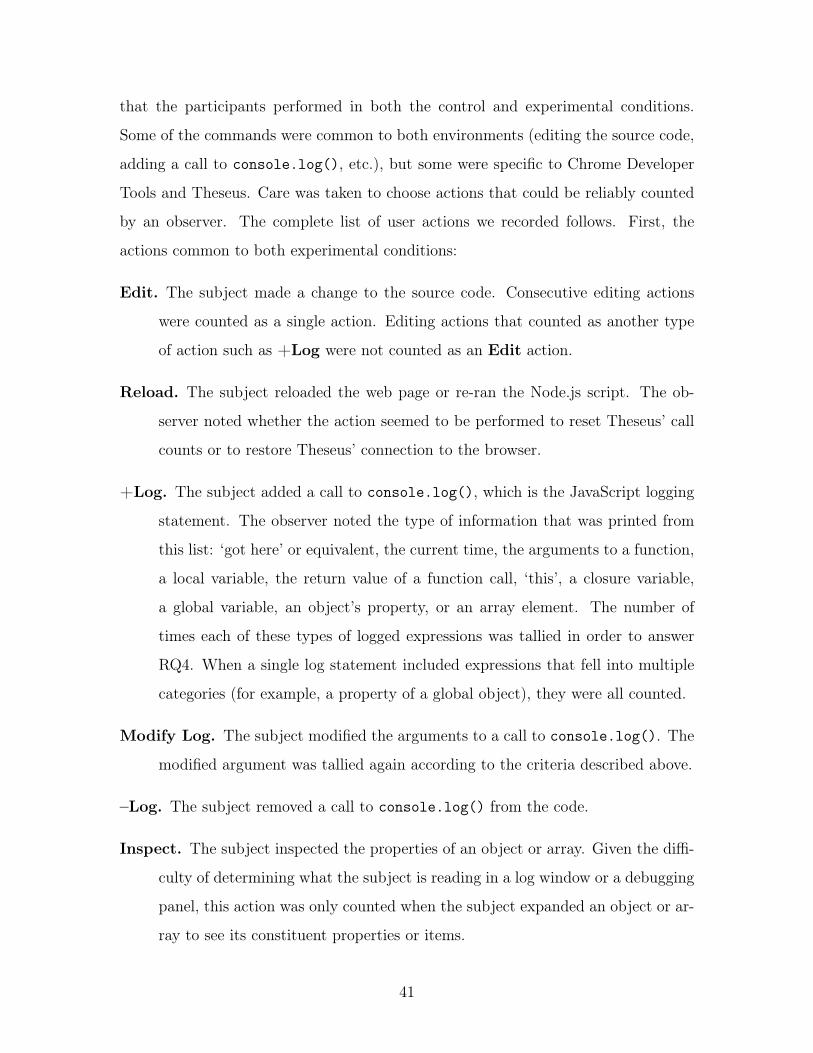
by an observer. The complete list of user actions we recorded follows. First, the
actions common to both experimental conditions:
Edit. The subject made a change to the source code. Consecutive editing actions
were counted as a single action. Editing actions that counted as another type
of action such as +Log were not counted as an Edit action.
Reload. The subject reloaded the web page or re-ran the Node.js script. The ob-
server noted whether the action seemed to be performed to reset Theseus’ call
counts or to restore Theseus’ connection to the browser.
+Log. The subject added a call to console.log(), which is the JavaScript logging
statement. The observer noted the type of information that was printed from
this list: ‘got here’ or equivalent, the current time, the arguments to a function,
a local variable, the return value of a function call, ‘this’, a closure variable,
a global variable, an object’s property, or an array element. The number of
times each of these types of logged expressions was tallied in order to answer
RQ4. When a single log statement included expressions that fell into multiple
categories (for example, a property of a global object), they were all counted.
Modify Log. The subject modified the arguments to a call to console.log(). The
modified argument was tallied again according to the criteria described above.
–Log. The subject removed a call to console.log() from the code.
Inspect. The subject inspected the properties of an object or array. Given the diffi-
culty of determining what the subject is reading in a log window or a debugging
panel, this action was only counted when the subject expanded an object or ar-
ray to see its constituent properties or items.
41

Some of the actions could only be performed in the control condition with the Chrome
Developer Tools:
+Breakpoint. The subject added a breakpoint.
–Breakpoint. The subject removed a breakpoint.
Step. The subject used a step command in the debugger, such as “Step” or “Con-
tinue”.
Finally, some actions could only be performed with Theseus:
+Pill. The subject added a function to the active Theseus query.
–Pill. The subject removed a function from the active Theseus query.
Backtrace. The subject viewed the backtrace of an entry in the log.
Watch counts. The subject watched the call counts and reachability coloring up-
date as they interacted with the web page or Node.js script.
Post-Study Survey
At the conclusion of the study, we verbally asked five questions regarding their opinion
of Theseus. The first two were open-ended:
1. What were the biggest differences between how you debugged with Theseus
than you normally debug, if any?
2. What did you find Theseus most useful for? Least useful for?
The following three questions asked for opinions on a 5-point scale, though partici-
pants given the opportunity to clarify their responses with further discussion:
1. Did you find Theseus easy-to-use? (1: Very difficult, 3: Neutral, 5: Very Easy)
2. How likely would you be to use Theseus outside of this study? (1: Not at all
likely, 3: Neutral, 5: Very Likely)
3. How likely would you be to recommend Theseus to a friend? (1: Very Unlikely,
3: Neutral, 5: Very Likely)
42
Subject T1 T2 T3 T4 T5 Ease
of Use
Would
Use
Would
Recommend
S2 q q Y Y Y q q q tq tq q q q tq q q qS7 q q Y q Y q q tq q q q tq q q q q q tS5 q q Y Y Y q q q tq q q tq q q q q q tS1 q q Y Y q q q q tq q q q tq q q q tqS6 q q Y q q q q q q t q q q q t q q q tqS3 Y ? Y q Y q q q tq q q q q t q q q q tS4 Y Y Y Y Y q q q tq q q q q t q q q q t
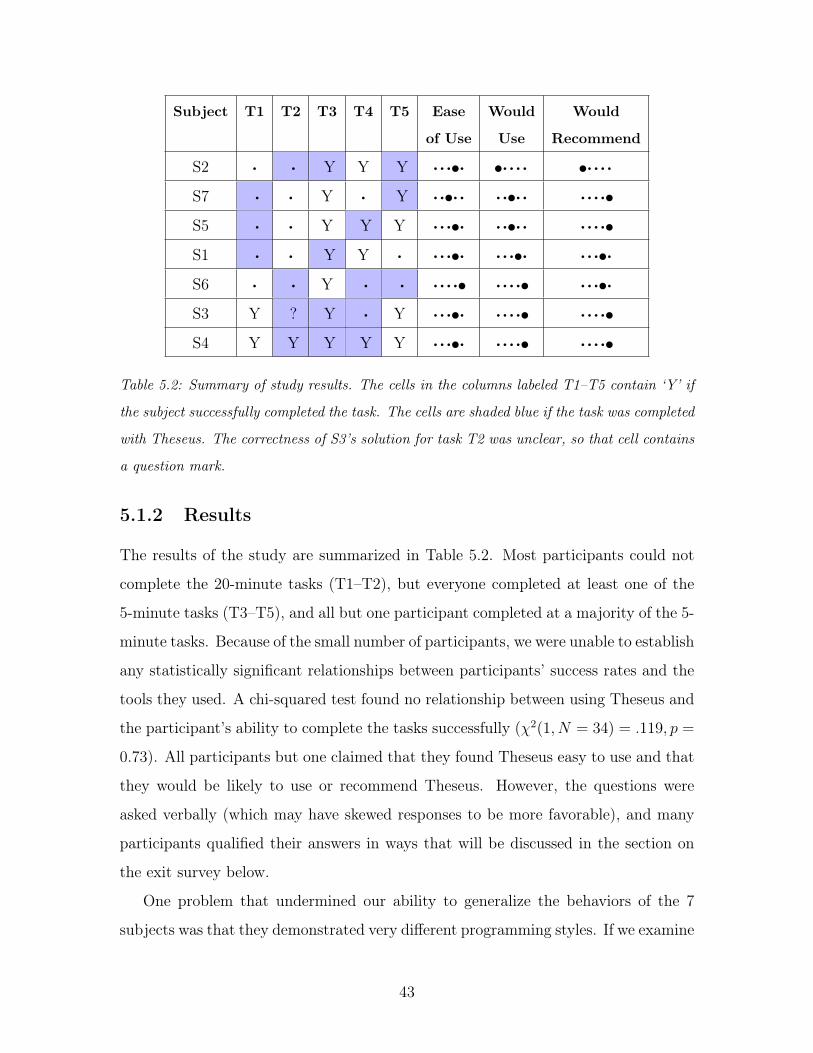
Table 5.2: Summary of study results. The cells in the columns labeled T1–T5 contain ‘Y’ if
the subject successfully completed the task. The cells are shaded blue if the task was completed
with Theseus. The correctness of S3’s solution for task T2 was unclear, so that cell contains
a question mark.
5.1.2 Results
The results of the study are summarized in Table 5.2. Most participants could not
complete the 20-minute tasks (T1–T2), but everyone completed at least one of the
5-minute tasks (T3–T5), and all but one participant completed at a majority of the 5-
minute tasks. Because of the small number of participants, we were unable to establish
any statistically significant relationships between participants’ success rates and the
tools they used. A chi-squared test found no relationship between using Theseus and
the participant’s ability to complete the tasks successfully (χ2(1, N = 34) = .119, p =
0.73). All participants but one claimed that they found Theseus easy to use and that
they would be likely to use or recommend Theseus. However, the questions were
asked verbally (which may have skewed responses to be more favorable), and many
participants qualified their answers in ways that will be discussed in the section on
the exit survey below.
One problem that undermined our ability to generalize the behaviors of the 7
subjects was that they demonstrated very different programming styles. If we examine
43

Table 5.4 for the actions we observed users taking as they tackled T1, we see that the
four participants in the control condition exhibited four different debugging styles.
S2 used no debugging tools except for one log statement at the very end; S3 used
breakpoints as reachability tests for functions; S4 used breakpoints to step through
and inspect variables; and S6 only inspected values with log statements. In the
following sections, we will use observations of individual programmers to discuss each
research question in turn.
RQ1: How might programmers find correspondences between code and
program behavior with Theseus?
Participants frequently sought code correspondences using Theseus by keeping the
call counts and code coloring on the screen as they interacted with the program they
were working on. They were pleased with how much information they could absorb
this way, an experience S1 described like this: “[Theseus] feels really interactive. [As
opposed to breakpoints], it’s more of a ‘watch and see what happens’ thing, which I
like.”
We recorded instances of the Watch Counts action in Tables 5.4—5.7. We did
not observe any instances during T2 or T5, likely because T2 involved writing a non-
interactive command-line tool and the problem in T5 resided in the logic of a single
function, making it effectively invisible to Theseus. However, during T1, S1 and S3
used the Watch Counts strategy 6 and 3 times respectively at various times during
the 20-minutes. 4 of the 6 participants used Watch Counts strategy during T3 and
T4. The only participants who did not use Watch Counts strategy on T3 and T4
were S2 and S4. This may have been because they spent their first 20 minutes with
Theseus working on T2, the non-interactive command-line tool.
There was some disagreement about whether the call counts were useful for finding
correspondences when the user had no idea where to begin. S5 said, “how the call
counts changed live when I interacted with the application ... was especially useful
for Canvas Painter because it was a lot of source code and I didn’t really know where
to start.” Their prediction of whether they would use Theseus outside the study (on
44

a 5-point scale) depended on the size of the project: 4/5 if the code base is large, but
only 1/5 if the code base is small. S1 had the opposite opinion, stating, “I felt like
it was the least useful when I wasn’t sure where the problem was. So in the canvas
thing, I didn’t know where the issue was, and there’s not much of a global scope with
Theseus. ... When I didn’t know where to start, there was no way to find a global
call stack and identify candidate starting points. ... [In short, Theseus is] more useful
on a narrow scope, less useful on a global scope.”
Participants were interested in the time at which the call counts changed if they
were interacting with their application, but also the total number. A changing call
count could alert the programmer to surprising or revealing information, such as when
S3 watched the call counts during the T1 task. At one point, S3 thought aloud, “I get
2 mouse up actions [every time I click]. Huh.” Then while watching the call counts
and clicking a second time, they exclaimed, “Aha!” as the nature of the problem
became more clear. S5 noted that they had become fixated on a handful of functions
while trying to narrow down the location of some strange behavior because “it seems
weird to me that I get 2 mouse ups every time I click, while I only get 1 mouse down.
... I’d expect the call counts to be the same for both of them, but they’re not.” S4
and S6 also used the fact that a function was called 17 times as verification that it
was being called once for each file in the directory during T2, since they had checked
that there were 17 files.
The call counts also turned out to be useful for verifying that a code change had
had the desired effect. In S4’s case, the fact that their change caused a function to be
called a different number of times was encouraging. The call count seemed a reliable
enough proxy for checking that the new behavior was correct that they performed no
further tests.
RQ2: How might programmers use Theseus to find where chains of call-
backs break down?
The problem of finding where chains of callbacks breakdown is an important subset
of the problem of finding code correspondences. In JavaScript, functions typically
45

cannot block, forcing the programmer to split computations into multiple functions
with no guarantee that control will flow successfully from one function to the other.
We noted several points during the study when participants using Theseus were
able to quickly (in some cases, immediately) locate the location of a broken call chain
based on the code coloring and call counts. In one instance, S4 opened a source file
and was immediately drawn to a network event handler that had never been called,
becoming suspicious because it looked like a handler which should have fired several
times had the page been working correctly. This was in contrast to S3’s experience
using a breakpoint debugger, in which they set breakpoints and reloaded the page 3
times before they finally guessed correctly about how much of the code had actually
executed.
RQ3: Would programmers use Theseus’ structured log sort through tan-
gled control flow problems?
S4 named this as Theseus’ most useful feature, saying that Theseus is most useful for
“if you have recursion problems,” referring to task T2 in which his solution involved
recursive asynchronous operations. S3 dubbed the pills “automatic silent breakpoints”
whose results he could “scroll through like a tree.” S1 compared the log to typical
console.log, saying, “[Theseus] is a lot more focused ... with console.logs it’s
global. ... [With Theseus] you can pick the scope you wanna look at on the fly.” S4
summarized his opinion of the log like this:
“It gives you what you would do if you were really careful and did con-
sole.log every function. Yeah, so I didn’t have to console.log. This saves
at least one or two iterations if the first thing you log is really the thing
you need. If you need to go through and look more, then this can save a
lot more iterations. ... This should be in Chrome. ... This should be in
every JavaScript debugger. This is very useful.”
S4 would often click the pills for several functions at once, saying, “all the time,
the thing that I wanted to do first is select all the functions and then see the whole
46

tree.” Showing the asynchronous call tree for all the functions of interest in the file
helped him to locate the points of interest. He cited the lack of a ‘Select All Pills in
File’ command as the reason he rated Theseus’ ease of use as 4/5 instead of 5/5. S6
felt similarly similarly, at one point saying aloud, “These are the four functions that
are interacting,” and without pausing, enabling the pills for those four functions to
see how they related.
RQ4: How frequently do users inspect local variables, closure variables,
and global variables?
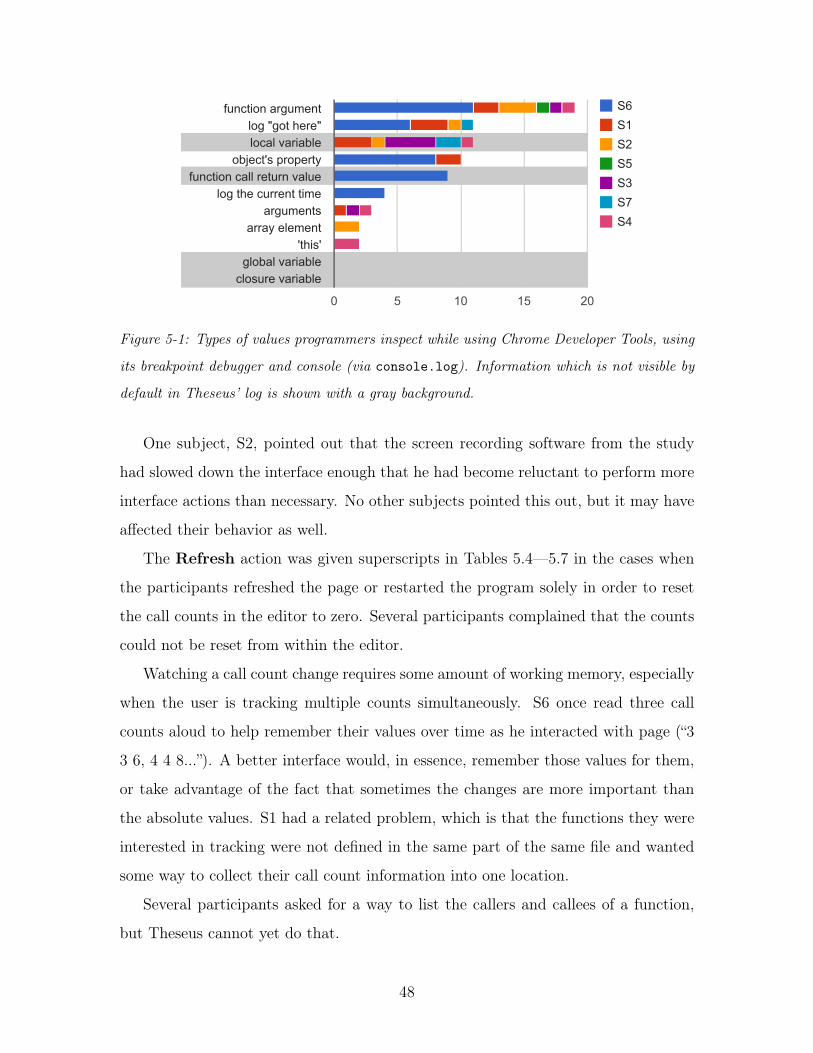
Figure 5-1 summarizes the data we collected about the types of inspections that users
performed without Theseus. There were only seven participants, and the numbers
are conditioned on the tasks that the users performed, so we cannot claim that this
distribution will hold universally. No participants were observed inspecting the values
of global variables or the values of variables that were defined outside of the current
scope (closure variables), but it certainly does happen. It’s worth noting that 8 of
the logged function call return values were invocations of toString() which were not
necessary because console.log would have displayed the value anyway. Even so,
most types of values that participants were interested in inspecting would have been
available in Theseus’ default log view.
Nearly all of the instances in the study where someone added log statements in
the Theseus condition (4 total) were in order to inspect one of the types of values that
are not automatically visible in Theseus. Extending the log to inspect intermediate
values such as local variables and the values of expressions is discussed in Chapter 6,
Conclusions & Future Work.
Usability Issues
As any good study of research software does, this study uncovered a laundry list of
small bugs and usability snafus. Most of them are too mundane to mention here,
but the following are significant enough to be guiding our continued research into
debugging interfaces.
47
S6
S1
S2
S5
S3
S7
S4
0 5 10 15 20
function argumentlog "got here"local variable
object's propertyfunction call return value
log the current timearguments
array element'this'
global variableclosure variable
Figure 5-1: Types of values programmers inspect while using Chrome Developer Tools, using
its breakpoint debugger and console (via console.log). Information which is not visible by
default in Theseus’ log is shown with a gray background.
One subject, S2, pointed out that the screen recording software from the study
had slowed down the interface enough that he had become reluctant to perform more
interface actions than necessary. No other subjects pointed this out, but it may have
affected their behavior as well.
The Refresh action was given superscripts in Tables 5.4—5.7 in the cases when
the participants refreshed the page or restarted the program solely in order to reset
the call counts in the editor to zero. Several participants complained that the counts
could not be reset from within the editor.
Watching a call count change requires some amount of working memory, especially
when the user is tracking multiple counts simultaneously. S6 once read three call
counts aloud to help remember their values over time as he interacted with page (“3
3 6, 4 4 8...”). A better interface would, in essence, remember those values for them,
or take advantage of the fact that sometimes the changes are more important than
the absolute values. S1 had a related problem, which is that the functions they were
interested in tracking were not defined in the same part of the same file and wanted
some way to collect their call count information into one location.
Several participants asked for a way to list the callers and callees of a function,
but Theseus cannot yet do that.
48

Task T1: Canvas Painter
Without Theseus With Theseus
S2 S3 S4 S6 S1 S5 S7
edit
refresh
edit
refresh
edit
refresh
edit
refresh
edit
refresh
edit
refresh
+log
refresh
out of time
+breakpoint
miss breakpoint
+breakpoint
miss breakpoint
hit breakpoint
+breakpoint
edit
refresh
hit breakpoint
edit
refresh
hit breakpoint
refresh
hit breakpoint
–breakpoint
success
+breakpoint
hit breakpoint
step
step
step
step
step
step
step
step
hit breakpoint
step
–breakpoint
+breakpoint
hit breakpoint
step
step
step
step
step
step
step
step
inspect
inspect
–breakpoint
edit
refresh
edit
refresh
edit
refresh
edit
refresh
edit
refresh
success
+log
refresh
mod. log
refresh
mod. log
+log
+log
refresh
+log
+log
+log
–log
–log
refresh
mod. log
refresh
+log
refresh
out of time
refresh
refresh1
watch counts
refresh1
refresh2
watch counts
+pill
+pill
refresh1
watch counts
refresh1
watch counts
refresh
refresh2
+pill
+pill
–pill
+pill
+pill
+pill
backtrace
+pill
+pill
+pill
–pill
backtrace
+pill
refresh1
watch counts
+pill
+pill
watch counts
refresh1
refresh1
edit
refresh
edit
refresh1
edit
refresh
edit
refresh
out of time
+pill
backtrace
refresh2
watch counts
refresh1
+pill
backtrace
jump to function
backtrace
backtrace
watch counts
edit
refresh
watch counts
+pill
backtrace
out of time
edit
out of time
Table 5.3: Actions performed by users during the Canvas Painter 20-minute task. refresh1
indicates a refresh that was performed primarily to reset the call counts back to zero. refresh2
indicates a refresh that occurred because a bug in Theseus caused the Chrome tab to crash.
49

Task T2: du
Without Theseus With Theseus
S1 S5 S7 S2 S4 S6
edit
+log
refresh
edit
+log
refresh
edit
refresh
refresh
+log
+log
refresh
edit
refresh
edit
refresh
edit
refresh
edit
refresh
edit
refresh
out of time
edit
refresh
edit
refresh
edit
refresh
edit
refresh
refresh
+breakpoint
step
step
step
edit
refresh
edit
out of time
+log
refresh
–log
refresh
edit
refresh
edit
+log
refresh
edit
+log
refresh
edit
out of time
edit
refresh
edit
refresh
edit
refresh
+pill
inspect
edit
refresh
+pill
edit
refresh
+pill
+pill
edit
refresh
+pill
inspect
+pill
inspect
edit
refresh
+pill
+pill
–pill
inspect
edit
refresh
refresh
edit
refresh
edit
refresh
+pill
–pill
+pill
inspect
+log
–pill
refresh
+log
refresh
+pill
out of time
edit
+log
edit
refresh
+pill
edit
refresh
edit
refresh
+pill
edit
+pill
edit
refresh
+pill
+pill
+pill
refresh
+pill
–pill
+pill
edit
+pill
+pill
+pill
refresh
edit
refresh
edit
refresh
+pill
+pill
edit
refresh
+pill
success
edit
refresh
edit
refresh
+pill
+pill
–pill
+pill
–pill
+pill
–pill
+pill
–pill
inspect
+log
refresh
edit
refresh
+log
refresh
+pill
edit
refresh
out of time
Table 5.4: Actions performed by users during the du 20-minute task. refresh1 indicates a
refresh that was performed primarily to reset the call counts back to zero. refresh2 indicates
a refresh that occurred because a bug in Theseus caused the Chrome tab to crash.
50

Task T3: Laggy AJAX UI
Without Theseus With Theseus
S5 S6 S7 S1 S2 S3 S4
success +log
+log
+log
+log
refresh
success
edit
refresh
edit
network timeline
success
watch counts
+pill
+pill
+pill
–pill
+pill
success
success watch counts
edit
+pill
backtrace
edit
+pill
success
+pill
+pill
+pill
+pill
+pill
jump to function
success
Table 5.5: Actions performed by users during the Laggy AJAX UI 5-minute task.
Task T4: Chat
Without Theseus With Theseus
S1 S2 S7 S3 S4 S5 S6
network timeline
+log
refresh
+log
refresh
+log
refresh
+log
refresh
+log
refresh
refresh
edit
refresh
success
+log
refresh
success
out of time watch counts
edit
refresh
out of time
+pill
inspect
inspect
edit
refresh
success
success watch counts
watch counts
+pill
+pill
+pill
+pill
backtrace
out of time
Table 5.6: Actions performed by users during the Chat 5-minute task. refresh1 indicates a
refresh that was performed primarily to reset the call counts back to zero. refresh2 indicates
a refresh that occurred because a bug in Theseus caused the Chrome tab to crash.
51

Task T5: Name Directory
Without Theseus With Theseus
S1 S3 S4 S5 S2 S6 S7
network timeline
+log
+log
refresh
network timeline
edit
+log
refresh
+log
refresh
inspect
inspect
edit
out of time
+log
refresh
inspect
+log
inspect
edit
refresh
+log
edit
refresh
inspect
success
+log
refresh
edit
refresh
success
success edit
refresh
success
+pill
refresh1
+pill
refresh1
+pill
+pill
refresh1
+pill
refresh
refresh
+pill
refresh1
+pill
–pill
+pill
out of time
refresh1
success
Table 5.7: Actions performed by users during the Name Directory 5-minute task. refresh1
indicates a refresh that was performed primarily to reset the call counts back to zero.
52

5.2 Node.js Mini-Course
In order to observe programmers using Theseus in a more natural setting, I held a
roughly 2-hour tutorial on Node.js for students of 6.813/6.831, User Interface Design
and Implementation. Many of their final projects required a server component, so
the tutorial was advertised as an opportunity to learn a server language that worked
well for real-time web interfaces.
I prepared a 17-step introductory tutorial to Node.js. The first step described how
to install Node.js, Google Chrome, the Brackets code editor, the Theseus extension for
Brackets, and the node-theseus command-line tool for debugging Node.js programs
with Theseus. Two of the remaining 16 steps described how to use Theseus (one for
debugging Node.js servers and one for debugging JavaScript on a web page). The 14
remaining steps covered the following topics:
• Install Node.js and using the Node.js package manager
• Create a web server with the Express library, extending it with middleware
• Use socket.io for real-time client/server messaging
• Fetch JSON from the server using AJAX
• Store data in redis and PostgreSQL
• Password-protect a page using the Passport package
The tutorial began with a brief verbal introduction. A text file containing instruc-
tions for downloading the tutorial files and a link to an exit survey were projected
on the screen with space for tips to accrue throughout the tutorial as the teaching
assistants noticed recurring problems. Students could work at their own pace and
leave at any time, whether they completed the materials or not. Using Theseus was
encouraged as part of the introduction and by being featured prominently in the
course materials, but was entirely optional.
The version of Theseus that was distributed to the students contained code that
recorded basic editor actions, enough to get a sense of how they progressed through
53

the tutorial, and how much they interacted with Theseus. Specifically, it reported
when the user opened a file in Brackets so that it could detect when the tutorial files
were opened, when Theseus connected to a Node.js or Chrome process for debugging,
and when the user clicked call count pills to add or remove them from the query.
5.2.1 Observations
Approximately 30 students attended the tutorial and about 20 successfully installed
all of the recommended software and ran the tutorial using Theseus. A summary of
the students’ interaction with Theseus is presented in Figure 5-2. Instead of following
the progress of a few students closely, the facilitators assisted whichever students
needed help, allowing us to paint a broad strokes picture of how Theseus worked in
a classroom with many students.
Holding the tutorial taught three main lessons about Theseus. The first is that
Theseus handles exceptions poorly. The extent to which Theseus calls attention to the
presence of exceptional cases occurring in a program is showing exceptions in the log.
That made them difficult to discover for many students. This is not a fundamental
limitation of Theseus, just an engineering oversight.
The second lesson is that Theseus does not help students learn how asynchronous
programming works. Experienced programmers understand how Theseus’ asynchronous
log works with very little instruction. They also quickly develop strategies to use the
interface to solve problems with their code, as we saw in the lab study. However, stu-
dents in the Node.js course who had little experience with JavaScript were not able
to use Theseus to gain that knowledge. The experience helping students understand
what went wrong with their tool highlighted the difference between tools like Whyline
that attempt to explain to the user what’s going on, tools that visualize what’s going
on, and tools like Theseus that are only useful for inspection. Tools in that final class
are only helpful for people who have a good understanding of the system before they
begin. They don’t help programmers who don’t yet have the model.
Thirdly, we learned that Theseus falls below the acceptable performance threshold
of some students. According to the Brackets usage logs, 2 students disabled Theseus,
54
at least one of whom reported doing so because restarting their application with
Theseus took too long. Others may have simply stopped using Brackets or uninstalled
the Theseus extension, neither of which would show up in the logs.
Since the instructors spent most of their time with the students who needed help,
our information about the students who had no problems comes mostly from the
automatically reported usage information and the end-of-course survey. The usage
reporter indicates that pills were clicked a total of 35 times by 8 different users (min.
1, max. 7 pills per user), not counting step 5, which told users to click pills. The
majority of the interactions took place during steps 8–10, when students were asked
to piece together the client and server sides of a real-time chat site. The survey only
received 6 responses, but in response to the question “What did you find Theseus
most useful for? Least useful for?” students seemed to think that Theseus was useful
(or theoretically useful):
• I didn’t use it for that long, but I’ve ran into problems in Javascript with
multiple event handlers firing more than once, or forgetting to unbind some
event handlers. Theseus would be incredibly useful in that case.
• it was helpful for debugging! least useful....idk
• Most useful to see whether some code was getting executed. Sometimes it was
difficult to actually understand the request/response object.
Our post-survey also asked, “How did you use Theseus to understand the code, if
at all?” and the answers describe the types of activities we observed during the lab
study:
1. To see which events got fired.
2. I looked at the count and log to see how the server and client were interacting.
3. I used it to see why something wasn’t working - id go and check the call numbers
next to the functions and those helped me find minor bugs
4. it helped me see when something was or was not getting executed
55

Total number of people who opened the file for each step of the tutorial:
5/21/13 progress.html#
file:///Users/tom/Desktop/2013-04-18-node-course-data-analysis/progress.html# 1/1
Generate download preview
1 2 3 4 5 6 7 8 9 10 11 12 13 14 15 1602468
101214161820
Total Theseus debugging connections opened on each tutorial step by all users
(refreshing the page and launching Node.js servers):
5/21/13 progress.html#
file:///Users/tom/Desktop/2013-04-18-node-course-data-analysis/progress.html# 1/1
Generate download preview
1 2 3 4 5 6 7 8 9 10 11 12 13 14 15 160
20
40
60
80
100
120
Total pill clicks on each tutorial step by all users:
5/21/13 progress.html#
file:///Users/tom/Desktop/2013-04-18-node-course-data-analysis/progress.html# 1/1
Generate download preview
1 2 3 4 5 6 7 8 9 10 11 12 13 14 15 160
5
10
15
20
25
30
35
Figure 5-2: Node.js course activity. They were instructed to open each tutorial step in a
way that caused a debugger connection to open, which is why the count is near 20 on steps
1–4, which come before they were introduced to Theseus. On step 5 the tutorial explicitly
asked them to click pills to introduce Theseus. Step 8: connect with socket.io. Step 9: Send
messages with socket.io. Step 10: send chat messages.
56
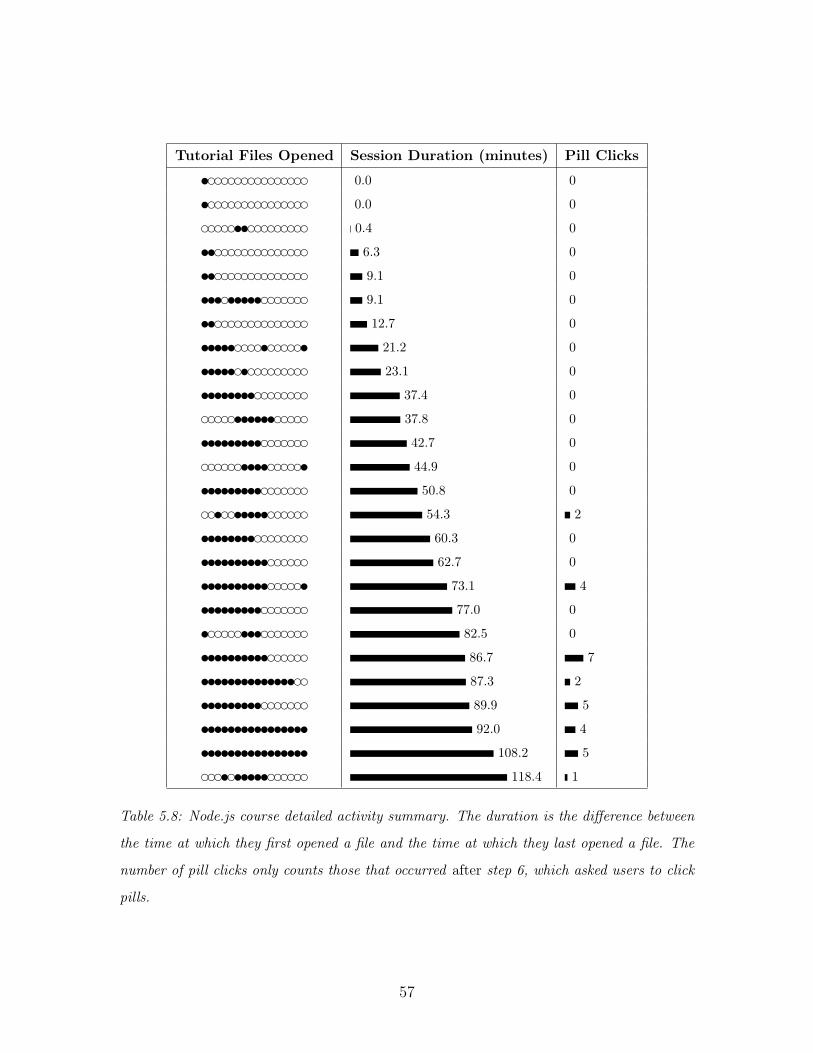
Tutorial Files Opened Session Duration (minutes) Pill Clickstddddddddddddddd 0.0 0tddddddddddddddd 0.0 0dddddttddddddddd 0.4 0ttdddddddddddddd 6.3 0ttdddddddddddddd 9.1 0tttdtttttddddddd 9.1 0ttdddddddddddddd 12.7 0tttttddddtdddddt 21.2 0tttttdtddddddddd 23.1 0ttttttttdddddddd 37.4 0dddddttttttddddd 37.8 0tttttttttddddddd 42.7 0ddddddttttdddddt 44.9 0tttttttttddddddd 50.8 0ddtddtttttdddddd 54.3 2ttttttttdddddddd 60.3 0ttttttttttdddddd 62.7 0ttttttttttdddddt 73.1 4tttttttttddddddd 77.0 0tdddddtttddddddd 82.5 0ttttttttttdddddd 86.7 7ttttttttttttttdd 87.3 2tttttttttddddddd 89.9 5tttttttttttttttt 92.0 4tttttttttttttttt 108.2 5dddtdtttttdddddd 118.4 1
Table 5.8: Node.js course detailed activity summary. The duration is the difference between
the time at which they first opened a file and the time at which they last opened a file. The
number of pill clicks only counts those that occurred after step 6, which asked users to click
pills.
57

5. just verified that stuff was called
When asked “What were the biggest differences between how you debugged with
Theseus than you normally debug, if any?” respondents almost universally declared
Theseus to have saved them from writing lots of print statements:
1. I didn’t have to place console.log statements in every event handler to figure
out what got called.
2. Normally I would have written a lot of console.log statements to debug. But
theseus allowed me debug without doing that.
3. it was a lot faster, since I typically type console.log statements to find out why
and where things arent working - especially when there isnt an error thrown by
the console
4. Didn’t have to add print statements everywhere
5. none
58
Chapter 6
Conclusions & Future Work
This thesis presented interfaces for displaying information about the run-time be-
havior of asynchronous code in the form of call counts, reachability coloring, and
asynchronous call trees. Programmers in the presented studies liked Theseus and was
able to use it with little training, solving programming tasks as well with Theseus
as they did with established breakpoint debugging and logging tools. However, there
are several research directions I plan to take which could make programmers even
happier and more productive with their tools.
Theseus’ scope is a single screen of code. Call counts and reachability coloring
assume that the relevant code all appears on the screen at once. As some study
participants noted, that is often insufficient. I believe that Theseus’ visualizations
may be useful if their scope were expanded to an entire file, or an entire project.
Domain-specific knowledge of JavaScript such as whether code is executing as a result
of a timer or a network request might be used to make navigating project-scale code
coverage information feasible.
Theseus visualizes basic information about the past execution of their code inside
the editor. As soon as the code changes, that information is invalidated because the
program is now different. If we collected program traces that were complete enough
to allow modified code to be executed inside a snapshot of past program states,
programmers could be shown how their changes would have affected the execution
of their program. Such a system could predict exceptions, or show how changes
59

to conditionals affect what branches would have been taken, giving programmers
immediate feedback that could prevent errors by visualizing potential program states.
The same visualizations might be used for comparing the traces from multiple runs
of the same code.
Theseus’ log is simply an extension of call trees, with edges for asynchronous
links, but such a visualization can only be used to answer some of the reachability
questions programmers ask [14, 13]. Many of the remaining questions cannot be an-
swered with Theseus because they are questions about classes of functions, such as
all networking-related code. Showing all networking-related functions in Theseus’ log
would be overwhelming, so new approaches would be needed for a Theseus-like inter-
face to work in those situations. Also, some reachability questions are unanswerable
in Theseus because they concern potential situations, such as finding all possible ways
that following a particular branch is possible. The Reacher tool, which uses static
analysis, can answer many of those questions [15], but uses a completely different
visualization from Theseus, and does not take advantage of run-time information to
provide context. An extension of both interfaces seems desirable.
Theseus supports programmers in a variety of tasks simply by showing information
in the right places, and providing an interface that makes investigating easy questions
easy and investigating difficult questions possible. In the long term, I hope that this
similar interfaces will eventually make understanding code possible for everyone.
60

Bibliography
[1] Brian Burg. Timelapse: Interactive Record/Replay for the Web. http://homes.
cs.washington.edu/~burg/projects/timelapse/research.html.
[2] Christopher J. DiGiano, Ronald M. Baecker, and Russell N. Owen. Logomedia: a
sound-enhanced programming environment for monitoring program behavior. In
Proceedings of the INTERACT ’93 and CHI ’93 Conference on Human Factors
in Computing Systems, CHI ’93, pages 301–302, New York, NY, USA, 1993.
ACM.
[3] Paul V. Gestwicki and Bharat Jayaraman. JIVE: Java Interactive Visualization
Environment. In Companion to the 19th annual ACM SIGPLAN conference on
Object-oriented programming systems, languages, and applications, pages 226–
227, Vancouver, BC, CANADA, 2004.
[4] Hani Z. Girgis and Bharat Jayaraman. JavaTA: A Logic-based Debugger for
Java. In 16th Workshop on Logic-based Methods in Programming Environments,
2006.
[5] Simon Goldsmith, Robert O’Callahan, and Alex Aiken. Relational Queries Over
Program Traces. In Proceedings of the 20th annual ACM SIGPLAN confer-
ence on Object-oriented programming, systems, languages, and applications, vol-
ume 40, pages 385–402, October 2005.
[6] Y.-G. Gueheneuc, R Douence, and N Jussien. No Java without caffeine: A tool
for dynamic analysis of Java programs. In Automated Software Engineering,
61

2002. Proceedings. ASE 2002. 17th IEEE International Conference on, pages
117–126, 2002.
[7] Thorsten Karrer, Jan-Peter Krämer, Jonathan Diehl, Björn Hartmann, and Jan
Borchers. Stacksplorer: Call Graph Navigation Helps Increasing Code Mainte-
nance Efficiency. In Proceedings of the ACM UIST 2011 Symposium on User
Interface Software and Technology, 2011.
[8] Jun Kato, Sean Mcdirmid, and Xiang Cao. DejaVu: Integrated Support for
Developing Interactive Camera-Based Programs. In Proceedings of the 25th an-
nual ACM symposium on User interface software and technology, pages 189–196,
2012.
[9] MSI-Dr Andreas Kerren. Software visualization. Journal of visual languages and
computing, 4(3):211–266, 1993.
[10] Andrew J Ko and Brad A Myers. Designing the Whyline: A Debugging Interface
for Asking Questions about Program Behavior. In Proceedings of the SIGCHI
Conference on Human Factors in Computing Systems, volume 6, pages 151–158,
2004.
[11] Andrew J. Ko and Brad A. Myers. Debugging Reinvented: Asking and Answer-
ing Why and Why Not Questions about Program Behavior. Human-Computer
Interaction Institute, pages 301–310, 2008.
[12] Jan-Peter Krämer, Joachim Kurz, Thorsten Karrer, and Jan Borchers. Blaze:
Supporting Two-phased Call Graph Navigation in Source Code. In CHI ’12
Extended Abstracts on Human Factors in Computing Systems, pages 2195–2200,
2012.
[13] Thomas D. LaToza. Answering Reachability Questions. PhD thesis, Carnegie
Mellon University, 2012.
62

[14] Thomas D. LaToza and Brad A. Myers. Developers Ask Reachability Questions.
In 2010 ACM IEEE 32nd International Conference on Software Engineering,
volume 1, page 185, New York, New York, USA, 2010. ACM Press.
[15] Thomas D. LaToza and Brad A. Myers. Visualizing Call Graphs. In 2011 IEEE
Symposium on Visual Languages and Human-Centric Computing (VL/HCC),
pages 117–124. Ieee, September 2011.
[16] Raimondas Lencevicius, Urs Hölzle, and Ambuj K. Singh. Query-Based Debug-
ging of Object-Oriented Programs. In Proceedings of the 12th ACM SIGPLAN
conference on Object-oriented programming, systems, languages, and applica-
tions, pages 304–317, 1997.
[17] Henry Lieberman. A three-dimensional representation for program execution. In
Visual Languages, 1989., IEEE Workshop on, pages 111–116. IEEE, 1989.
[18] Henry Lieberman. The Debugging Scandal and What to Do About It. Commu-
nications of the ACM, 40(4):26–29, 1997.
[19] Henry Lieberman and Christopher Fry. Bridging the Gulf Between Code and
Behavior in Programming. In Proceedings of the SIGCHI Conference on Human
Factors in Computing Systems, CHI ’95, pages 480–486, New York, NY, USA,
1995. ACM Press/Addison-Wesley Publishing Co.
[20] Michael S. Meier, Kevan L. Miller, and Donald P. Pazel. Experiences with
Building Distributed Debuggers. In Proceedings of the SIGMETRICS symposium
on Parallel and distributed tools, pages 70–79, 1996.
[21] Microsoft. Debug Your App by Recording Code Execution with IntelliTrace.
http://msdn.microsoft.com/en-us/library/vstudio/dd264915.aspx.
[22] Guillaume Pothier, Éric Tanter, and José Piquer. Scalable Omniscient Debug-
ging. In Proceedings of the 22nd annual ACM SIGPLAN conference on Object-
oriented programming systems and applications, volume 42, page 535, October
2007.
63

[23] Steven P. Reiss. Visualizing Program Execution Using User Abstractions. In
Proceedings of the 2006 ACM symposium on Software visualization, volume 1,
pages 125–134, 2006.
[24] Eric Schrock. Debugging AJAX in Production. ACM Queue, 2009.
[25] Jonathan Sillito, Gail C. Murphy, and Kris De Volder. Asking and Answering
Questions during a Programming Change Task. IEEE Transactions on Software
Engineering, 34(4):434–451, July 2008.
[26] Bret Victor. Learnable Programming. http://worrydream.com/#!
/LearnableProgramming, 2012.
64
Appendix A
Source Code From the Lab Study
Participants were provided the following code for each of the lab study tasks.
A.1 Task T2: du
var f s = r equ i r e ( ' f s ' ) ;
f unc t i on du( path , c a l l b a ck ) {
ca l l ba ck ( 0 ) ;
}
du ( ' . / t e s t−dir ' , f unc t i on ( s i z e ) {
conso l e . l og ( ' t o t a l s i z e ' , s i z e ) ;
} ) ;
A.2 Task T3: Laggy AJAX UI
A.2.1 index.html
Some lines were wrapped to fit on the page.
<s ty l e >
65

body {
background : #eee ;
}
#popup {
d i sp l ay : none ;
p o s i t i o n : abso lu t e ;
background : white ;
border−rad iu s : 4px ;
padding : 8px ;
. name , . d e s c r i p t i o n {
d i sp l ay : b lock ;
}
. name {
font−weight : bold ;
}
}
</s ty l e >
<h1>Home</h1>
<ul>
<l i ><a hr e f="#" c l a s s="more−i n f o " data−id="1">Shovel</a>
<l i ><a hr e f="#" c l a s s="more−i n f o " data−id="2">Basket</a>
</ul>
<div id="popup">
<span c l a s s="name"></span>
<span c l a s s="d e s c r i p t i o n"></span>
<span c l a s s=" l i n k"></span>
66

</div>
<s c r i p t s r c="http :// ajax . goog l e ap i s . com/ ajax / l i b s /
jquery /1 . 7 . 2 / jquery . min . j s "></s c r i p t >
<s c r i p t s r c="main . j s "></s c r i p t >
A.2.2 main.js (included from index.html)
f unc t i on f e t ch I t emIn fo ( itemId , c a l l b a ck ) {
$ . getJSON("/ items /" + itemId , func t i on ( data ) {
ca l l ba ck ( data ) ;
} ) ;
}
func t i on popupItemInfo (x , y , i n f o ) {
$("#popup " ) . c s s ({
d i sp l ay : " i n l i n e−block " ,
l e f t : x ,
top : y
} ) ;
$("#popup . name " ) . t ex t ( i n f o . name ) ;
$("#popup . d e s c r i p t i o n " ) . t ex t ( i n f o . d e s c r i p t i o n ) ;
setTimeout ( func t i on ( ) {
$("#popup " ) . h ide ( ) ;
} , 4000 ) ;
}
$ ( document . body ) . on (" c l i c k " , " . more−i n f o " , f unc t i on ( e ) {
e . preventDefau l t ( ) ;
f e t ch I t emIn fo ( $ ( t h i s ) . a t t r (" data−id ") , f unc t i on ( i n f o ) {
67

popupItemInfo ( e . pageX , e . pageY , i n f o ) ;
} ) ;
} ) ;
A.3 Task T4: Real-Time Chat
A.3.1 app.js (Node.js server code)
var expre s s = r equ i r e ( ' express ' )
, app = expre s s ( )
, s e r v e r = r equ i r e ( ' http ' ) . c r e a t eS e rv e r ( app )
, i o = r equ i r e ( ' socke t . io ' ) . l i s t e n ( s e r v e r ) ;
s e r v e r . l i s t e n ( 3000 ) ;
app . use ( expre s s . s t a t i c (__dirname + '/ publ ic ' ) ) ;
var messages = new Array ( )
Array . prototype . i n j e c t = func t i on ( element ) {
i f ( t h i s . l ength >= 5) {
t h i s . s h i f t ( )
}
t h i s . push ( element )
}
i o . s o cke t s . on ( ' connect ion ' , f unc t i on ( socke t ) {
socke t . emit (" i n i t " , JSON. s t r i n g i f y ( messages ) ) ;
socke t . on ( 'msg ' , f unc t i on (msg) {
var message = JSON. parse (msg)
68

messages . i n j e c t ( message )
socke t . broadcast . emit ( 'msg ' , msg)
} ) ;
socke t . on ( ' disconnect ' , f unc t i on ( ) {
} ) ;
} ) ;
A.3.2 index.html
Some lines were wrapped to fit on the page.
<s ty l e >
#msgs {
he ight : 300px ;
background : #f 3 f 3 f f ;
font−f ami ly : monospace , sans ;
over f l ow : auto ;
}
. chat−t i t l e {
c o l o r : white ;
background : #a2a2ee ;
font−weight : bold ;
font−s i z e : 20px ;
he ight : 24px ;
padding : 2px ;
}
</s ty l e >
<div>
<p c l a s s="chat−t i t l e " on c l i c k=" j a v a s c r i p t : toggleChat ();" >
69
Real Time Chat</p>
<div id="msgs"></div>
<div id="form">
<form id="chat " onsubmit="sendMsg ( ) ; r e turn f a l s e ;">
<l a b e l f o r="username">Username : </labe l >
<input name="username" type="text"><br/>
<l ab e l f o r="msg"> Message : </labe l >
<input id="msg" type="text " name="message"/><br/>
<input type="submit"/>
</form>
</div>
</div>
<s c r i p t type="text / j a v a s c r i p t " s r c="http :// ajax . goog l e ap i s . com/
ajax / l i b s / jquery /1 . 7 . 2 / jquery . j s "></s c r i p t >
<s c r i p t s r c="/socket . i o / socke t . i o . j s "></s c r i p t >
<s c r i p t s r c="main . j s "></s c r i p t >
A.3.3 main.js (included on index.html)
var socke t = io . connect ( ' http :// l o c a l h o s t : 3 0 0 0 ' ) ;
socke t . on ( 'msg ' , f unc t i on ( data ) {
var msg = JSON. parse ( data ) ;
appendMsg (msg ) ;
} ) ;
socke t . on ( ' i n i t ' , f unc t i on ( data ) {
var messages = JSON. parse ( data )
f o r ( i in messages )
appendMsg ( messages [ i ] )
70

} ) ;
f unc t i on appendMsg (msg) {
$( '#msgs ' ) . append ( func t i on ( ) {
var div = $( '<div > ') ;
d iv . html ( '<b>' + msg . username + ': </b> ' + msg . message ) ;
r e turn div ;
} ) ;
$( '#msgs ' ) [ 0 ] . s c ro l lTop = $( '#msgs ' ) [ 0 ] . s c r o l lH e i g h t ;
}
func t i on sendMsg ( ) {
var msg = {} ;
$ . each ( $( '#chat ' ) . s e r i a l i z eA r r a y ( ) , f unc t i on ( i , v ) {
msg [ v . name ] = v . va lue ;
} ) ;
$("#msg " ) . va l ( " " ) ;
appendMsg (msg ) ;
socke t . emit ( ' message ' , JSON. s t r i n g i f y (msg ) ) ;
}
A.4 Task T5: Faulty Auto-Complete
A.4.1 app.js (Node.js server)
( func t i on ( ) {
' use s t r i c t ' ;
var http = r equ i r e ( ' http ' ) ;
var connect = r equ i r e ( ' connect ' ) ;
71
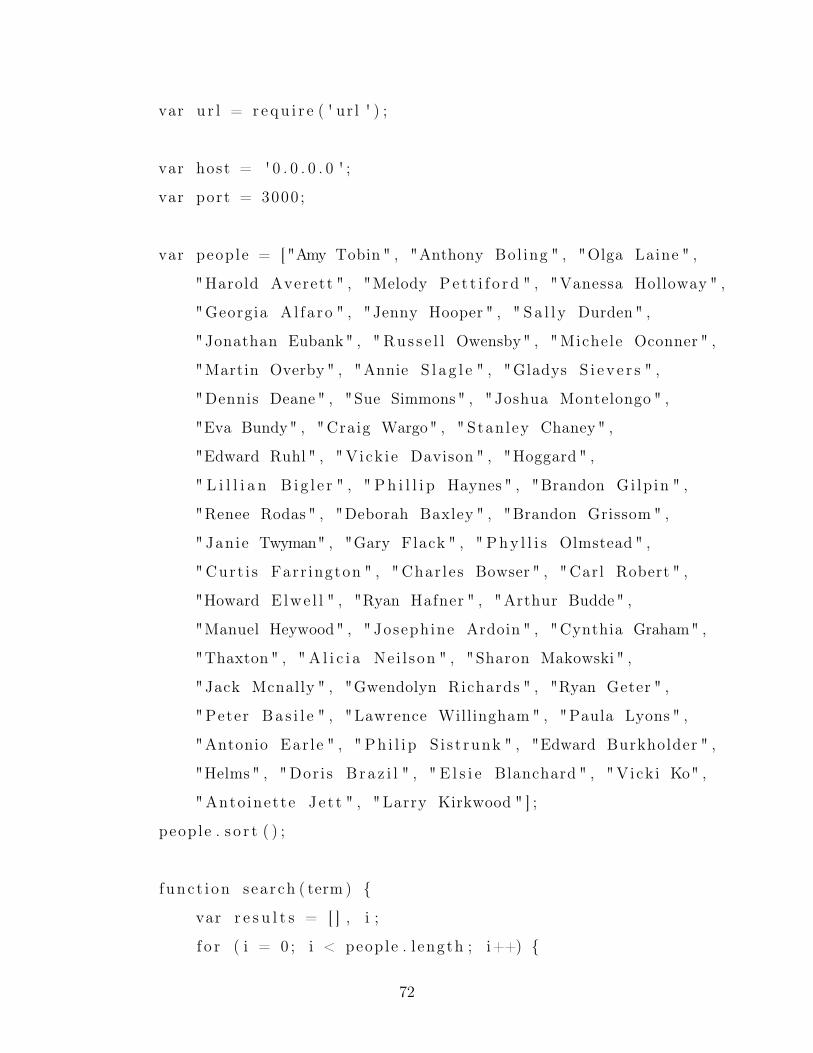
var u r l = r equ i r e ( ' ur l ' ) ;
var host = ' 0 . 0 . 0 . 0 ' ;
var port = 3000 ;
var people = [ "Amy Tobin " , "Anthony Bol ing " , "Olga Laine " ,
"Harold Averett " , "Melody Pe t t i f o r d " , "Vanessa Holloway " ,
"Georgia Al fa ro " , "Jenny Hooper " , " Sa l l y Durden " ,
"Jonathan Eubank" , " Rus s e l l Owensby" , "Michele Oconner " ,
"Martin Overby " , "Annie S l a g l e " , "Gladys S i e v e r s " ,
"Dennis Deane " , "Sue Simmons" , "Joshua Montelongo " ,
"Eva Bundy" , "Craig Wargo" , " Stanley Chaney" ,
"Edward Ruhl " , "Vick i e Davison " , "Hoggard " ,
" L i l l i a n B i g l e r " , " Ph i l l i p Haynes " , "Brandon Gi lp in " ,
"Renee Rodas " , "Deborah Baxley " , "Brandon Grissom " ,
" Janie Twyman" , "Gary Flack " , " Phy l l i s Olmstead " ,
"Curt i s Farr ington " , "Char les Bowser " , "Carl Robert " ,
"Howard Elwe l l " , "Ryan Hafner " , "Arthur Budde" ,
"Manuel Heywood" , " Josephine Ardoin " , "Cynthia Graham" ,
"Thaxton " , " A l i c i a Ne i l son " , "Sharon Makowski " ,
"Jack Mcnally " , "Gwendolyn Richards " , "Ryan Geter " ,
"Peter Ba s i l e " , "Lawrence Willingham " , "Paula Lyons " ,
"Antonio Ear le " , " Ph i l i p S i s t runk " , "Edward Burkholder " ,
"Helms " , "Dor is B ra z i l " , " E l s i e Blanchard " , "Vick i Ko" ,
"Anto inette Je t t " , "Larry Kirkwood " ] ;
people . s o r t ( ) ;
f unc t i on search ( term ) {
var r e s u l t s = [ ] , i ;
f o r ( i = 0 ; i < people . l ength ; i++) {
72
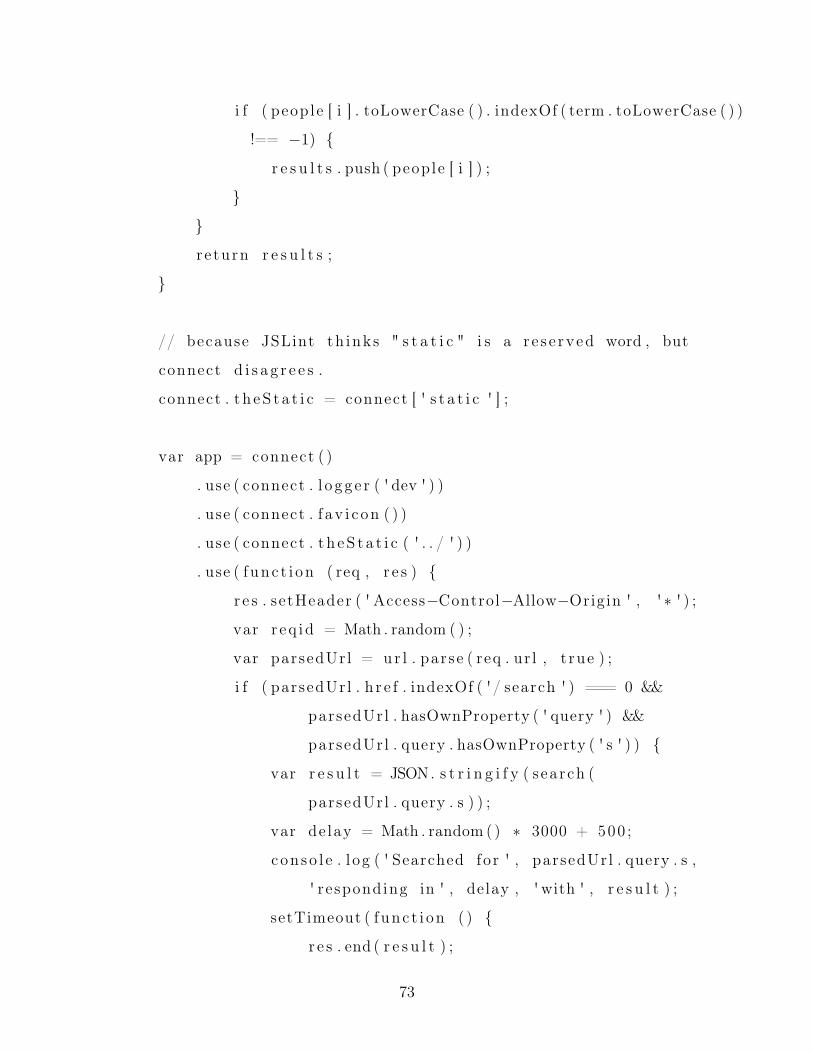
i f ( people [ i ] . toLowerCase ( ) . indexOf ( term . toLowerCase ( ) )
!== −1) {
r e s u l t s . push ( people [ i ] ) ;
}
}
re turn r e s u l t s ;
}
// because JSLint th inks " s t a t i c " i s a r e s e rved word , but
connect d i s a g r e e s .
connect . t h eS t a t i c = connect [ ' s t a t i c ' ] ;
var app = connect ( )
. use ( connect . l o gg e r ( ' dev ' ) )
. use ( connect . f av i con ( ) )
. use ( connect . t h eS t a t i c ( ' . . / ' ) )
. use ( func t i on ( req , r e s ) {
r e s . setHeader ( ' Access−Control−Allow−Origin ' , ' ∗ ' ) ;
var r eq id = Math . random ( ) ;
var parsedUrl = u r l . parse ( req . ur l , t rue ) ;
i f ( parsedUrl . h r e f . indexOf ( '/ search ' ) === 0 &&
parsedUrl . hasOwnProperty ( ' query ' ) &&
parsedUrl . query . hasOwnProperty ( ' s ' ) ) {
var r e s u l t = JSON. s t r i n g i f y ( search (
parsedUrl . query . s ) ) ;
var de lay = Math . random ( ) ∗ 3000 + 500 ;
con so l e . l og ( ' Searched for ' , parsedUrl . query . s ,
' responding in ' , delay , 'with ' , r e s u l t ) ;
setTimeout ( func t i on ( ) {
r e s . end ( r e s u l t ) ;
73
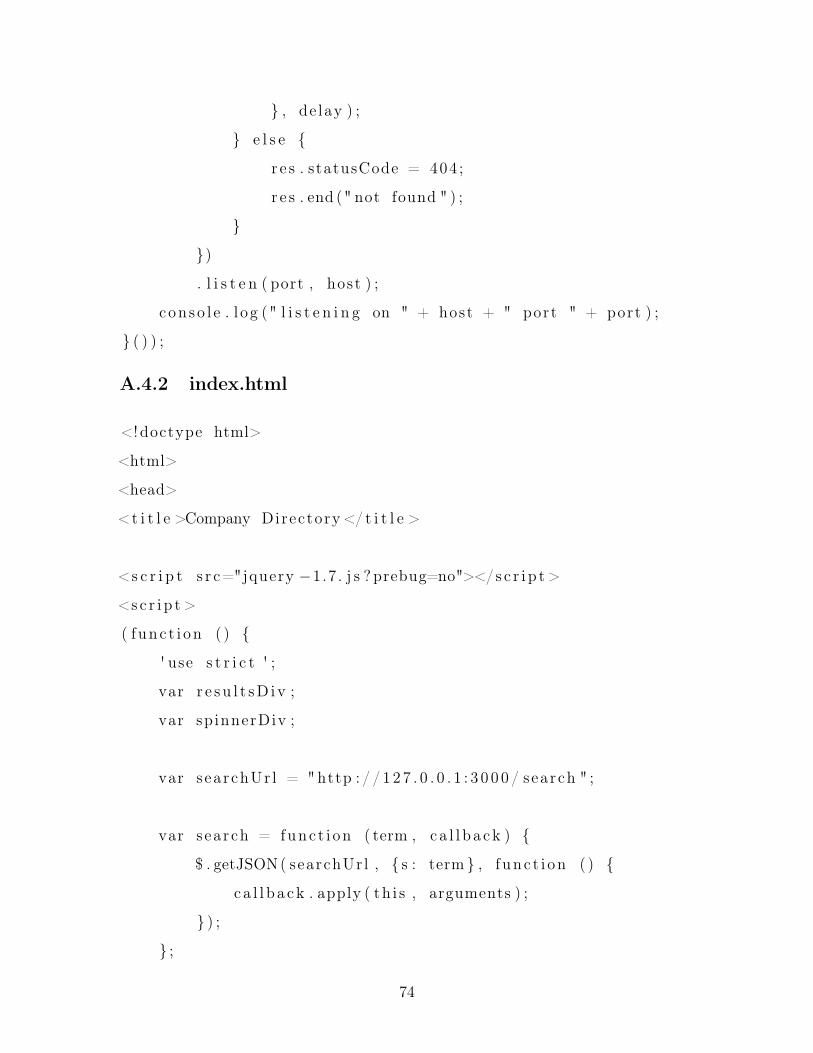
} , de lay ) ;
} e l s e {
r e s . statusCode = 404 ;
r e s . end (" not found " ) ;
}
})
. l i s t e n ( port , host ) ;
c on so l e . l og (" l i s t e n i n g on " + host + " port " + port ) ;
} ( ) ) ;
A.4.2 index.html
<!doctype html>
<html>
<head>
<t i t l e >Company Directory </ t i t l e >
<s c r i p t s r c="jquery −1.7. j s ? prebug=no"></s c r i p t >
<sc r i p t >
( func t i on ( ) {
' use s t r i c t ' ;
var r e su l t sD i v ;
var sp innerDiv ;
var searchUr l = "http : / / 1 2 7 . 0 . 0 . 1 : 3 0 0 0 / search " ;
var search = func t i on ( term , ca l l b a ck ) {
$ . getJSON( searchUrl , { s : term } , func t i on ( ) {
ca l l ba ck . apply ( th i s , arguments ) ;
} ) ;
} ;
74
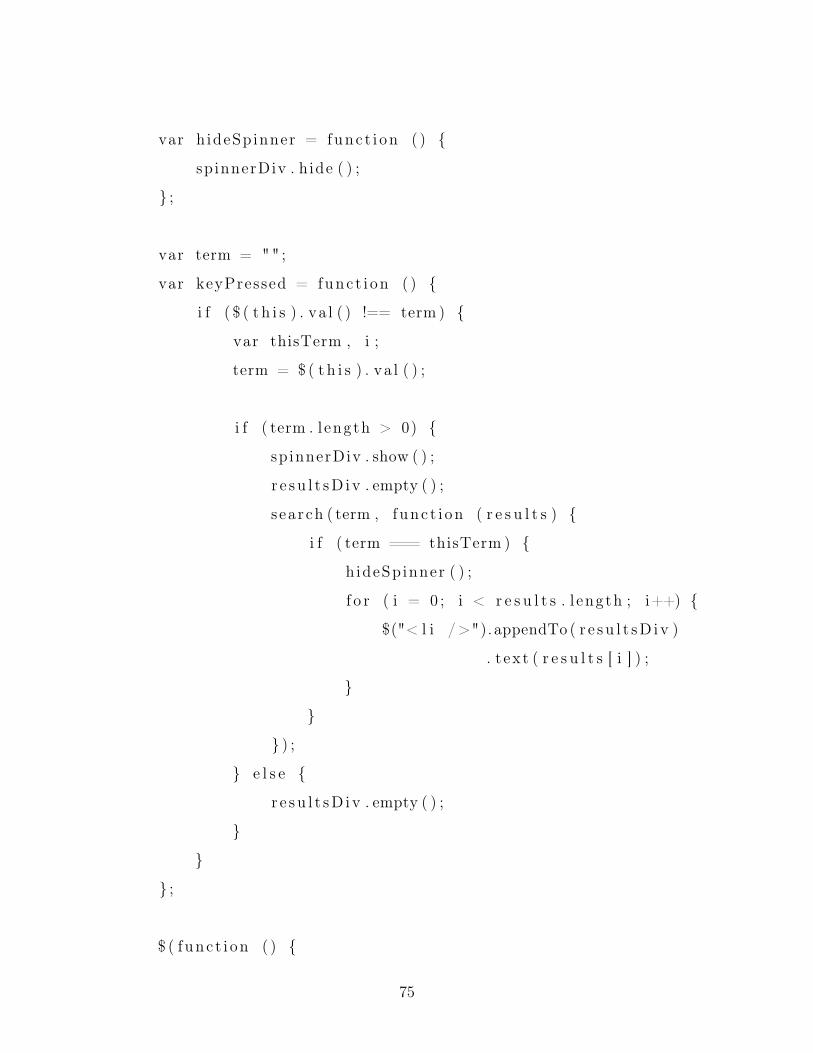
var h ideSpinner = func t i on ( ) {
spinnerDiv . h ide ( ) ;
} ;
var term = "" ;
var keyPressed = func t i on ( ) {
i f ( $ ( t h i s ) . va l ( ) !== term ) {
var thisTerm , i ;
term = $ ( t h i s ) . va l ( ) ;
i f ( term . l ength > 0) {
spinnerDiv . show ( ) ;
r e s u l t sD i v . empty ( ) ;
s earch ( term , func t i on ( r e s u l t s ) {
i f ( term === thisTerm ) {
hideSpinner ( ) ;
f o r ( i = 0 ; i < r e s u l t s . l ength ; i++) {
$("< l i />").appendTo ( r e su l t sD i v )
. t ex t ( r e s u l t s [ i ] ) ;
}
}
} ) ;
} e l s e {
r e su l t sD i v . empty ( ) ;
}
}
} ;
$ ( func t i on ( ) {
75

$ (" body " ) . append (" Search : " ) ;
var textbox = $("< input />").appendTo ("body " ) ;
textbox . on ( ' keyup ' , keyPressed ) ;
textbox . f o cus ( ) ;
sp innerDiv = $("<div />").appendTo ("body ")
. html("<img s r c=' sp inner . g i f ' />")
. h ide ( ) ;
r e s u l t sD i v = $("<div />").appendTo ("body " ) ;
} ) ;
} ( ) ) ;
</s c r i p t >
</head>
<body>
</body>
</html>
76