underkeel clearance management systems - lone star … clearance... · - wave response - changes in...
TRANSCRIPT
Underkeel Clearance
Management Systems
Captain Jonathon Pearce
Senior Pilotage Advisor
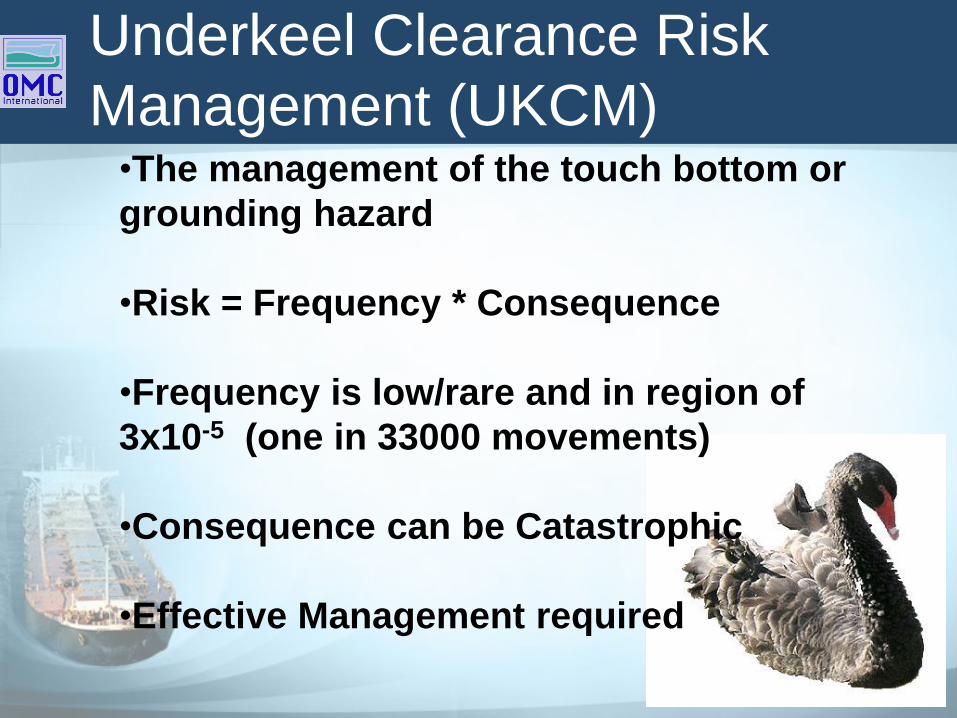
Underkeel Clearance Risk
Management (UKCM)•The management of the touch bottom or
grounding hazard
•Risk = Frequency * Consequence
•Frequency is low/rare and in region of
3x10⁻⁵ (one in 33000 movements)
•Consequence can be Catastrophic
•Effective Management required
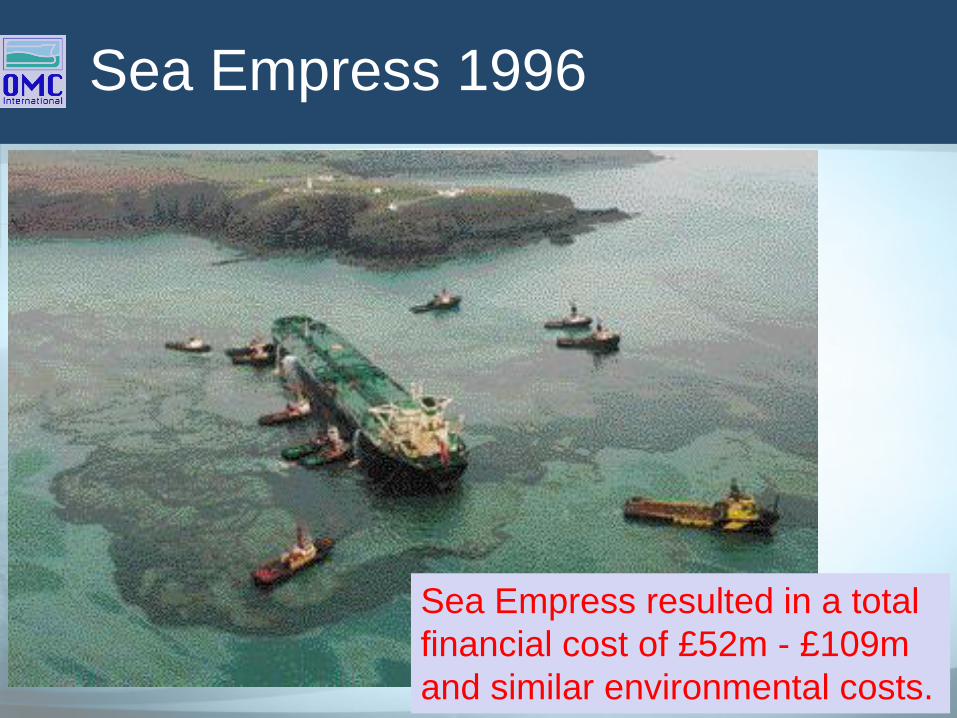
Sea Empress 1996
Sea Empress resulted in a total
financial cost of £52m - £109m
and similar environmental costs.
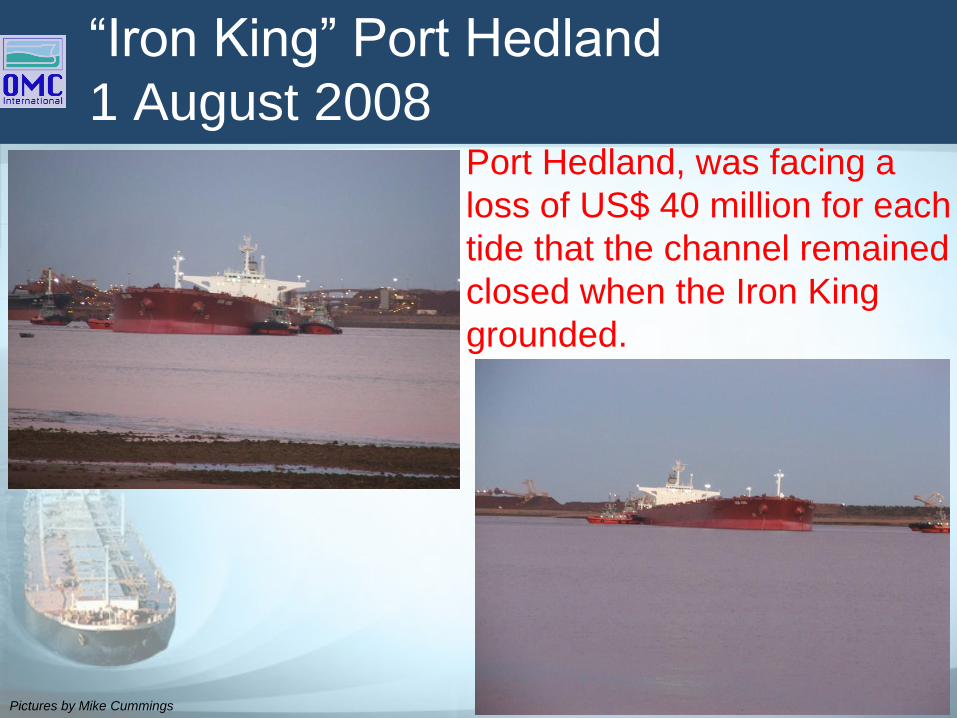
“Iron King” Port Hedland
1 August 2008
Pictures by Mike Cummings
Port Hedland, was facing a
loss of US$ 40 million for each
tide that the channel remained
closed when the Iron King
grounded.

mv “Rena” 5 October 2011 NZ
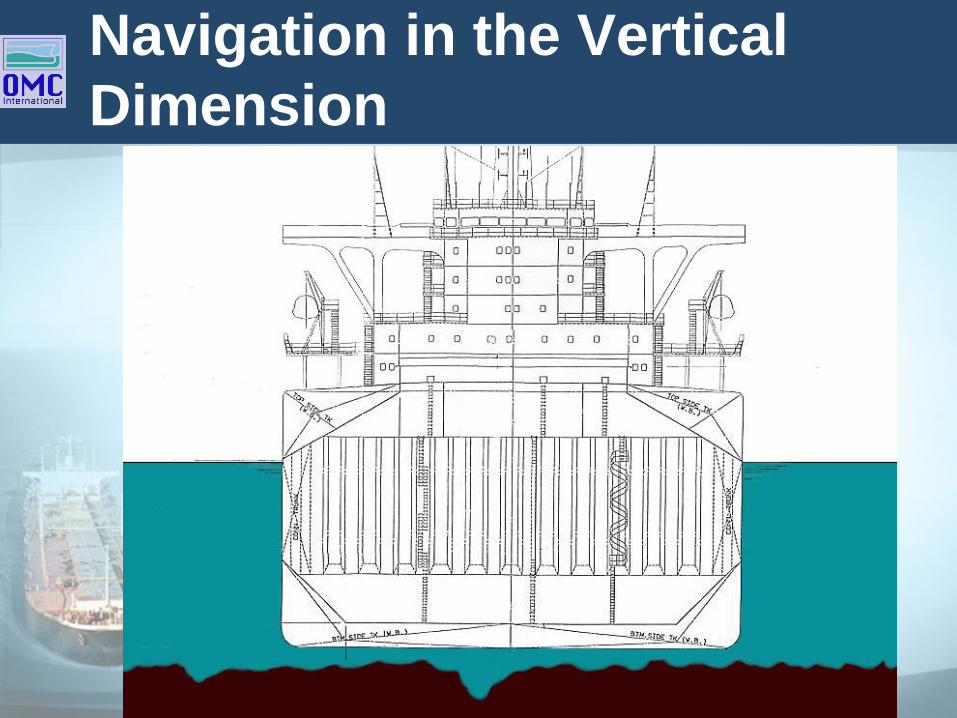
Navigation in the Vertical
Dimension
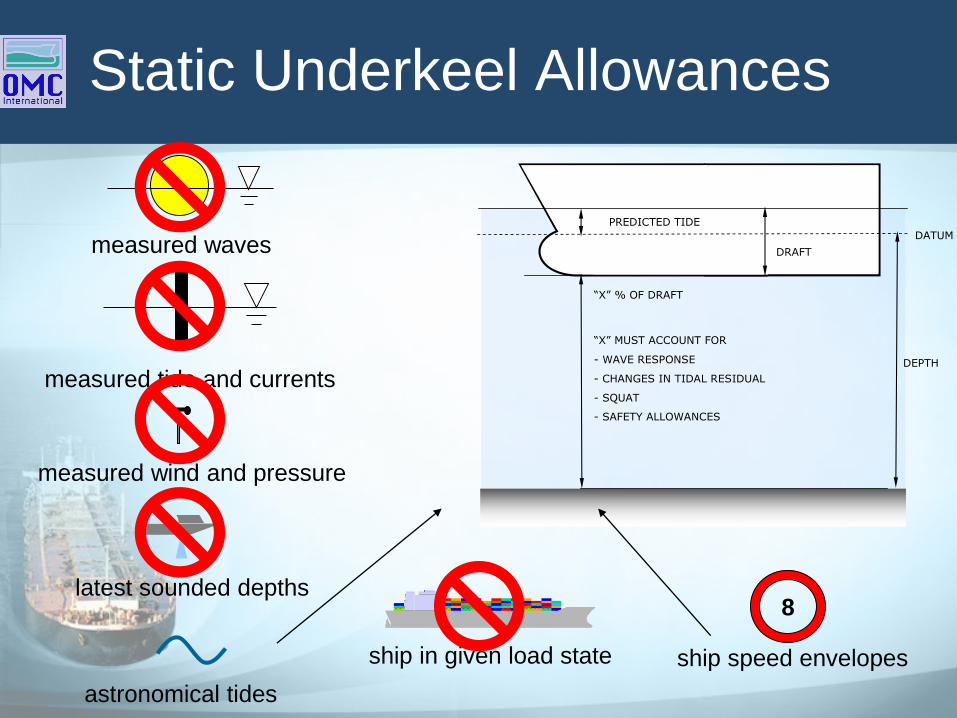
measured tide and currents
measured waves
measured wind and pressure
ship in given load state
latest sounded depths8
ship speed envelopes
astronomical tides
DATUM
“X” % OF DRAFT
DRAFT
DEPTH
PREDICTED TIDE
“X” MUST ACCOUNT FOR
- WAVE RESPONSE
- CHANGES IN TIDAL RESIDUAL
- SQUAT
- SAFETY ALLOWANCES
Static Underkeel Allowances
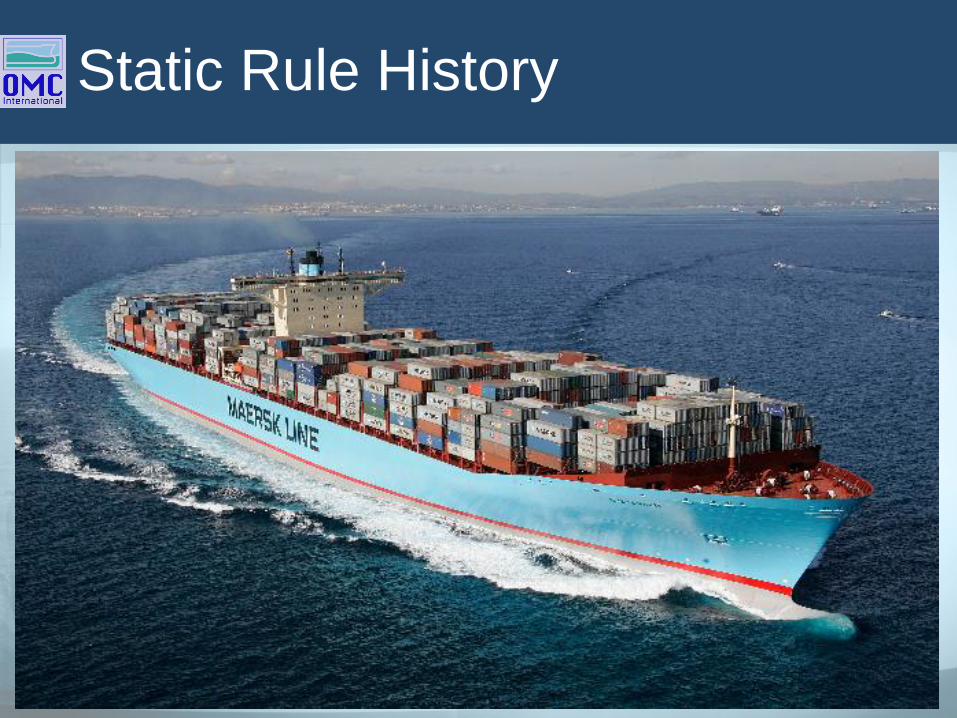
Static Rule History
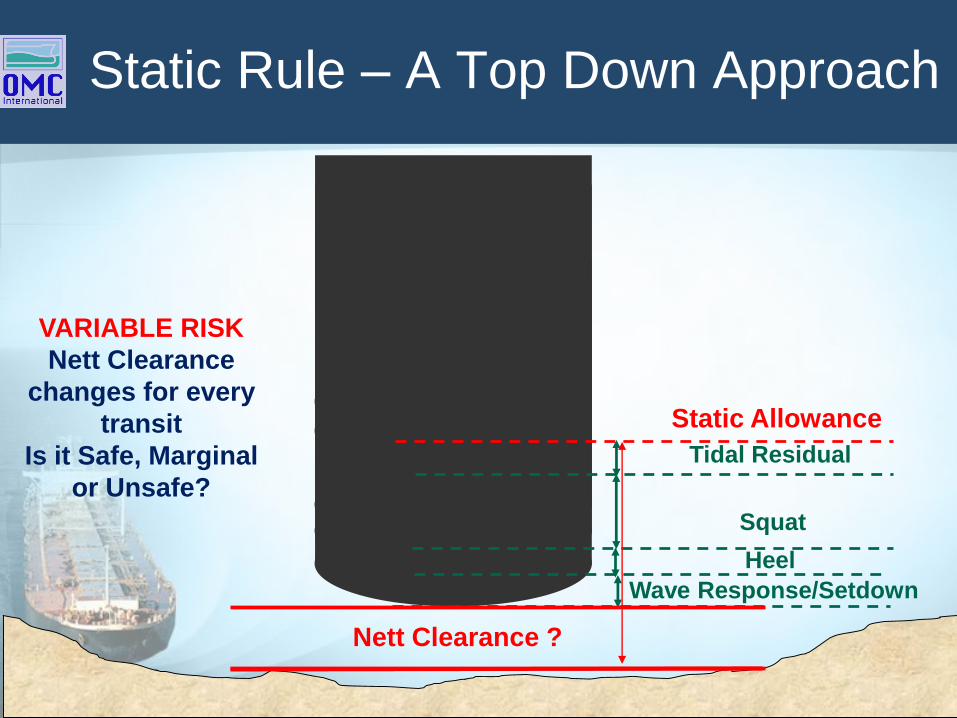
Wave Response/Setdown
Heel
Squat
Tidal Residual
Static Rule – A Top Down Approach
Static Allowance
Nett Clearance ?
VARIABLE RISK
Nett Clearance
changes for every
transit
Is it Safe, Marginal
or Unsafe?

Static Rule Compromise
Optimism v Conservatism
Static Rules are:
Blunt compromise between economics
and safety;
Nett clearances change from day to day,
ship to ship and even transit to transit!
Too optimistic - Safety jeopardisedToo conservative - Less cargo
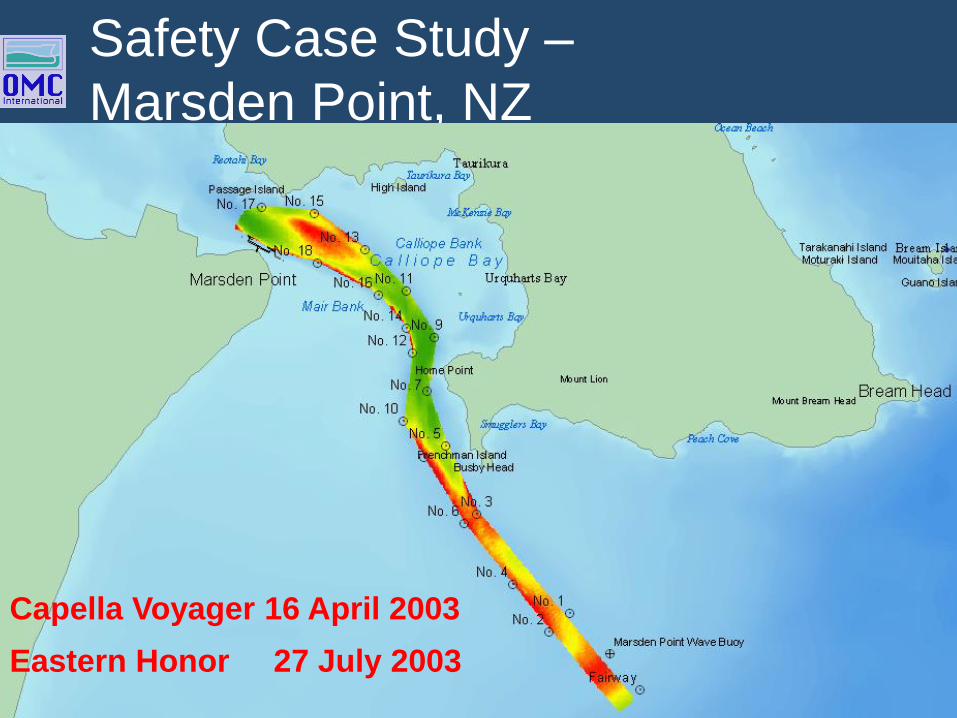
Safety Case Study –
Marsden Point, NZ
Eastern Honor 27 July 2003
Capella Voyager 16 April 2003

Under most conditions a static rule will be conservative
However, groundings can occur when a ship is sensitive to the prevailing conditions (this is actual data!)
Marsden Vessel Analysis
Don’t be complacent about your existing rules!
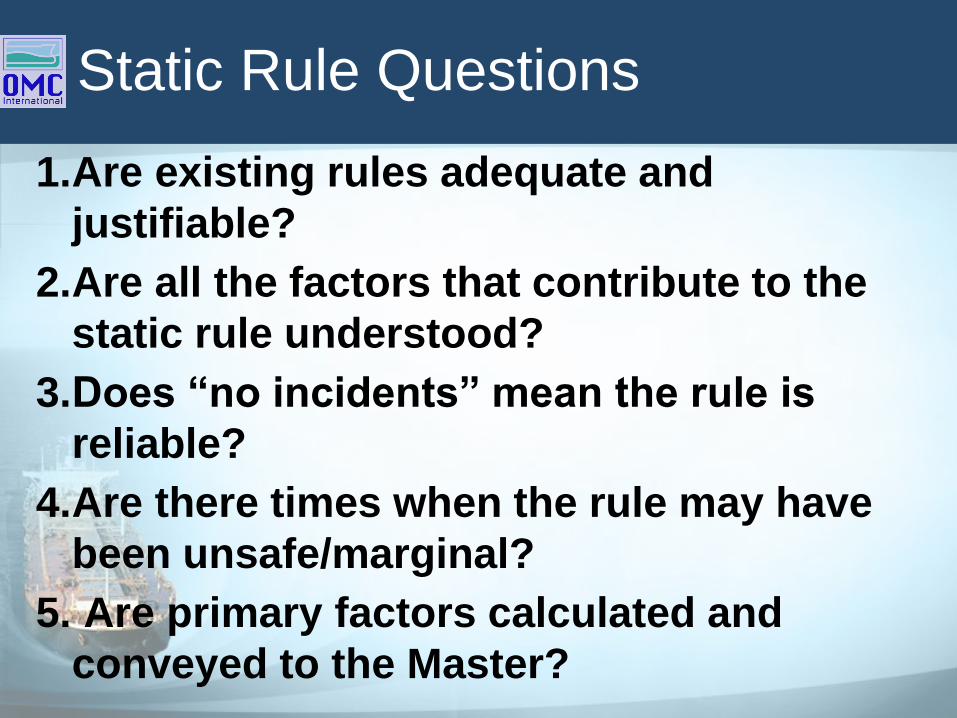
Static Rule Questions
1.Are existing rules adequate and
justifiable?
2.Are all the factors that contribute to the
static rule understood?
3.Does “no incidents” mean the rule is
reliable?
4.Are there times when the rule may have
been unsafe/marginal?
5. Are primary factors calculated and
conveyed to the Master?

measured tide
& currents
measured waves
measured wind
& pressure
ship in given load state
latest sounded
depths
8
ship speed envelopesastronomical tides
Dynamic UKC Methodology
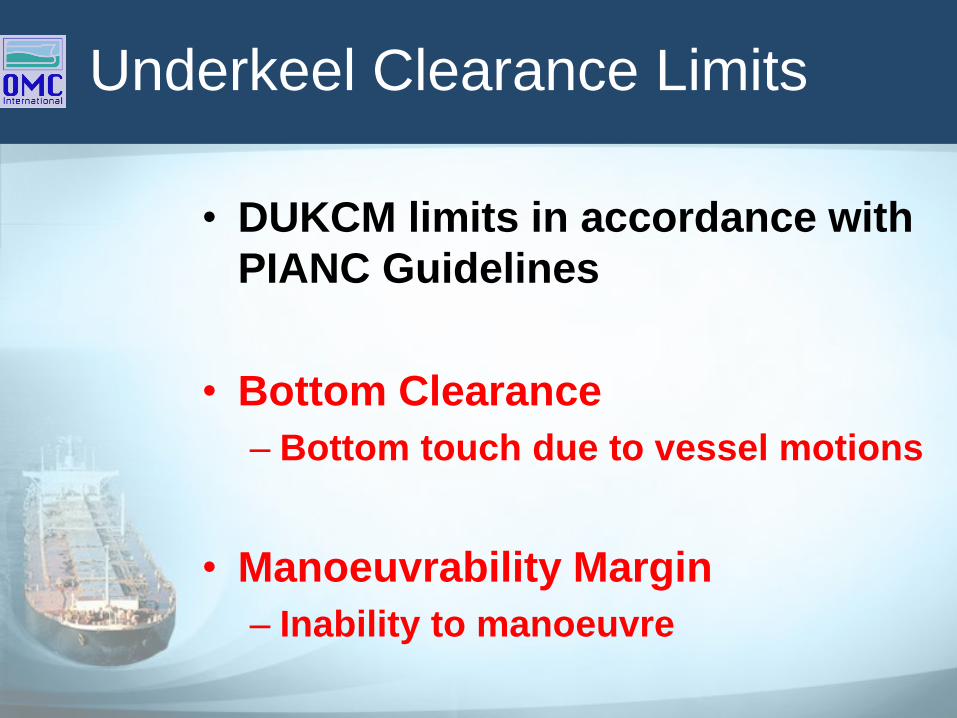
Underkeel Clearance Limits
• DUKCM limits in accordance with
PIANC Guidelines
• Bottom Clearance
– Bottom touch due to vessel motions
• Manoeuvrability Margin
– Inability to manoeuvre
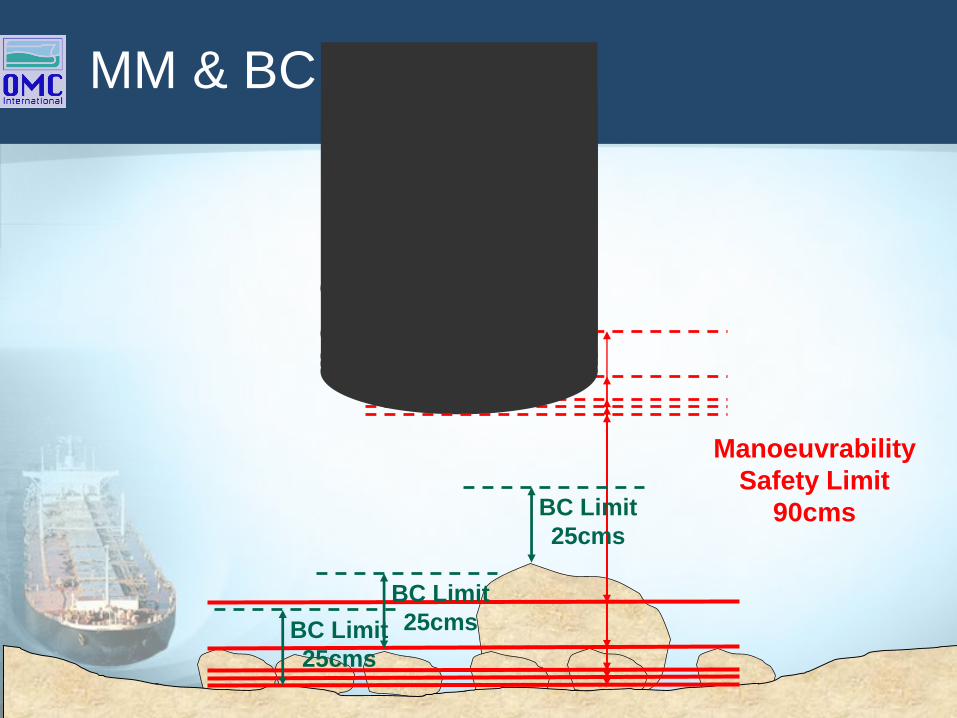
MM & BC
Manoeuvrability
Safety Limit
90cmsBC Limit
25cms
BC Limit
25cmsBC Limit
25cms
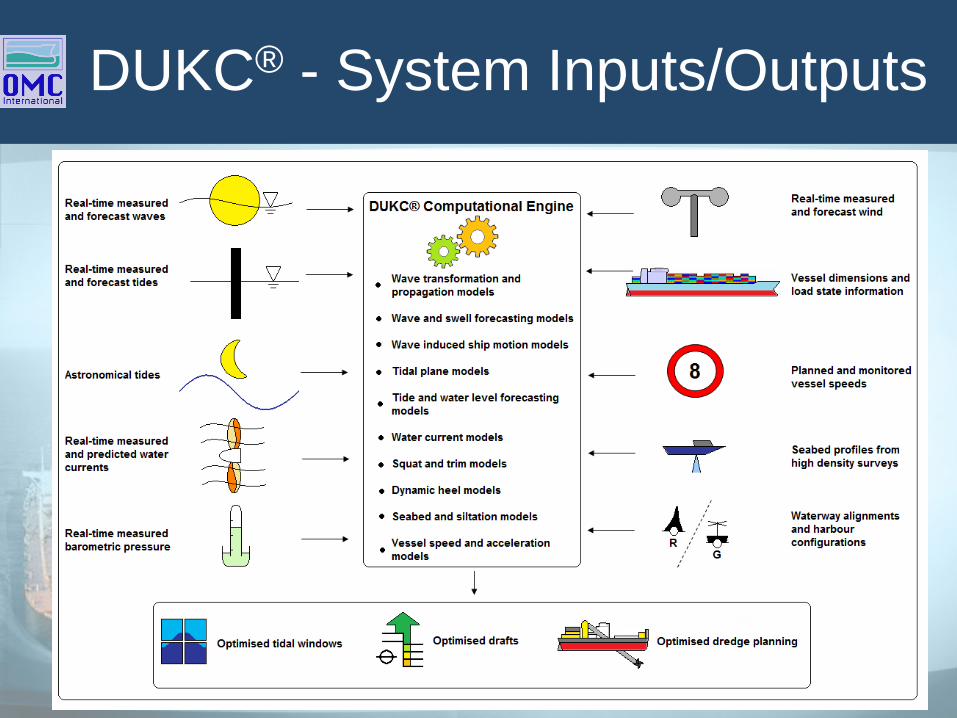
DUKC® - System Inputs/Outputs
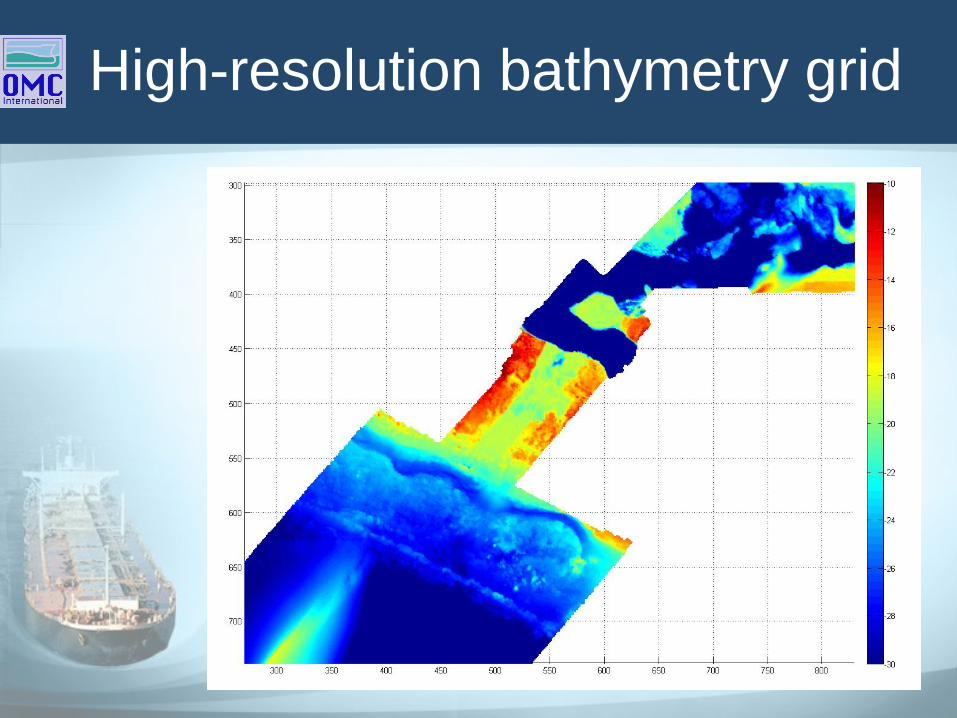
High-resolution bathymetry grid
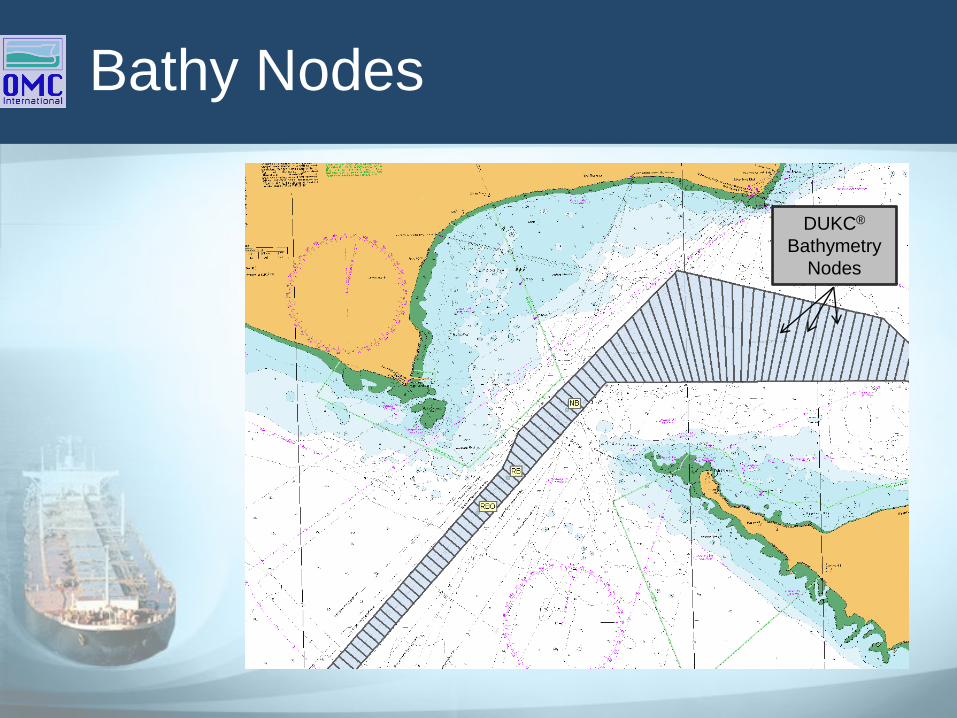
Bathy Nodes
DUKC®
Bathymetry
Nodes

Channel Segment
14.8m BC
Declared Depth
15.7m Max
Channel Section
300m to channel boundary
100m segment
MM 15.0m for 300m x 100m section
Channel Boundary
Scale exaggerated by 25x for emphasis
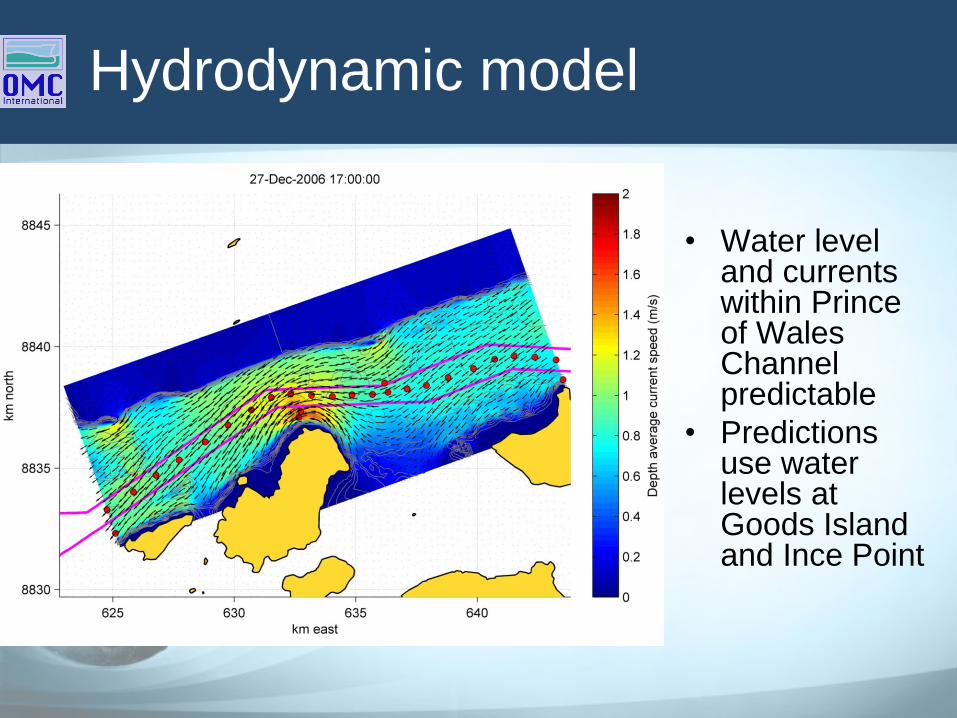
Hydrodynamic model
• Water level and currents within Prince of Wales Channel predictable
• Predictions use water levels at Goods Island and Ince Point
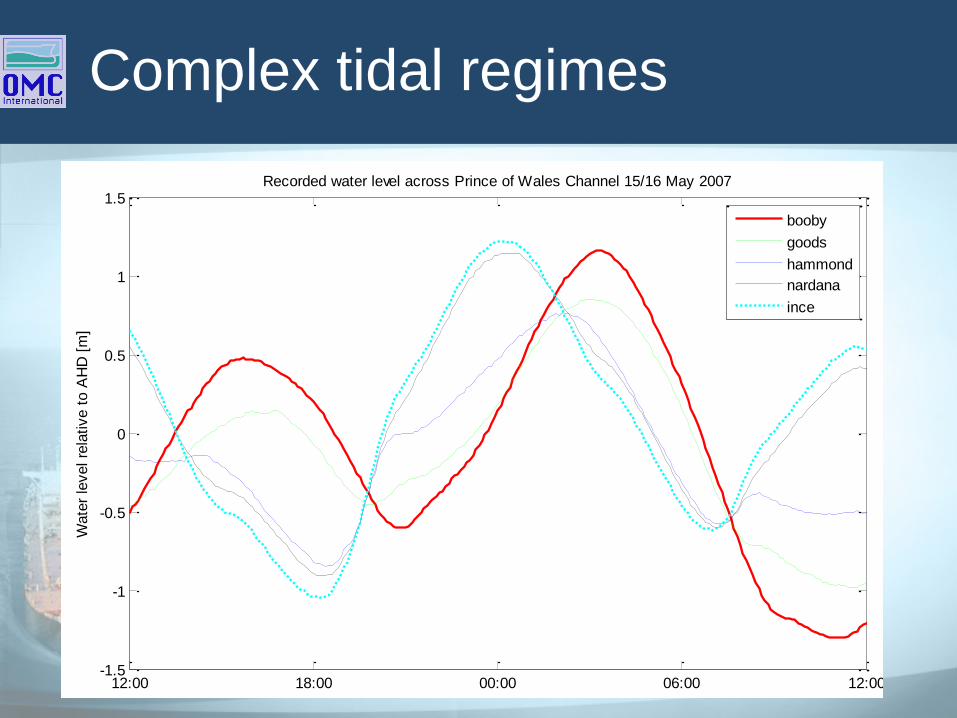
Complex tidal regimes
12:00 18:00 00:00 06:00 12:00-1.5
-1
-0.5
0
0.5
1
1.5
Wate
r le
vel re
lative t
o A
HD
[m
]
Recorded water level across Prince of Wales Channel 15/16 May 2007
booby
goods
hammond
nardana
ince

Tidal Residuals
Positive Residual
Negative Residual
Measurements
Predictions
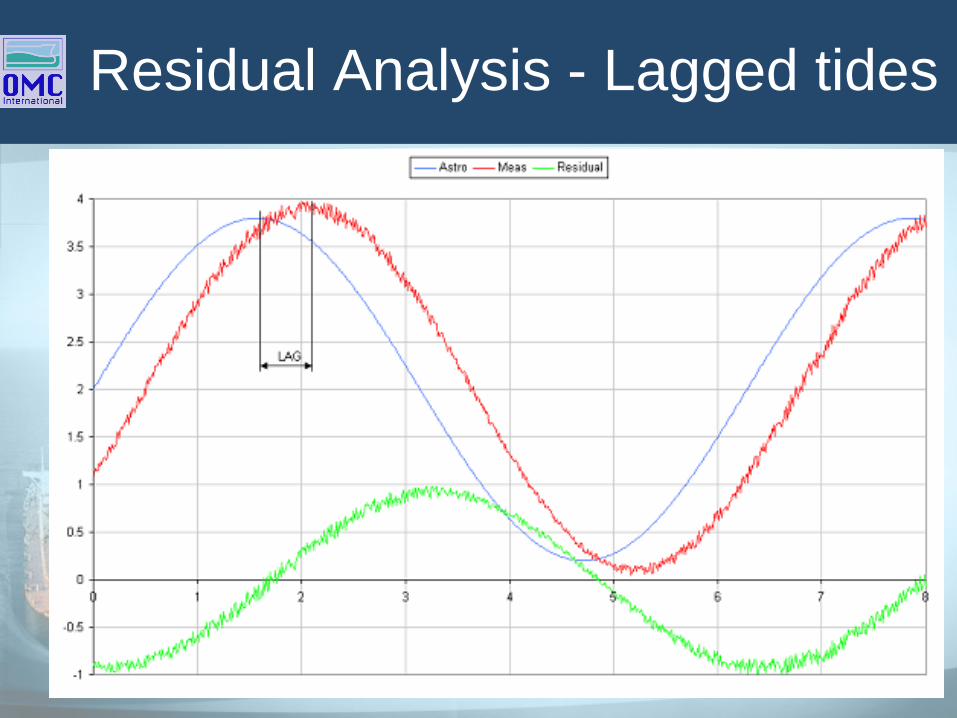
Residual Analysis - Lagged tides
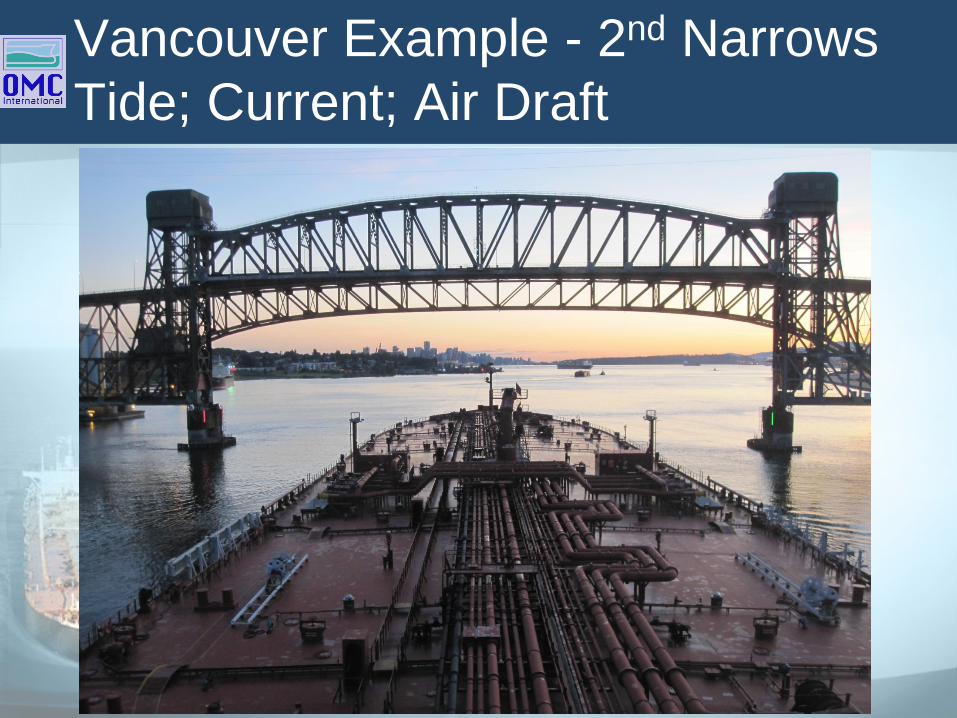
Vancouver Example - 2nd Narrows
Tide; Current; Air Draft
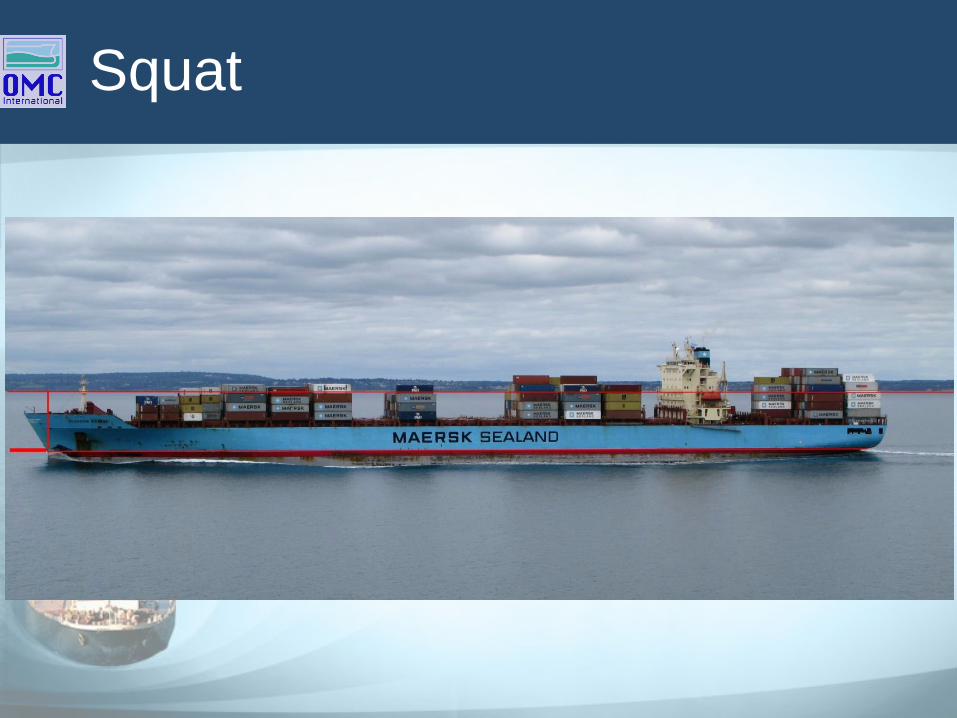
Squat
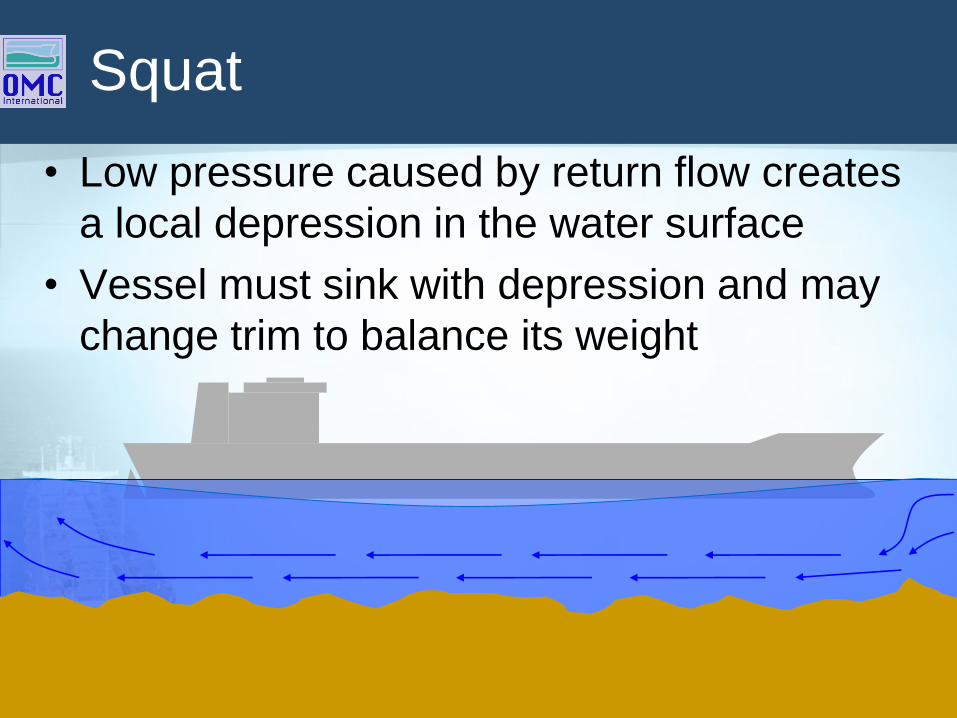
Squat
• Low pressure caused by return flow creates
a local depression in the water surface
• Vessel must sink with depression and may
change trim to balance its weight
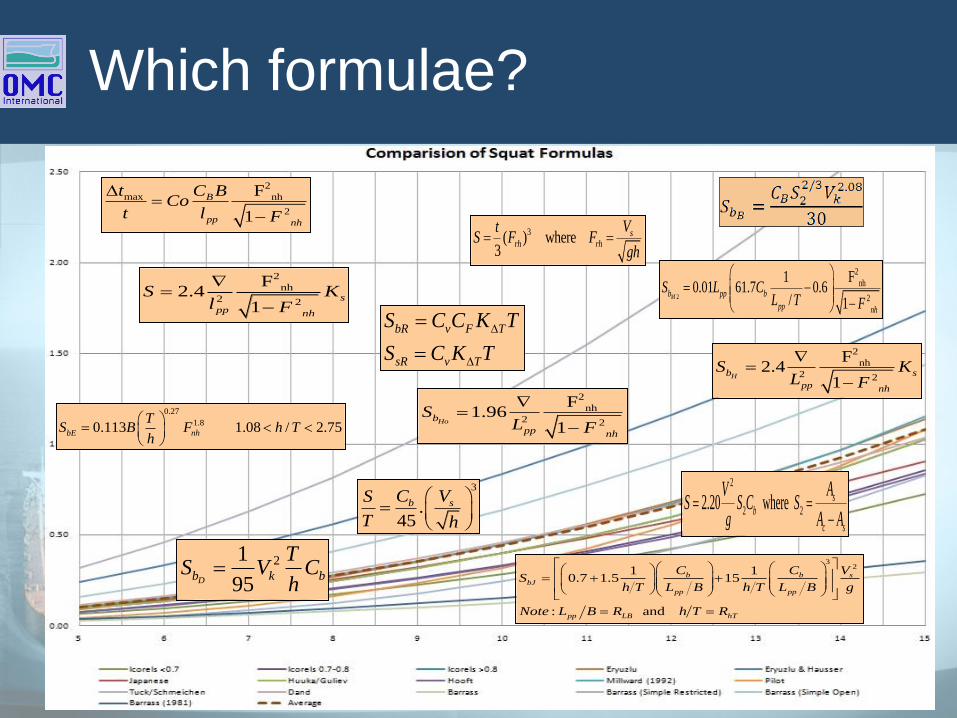
Which formulae?
2
max nh
2
F
1
B
pp nh
t C BCo
t l F
2
nh
2 2
F2.4
1s
pp nh
S Kl F
0.27
1.80.113 1.08 / 2.75bE nh
TS B F h T
h
2
nh
2 2
F1.96
1Hob
pp nh
SL F
2
nh
2 2
F2.4
1Hb s
pp nh
S KL F
2
2
nh
2
F10.01 61.7 0.6
/ 1Mb pp b
pp nh
S L CL T F
bR v F T
sR v T
S C C K T
S C K T
3
.45
b sC VS
T h
3( ) where 3
srh rh
VtS F F
gh
2
2 22.20 where sb
c s
AVS S C S
g A A
21
95Db k b
TS V C
h
32
1 10.7 1.5 15
: and
b b sbJ
pp pp
pp LB hT
C C VS
h T L B h T L B g
Note L B R h T R
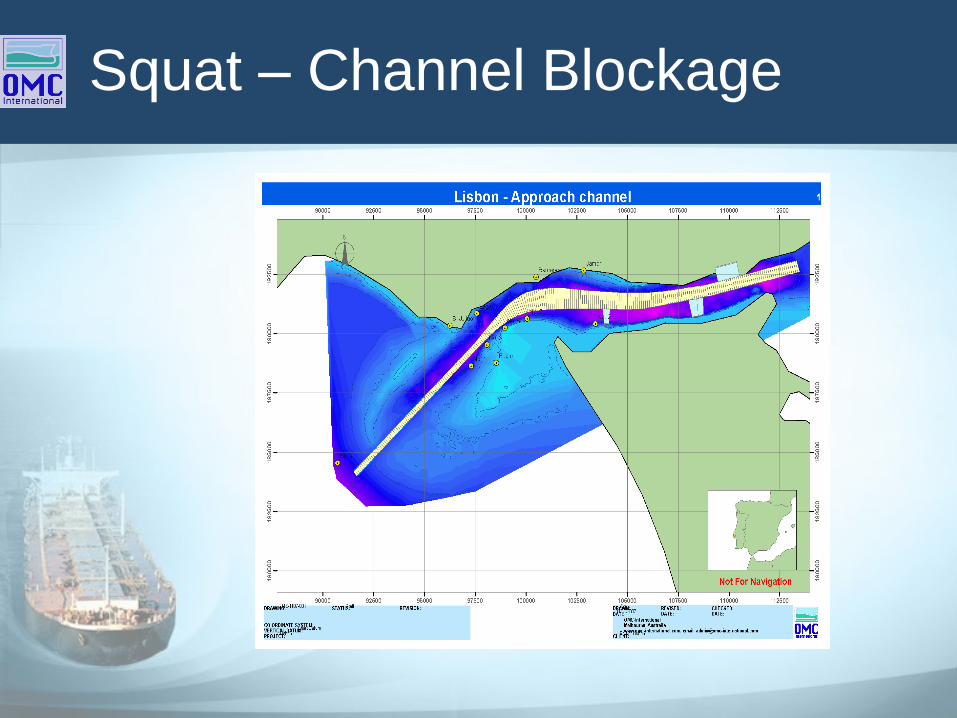
Squat – Channel Blockage

Squat Case Study – Port of Lisbon
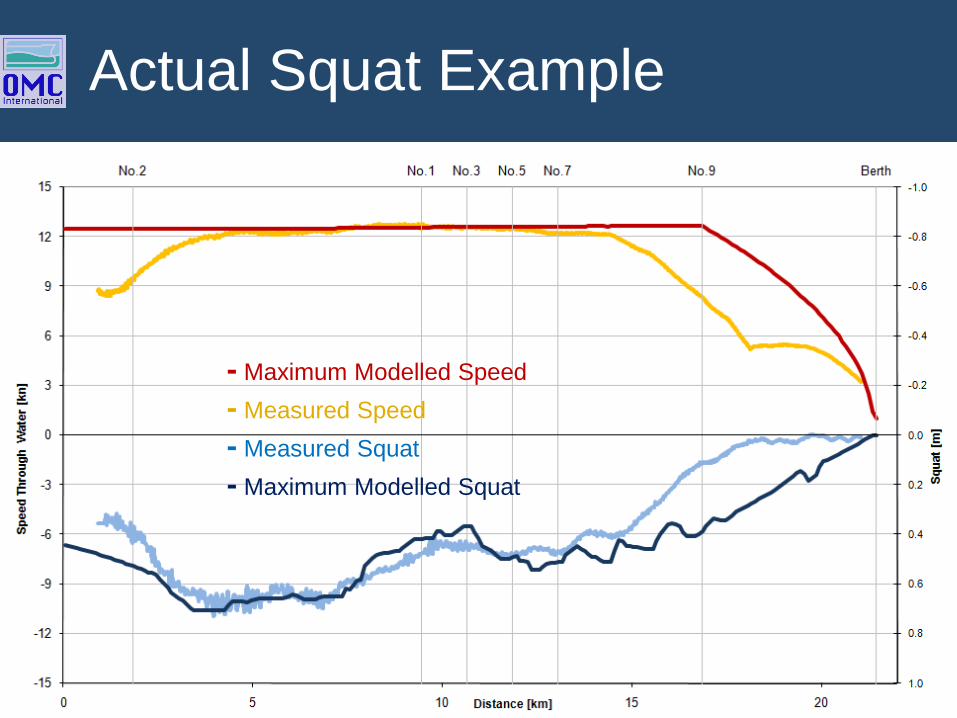
Actual Squat Example
- Maximum Modelled Speed
- Measured Speed
- Measured Squat
- Maximum Modelled Squat
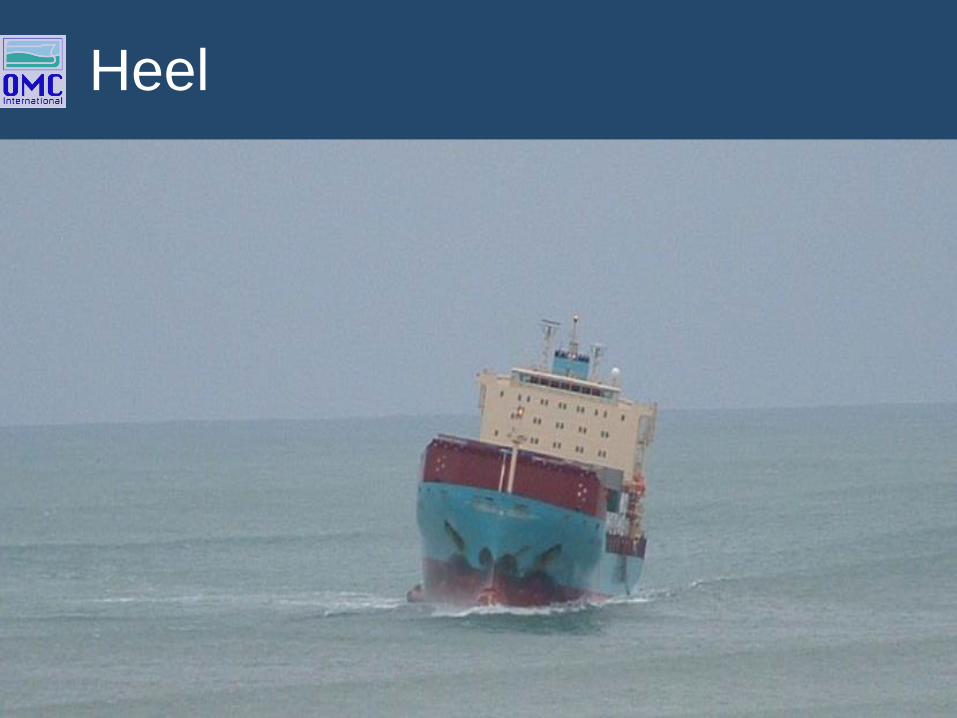
Heel
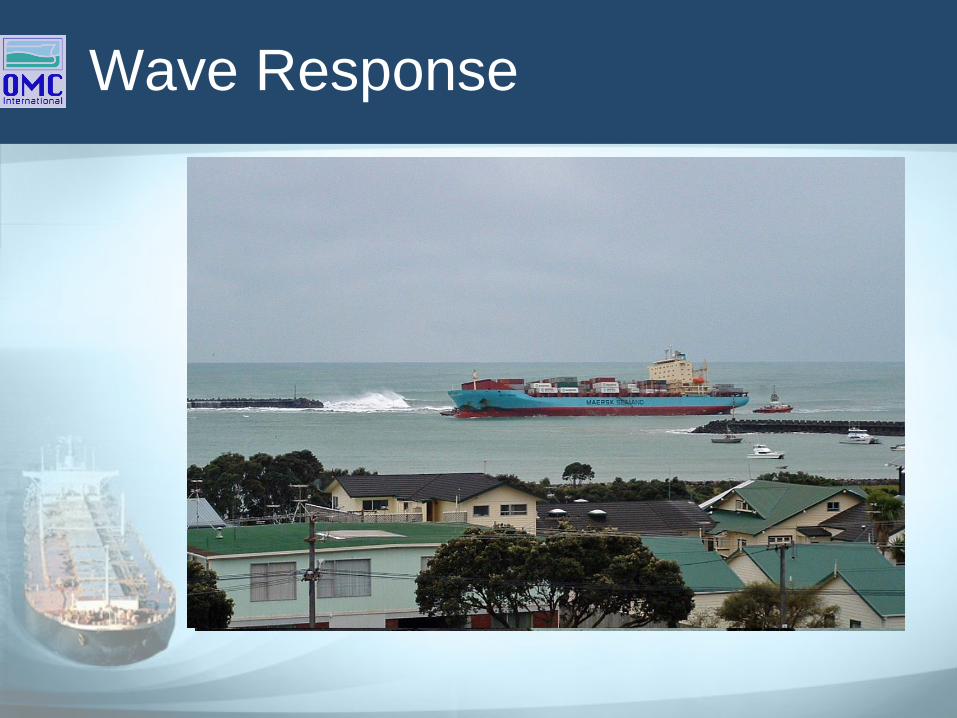
Wave Response
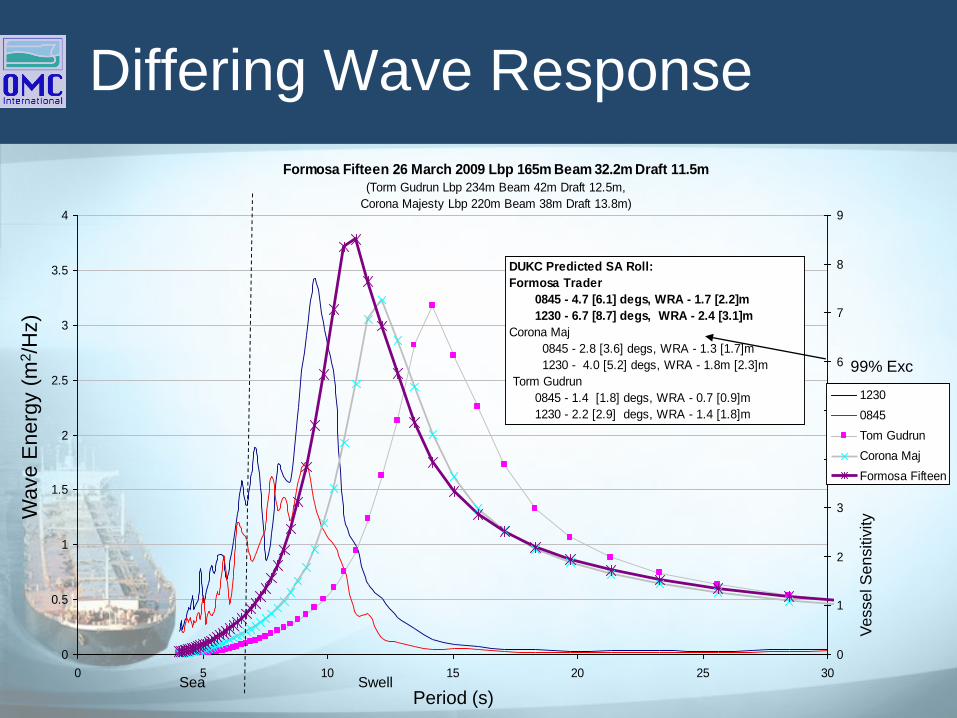
Differing Wave Response
Formosa Fifteen 26 March 2009 Lbp 165m Beam 32.2m Draft 11.5m
(Torm Gudrun Lbp 234m Beam 42m Draft 12.5m,
Corona Majesty Lbp 220m Beam 38m Draft 13.8m)
0
0.5
1
1.5
2
2.5
3
3.5
4
0 5 10 15 20 25 30
0
1
2
3
4
5
6
7
8
9
1230
0845
Tom Gudrun
Corona Maj
Formosa Fifteen
DUKC Predicted SA Roll:
Formosa Trader
0845 - 4.7 [6.1] degs, WRA - 1.7 [2.2]m
1230 - 6.7 [8.7] degs, WRA - 2.4 [3.1]m
Corona Maj
0845 - 2.8 [3.6] degs, WRA - 1.3 [1.7]m
1230 - 4.0 [5.2] degs, WRA - 1.8m [2.3]m
Torm Gudrun
0845 - 1.4 [1.8] degs, WRA - 0.7 [0.9]m
1230 - 2.2 [2.9] degs, WRA - 1.4 [1.8]m
99% Exc
Period (s)Sea Swell
Wave E
nerg
y (
m2/H
z)
Ve
sse
l S
en
sitiv
ity

2.4m
0.9m
1.2m
2.8m
Tidal Current (3.0kn)
Swell (1.7m Hm0)
FLOOD
Tidal Current (5.0kn)
Swell (2.8m Hm0)
Offshore Swell height = 2m, period = 14 seconds
EBB
PostPanamax
Handymax
Wave Response Calculation
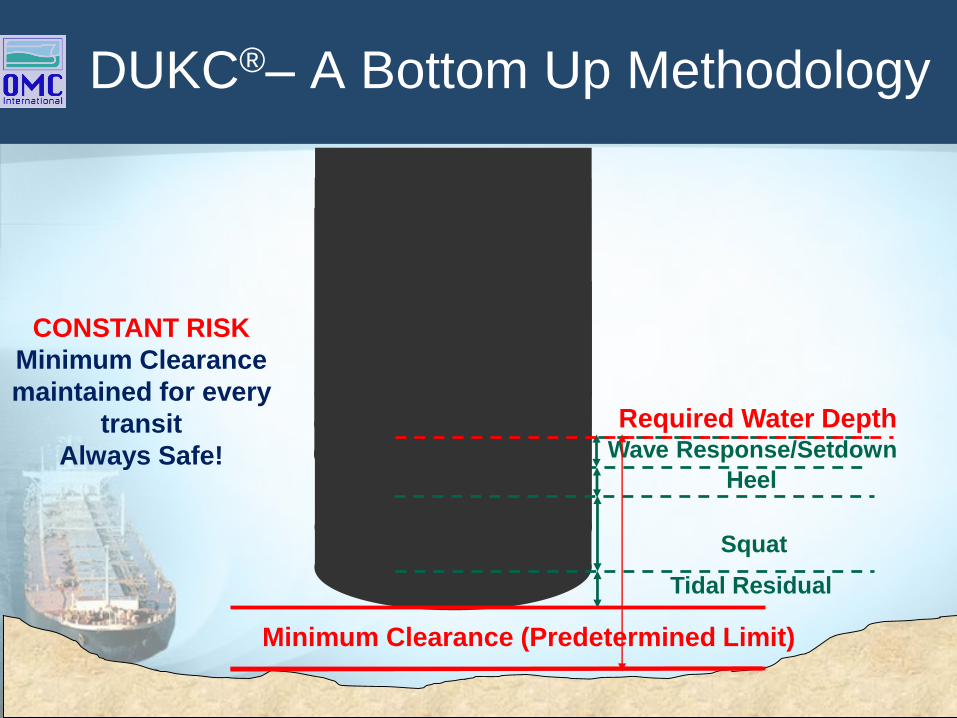
Wave Response/Setdown
Heel
Squat
Tidal Residual
DUKC®– A Bottom Up Methodology
Required Water Depth
Minimum Clearance (Predetermined Limit)
CONSTANT RISK
Minimum Clearance
maintained for every
transit
Always Safe!

UKC Safety Case Study – Port Taranaki
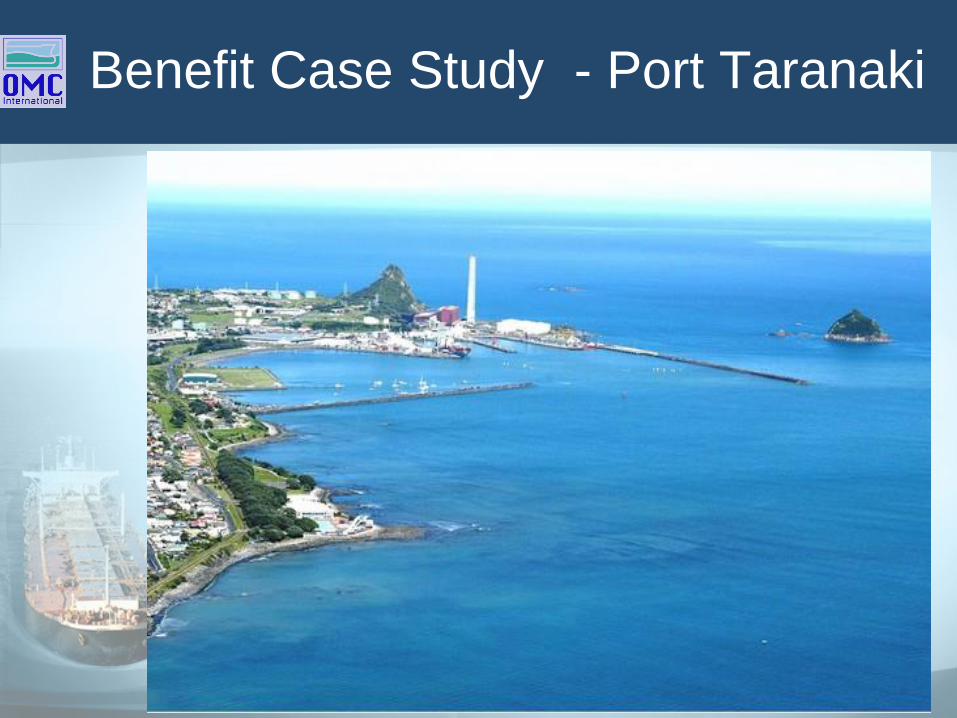
Benefit Case Study - Port Taranaki

Benefit Case Study - Port Taranaki
Blue Area
Static Tidal
Window
Orange Area
DUKC Tidal
Window
Static Rules not Sufficient in High Swell Conditions
Case Study – Torres
Strait
AMSA
Under Keel Clearance
Management System

Operational Area – Torres Strait
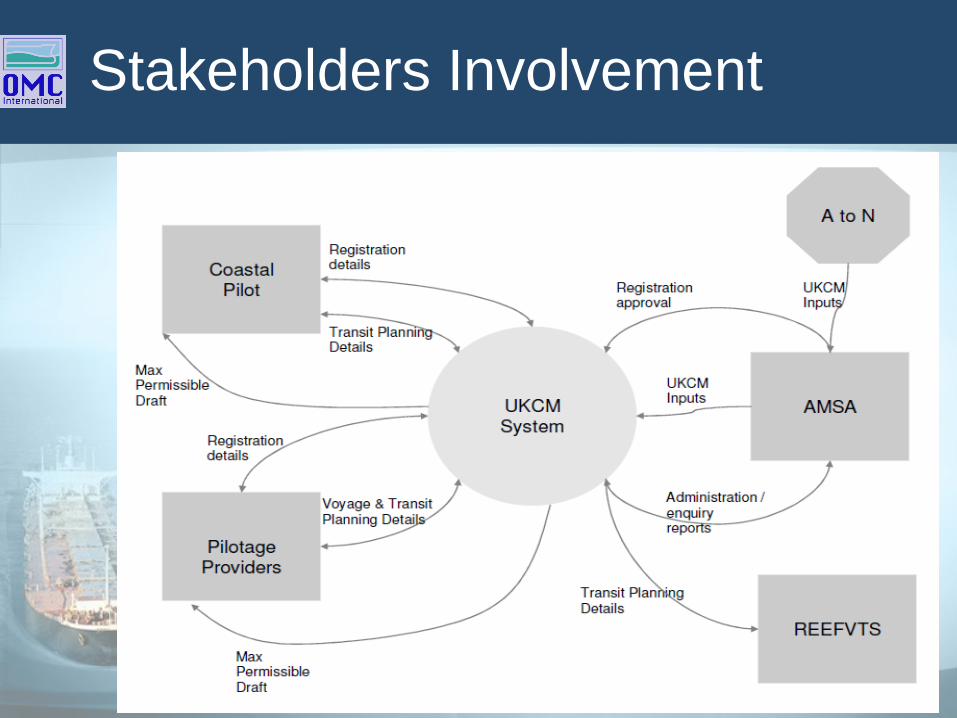
Stakeholders Involvement

Met Ocean Display
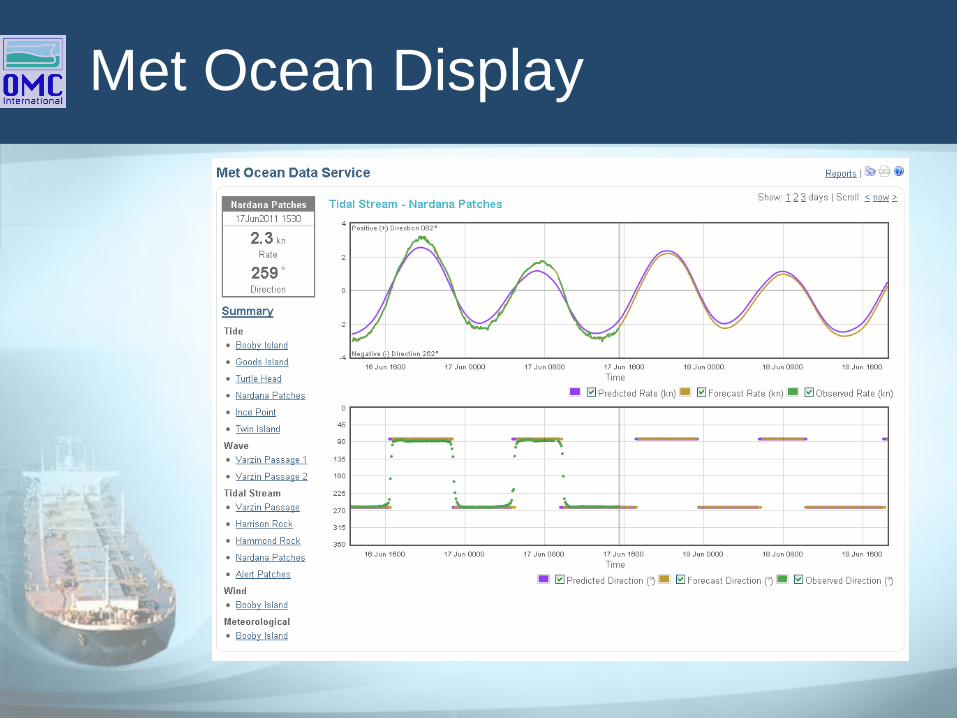
Met Ocean Display
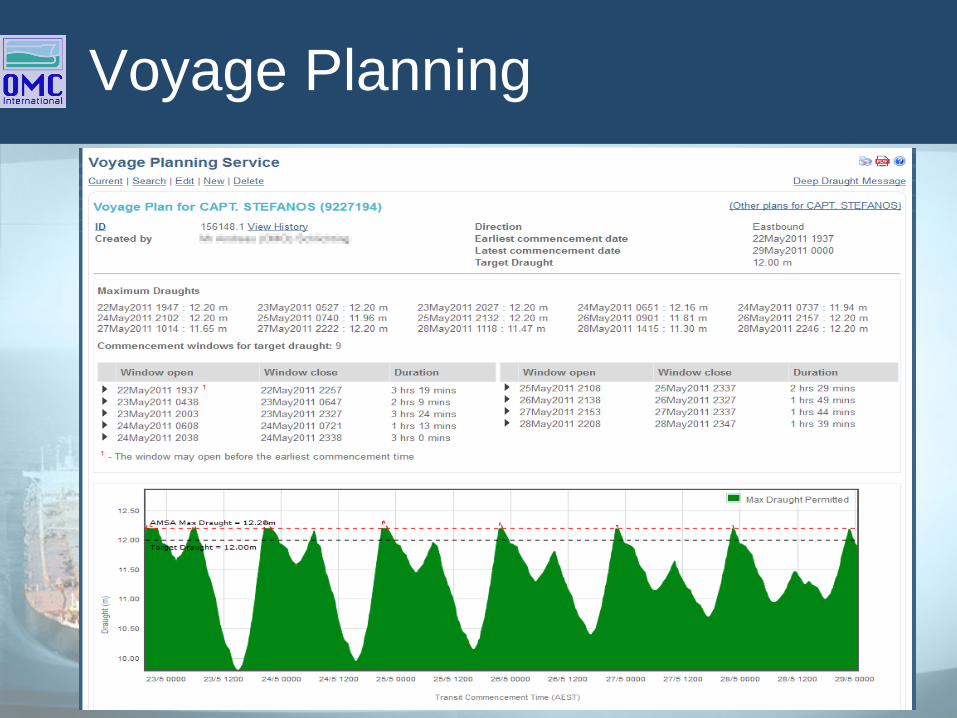
Voyage Planning

Transit Planning
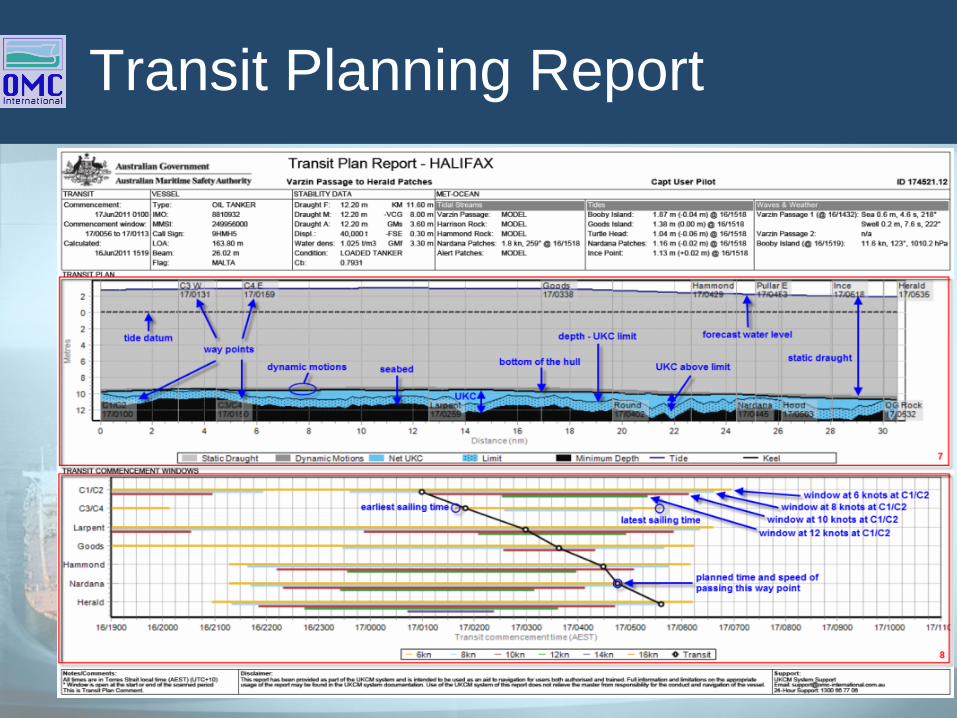
Transit Planning Report
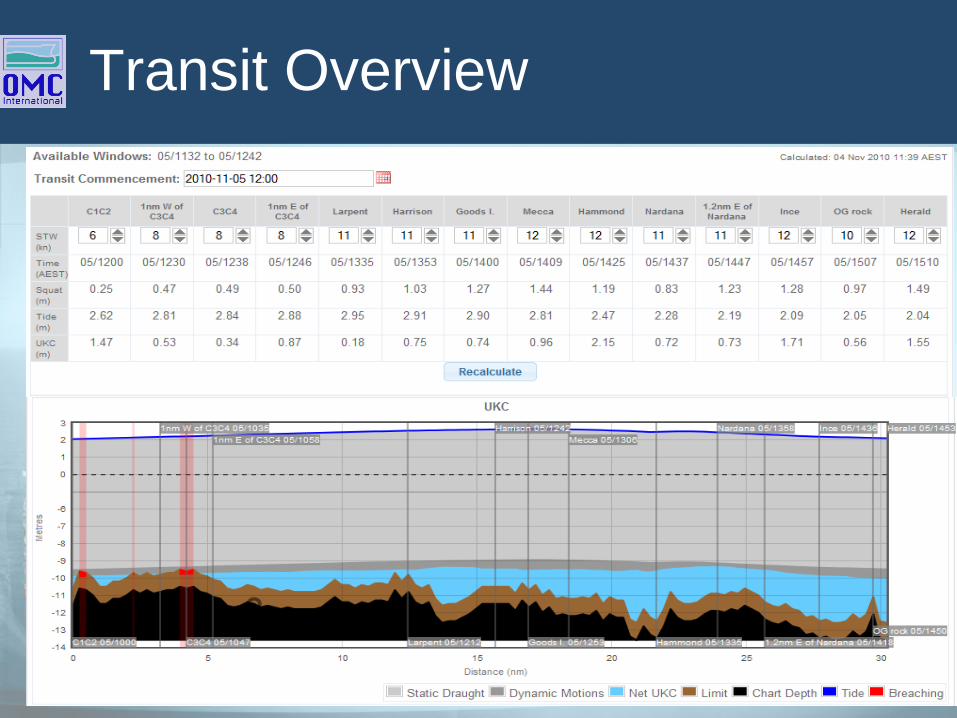
Transit Overview
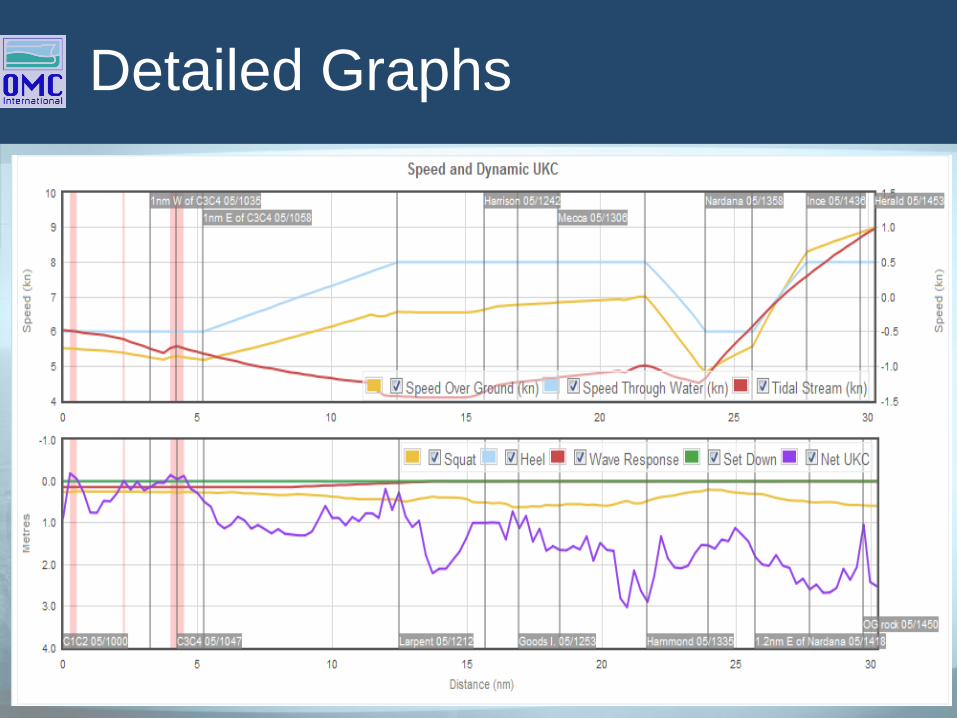
Detailed Graphs

Operating Envelopes/Gates
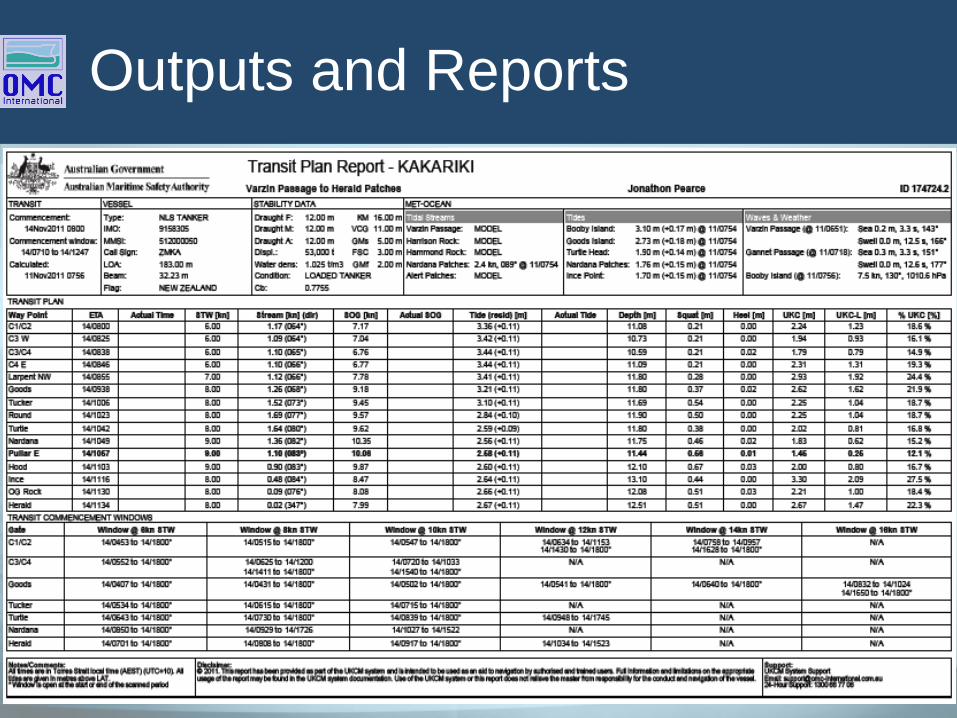
Outputs and Reports
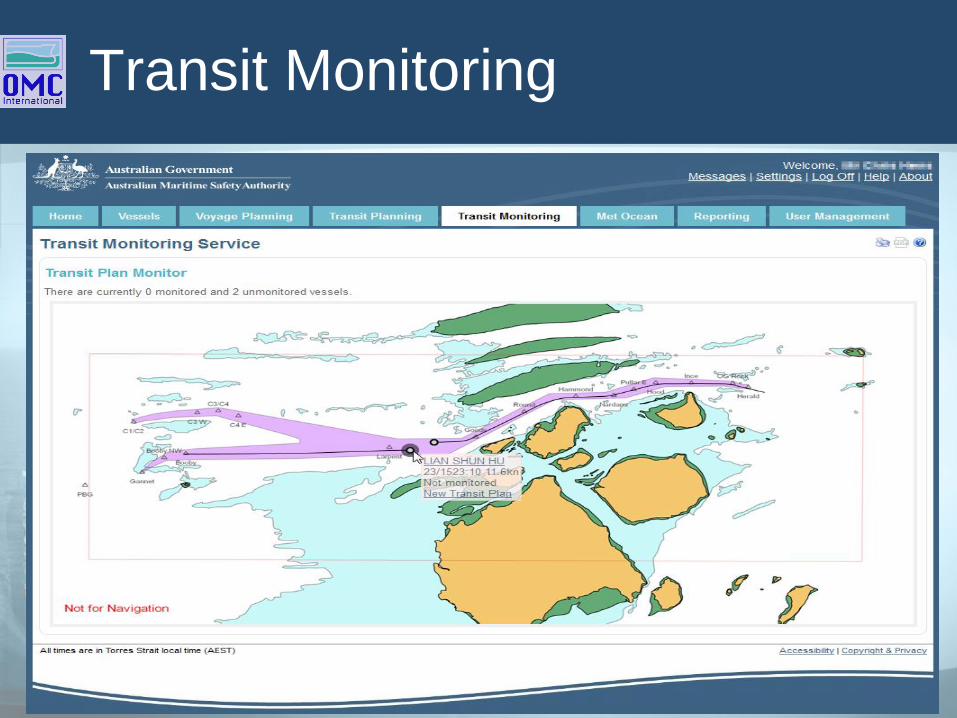
Transit Monitoring

Benefits : Pilots - Port
• Enhanced decision making
• Improved Master/Pilot Information Exchange
• Contingency planning
• Increased transit plan accuracy
• Optimised safe speed profiling
• Removes commercial pressure from the Pilot - the
hardest decision for a pilot to make is to say “NO!”
• Port:
– Improves Safety
– Increases Economic Benefits
– Greater Operating Flexibility
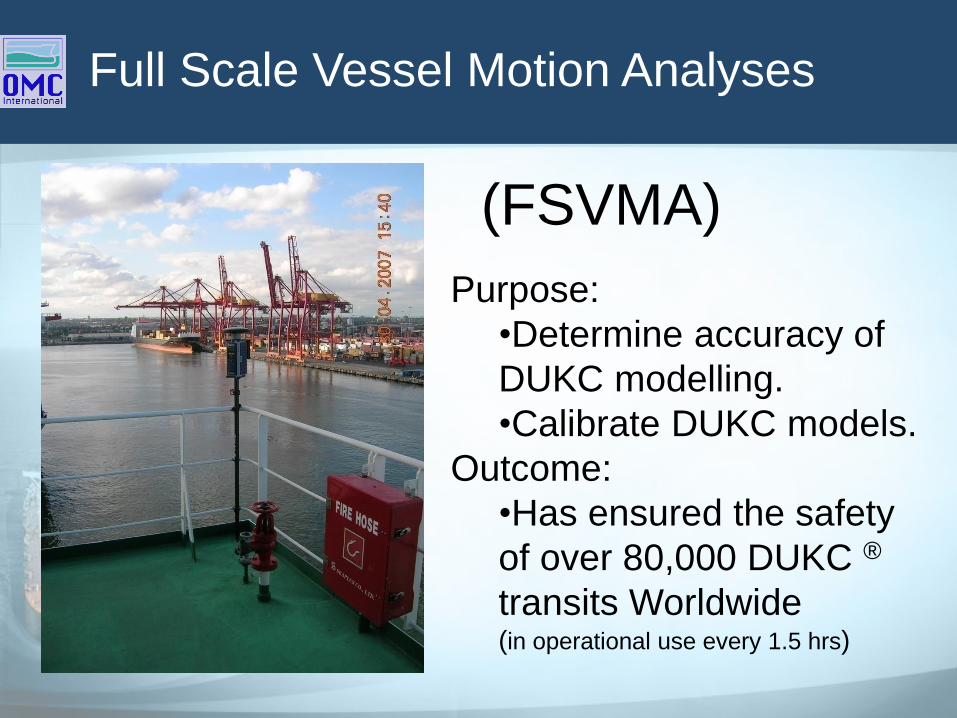
Full Scale Vessel Motion Analyses
Purpose:
•Determine accuracy of
DUKC modelling.
•Calibrate DUKC models.
Outcome:
•Has ensured the safety
of over 80,000 DUKC ®
transits Worldwide (in operational use every 1.5 hrs)
(FSVMA)
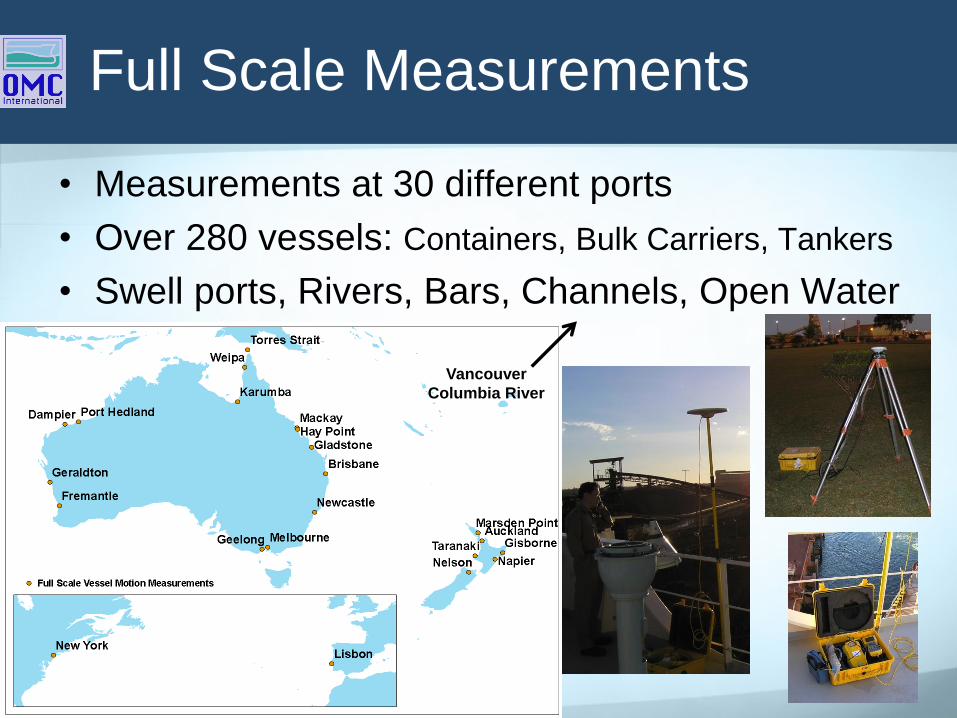
Full Scale Measurements
• Measurements at 30 different ports
• Over 280 vessels: Containers, Bulk Carriers, Tankers
• Swell ports, Rivers, Bars, Channels, Open Water
Vancouver
Columbia River
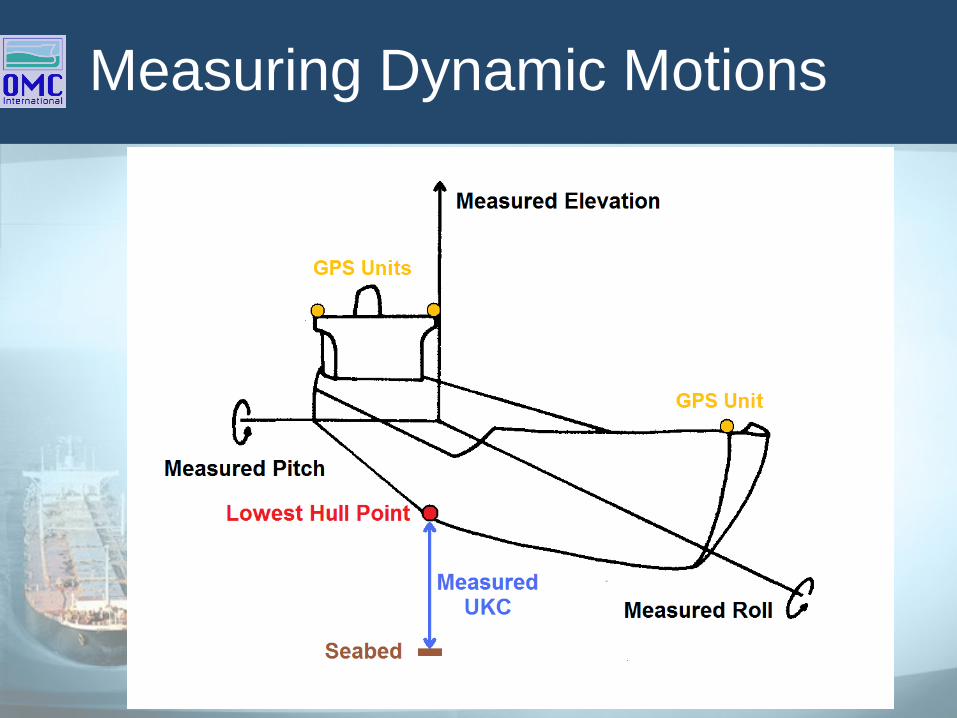
Measuring Dynamic Motions
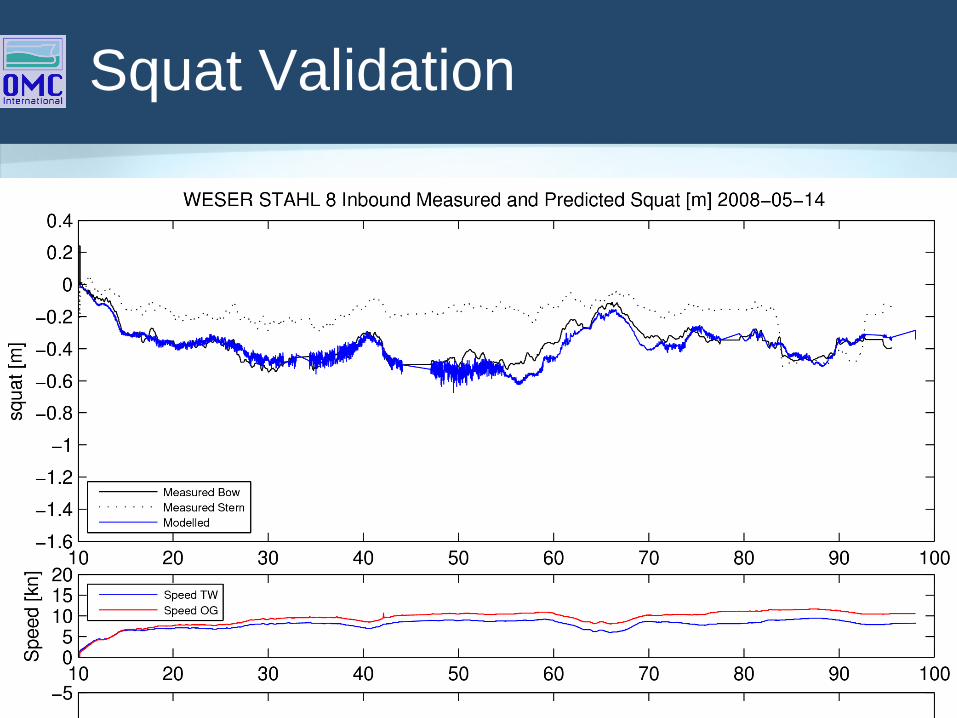
Squat Validation
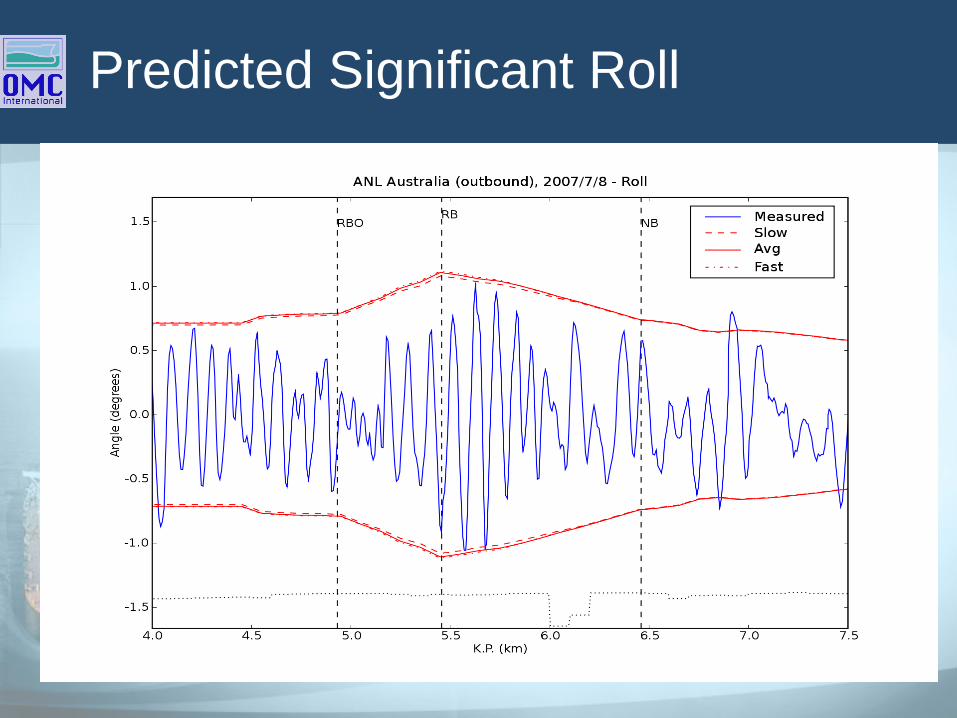
Predicted Significant Roll
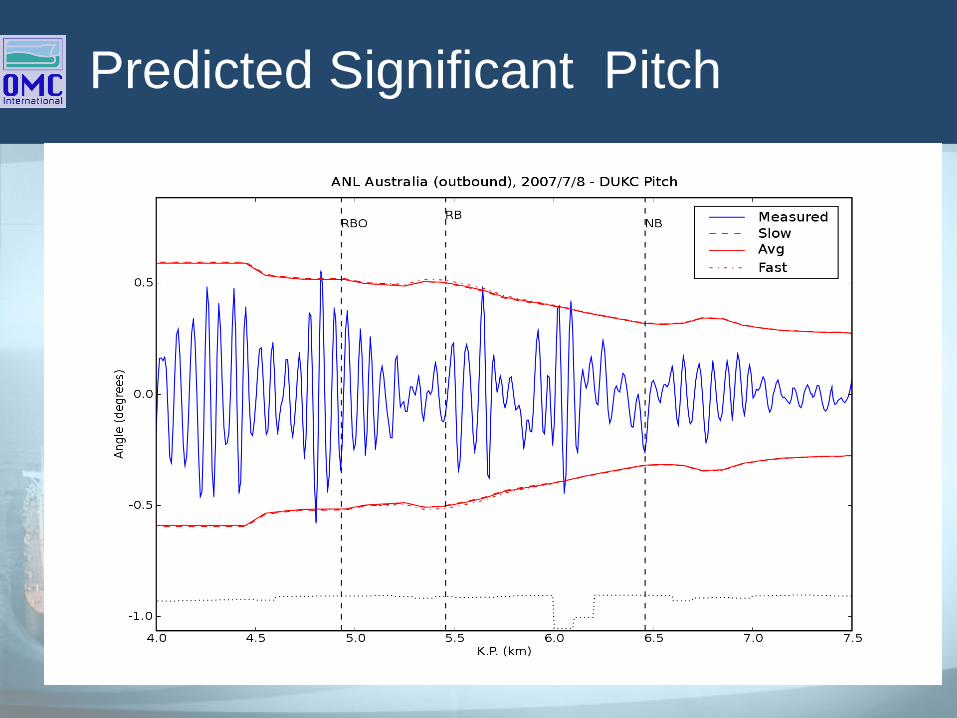
Predicted Significant Pitch
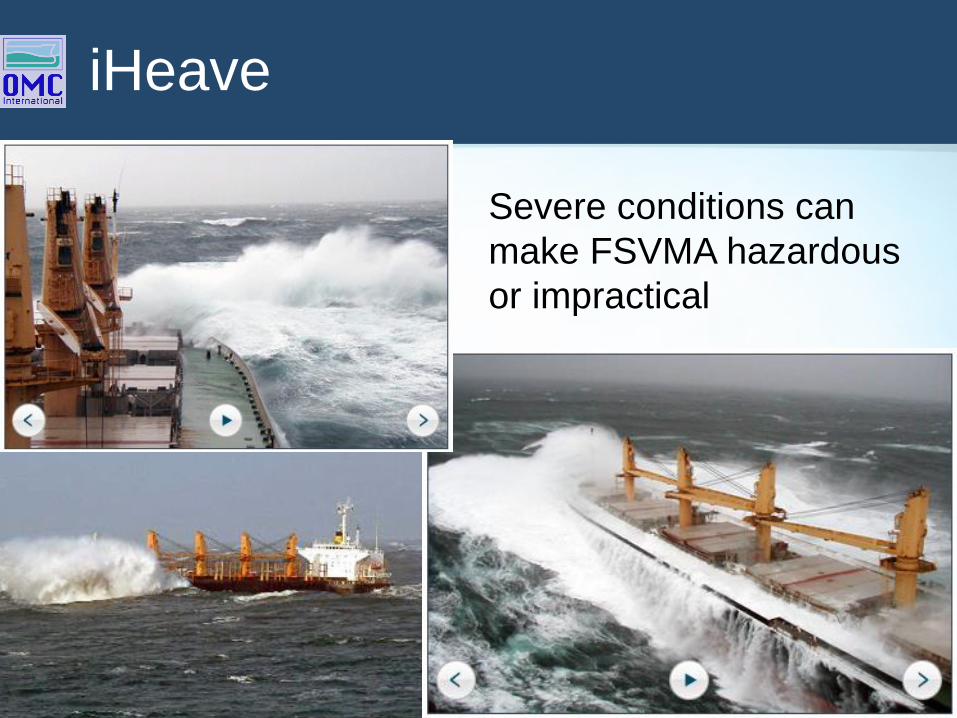
iHeave
Severe conditions can
make FSVMA hazardous
or impractical
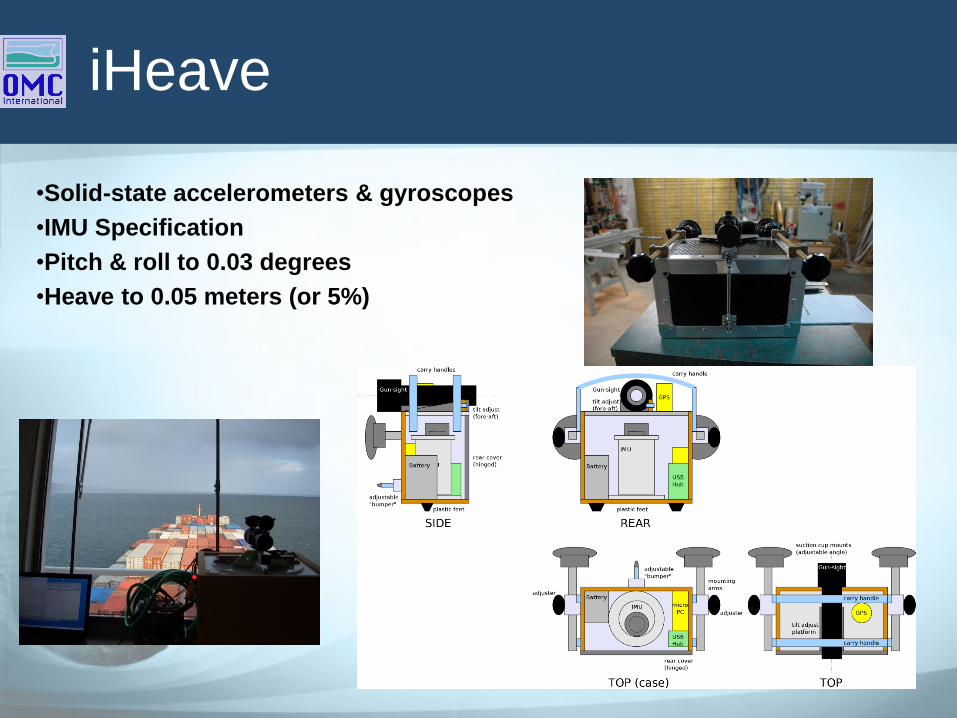
iHeave
•Solid-state accelerometers & gyroscopes
•IMU Specification
•Pitch & roll to 0.03 degrees
•Heave to 0.05 meters (or 5%)
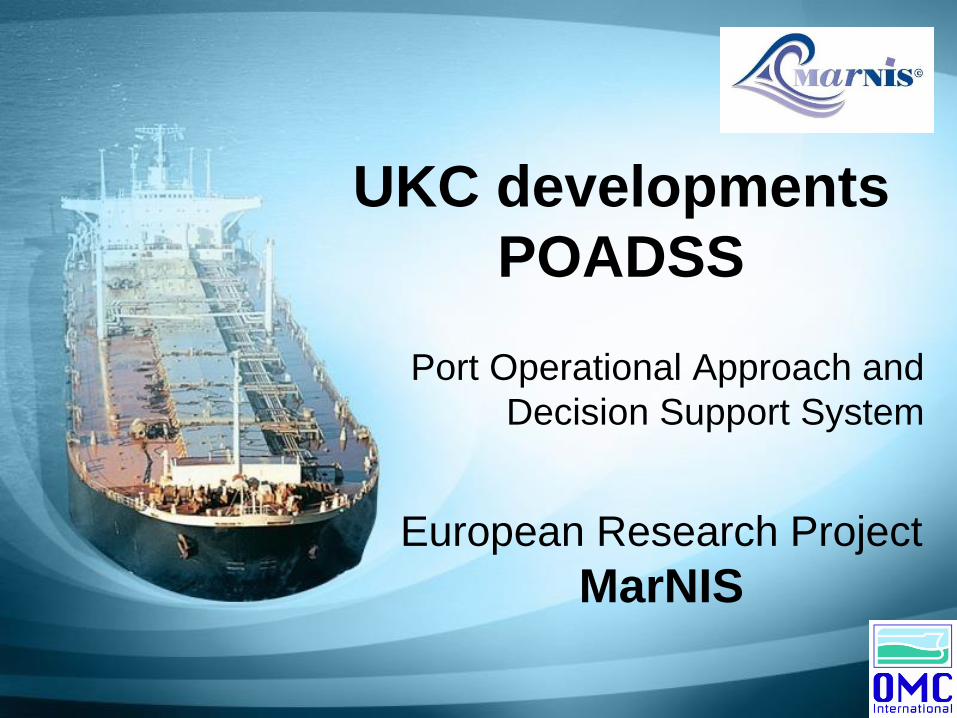
UKC developments
POADSS
Port Operational Approach and
Decision Support System
European Research Project
MarNIS
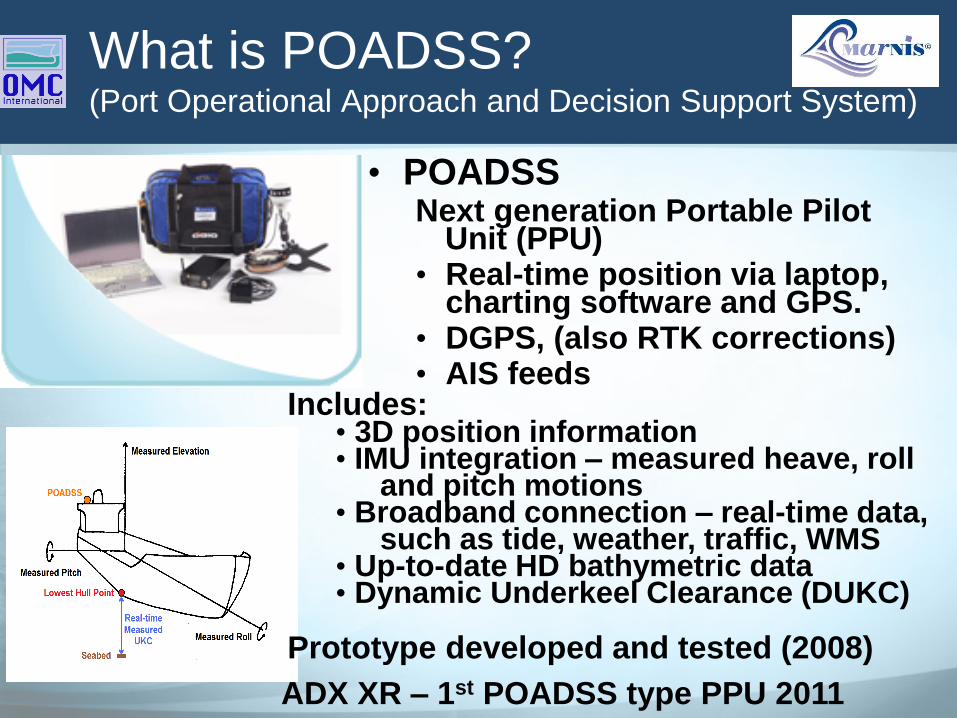
What is POADSS?(Port Operational Approach and Decision Support System)
• POADSSNext generation Portable Pilot
Unit (PPU)• Real-time position via laptop,
charting software and GPS. • DGPS, (also RTK corrections)• AIS feeds
Includes:• 3D position information• IMU integration – measured heave, roll
and pitch motions• Broadband connection – real-time data,
such as tide, weather, traffic, WMS• Up-to-date HD bathymetric data• Dynamic Underkeel Clearance (DUKC)
Prototype developed and tested (2008)
ADX XR – 1st POADSS type PPU 2011
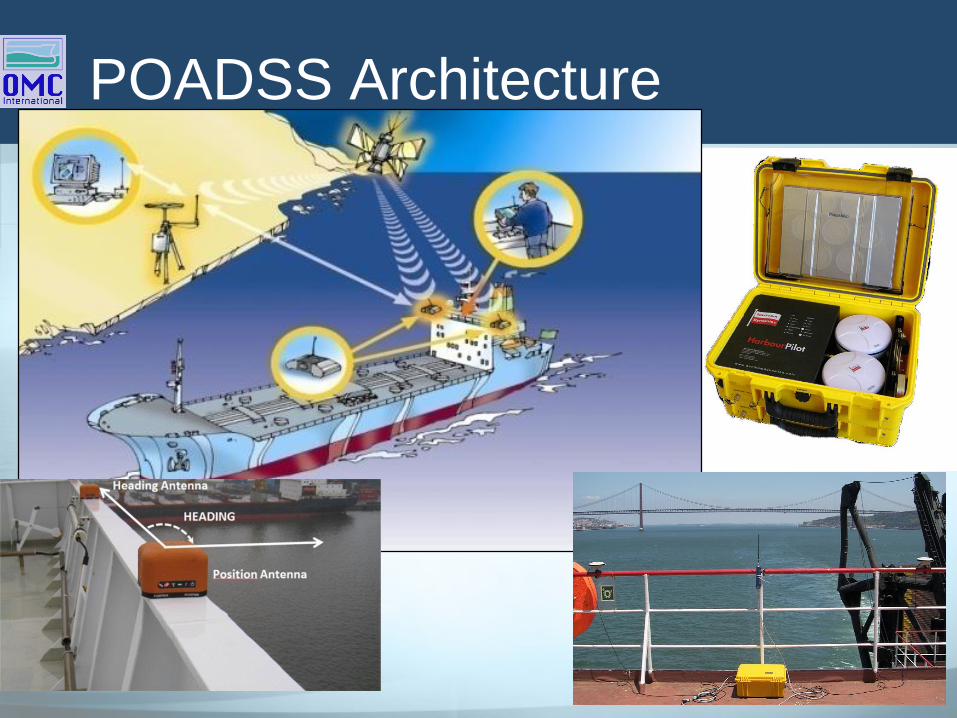
POADSS Architecture

Real-time Transit Planning
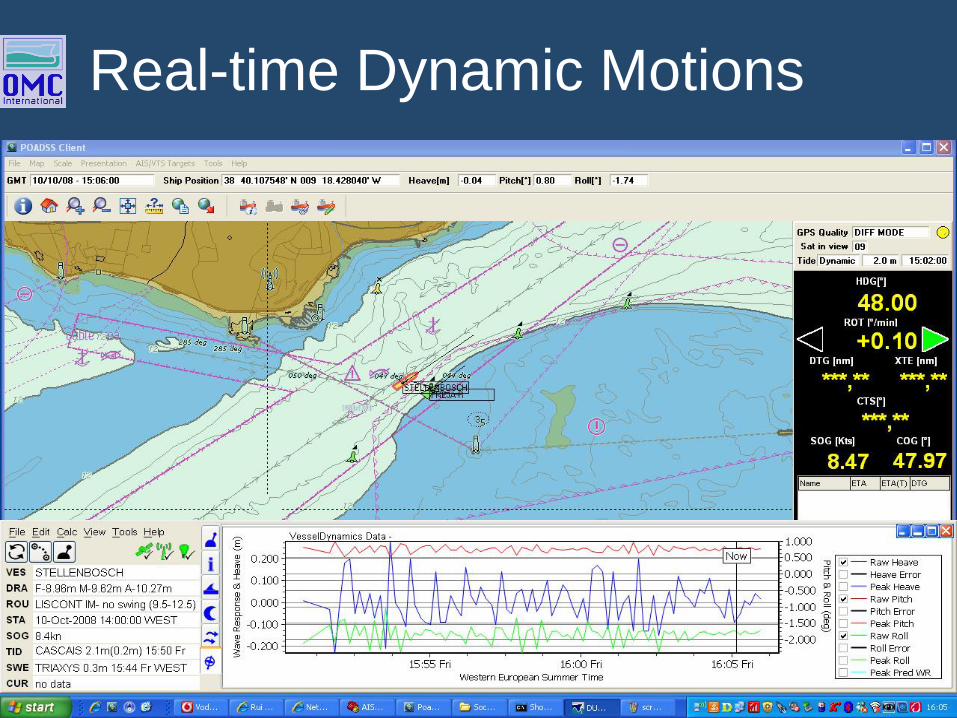
Real-time Dynamic Motions
Dynamic Tide Contours

14.7m Vessel – 12k Area 1

14.7m Vessel – 14k Area 1
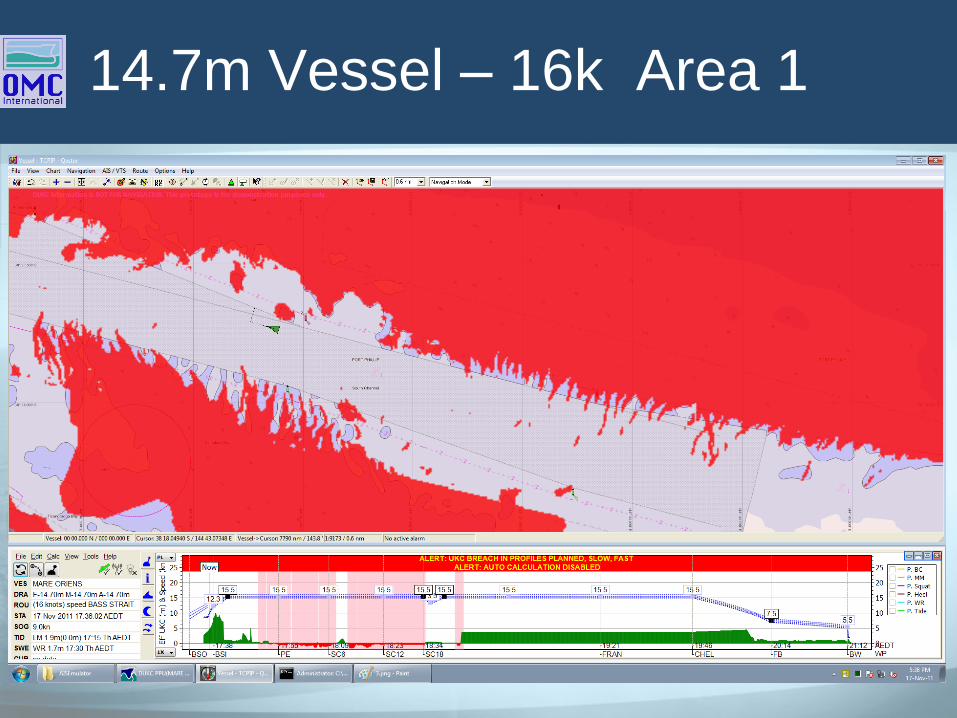
14.7m Vessel – 16k Area 1
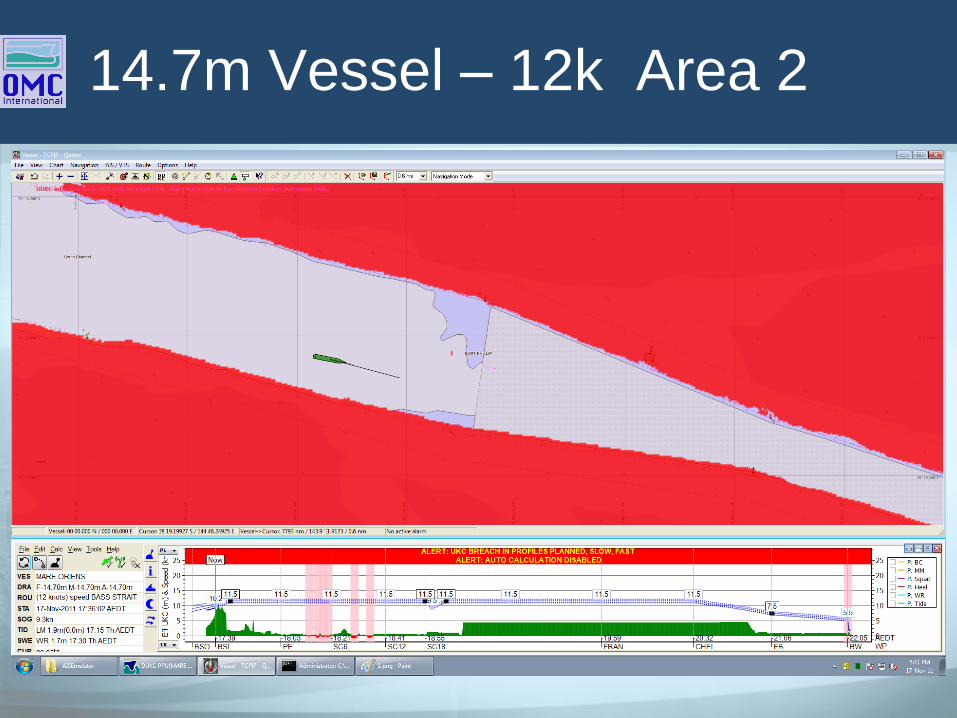
14.7m Vessel – 12k Area 2
• High waves / Low waves

14.7m Vessel – 14k Area 2
• High waves / Low waves
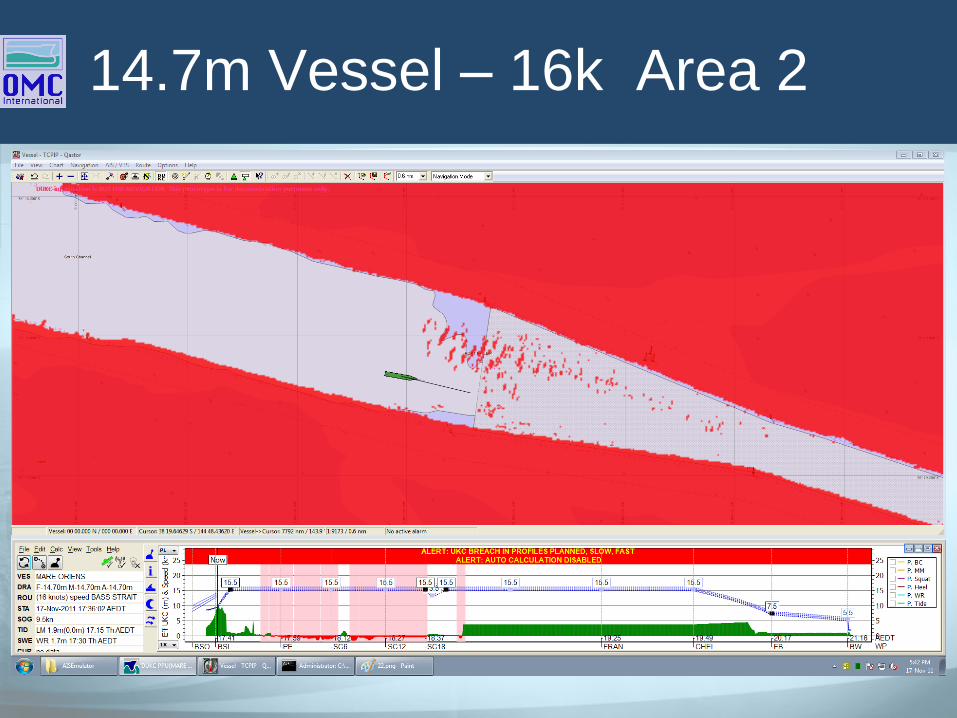
14.7m Vessel – 16k Area 2
• High waves / Low waves

What If – High Waves...
• High waves / Low waves
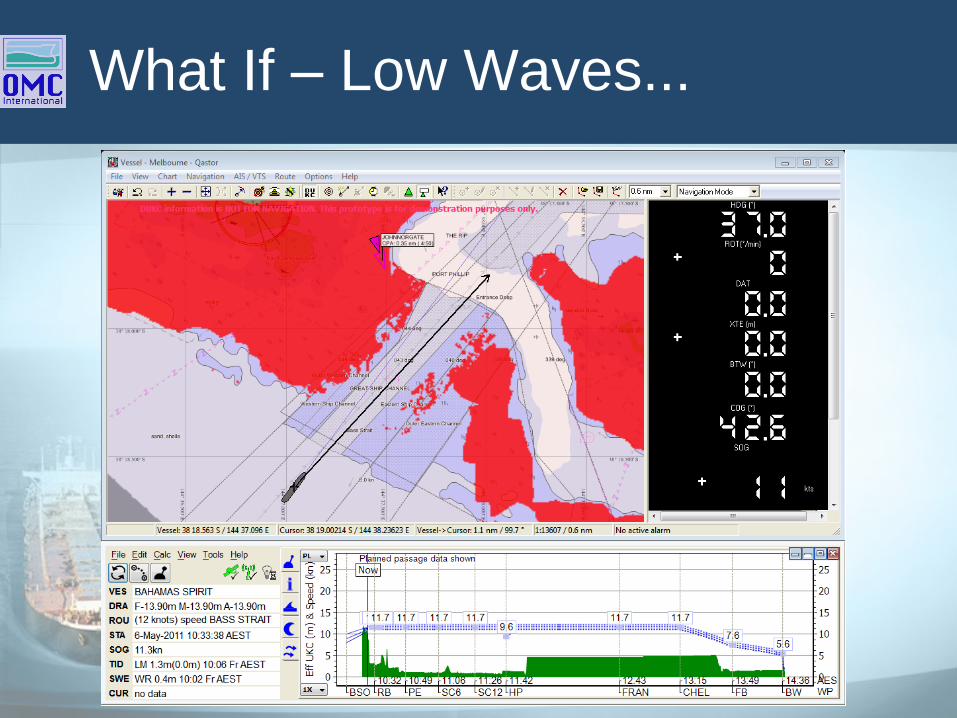
What If – Low Waves...
• High waves / Low waves
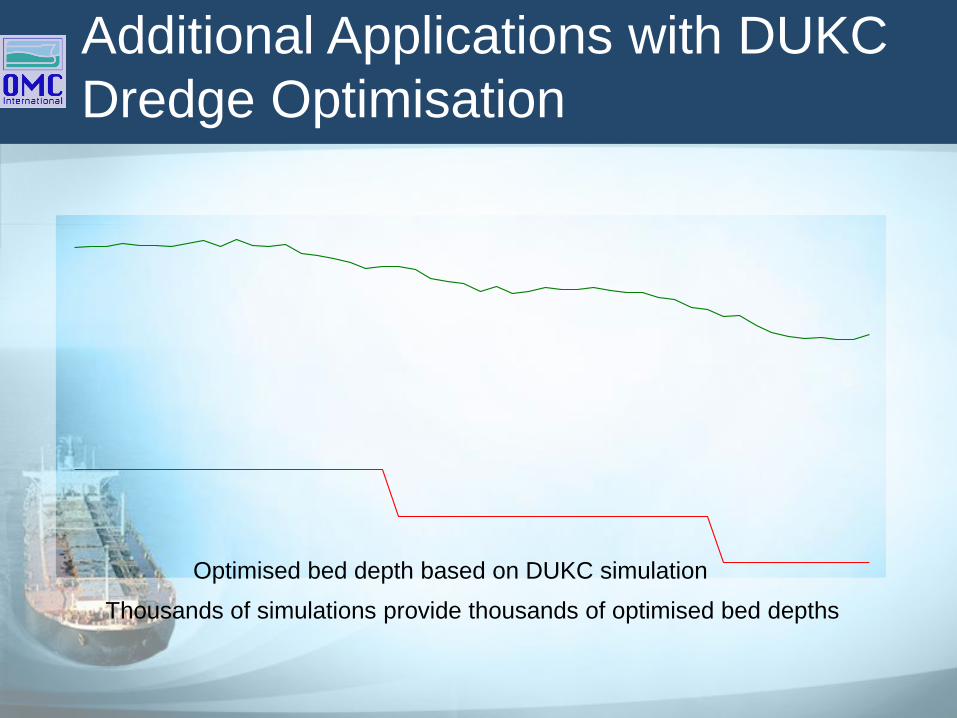
Optimised bed depth based on DUKC simulation
Thousands of simulations provide thousands of optimised bed depths
Additional Applications with DUKC
Dredge Optimisation

Different requirements result in different optimised depths.
1. Access for 14.5 metre draft tankers on 95% of high waters.
2. Access for all inbound vessels on 90% of occasions regardless of
tide.
3. Minimum requirement of 4 hour operating windows for container
vessels in winter.
VOLUME OF DREDGING SAVED

Who is OMC International?
• Inventor and sole supplier of DUKC®
• 17 years in operation with over 80,000 safe transits
• Installed at 21 Australian, NZ and EU ports
• OMC is the approved supplier to AMSA for the Torres Strait UKCM system