underground cropspdf.usaid.gov/pdf_docs/pnabd277.pdftime, fao appointed a senior staff member i. ......
TRANSCRIPT

inrock Internationalitjf £RN>tiON«riNSTIlUTE>bfl AGWCUi'TUB'OL DEVflOPSEHf-*^
Underground Crops
Long-term trends in production of roots and tubers
Douglas Horton

9
UNDERGROUND CROPSLong-term trends in production
of roots and tubers
Douglas Horton
with a note on the quality andinterpretation of African data
byPaulDorosh
1988
o
0
Winrock International

fe.- -a
I)
G
o
Copyright 1988 by Winrock International Institute for Agricultural Development Morrllton, AR 72110 USA
4Printed in the United State of America All rights reserved
ISBN 0-933595-19-0
Drawings on pages 3,4, and 7 are reproduced from Purseglove, Tropical Crops: Moncotyledons and on pages 2, 5, and 6 from Purseglove, Tropical Crops: Dicotyledons by permission of Longman Group, UK
J

.) '
LI •>->o •'
•p . •
V
,.:u ' f '
Root Crop
Accuracy of Roof Crop Statistics.
About the Tables ...........................
A Note on African Root CrQs Data
Tables
//
12
21

•\s
Preface;;
This book is the outcome of collaboration between the International Potato Center (CIP) and Winrock International, with the help from several other international agricultural centers. Douglas Horton of CIP was the principal author and supervised the compilation and organization of the data. Paul Dorosh, a post-doctoral fellow at the International Institute of Tropical Agriculture, contributed the discussion of African data. Steven Breth of Winrock International produced the book.
The tables in this publication are based on previously unpublished data from the Food and Agriculture Of ganization of the United Nations. K. Becker and F. Pariboni of FAO's Basic Data Unit generously provided the data and promptly responded to numerous questions on its sources and interpretation.
Special thanks go to several members of CIPs staff: Norma Puican, who was mainly responsible for data processing and preparation of draft tables and figures, Maria and Carmen Lozano, and Victor Suarez.
J. Lynam of CIAT and R. Opena of AVRDC commented on the proposal; and K. Becker, 3. Lynam, and R. Moreno provided valuable comments on the draft.
The author accepts responsibility for any errors and invites readers to point them out in order to improve future editions of this book. /; M ,
A grant from the Rockefeller Foundation supported the distribution of this publication to institutional libraries in developing countries.

f
This publication was prepared to improve information on root crops in developing countries. Traditionally, agricultural research and development efforts have focused on ex port crops and the major cereals. Relatively little attention has been paid to roots and tu bers. Recently, the underexploited potential of root crops has become more widely rec ognized. In many parts of the developing world, cereals do not flourish and cereal im ports drain scarce foreign exchange. A num ber of countries that once relied heavily on imported grain to meet domestic food needs are now seeking to increase food self suffi ciency in the wake of foreign exchange shortages and persistent rural poverty. Greater output of roots and tubers is a promising avenue for expanding food sup plies in many countries. Roots and tubers are productive food crops and they may also be used in manufacturing and livestock feeding. Often toot crops are important sources of rural employment, and in a surprising num ber of areas they generate much-needed cash .° C/'. income for poor farmers. For some coun- -,tries, root crop exports generate foreign ex change (Thailand's cassava exports are an example).// Growing awareness of the value, both actual and potential, of root crops is re flected in a recent study of priorities for in ternational agricultural research (Consultative Group on International Agri cultural Research, 1987) and in a number of FAO documents, most notably the reports on Africa (FAO, 1986) and Latin America (FAO, 1987) prepared by the Committee on World Food Security. In 1986, for the first time, FAO appointed a senior staff member
I .£
\\to coordinate its activities with root crop. Several developing countries have also begun to upgrade the position of root crops in their research and development planning.
Root Crop Characteristics
This publication deals with five major groups of crops: cassava (Manihot esculenta), edible aroids (principally Coiocasia esculenta andXanthosoma spp.), potatoes (Solatium tuberosum), sweet potatoes (Ipomoea batatas), and yams (Dioscorea spp.). Techni cally, the important edible product harvested from cassava and sweet potatoes is roots; from potatoes and yams, it is tubers; and from aroids (known variously as taro, tannia, and cocoyams), it is cornis and cormels. To simplify and condense the discussion in this publication, the term "root crops" is generally used to include all these crops.
This section, adapted from "Root crops in developing countries: An economic ap praisal" (Horton, Lynam, and Knipscheer, 1984), briefly describes the characteristics of the major root crops and their production systems.
CassavaCassava is unknown in a wild state and its
evolution as a species is directly linked to selection by man under cultivation. Cassava's center of origin is tropical America; the ex act time and location of domestication and
it'llthe direct ancestor are not known.Certainly by the beginning of the 19th
century cassava had been effectively dis tributed throughout the world's tropical re-

Douglas Horton
gions. Expansion of cassava production in . .-; ,the 19th century was hastened by import into
West Africa of techniques for producing gari (fermented and fried cassava mash), by the promotion of cassava as a famine reserve by colonial governments such as the Dutch in Java and the British in West Africa and southern India, and by establishment of a cassava processing and export industry in Malaya. By the 1880s, the tapioca trade was
.,., well established in Malaya and by the turn of ---,) the century, production and trade in cassava
products, particularly starch, had been started by the Dutch in Java and the French in Madagascar. Brazil was also exporting modest amounts.
Tubers of cassava (Manihot esculenta)and a young shoot with leaf. Reproduced
from Purseglove, Tropical Crops bypermission of Longman Group, UK
Because of cassava's long growth season, cultivation is limited to the tropics and sub- tropics. Cassava is nevertheless the most widely cultivated root crop in the tropics. It is grown across a broad range of agro-cli matic conditions: from sea level to almost 2,000 meters in the American tropics and in areas with as little as 500 millimeters of rainfall to areas of tropical rainforest.
One of cassava's principal characteristics is its ability to produce economic yields under relatively marginal rainfall and soil conditions. Cassava is efficient in water use and is able to withstand dry periods of up to 5 months. Also, it is adapted to low pH and high aluminum content, which are common in tropical soils. Cassava forms an effective mycorrhiza association and is efficient in phosphorus uptake and utilization.
Important characteristics that influence the role of cassava within farming systems are high carbohydrate yields per unit of land and labor, adaptation to poor soils and water stress, compatibility with a variety of crops in association, an indeterminate harvest period, the bulkiness of the roots, their 60 to 70 per cent water content, and their extreme per ishability after harvest.
Cassava is well suited to small farm pro duction systems. In the Americas, where there is a great disparity in farm size, 75 per cent of cassava farmers operate farms of 20 : , hectares or less. These are small farms by Latin American standards, particularly in the marginal, lowland areas where most cassava is produced. In Asia cassava is cultivated in populous areas such as Java in Indonesia and Kcrala in India, where farms rarely exceed 2 hectares in size. Cassava is exclusively an upland crop in these areas and is usually grown where soil is poor and rainfall is lim iting. In Thailand 75 percent of cassava growers have under 6 hectares of farmland. Most cassava is produced in the northeast on

/Underground Crops
relatively marginal land that has few other cropping alternatives. In Africa the role of cassava is defined not so much by farm size as by population pressure and the length of the fallowing period in shifting cultivation systems. Cassava is a principal crop where fallows have become particularly short and soil fertility conditions are poor.
Cassava is not only produced under rela tively marginal agricultural conditions, few purchased inputs are used. Because cassava is vegetatively propagated through stem cut tings, seed costs are nil. Although cassava can be attacked by diseases and pests, the varieties that most farmers plant are either resistant to the dominant diseases and pests or they can yield well under attack. Many traditional varieties are very leafy, which ap pears to afford tolerance to insects and dis eases that attack the leaves. Few growers ap ply fungicides, insecticides, or herbicides. Moreover, fertilizer is seldom used in cas sava production systems. In Brazil, for ex ample, less than 9 percent of the cassava area is fertilized. Even in Java, where land use is intensive and fertilizer prices are heavily subsidized, fertilizer use for cassava averages only 8 kg/ha compared with about 180 kg/ha for all crops.
Outside of Asia, cassava is grown in rota tions that include fallow. In Latin America, the length of fallow tends to be shorter than in Africa, where bush fallow is common place.
Cassava has been widely characterized as a subsistence crop. This reputation traces to the colonial period when cassava was often cultivated as a famine reserve. The locus of cassava production on small farms has tended to support this view. However, cas sava today is very much a commercial crop. In the Americas perhaps 70 percent of pro duction is marketed. This is true in Asia, too, even in countries like India and Indonesia
'' A young tannia plant (Xanthosoma sagittifolium), base of the plant with cornsand cormels, andacomtel. Reproduced
from Purseglove, Tropical Crops by permission of Longman Croup, UK
where most cassava is eaten (rather than fed to livestock). Even in Africa, where most people live in rural areas and nearly all cas sava is used as a food, an extensive trade in gari exists in Nigeria and in kokonte (dried cassava) in Ghana, Thus, part of the reason cassava is so widely produced is not because it is the paramount subsistence crop, but be cause it is a cash crop with an existing mar ket. Future development of cassava produc tion will require strengthening of the market for the crop.
Edible aroidsThe two main genera of edible aroids are
Colocasia (taro) and Xanthosoma (tannia). Both taro and tannia are often referred to as
\

Douglas Norton
A young iaro (Colocasia esculents) plantand a com. Reproduced from Pitrseglove,Tropical Crops by permission of Longman
Group, UK
cocoyams. Taro originated in Southeast Asia and spread across Africa to the Americas. In Nigeria it is called "old" cocoyam to distin guish it from the "new" cocoyam, or tannia, which originated in South or Central Amer ica and reached West Africa later. It is be lieved that tannia is rapidly replacing taro in West Africa. In Nigeria, the largest producer of this crop, cocoyams are appreciated for their easy digestibility. Farmers distinguish "soft" and "hard" varieties. The soft ones are often used for pounding in a yam-cocoyam mixture.
Cocoyams arc typically grown as sec ondary crops in Nigeria, ranking far behind yams and cassava in production and con sumption. However, in parts of Ghana,
Cameroon, and Gabon, cocoyams are a sta ple food. The usefulness of cocoyams as an intercrop between tree crops is one reason for their popularity in those areas.
Taro is adapted to wet soils but is gener ally grown on well-drained, relatively fertile upland soils. It is often cultivated in associa tion with tree crops, especially cocoa.
Although most farmers use a rotation, edible aroids are sometimes grown for as much as 6 years in succession. They are often planted in clusters between scattered trees. Spacings within clusters differ from those between clusters. Hence, in comparing yields, it is important to know if the sample is based on a small area containing one cluster, on part of one cluster, or on a large area containing several clusters. Yield esti mates will be substantially lower in the last case than in the first two.
For edible aroids, as for most foodcrops - in tropical Africa, labor is the main produc tion input. Although cash and good quality land are scarce, farmers consider the short age of labor to be their main production constraint.
Farmers use conns and cormels as plant ing material. Little is known about the re production factor for the different aroids, but it is believed to be much higher than that for yams (that is, a smaller share of the har vest of edible aroids has to be reserved as planting material). Planting material is stored in shady places and is usually covered with palm leaves. Pre-sprouted cormels are then selected for planting on low mounds or ridges, or on the flat.
PotatoesThe potato is of highland origin. Domes
ticated in the Andes of South America, it be came a major food crop near its origin and in similar mountainous areas elsewhere (e.g., the Himalayas and cool highland areas of
Underground Crops
Central and Eastern Africa). Although it reached Euro^ in the early 16th century, the potato remained as a botanical curiosity for two centuries. Gradually the potato be came an important food of peasants and low- income urban wage earners across Europe, and in North America. Most research on the potato has been done in Europe and North America, and most varieties now grown in the tropics (outside the Andes) originated in temperate areas.
In highland farming systems, the potato is generally grown by small farmers cultivating no more than 1 to 2 hectares in a number of distinct parcels of land. The crop is typically rainfed and subject to many hazards, in cluding droughts, excessive rain, frost, hail, or typhoons, depending upon the location. Highland farmers generally retain a substan tial part of their harvest to use as seed in the next season. In areas where potatoes are rel atively expensive (Central America and Southeast Asia), farmers usually consume few of their own potatoes. Instead they sell the harvest and purchase cheaper foods with the proceeds. \
In recent years, potato production has spread from its traditional mountainous en vironment into warmer, drier areas. Typical of such nontraditional growing areas are Peru's coastal valleys, the plains of India, Bangladesh, and Pakistan, and the irrigated oases of North Africa.
Potatoes arc becoming an attractive win ter crop in many arid, irrigated areas, where they are grown on relatively large commer cial farms. Since harvest occurs at the begin ning of summer, storage and marketing pre sent severe problems for this perishable crop. In these areas, refrigerated storage is generally required both for seed and table potatoes.
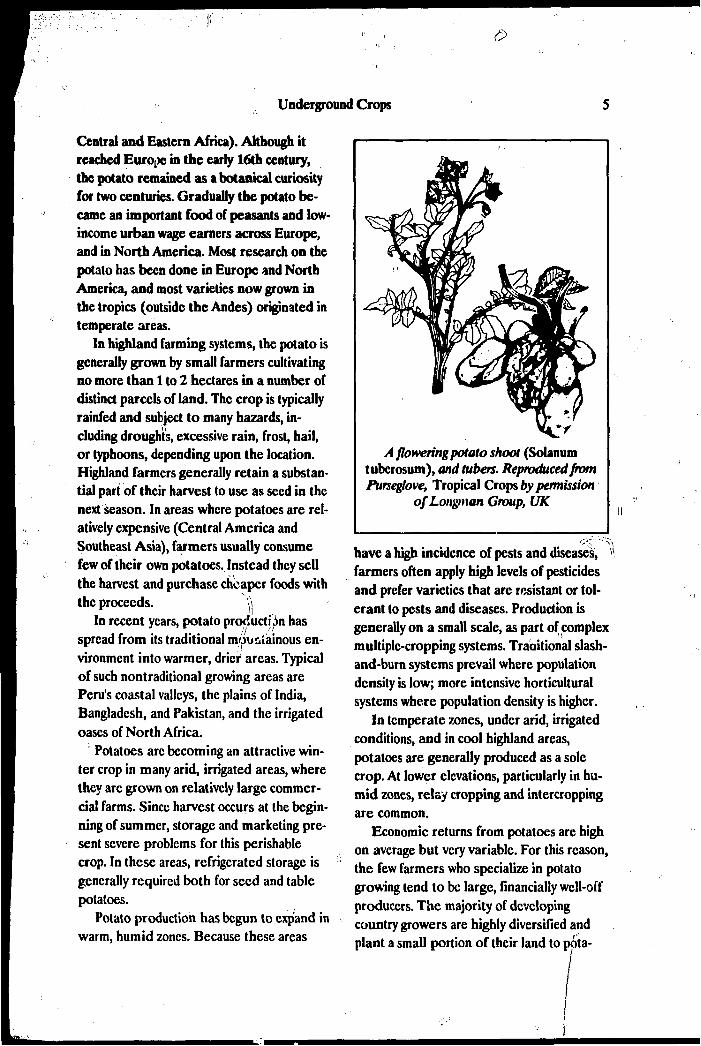
Potato production has begun to expand in warm, humid zones. Because these areas
A flowering potato shoot (Solanumtuberosum), and tubers. Reproduced fromPurseglove, Tropical Crops by permission
o/Longman Group, UK
have a high incidence of pests and diseases, V farmers often apply high levels of pesticides and prefer varieties that are resistant or tol erant to pests and diseases. Production is generally on a small scale, as part of complex multiple-cropping systems. Traditional slash- and-burn systems prevail where population density is low; more intensive horticultural systems where population density is higher.
In temperate zones, under arid, irrigated conditions, and in cool highland areas, potatoes are generally produced as a sole crop. At lower elevations, particularly in hu mid zones, relay cropping and intercropping are common.
Economic returns from potatoes are high on average but very variable. For this reason, the few farmers who specialize in potato growing tend to be large, financially well-off producers. The majority of developing country growers are highly diversified and plant a small portion of their land to pota-
Douglas Horton
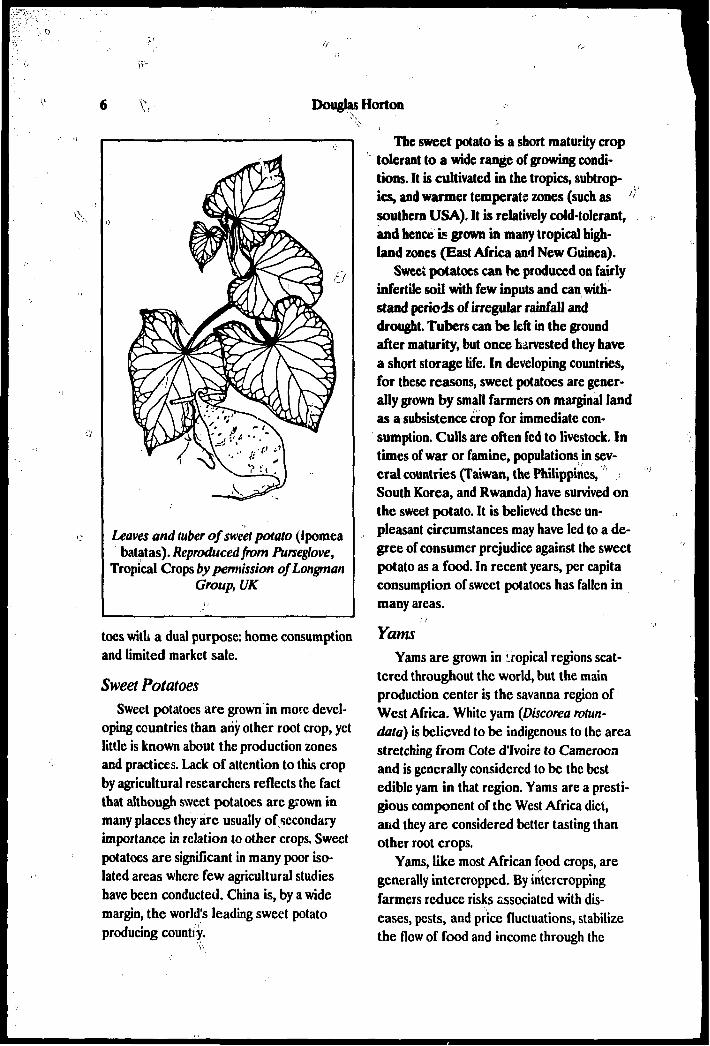
Leaves and tuber of sweet potato (Ipomeabatatas). Reproduced from Purseglove,
Tropical Crops by permission of LongmanGroup, UK
toes with a dual purpose: home consumption and limited market sale.
Sweet PotatoesSweet potatoes are grown in more devel
oping countries than any other root crop, yet little is known about the production zones and practices. Lack of attention to this crop by agricultural researchers reflects the fact that although sweet potatoes are grown in many places they are usually of secondary importance in relation to other crops. Sweet potatoes are significant in many poor iso lated areas where few agricultural studies have been conducted. China is, by a wide margin, the world's leading sweet potato producing countiy.
The sweet potato is a short maturity crop tolerant to a wide range of growing condi tions. It is cultivated in the tropics, subtrop- ics, and warmer temperate zones (such as '>' southern USA). It is relatively cold-tolerant, and hence is grown in many tropical high land zones (East Africa and New Guinea).
Sweet potatoes can be produced on fairly infertile soil with few inputs and can with stand periods of irregular rainfall and drought. Tubers can be left in the ground after maturity, but once harvested they have a short storage life. In developing countries, for these reasons, sweet potatoes are gener ally grown by small farmers on marginal land as a subsistence crop for immediate con sumption. Culls are often fed to livestock. In times of war or famine, populations in sev eral countries (Taiwan, the Philippines, • South Korea, and Rwanda) have survived on the sweet potato. It is believed these un pleasant circumstances may have led to a de gree of consumer prejudice against the sweet potato as a food. In recent years, per capita consumption of sweet potatoes has fallen in many areas.
YamsYams are grown in : ropical regions scat
tered throughout the world, but the main production center is the savanna region of West Africa. White yam (Discorea rotun- data) is believed to be indigenous to the area stretching from Cote d'lvoire to Cameroon and is generally considered to be the best edible yam in that region. Yams are a presti gious component of the West Africa diet, and they are considered better tasting than other root crops.
Yams, like most African food crops, are generally intercropped. By intercropping farmers reduce risks associated with dis eases, pests, and price fluctuations, stabilize the flow of food and income through the

Underground Crops
whole year, and intensify land use. Because yams are generally intercropped, yield fig ures can be misleading unless they are pre sented with the yield of the intercrops (which is seldom done).
African production of yams, as well as cassava, cocoyams, and sweet potatoes, is concentrated in areas within 15 degrees of the equator. In this zone, about 40 percent of the daily energy intake is derived from root crops (22% from cassava, 10% from yams, 4% from edible aroids, and 2% from sweet potatoes). The principal producing and con suming country for most root crops is Nige ria, which also accounts for more than 50 percent of the area's population in this zone.
ComparisonsPotatoes have a shorter vegetative period
than most other root crops, and they do best under cool temperatures (Table A). Potatoes can be grown in areas with high daytime temperatures, but do not tubcrizc well if nighttime temperatures are above 20°C. For economic yields, potatoes require relatively high inputs of fertilizer and organic matter. They do poorly in waterlogged soils. The op timal rainfall for potato production is lower than that for other root crops, but potatoes require regular watering and are highly sus ceptible to drought. Potato tubers can be left '•- in the ground for short periods after matu-
" rity. Harvested tubers can be stored for long periods if they are free of pests and disease and if low temperatures and high humidity are maintained.
Other root crops have longer and more variable growing periods; cassava, the ex treme case, requires 8 to 24 months, de pending on temperature and soil fertility. Other root crops also do better under higher temperatures. For yams, the extreme, the optimal temperature is 30°C. Sweet potatoes and cassava, though responsive to fertiliza
tion, can produce economic yields on poor, unfertilized soils ^th little organic matter. Their roots cannot be stored for longer than a few days after harvest, but they can be left unharvested for long periods. Both these crops are highly drought resistant.
!n contrast to cassava and sweet potatoes, yams and edible aroids require good soils and adequate moisture. While neither yams nor tannia do well in swampy areas, taro can be grown in waterlogged soils. Both yams and edible aroids can be left on the plant after maturity and harvested as needed. If care is taken to avoid damaging the tubers, conns, and cormels during harvesting and handling, they store well.
A portion of a shoot of the greater yam(Dioscorea alata) with male infloresences,and a tuber. Reproduced from Purseglove,Tropical Crops by permission ofLongrnan
Croup, UK

Douglas Horton
O
TABLEAComparative root crop characteristics.
CharacteristicSweet
Cassava Potato potato Tannia Taro Yam
Growth period (months)Rant annual or perennialOptimal rainfall jcm)Optimal temp. fC)Drought resistantOptimal pH n :/.Fertility requirementOrganic matter requirementCan be grown on swampy,waterlogged soil?Planting material
Period crop can be storedin groundPost-harvest storage life c,
Si:x,.Source: Derived from Kay, D.E.
9-24per.
100-15025-29yesWlowlow
noStem
longshort
Root crops.
3-7ann.50-7515-18
no5.5-6.0highhigh
noTuberscuttings
shortlong
3-8per.
: " 75-100> 24yes
5.6-6.6lowlewt\no
Vinecuttings
longshort
9-12per.
140-20013-29no
5.5-6.5highhigh
noCorms/cormels
longlong ,
6-18per.250
21-27no
5.5-6.5highhigh
yes
8-11ann.11530yesNA
highhigh
noCorms/ Tuberscormels
<•-•moderatevariable
longlong
(London: Tropical Products Institute, 1973).NA = Not available.
Root crops as a group are often thought • of as "inferior" foods or "starchy staples" that provide low-cost energy but little else to the human diet. This generalization is unwar ranted for two reason: it does not apply to all root crops, and it does not apply to any sin gle root crop in all countries.
Nutritional composition varies greatly among the root crops (Table B). For ev am ple, cooked potatoes, yams, and taro have about 2 percent protein, but cassava has only about 1 percent protein. Potatoes, yams, and taro are rich in protein relative to some ce reals. Their protein-to-calorie ratios equal or exceed those of maize grits and rice.
Root crops also contribute significant amounts of essential dietary vitamins and minerals. Notably, cassava, potatoes, and sweet potatoes provide ascorbic acid, which the cereals are deficient in.
Contrary to conventional wisdom, root crops are not always cheap. Prices vary among the crops and regions. In most devel oping regions, yams, potatoes, and edible aroids are costly sources of energy relative to cereals, sweet potatoes, and cassava (Table C). However, in some places, particularly in large cities, perishability and high marketing costs make cassava expensive. In these areas, cassava my be consumed by high-income households as a luxury vegetable.
Root crops are generally considered to be of minor economic importance. At the average farm-gate prices prevailing in 1977, however, potatoes, sweet potatoes, and cassava are among the six most valuable food crops grown in developing nations (Taole C). Yams and edible aroids rank twelfth and nineteenth.

TABLES -Nutritional composition of a hundred-gram edible portion of various foods.
=
WaterFood*
Maize (grits)PotatoPlaintainTaro (raw)Yam (raw)RiceSpaghettiSweet potatoCommon beanCassavaWhite bread (fresh)
(%)
8780807374737271696836
Proteinto)
1.22.11.31.92.12.03.4
Foodenergy(kcal)
51767798
101109111
1.7-^114
^0.98.7
— 118124269
Protein- calorieratio
to/ioookcal)
2427171921183115667
32
Fatto)
0.10.10.10.20.20.10.40.40.60.13.2
Ash(mg)
0.60.90.71.21.01.11.21.01.40.61.9
CA>,(mgr"
17...
, 28° 20
10
83250...
70
P(mg)
1053...
6169285047
148...
87
Fe(mg)
0.10.6
...
1.00.60.20.40.72.7
...0.7
Na(mg)
2053...
7...
3741
107
...
507
K(mg)
11407
...
514600
2861
243416
...
85
Thia-mine(mg)
0.020.09
...
0.130.1
0.020.01O.O90.14
...0.09
Ribo-flavin(mg)
0.010.04
*..
0.040.040.010.010.060.07
...0.08
Niacin(mg)
0.21.5
1.10.50.40.30.6
.0.7...
1.2
Ascorbicacid(mg)
016...
4900
170
26trace
Boiled unless otherwise indicated. Edible portions of potatoes and other root crops and plaintains do not include peels. Dashes denote lack of reliable data.Sources: Composition of foods (Washington D.C.: U.S. Department of Agriculture, 1975); W-T. Wu-Leung, F. Busson, and C. Jardin. Food composition table for use in Africa (Bethesda, MD: U.S. Department of Health, Education, and Welfare, Public Health Service, 1968).
\

10 Douglas Horton
TABLEC QProduction and value of major food crops in developing countries, 1981/83.
Fresh Dry Edible wt matter energy
(million (million (trillion Commodity tons) tons) kcal)
Rice, paddyWheatMaize : ;:PotatoSweet potatoCassavaSoybeanSorghumGroundnut in shellBananaTomatoYamMilletBeans, dryBarleyCabbageChickpeaBroadbeen, dryCocoyamLentils
Sources: FAO Production
40418015682
107127324718402224271221136451
Yearbook
356157134
17325128421713
16
241019
15311
1983
982454476
5199 ,;;;
109 "127;1497434
•' 4
21844052
22212
-:• ' 44
(Rome: FAO,
Edible protein (million tons)
18.118.1
o 12.21.4
,;>' 1.5'••0.5!:10.8*4.93.40.30.20.4
1 2.52.61.26.11.20.90.10.3
Production Avg value price (US$ (US$/t)
millions)
68.726.618.511.79.58.96.55.85.34.24.23.93.93.43.12.31.30.90.60.4
1984): Composition
1701481191428970
207123297 (N107 ~195163144288145178211245123341
of foods(Washington, D.C.: U.S. Department of Agriculture, 1975); FAO estimates of farmgate price (unpublished). Production estimates are 1981/83 averages; price estimates are for 1977. ':
Accuracy of Root Crop Statistics
As various organizations have begun to look more closely at root crops, the inade quacy of published statistics on root crop production and use has become apparent. People seeking internationally comparable data usually turn to FAO publications: the production yearbooks, trade yearbooks, and food balance sheets. These are useful ior inter-country comparisons at a given point in
time, but they arc; not appropriate sources of data for time series analysis. The reason is that FAO continually revises and corrects its estimates based on current information. As new information become available, estimates may be revised substantially. For example, in 1978 FAO revised its estimates of China's potato production downward two-thirds and then in 1983 more than doubled it.
FAO's Statistics Division keeps its data under continuous review and revises its esti mates retrospectively if necessary. However, only current estimates arc published in the
Underground Crops 11
production yearbooks, trade yearbooks, and food balance sheets. As a result, time series assembled from those FAO publication se ries present sharp discontiruities from year to year.
FAO releases, on request, long-term se ries of agricultural production, trade, and utilization in the form of computer printouts and magnetic tapes. However, researchers and policy makers, particularly those in de veloping countries may not have easy access to them. In 1987, FAO published revised time series estimates in 1948-1985 World Crop and Livestock Products. This extremely useful document presents production esti mates for the post-war years for total root crops and for cassava, potato, and sweet potato.
The data in Underground Crops is based on a single set of revised, unpublished time series prepared by FAO's Basic Data Unit in May 1986. FAO has not eliminated all incon sistencies from this data set, but what is pre sented here are the best, most consistent, and up-to-date estimates of root crop pro duction available at that time.
Aside from the time-series problem, most published data on root crop production and use have several other flaws. From 1949 to 1971, the FAO production yearbooks lumped together the production estimates for sweet potatoes and yams, two botanically distinct crops that play quite different roles in food systems and that exhibit different trends in production and use. In Underground Crops, this problem has been resolved through use of FAO's revised, unpublished time series.
Another limitation is that the FAO trade yearbooks include international figures only for fresh potatoes. Trade statistics for pro cessed p tatoes and for other root crops, either fresh or processed, are not published. Underground Crops presents trade statistics for each of the five major groups of root
crops, including both fresh roots and pro cessed products converted into fresh weight equivalent.
A third problem is that FAO's figures are based on official estimates, where available, generated by governmental statistical agen cies. Government agencies tend to underes timate root crop production and consump tion because root crops are often grown in isolated areas on small, irregular plots, fre quently as intercrops, relay crops, secondary crops, or backyard garden crops. Conse quently, root crops may easily be overlooked in national estimates.
Consumption estimates are usually de rived from food balance sheets, which equate domestic production plus imports minus ex ports and net changes in year-end stocks to total domestic availability, which is the sum of the quantities available for seed, industrial products, animal feed, waste, and human consumption. Human consumption is often estimated as the residual (i.e., the first four uses are estimated and subtracted from total production and the balance is assumed to be human consumption). It is then divided by the estimated national population to obtain per capita consumption. In some instances, consumption is estimated and another vari able, such as livestock feed, is calculated as the residual. In cither case, the information in the equation is often unreliable. More over, the result is an estimate of the quantity available for consumption, not actual con sumption.
On the supply side, the tendency to un- derreport production has already been men tioned. On the utilization side of the food balance sheet equation, the figures are equally suspect. Seeding rates for crops like potatoes in the developing countries are usu ally assumed to be close to rates used in in dustrial countries. However, because farmers in poor countries tend to use small tubers for

12 Douglas Horton
seed, the tonnage of seed planted may be vastly overestimated. Compilers of food bal ance sheets may indiscriminately apply waste factors of 10,15, or 20 percent without re gard to indigenous practices in peeling, cooking, or utilization of root crops. So far as is known, no developing country's estimates of seed and waste are based on local on-farm or market-level research. Instead, they are generally educated guesses.
Many estimates of the volume of root crops processed are known to be only a frac tion of the true amount, because FAO has included only the portion that is exported or imported. For this reason, potato processing is substantially underreported for many countries. In the USA, for example, over half the potatoes consumed are processed; in Peru, traditional processed potato products (e.g., chuno and papa seca) are important. In Argentina, desserts made from sweet pota toes (duke de batata) are common. How ever, these uses are not reflected in the FAO estimate. For cassava, FAO has attempted to estimate processing for domestic consump tion.
The basic problems of data accuracy re main in Underground Crops, since no attempt has been made to correct or adjust the FAO estimates. For this reason, the figures pre sented should not be considered as defini tive, but as the best available estimates as of May 1986.
Aside from accuracy, food balance sheets have the limitations of all average national estimates. The figures do not reflect impor tant differences in consumption that occur between regions and across social groups. Despite all these shortcomings, food balance sheets provide a general indication of con sumption levels and serve as a useful starting point for estimating root crop utilization. For many countries, the FAO food balance
sheets are the only estimates of root crop use.
About the TablesThe tables in this publication present
FAO's most up-to-date country-level esti mates of production and use of five major groups of root crops: cassava, edible aroids, potatoes, sweet potatoes, and yams. An ad ditional category "unspecified root crops" is included when the original source does not specify which of the five major root crops, or others, are concerned. For example, in Table 19, the relatively high levels of unspecified root crop production in Cameroon, Ethiopia, Guinea-Bissau, and Namibia almost certainly include cassava, edible aroid, yam, and sweet potato production. However, the amount of each produced is not known.
Following the convention of the FAO production yearbooks, countries are listed in alphabetical order under regional headings: Africa, North and Central America, South America, Asia, Europe, Oceania, and the USSR. Each table begins with an estimate for the world and ends with estimates for "developing" and "developed" countries. FAO considers the countries of Eastern and Western Europe, the USSR, Canada, USA, Israel, Japan, Australia, New Zealand, and South Africa to be "developed." All other countries are considered to be "developing."
Production, Area, and YieldTables 1 through 18 present annual esti
mates of root crop production, area, and yield from 1961 to 1985. The countries listed vary from table to table depending upon which country reported production of each root crop. Only countries that reported pro duction of 500 tons or more in at least one year during the period 1961-85, are included. Following this criterion, production esti-

Underground Crops 13
000 tons (log scale) ISO-
100-
000 tons (log seal*) 10
100-
250
200-
150-
100-
I I1965 1970 1975 1980 1965 1970 1975 1980
Fig. 1. World and regional root crop production trends 1961-85 (3-year moving
averages).

14 Douglas Horton
mates for potatoes were reported for 126 countries; for sweet potatoes, 98 countries; for cassava, 93 countries; for yams, 48 coun tries; and for edible aroids, 45 countries.
Table 19 presents a summary of average root crop production, area, and yields for 1983-85. It includes countries that produced an average of 500 tons or more of root crops during the period.
Figure 1 summarizes regional root crop production trends. A semi-log scale is used to facilitate visual comparison among regions and crops. Equal slopes indicate equal rates of growth. On a worldwide basis, cassava and yam production have grown most rapidly. Yam production has more than doubled, and cassava production has increased about 90 percent from 1961 to 1985. World produc tion of edible aroids has increased about 40 percent; both potato and sweet potato pro duction have increased about 10 percent.
Virtually all of the world's cassava is pro duced in Africa, Asia, and South America. Africa and Asia also produce most of the world's cocoyams. Sweet potato production is highly concentrated in China. Yam produc tion is concentrated in Nigeria and a few other African countries (most notably Cote d'lvoire and Ghana). Among the root crops, potatoes are the most evenly distributed around the globe.
In general, root crop production has dropped in the developed countries and ex panded in the developing countries (Fig. 2). Production of potatoes, the dominant root crop in developed countries, has declined from about 240 million tons in 1961 to 212 million tons in 1985. Production of sweet potatoes, the only other root crop grown on a significant scale in developed countries, has fallen from 7 million tons in 1961 to just over 2 million tons in 1985.
In developing countries, production trends of root crops differ sharply (Fig. 3).
Although cassava and yam production has increased steadily, and by 1985 reached a level about double that of thivearly 1960s, j j sweet potato and edible nroid production has // been more erratic and now stands less than 50 percent above the 1961 level. Potato stands out from the rest-production has tripled in developing countries over the last quarter century.
In developing countries, production of root crops, particularly potatoes and cassava production, has expanded most rapidly in Asia. Average potato and yam yields in de veloping countries have approximately dou bled from 1961 to 1985 (from 6 t/ha to 12 t/ha) and sweet potato yields also increased substantially (from 8 t/ha to 14 t/ha). Cas sava yields increased about 25 percent (from 8 t/ha to 10 t/ha), and edible aroid yields remained stable at around 5 to 6 t/ha.
Comparing developed and developing countries, the yield gap for both potatoes and sweet potatoes was about 100 percent of the developing country yield in the early 1960s (6 to 8 t/ha). The gap has gradually narrowed. At present, potato and sweet potato yields are about 12 to 14 t/ha in de veloping countries and 17 to 18 t/ha in de veloped countries (Fig. 4).
Cassava and sweet potatoes each account for about one third of the root crops cur rently produced in developing countries (Fig. 5). The balance is made up of potatoes (a quarter of the total), yams (7 percent), edi ble aroids and others (about 2.5 percent).
ConsumptionTables 22 through 31 present information
on root crop utilization. In these tables all figures are in fresh-weight equivalents using the following conversion factors:
1 ton fresh cassava = 280 kg flour = 230 kg starch

Underground Crops 15
million tons 600-
500-
400-
300-
200-
100-
World
Developing nations •
1959/61 1969/71 1979/81
Fig. 2. Root crop production in developing and developed nations 1961-85 (3-year
moving averages).
Irdex 1961/63 = 100
300-
250-
200-
150-
100-
1959/61
PotatOv
1969/71——I——1979/81
Fig. 3. Root crop production trends in developing nations 1961-85 (3-year moving
averages).
\\
t/ha 18 •
16 -
14 -
12 -
10 -
8 -
6 -
POTATO
Developed nations
Developing nation
1959/61i —
1969/71 1979/81
t/ha 18 -
16 -
14 -
12 -
10 -
8 -
6 -
SWEET POTATO
Developed nations
Developing nations
1959/61 1969/71 1979/81
Fig. 4. Potato and sweet potato yields in developing and developed nations 1961-85 (3-
year moving averages).

f
16 Douglas Horton
Unspecified 0.4)
Edible voids (6)
WORLD
Unspecified (3.3)
Edible voids (5)
DEVELOPING NATIONS
Others (0.6)—, ,——— Sweet potato (2.2)
DEVELOPED NATIONS
Fig. 5. Root crop production 1983-85 (million tons).
1 ton fresh potatoes
1 ton fresh unspecified roots and tubers:
= 250 kg tapioca = 280 kg dried
= 200 kg flour = 150 kg starch = 150 kg tapioca = 600 kg frozen
= ISO kg flour = 150 kg flour = 150 kg dried
No utilization of processed edible aroids, sweet potatoes, or yams is reported by FAO.
Average world per capita consumption of root crops was reported to be about 70 kilo grams in 1984 (Figure 6 and Table D). This total is made up of 32 kilograms of potatoes, 19 kilograms of sweet potatoes, 16 kilograms of cassava, and 4 kilograms of yams, cocoy- ams, and unspecified root and tuber crops. With an average consumption of 132 kilo grams, Africa has the highest per capita root crop consumption of any region. Nearly 60 percent of Africa's root crop consumption is supplied by cassava and 20 percent by yams. Cassava consumption is heavily concentrated in Africa and South America, where it aver ages over 60 kilograms. In no other world region does the average reach 10 kilograms per head. Average per capita cocoyam con sumption is low in most regions, reaching a maximum of 10 kilograms in Oceania. Potato consumption is spread more uniformly across the regions; average per capita potato consumption exceeds 20 kilograms per year in all regions except Africa. Per capita re gional sweet potato consumption is low ev erywhere except in Oceania and Asia. Aver age yam consumption is also low except in Africa (Table 22).

x • o'
Underground CropsA
TABLED °Average quantity of root crops available for consumption by region, 1984 (kilograms per head per year).
17
World ,
AfricaN. &,C. AmericaSoul!, 'AmericaAsiaEuropeOceaniaU.S.S.R.
Developing nations
Developed nations
Cassava
16
782
418060
22
0
Edib*aroids
1
50010
100
10
Potato
32
84032198146
110
17
75
Sweetpotato
19
934
290
190
25
1
Yam
3
28110080
4
0
Total*
71
1324678578191
110
70
76
* Includes unspecified roots and tubers.
>''• ',
TABLE E ' ^Proportion (%) of total dietary calories from1984
World
AfricaN. & C. AmericaSouth AmericaAsiaEuropeOceaniaU.S.S.R.
Developing nations
Developed nations
Cassava
1.4
9.60.13.70.5
'. 0.00.60.0
2.1
0.0
Ediblearoids
0.1
0.50.00.00.10.00.70.0
0.1
0.0
Potato
2.3
0.72.12.31.54.72.96.2
1.3
4.3
root crops by region,
Sweetpotato
1.8
1.10.20.33.20.01.60.0
2.7
0.1
Yam
0.3
3.30.00.10.00.00.60.0
0.5
0.0
Total*
6.0
15.32.66.45.24.77.26.2
6.7
4.4
* Includes unspecified roots and tubers.

18 Douglas Horton
Yam (3)
Edible aroids (1)
WORLD
Edible aroids (t) Other (1)
DEVELOPING NATIONS
-Sweet potato (1)
DEVELOPED NATIONS
Fig. 6. Average annual per capita root crop consumption (kilograms).
Dietary ContributionAbout 6 percent of the world's dietary
calories are provided by root crops, primarily by potatoes, sweet potatoes and cassava. Root crops make their greatest dietary con tribution in Africa and Oceania, where they provide 15 percent and 7 percent of the di etary calories, respectively (Table E). A broader range of root crops is of dietary sig nificance in Oceania and Africa than in any other world region. In Europe and the USSR, potatoes provide 5 to 6 percent of the dietary calories, but no other root crops are grown. In Asia, where the numbers are dominated by China, sweet potato is the principal root crop. Potatoes and cassava each contribute about 1 percent of dietary calories in this region. Cassava is the major
/" ' >p in South America, contributing aVyw. Vpercent of dietary calories. In both North and South America, potatoes con tribute on average 2 percent of the dietary calories.
UtilizationAs noted earlier, the quality of food bal
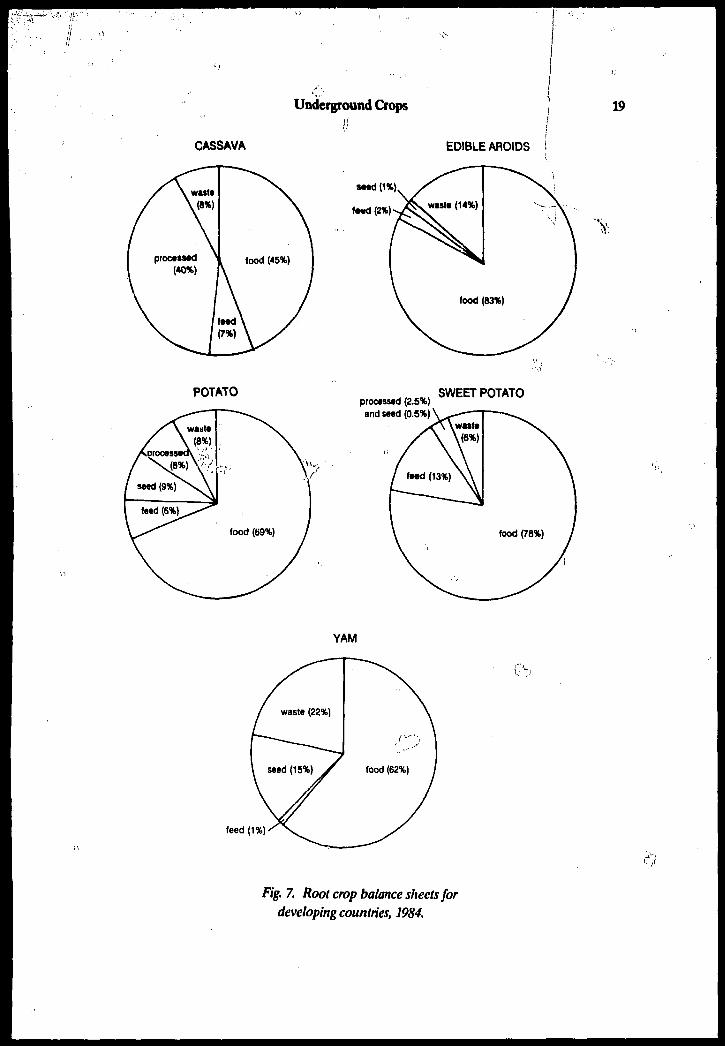
ance sheet data is poor. Perhaps the most difficult variable to estimate is the quantity processed. In the food balance sheets (Table 10), an unknown portion of the root crops listed as "processed" is consumed and a por tion of the crops listed as "food" is processed before consumption. For the world as a whole, FAO estimates that potato, sweet potato, and cassava consumption averages about 30 kilograms, 20 kilograms, and 15 kilograms, respectively (Fig. 6). In contrast, world consumption of yams, edible aroids, and other root crops, both fresh and pro cessed, is estimated to be on average only about 5 kilograms per capita per year. FAO estimates that a bit more than one-third of the world's cassava is processed (Fig. 7). In developing countries most of this is believed
Underground Crops 19
CASSAVA EDIBLE AROIDS i
POTATOprocessed (2.5%)
and swd (0.5%)
SWEET POTATO
YAM
feed (1%)
Fig. 7. Root crop balance sheets for developing countries, 1984.

20 Douglas Horton
TABLEFRoot crop trad* by region, 1984 (0001)
EdibleCassava
Country Imp.
World 26,409Africa 0N. & C. America 138South America 0Asia 1,223Europe 25,048Oceania 0U.S.S.R. 0
Exp.
31,606214320
26,5694,950
20
aroids
Imp.
140
1400000
Exp.
280
2101070
Potato
Imp.
7,757418661
55754
5,27828
563
Exp.
7,695200519
5604
6,16121
184
Sweetpotato
Imp.
1320
1104
11600
Exp.
487
110
f "•! 121800
Yam
Imp,
30300000
Exp.
170790000
Total*
Imp.
34,542422859
552,146
30,45046
563
Exp.
39,575228619
3627,34311,135
30184
Developingnations 678 26,655 14 28 1,241 786 6 29
Developed nations 25,731 4,950 0 6,516 6,909 126 19
3 17
0 0
2,118 27,683
32,424 11,892
* Includes unspecified roots and tubers.
to be for human consumption, except for cassava processed in Thailand. No cassava is used as planting material, and waste is esti mated to be just under 10 percent. In cassava growing areas, use of the roots for livestock feed is not common except in Latin America. However, imported dehydrated cassava is an important livestock feed in Europe. Virtually no edible aroids are used for seed, livestock feeding, or industry. About 80 percent is used for direct human consumption, most of the remainder being wasted.
The principal use of sweet potatoes is also human consumption; seed and industrial uses are insignificant, and less than 15 per cent of harvest is fed to livestock. Yams are seldom processed or fed to livestock; how ever, a substantial share of the harvest, esti mated to be 15 percent, is used for planting material, and an additional 22 percent is es timated to be wasted after the harvest. These factors help to make yams an expensive food in most developing areas. Other factors, such
as the need for staking in forest zones, the need for good soil fertility, and the heavy la bor inputs required also contribute to high production costs for yams.
Use of potatoes in developed and devel oping countries differs sharply. In Europe and the USSR, about half the potatoes are estimated to be used for livestock feed and industrial purposes. In other parts of the world, most potatoes are consumed. The rel atively large proportion (12 percent) of the harvest that is used for planting material makes potatoes expensive in many develop ing areas where seed is imported.
International TradeBecause of their bulkiness and perishabil
ity, root crops are not commonly exported. The only ones that are traded in a significant volume are cassava and potatoes. Developing countries annually export about 27 million tons (fresh-weight equivalent) of cassava, most of which is dehydrated livestock feed for Europe (Table F). About a quarter of
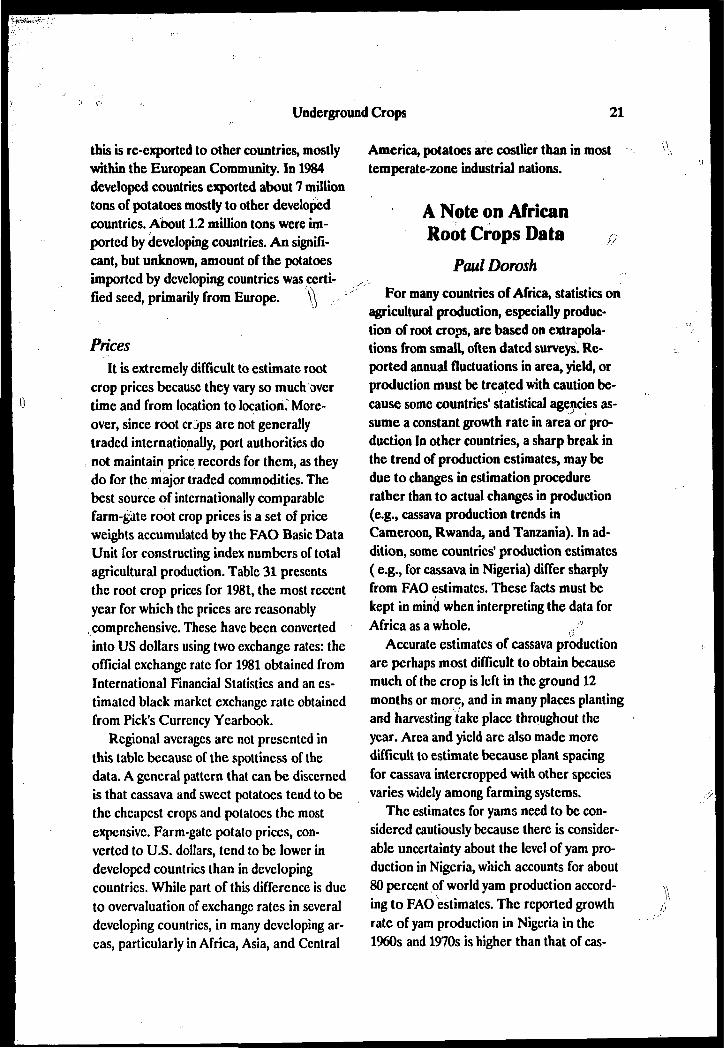
Underground Crops 21
this is re-exported to other countries, mostly within the European Community. In 1984 developed countries exported about 7 million tons of potatoes mostly to other developed countries. About 1.2 million tons were im ported by developing countries. An signifi cant, but unknown, amount of the potatoes imported by developing countries was certi fied seed, primarily from Europe. M,
PricesIt is extremely difficult to estimate root
crop prices because they vary so much over time and from location to location. More over, since root crjps are not generally traded internationally, port authorities do not maintain price records for them, as they do for the major traded commodities. The best source of internationally comparable farm-gate root crop prices is a set of price weights accumulated by the FAO Basic Data Unit for constructing index numbers of total agricultural production. Table 31 presents the root crop prices for 1981, the most recent year for which the prices are reasonably comprehensive. These have been converted into US dollars using two exchange rates: the official exchange rate for 1981 obtained from International Financial Statistics and an es timated black market exchange rate obtained from Pick's Currency Yearbook.
Regional averages are not presented in this table because of the spottiness of the data. A general pattern that can be discerned is that cassava and sweet potatoes tend to be the cheapest crops and potatoes the most expensive. Farm-gate potato prices, con verted to U.S. dollars, tend to be lower in developed countries than in developing countries. While part of this difference is due to overvaluation of exchange rates in several developing countries, in many developing ar eas, particularly in Africa, Asia, and Central
America, potatoes are costlier than in most temperate-zone industrial nations.
A Note on African Root Crops Data
Paul Dorosh
For many countries of Africa, statistics on agricultural production, especially produc tion of root crops, are based on extrapola tions from small, often dated surveys. Re ported annual fluctuations in area, yield, or production must be treated with caution be cause some countries' statistical agencies as sume a constant growth rate in area or pro duction In other countries, a sharp break in the trend of production estimates, may be due to changes in estimation procedure rather than to actual changes in production (e.g., cassava production trends in Cameroon, Rwanda, and Tanzania). In ad dition, some countries' production estimates ( e.g., for cassava in Nigeria) differ sharply from FAO estimates. These facts must be kept in mind when interpreting the data for Africa as a whole.
Accurate estimates of cassava production are perhaps most difficult to obtain because much of the crop is left in the ground 12 months or more, and in many places planting and harvesting take place throughout the year. Area and yield are also made more difficult to estimate because plant spacing for cassava intercropped with other species varies widely among farming systems.
The estimates for yams need to be con sidered cautiously because there is consider able uncertainty about the level of yam pro duction in Nigeria, which accounts for about 80 percent of world yam production accord ing to FAO estimates. The reported growth rate of yam production in Nigeria in the 1960s and 1970s is higher than that of cas-

22 Douglas Horton
sava, in contrast to longer-run trends and the observations of many researchers. In com paring production of yams with that of other crops, it is important to realize that use of yams as yam setts for replanting typically ac counts for about 20 percent of the crop har vest. (Surprisingly, use of yams for seed has been omitted in the FAO utilization account for Ghana, the third largest producer of yams.)
The picture of cocoyams in Africa given by the FAO data is distorted by the apparent lack of data for Cameroon. FAO production data indicates no cocoyam production in Cameroon, but a large volume of "unspecified" root crops. The absence of data on cocoyams may arise from confusion be tween the two genera of cocoyams, Xantho soma and Colacasia, both of which are widely grown in the country. Cocoyams of both genera are apparently included in the production figures of other major West African producers of edible aroids, however. If the "unspecified" figure is largely cocoyam
Symbols Used in Tables
In all tables, zero (0) indicates a value is less than one-half the indicated unit of measurement.
Ellipsis (.. .) indicates that no estimate is available, or that the variable docs not apply to the country and year in question. For example, in Tables 1 through 21, zeros indicate that production of the crop was less than 500 tons or area was less than 500 hectares. The symbol ... in the tables presenting yields indicates that no yield estimate is available, usually because no production was recorded in that country that year.
production, a reasonable assumption, Cameroon may be Africa's'second leading producer of edible aroids.
Finally, the price statistics for root crops, especially cassava, need to be carefully han dled. Fresh cassava roots deteriorate quickly and are generally sold in retail markets in small quantities, compared with the large volumes of processed cassava. Hence if the price of fresh roots is used instead of the much lower price of dried cassava, the value of cassava production may be overstated by a factor of two to four. On the other hand, the considerable value of cassava leaves, which are widely consumed in Central Africa, is missed in calculations based only on the pro duction of roots.
References,f'
Consultative Group on International Agri cultural Research, Technical Advisory Committee. 1987. CGIAR priorities and future strategies, Rome: FAO.
FAO. 1986. Role of roots, tubers, and plan tains in food security in Sub-Saharan Africa. Rome.
FAO. l%i.Role of roots, tubers, and plan tains in food security in Latin America. Rome.
Horton, D.; Lynam, J.; and Knipscheer, H. 1984. Root crops in developing coun- tries--An economic appraisal. In Sixf/i Symposium: International Society for Tropical Root Crops. Lima: International Potato Center.
International Monetary Fund. 1986. Interna tional financial statistics. Washington D.C..
Kay, D.E. 1973. Root crops. London: Tropi cal Products Institute.
Pick, F. ed. 1983. Pick's currency yearbook, 23rd Edition 1982-1983. New York.
Tables
1. Cassava production2. Cassava area3. Cassava yield4. Edible aroid production5. Edible aroid area6. Edible aroid yield7. Potato production8. Potato area9. Potatoyield
10. Sweet potato production11. Sweet potato area12. Sweet potato yield13. Yam production14. Yam area15. Yam yield16. Unspecified production17. Unspecified area18. Unspecified yield
19. Root crop production summary20. Root crop area summary21. Root crop yield summary22. Per capita root crop production and
availability/or consumption and to supply dietary energy and protein
23. Proportion of calories provided by root crop in daily diets
24. Cassava balance sheet25. Edible aroid balance sheet26. Potato balance sheet27. Sweet potato balance sheet28. Yam balance sheet29. Unspecified roots and tubers
balance sheet30. Root crop trade31. Farm-gate root crop prices

TABLE 1Cassava production, 1961-85 (0001)
Country
WORLD
AFRICAAngolaBeninBurkina FasoBurundiCameroonCape VerdeCent.Afr.Rep.ChadComorosCongoCote d'K/oireEq.GuineaGabonGambiaGhanaGuineaKenyaLiberiaMadagascarMalawiMaliMauritiusMozambiqueNigerNigeriaReunionRwandaSao Tome Prn.SenegalSeychellesSierra LeoneSomaliaSudanTanzaniaTogoUgandaZaireZambiaZimbabwe
N. & C. AMERICABahamasBarbadosCosta RicaCubaDominicaDominican Rp.El SalvadorGuadeloupeGuatemalaHaitiHondurasJamaicaMartiniqueMexicoNicaraguaPanamaPuerto RicoSaint LuciaSt.VincentTrinidad Tob.
61
71018
31234125028030
420580
57203050
48046040
2856
1100450420250926147500
2000130
73845
1252
1450
5616
2002600400
11208680
15041
596116
1601
1408
105
1602093
3011186133
62
74410
319641275
32027
420600
5730
4050
480500
40290
6110043043025096114750^1
2100133
7583!5
1342
1570
5416
2002900
40010558900
15042
610116
1621
1489
135
1602193
3012186124
63
77894
32585130033026
420620
5740
4755
470470
38280
6119442044025598413640
12000
1367783
5209
2153
061i7
2003000
41511409000
14542
623117
1701
147955
17023
93
3012186124
64
82262
33322132035025
450650
57605860
50049040
2806
1229450450252984136300
2050149
79825
1742
1560
6118
2003100430985
930014143
633117
1701
153955
1702493
3213196124
65
85173
348651400
40026
450675
5780
6575
50050040
2808
1400420460255
117113530
02000
1508182
3178
2150
07220
2003200
45013009700
13943
679117
2001
15210
55
180ft
93
341420
6133
66
84340
34962150055027
450705
35787063
480515
41280
81552433470255
1022138
310
2150149
83825
1982
2410
8320
2003300
470900
950014544
686117
2001
15310
56
18025123
361521
5133
67
88276
35933152545030
460756
36299065
465520
41280
71577446480255
104314032
02200169
85815
2302
2390
8020
1603500495
10639700
15044
711118
2101
15211
26
19025153
381622
6134
68
92881
36412154542530
460758
367011066
460530
42285
81446450490260
1140142330
2326198
88013
2332
2320
6623
1403600
510930
980015045
721118
2101
1551136
1903283
4016245133
69
95382
376761590500
30460595
371612568
448532
42285
81500470500260
12538933
02547
1979040
3283
2177
'J6123
1303500
5451440
1002015545
757118
2201
16512
56
20030113
401724
5144
70
97806
397471600510
30410654
276414070
461540
42285
81550480510265
12188135
02500
18210206
3345
2162
08325
1343428550
192010346
16046
n• 786
118
2201
17011
56
20528203
431735
4133
71
98476
39220160060030
420662
182014472
47556745
290„ 81550495520267
1210100400
2500166
91724
3723
1381
8226
1343192560
241710329
16347
799119
2101
1841347
21027173
4618374133
72
101052
405511620
61530
380719
087314574
489585
45290
81650
505530267
1213139300
250095
95704
3503
1501
8326
1343475
5052650
10585165
49
849119
2201
1951447
23025213
491939
4134
continued

COUNTRY
WORLDAFRICAAngolaBeninBurkina FasoBurundiCameroonCap* VerdeCent.Afr.Rep.ChadComorosCongoCote d'rvolreEq.GuineaGabonGambiaGhanaGuineaKenyaLiberiaMadagascarMalawiMallMauritiusMozambiqueNigerNigeriaReunionRwandaSao Tome Prn.SenegalSeychellesSierra LeoneSomaliaSudanTanzaniaTogoUgandaZaireZambiaZimbabwe
N.& C.AMERICABahamasBarbadosCosta RicaCubaDominicaDominican Rp.El SalvadorGuadeloupeGuatemalaHaitiHondurasJamaicaMartiniqueMexicoNicaraguaPanamaPuerto Rico
\ Saint LuciaSt. Vincent
'• Trinidad Tob.
73
101341
409811630599
20430732
194513676
49062546
2909
1600598540250
1175247
300
2450156
96004
3633
1311
8426
1403770
4282132
1101516545
84111
10230
1197
1547
22014153
522039
5135
74
104679
42603168057830
345811
289814078
51562346
2809
1600604550245
1264254350
2500201
100004
3603
1200
812792
4179436
235011447
16550
84711
11238
1192
1637
22011153
552140
5135
75
110166
46435171056235
440765
365016080
55093948
2609
1900610560252
1309260400
2600176
106004
3943
1090
8128
1305480
4372992
11844167
, > 48
87511
12246
1191
1727
23510193
5622404135
76
114256
469431740624
35445810
6850163
81556990
49250
101819616605275
1390267
450
2700197
108004
4153
680
873099
5500448
283811910
16950
87811
13254
1171
1328
2409
211
682340
4135
77
117731
468871760625
40450800
690017083
56097750
2169
1811622610285
141227350
02800
18010600
4444
375
0893195
5111392
299312139
17250
91611
14262
118513
18
2508
281
6625404135
78
121275
45554170072140
500632
394017585
5801056
52229
61695629620295
1594280550
2900205
105004
3733
810
8930
1034824319
202811779
17552
95411
14312
1185
1518
2618
301
3926404135
79
117201
456021800735
42365643
4940180
85600
111252
2396
1759475630300
1570288
560
3000224
105004
6543
250
9031
1275146
3701294
1200017854
88211
15320
111920
18
2549
240
332440
4135
80
124882
48464185058342
400625
392021086
6281253
53250
61858480635300
1683292
600
3100162
110004
5423
270
9532
1225631
4332072
1278518060
82811
18325
18120
18
2507
230
2026343134
81
127941
49727190057542
451638
490022587
6491218
53237
61652485221315
1670295620
3200188
110004
5373
340
9733
1256000408
300013172
19050
86311
19330
1942528
2527
220
3026343134
82
127520
516071950610
43444519
1940240
88650
123053
2506
1976490390320
1898296
650
3250190
117004
5933
320
10034
1255000
3723300
14185200
60
86111
21330
17623
29
2607
170
432735
3133
83
125250
507871950
58042
444600
1860250
89600
121054
2606
1729494250320
19922S8
700
3150180
99505
6713
170
10535
1255400
3673800
14600210
70
86411
21300
110223
29
2657
170
432734
3133
84
133897
56187195069540
511650
290028090
6001230
54245
64083496612320
2047299750
3150170
118005
3243
170
10036
1255600444
390015038
21080
89611
18300
112928
39
2657
200
4327342133
85
136230
56557195079544
520670
292029092
6101500
55250
62373500400320
2142300730
3180190
130005
3503
120
11037
1285500
4394000
1550021082
88811
20300
11252329
2657
190
432735
2133
continuea

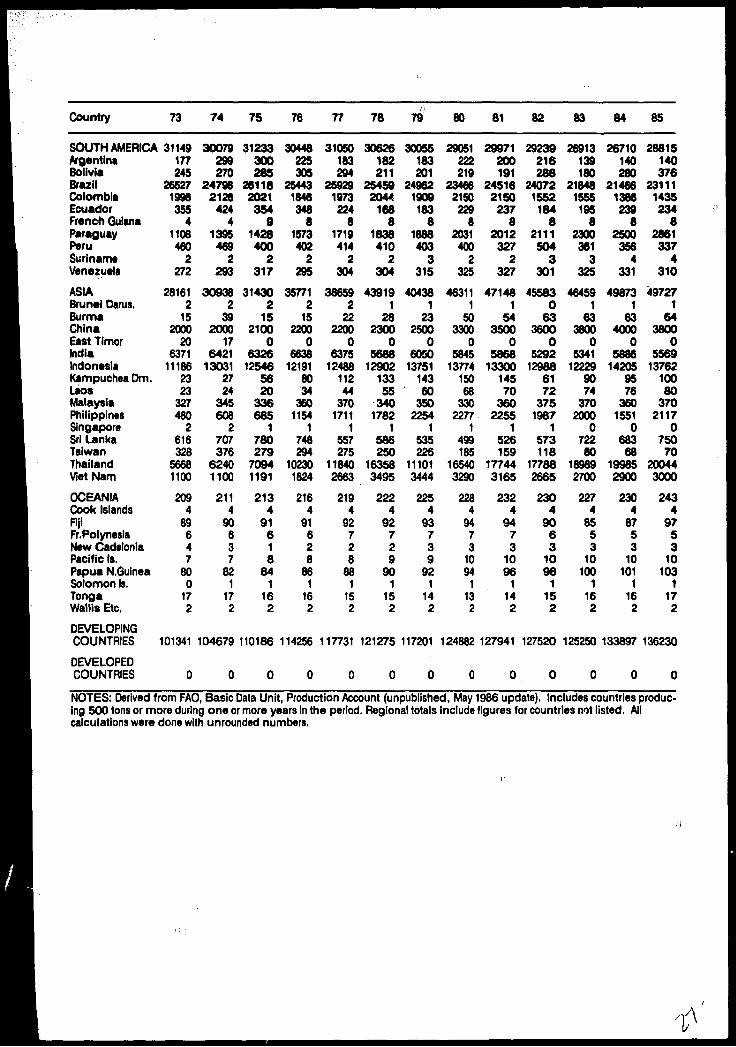
TABLE 1 (CONTINUED)Cassava production 1961-85 (0001)It'\\ (Country
SOUTH AMERICAArgentinaBoliviaBrazilColombiaEcuadorFrench GuianaParaguayPeruSurinameVenezuela
ASIABrunei Darus.BurmaChinaEast TimorIndiaIndonesiaKampuchea Dm.LaosMalaysiaPhilippinesSingaporeSri LankaTaiwanThailandViet Nam
OCEANIACook IslandsRjiFr.PolynesiaNew CadeloniaPacific Is.Papua N.GuineaSolomon Is.TongaWallis Etc.
DEVELOPINGNATIONS
DEVELOPEDNATIONS
61
21052225148
18058650221
8994407
2339
1797524
94010
196911190
1410
125495
3297226
1726965
1615
80535
53072
71018
0
62
22934243135
19843780212
9997390
2323
1871425
100016
189211386
1311
150458
3282224
20771196
1685
80545
550
122
74410
0
63
25415231138
22249800209
61000438
2342
1909514
95013
175711679
1311
174596
3312217
21111253
1775
80545
570
182
77894
0
64
27890240140
24356700189
61449497
2312
2023714
10009
282312262
159
146646
3369242
15571150
1805
80555
590
192
82262
0
65
28727260150
24993800254
61512449
2301
2072215
11009
303312643
3010
165614
3328265
14751040
1805
78555
610
192
85173
0
66
28476241160
24710840276
51437487
1320
200301
101100
153467
112321910
199529
3289264
18921000
1864
82655
630
192
84340
0
67
31212303180
27268850323
51460507
1316
2023318
12008
381710747
2311
206482
3383299
2062982
1864
82645
651
182
88276
0
68
33048273200
29203886234
61504399
1341
225102
131400
174644
113564012
199487
4425342
2611960
1904
83645
671
182
92881
0
69
34246301213
30074950390
71549450
2310
225112
151500
234636
109172713
204442
4403316
3079930
1934
84645
701
182
95382
0
70
33949292221
294641200
3713
1580498
2317
231282
141600
185214
104783015
288427
3354308
3431945
1974
85646
721
182
97806
0
71 72
35138 34680295 244234 242
30229 298291990 2010383 377
4 41198 1208482 446
2 2323 318
23117 247663 3
12 101800 1900
17 75130 6026
10690 1038515 2117 20
245 302440 445
3 3372 318290 325
3114 3974970 1027
202 2054 4
87 886 64 46 6
75 771 1
17 172 2
98476 101052
0 0
Country
SOUTH AMERICAArgentinaBoliviaBrazilColombiaEcuadorFrench GuianaParaguayPeruSurinam*VenezuelaASIABrunei Dams.BurmaChinaEast TimorIndiaIndonesiaKampuchea Dm.LaosMalaysiaPhilippinesSingaporeSri LankaTaiwanThailandWet Nam
OCEANIACook IslandsFijiFr.PolynesiaNew CadeloniaPacific Is.Papua N.GuineaSolomon Is.TongaWallis Etc,
DEVELOPINGCOUNTRIES
DEVELOPEDCOUNTRIES
73
31149177245
265271998355
41106460
2272
281612
152000
206371
111862323
327480
2616328
56681100
2094
89647
800
172
101341
0
74
30079299270
247982126
4244
1395469
2293
309382
392000
176421
130312724
345608
2707376
62401100
2114
90637
821
172
104679
0
75
31233300285
261182021354
91428400
2317
314302
152100
06326
125465620
336685
1780279
70941191
2134
91618
841
162
110186
0
76
30448225305
254431846348
81573402
2295
357712
152200
06638
121918034
3601154
1748294
102301824
2164
91628
861
162
114256
0
77
31050183294
259291973
2248
1719414
2304
386592
222200
06375
1248811244
3701711
1557275
118402663
2194
92728
881
152
117731
0
78
30626182211
254592044
1688
1838410
2304
439191
282300
05688
1290213355
3401782
1586250
163583495
2224
92729
901
152
121275
0
/f
79
30055183201
249621909183
81888403
3315
404381
232500
06050
1375114360
3502254
1535226
111013444
2254
93739
921
142
117201
0
80
29051222219
234662150
2298
2031400
2325
463111
SO3300
05845
1377415068
3302277
1499185
165403290
2284
9473
1094
113
2
124882
0
81
29971200191
245162150
2378
2012327
2327
471481
543500
05868
1330014570
3602255
1526159
177443165
2324
9473
1096
1142
127941
0
82
29239216288
240721552
1848
2111504
3301
455830
633600
05292
129886172
3751987
1573118
177882665
2304
9063
1098
1152
127520
0
83
26913139180
218481555
1958
2300361
3325
464591
633800
05341
122299074
3702000
0722
80189892700
2274
8553
10100
1162
125250
0
84
26710140280
214661386239
82500
3564
331
498731
634000
05606
142059576
3601551
0683
68199852900
2304
8753
10101
1162
133897
0
85
28815140376
231111435234
82861337
4310
497271
643800
05569
1376210080
3702117
075070
200443000
2434
9753
10103
1172
136230
0
NOTES: Derived from FAO, Basic Data Unit, Production Account (unpublished, May 1986 update). Includes countries produc ing 500 tons or more during one or more years in the period. Regional totals include figures for countries not listed. All calculations were done with unrounded numbers.

TABLE 2Cassava area, 1961-1985 (000 ha)
Country
WORLDAFRICAAngolaBeninBurkina FasoBurundiCameroonCap* VerdeOnt.Afr.Rtp.ChadComorosCongoCoted'lvoireEq.GuineaGabonGambiaGhanaGuineaKanyaLiberiaMadagascarMalawiMallMauritiusMozambiqueNigerNigeriaReunionRwandaSao Tom* Prn.SenegalSeychellesSierra LeoneSomaliaSudanTanzaniaTogoUgandaZaireZambiaZimbabweN.& C.AMERICABahamasBarbadosCosta RicaCubaDominicaDominican Rp.El SalvadorGuadeloupeGuatemalaHaitiHondurasJamaicaMartiniqueMexicoNicaraguaPanamaPuerto RicoSaint LuciaSt.VlncentTrinidad Tob.
61
91445096
11074
536
1401
2204
1895
1531540
1140605562
1602180
43016
7801
210
360
202
6057025
3171340
4614
112002
240
28112
404102323000
62
9610
5431110825
36400
1200
51895
1761543
1140605662
1642180
43017
8651
220
380
202
6058025
2641350
4614
113002
240
30112
404102322000
63
10006
5488110845
36410
1200
102095
2101243
1159605764
1642060
43016
8011
470
340
202
60590
25286
13504614
115002
250
29102
424102322000
64
10161
5591110905
38420
1200
1520
100220
1243
1163605863
16420
50
43017
8701
140
330
212
60600
26240
14104614
116002
250
30102
424102322000
65
10512
573111598
538
4301
2001823
100227
12432
150605964
1731950
43019
8290
150
380
182
6061028
3591420
4614
123002
280
30102
454102322000
66
10354
5730115915
38450
0236222194
19213432
186606070
17020
50
43021
9101
200
640
202
6062030
2171380
4715
124002
280
30112
454202422000
67
10717
587611575
540
4601
243282296
20213432
183656172
17320
50
43024
9581
230
630
192
54625
29253
14104815
128002
300
30102
474102422000
68
10902
587012070
540
4701
249352297
20015432
172656277
17720
50
43027
9020
260
630
162
47660
30227
14304815
130002
300
31102
475102421000
69
11088
6005120108
540
3961
255402297
16415442
200706377
1841550
44928
9060
280
390
152
4471530
3001460
5015
139002
330
33202
505202421000
70
11165
6119120116
536
4160
2624423
100163
15442
210706478
1851450
45024
8570
290
390
172
37700
31400
14935215
143002
330
34102
514202441000
71
11566
6363123108
536
4580
2684523
100170
17452
210716581
1951750
45024
9200
310
310
172
36670
33508
15275316
146002
330
36102
524202541000
72
11782
6399123101
535
4790
275452498
17517452
220725677
1952350
45019
9600
290
410
172
35720
28375
15715316
150002
330
39102
524202541000
continued

Country
WORLDAFRICAAngolaBeninBurkina FasoBurundiCameroonCape VerdeCent.Afr.Rep.ChadComorosCongoCote d'lvoireEq.GuineaGabonGambiaGhanaGuineaKenyaLiberiaMadagascarMalawiMaliMauritiusMozambiqueNigerNigeriaReunionRwandaSao Tome Prn.SenegalSeychellesSierra LeoneSomaliaSudanTanzaniaTogoUgandaZaireZambiaZimbabweN. & C. AMERICABahamasBarbadosCosta RicaCubaDominicaDominican Rp.El SalvadorGuadeloupeGuatemalaHaitiHondurasJamaicaMartiniqueMexicoNicaraguaPanamaPuerto RicoSaint LuciaSt.VincentTrinidad Tob.
73
12239
6684123975
37475
0283
4525
100186
18463
224856771
18935
50
50024
9700
300
290
172
34780
21483
13075316
151002
340
39102
523203551000
74
12605
691312497
534
5000
3024525
105185
19473
225866870
1913850
50031
10000
290
330
173
34870
21485
16485317
151003
350
38103
523203551000
75
12697
7042120776
39478
12864726
10017020463
285877072
2034050
55035
10500
320
370
173
43700
21618
16885316
155002
360
38203
553203551000
76
12805
684512079
639
5081
290472682
18520403
250887476
21641
60
55022
10800
350
250
173
3855022
5121724
5317
154002
370
34103
563204651000
77
13236
692112085
639
5151
3054827
10219321403
232897979
2134260
60021
11000
370
190
183
38450
21540
17595317
161002
380
37103
573304651000
78
13741
7089120111
640
5451
315492796
20422402
235908082
27343
70
60026
11000
400
170
203
42450
23529
17785317
169003
450
37203
583302650000
79
13321
6923130113
639
5531
310502895
21222402
219688082
2674470
60228
11500
40080
203
50450
28303
18005518
162005
460
24202
633302650000
80
13386
6832130886
39402
1300
552891
21922412
230698185
27745
70
60021
12000
46080
253
45450
22302
18185519
154005
470
16202
631302750000
81
13702
696613094
639
3971
287602894
22923402
210854287
2874570
60026
12000
45080
283
4545023
3001968
5918
158005
480
18203
631202750000
82
13790
7237130
i\ 946
40383
0300652994
23523412
260707587
3144580
60026
12500
46090
303
4545023
3502026
6019
151005
490
10203
641202750000
83
13430
7112130876
40390
0290652994
24924422
210717087
3294680
50025
11500
47060
313
4545020
4002086
6019
155005
460
17203
650202750000
84
14085
7554130996
45400
0300653094
23025422
436706187
3364690
55025
12500
40060
303
45450
10400
21506120
159005
460
20203
650202750000
85
13956
7492130116
645
4100
310673294
27025422
290716087
3514680
57026
12000
43040
313
46450
15410
21506120
161005
460
23203
650202750000
continued

TABLE 2 (CONTINUED)Cassava art*, 1961-1985 (000 ha)
Country
SOUTH AMERICAArgtntinaBoliviaBrazilColombiaEcuadorFrench GuianaParaguayParuSurinam*VenezuelaASIABrunei Darus.BurmaChinaEast TimorIndiaIndonesiaKampuchea Dm.LamMalaysiaPhilippinesSingaporeSri LankaTaiwanThailandVletNamOCEANIACook IslandsFijiFr.PolynesiaNew CaledoniaPacific to.Papua N.GuineaSolomon Is.TongaWallis Etc.DEVELOPINGNATIONS
DEVELOPEDNATIONS
61
16961813
138111525
170410
34
222300
804
2741478
11
14930
391799
122
16070015010
9144
0
62
18072013
147613823
171390
26
224300
856
2651449
12
16800
3418
122164
16070106010
9610
0
63
19591913
161814227
171440
25
242800
855
2471598
12
19940
4917
139172
16070106010
10006
0
64
20772113
171612524
1103500
25
235900
905
2441579
11
15930
4517
105163
16070106010
10161
0
65
21282313
175014225
1108410
25
251401
904
2401754
21
17900
5318
101143
16070106010
10512
0
66
21522113
178014228
1102400
26
233301
956
2711514
11
22870
4917
129139
17070116010
10354
0
67
23012515
1914144v27
19742
035
239501
1004
2901524
21
23840
7119
140137
170700170
, 10
10717
0
68
23982517
199815227
1101370
41
248801
1205
3471503
31
22860
7321
170135
17070117010
10902
0
69
24422517
202915535
1103380
39
248501
1307
3591467
31
23830
6922
189132
17070017010
11088
0
70
24342618
2025150350
103390
39
245101
1407
3531396
31
31820
6021
224131
17070017010
11165
0
71
25722818
2071249
371
95380
40
246701
1507
3451406
11
28830
6820
220136
17070017010
11566
0
72
25582418
2053251
411
9336
041
265801
1608
3541468
21
2887
05921
325142
18070018010
11782
0
•7,0
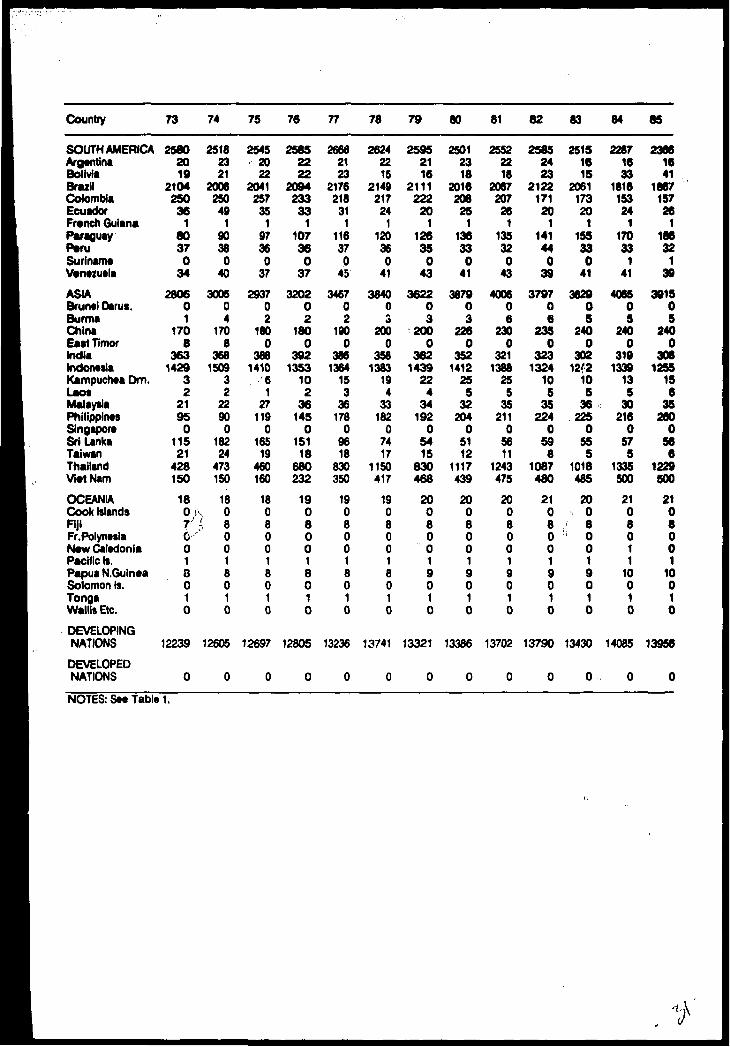
Country
SOUTH AMERICAArgentinaBoliviaBrazilColombiaEcuadorFrench GuianaParaguayPeruSurinam*V*rMzu«laASIABrunei Darus.BurmaChinaEast TimorIndiaIndonesiaKampuchea Dm.LaosMalaysiaPhilippinesSingaporeSri LankaTaiwanThailandV/ietNam
OCEANIACook IslandsFijiFr.PolynetlaNew CaledoniaPacific Is.Papua N.GuineaSolomon Is.TongaWallts Etc.DEVELOPINGNATIONS
DEVELOPEDNATIONS
73
25802019
210425036
180370
34
280601
1708
3631429
32
21950
11521
428150
1807'
6018010
12239
0
74
25182321
2006250
491
9038
040
300504
1708
3681509
32
2290
018224
473150
18^ I' -, 8
0018010
12605
0
75
25452022
2041257
351
97360
37
293702
1800
3881410
61
27119
0165
19460160
18080018010
12697
0
76
25852222
209423333
1107360
37
320202
1800
3921353
102
36145
0151
18680232
19080018010
12805
0
77
ttfAA£OQO
2123
2176218
311
116370
45
346702
1900
3861364
153
36178
09618
830350
19080018010
13236
0
78
26242215
2149217
241
120360
41
384003
2000
3581383
194
33182
07417
1150417
19080018010
13741
0
79
25952116
2111222
201
12635
043
362203
2000
3621439
224
34192
05415
830468
20080019010
13321
0
60
25012318
201620825
1136330
41
387903
2260
3521412
255
32204
05112
1117439
20080019010
13386
0
81
25522218
2067207
261
135320
43
400606
2300
3211388
255
35211
05611
1243475
20080019010
13702
0
82
25852423
212217120
1141440
39
379706
2350
3231324
105
35224
059
81087480
21080019010
13790
0
83
25151615
206117320
1155330
41
362905
2400
30212/2
105
36225
0555
1018485
20080019010
13430
0
84
22871633
181615324
117033
141
406505
2400
3191339
135
30216
057
51335500
2106011
10010
14085
0
85
23661641
186715726
118632
139
391505
2400
3081255
156
35280
0566
1229500
2108001
10010
13956
0
NOTES: See Table 1.

TABLES, 1961-85 (t/ha)
Country
WORLDAFRICAAngolaBeninBurkina FatoBurundiCameroonCap* VardaCent.Afr.Rtp.ChadComoro*CongoCote d'hwlreEq.GuineaGabonGambiaGhanaGuineaKenyaUberiaMadagascarMalawiMaliMauritiusMozambiqueNigerNigeriaReunionRwandaSao Tom* Prn.SenegalSeychellesSierra LeoneSomaliaSudanTanzaniaTogoUgandaZaireZambiaZimbabweN. & C. AMERICABahamasBarbadosCosta RicaCubaDominicaDominican RepEl SalvadorGuadeloupeGuatemalaHaitiHondurasJamaicaMartiniqueMexicoNicaraguaPanamaPuerto RicoSaint LuciaSt.VincentTrinidad Tob.
61
86
1146
12453835337588846767589
106
10463
1035
164633
58
3047
1058
10345
111520
41024
129
62
8
61245
12254835337587846769589
106
10463
1035
164733
58
3247
1058
10346
111720
41034
129
63
8
61245
1225453523758784677
1058
10104
10563
1035
174733
58
3047
1058
10346
111520
41034
129
64
8
61245
1225443523766884676
10599
101210563
1035
174733
59
3147
1058
10346
111520
41034
129
65
8
61245
1225443523749784776
1058
108
1210464
1035
164733
69
3047
1058
10346
111520
41034
129
66
8
61365
1227233533748784676
18579
101011464
1035
164733
61028
47
105893467
1520
41034
129
67
8
61366
1226333533749784676
17579
101010464
1036
174733
6102847
1058
10346
111520
41044
129
68
9
61366
12263
>/ 3-" 3
'•'• 533748783677
1757
1089
11464
1035
174733
61030
47
1058
113478
1520
41044
119
69
9
61356
1226333533648783767
1767
108
1010564
1035
185733
5112747
1058
133467
1520
41034
159
70
9
61346
1125333533647783767
1767
128
1211465
1145
185733
5112747
1058
113479
1520
4844
139
71
9
61366
1215333533647783668
1667
10101210465
1145
175733
5112746
105
12103478
1320
4834
139
72
9
61366
1122333533638783666
1665
10101211465
1145
187733
61227
47
105
12103479
2020
4934
1310
continued
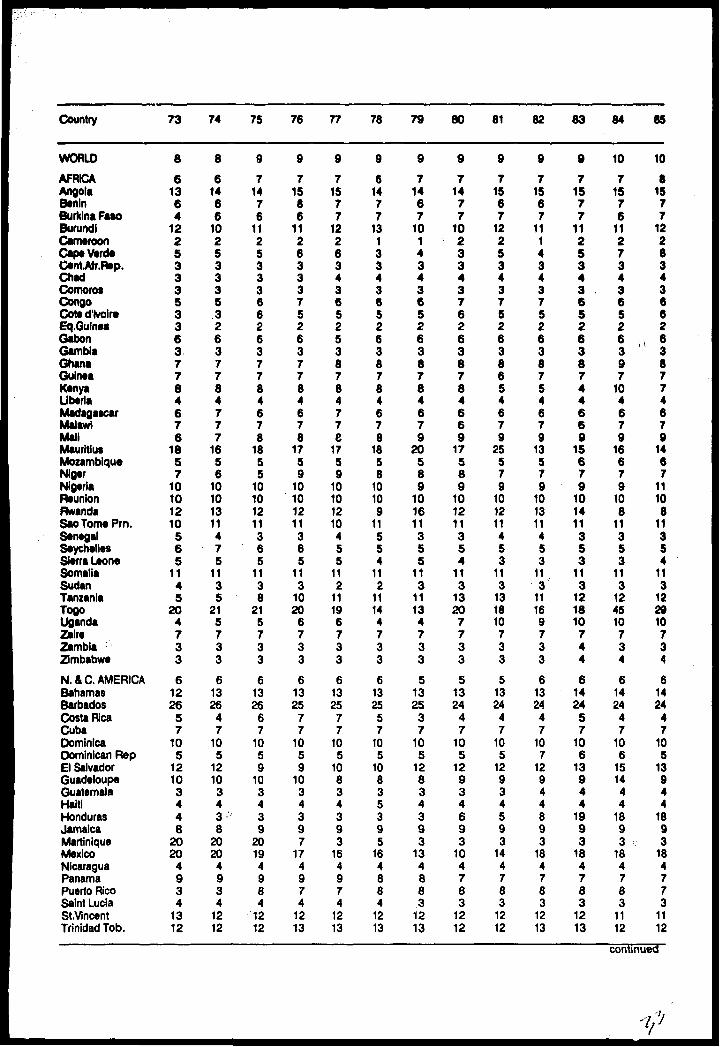
Country
WORLDAFRICAAngolaBeninBurkina FasoBurundiCameroonCape VerdeCent.Alr.Rep.ChadComorosCongoCote d'lvoireEq.GuineaGabonGambiaGhanaGuineaKenyaLiberiaMadagascarMalawiMaliMauritiusMozambiqueNigerNigeriaReunionRwandaSao Tome Prn.SenegalSeychellesSierra LeoneSomaliaSudanTanzaniaTogoUgandaZaireZambiaZimbabweN.& C.AMERICABahamasBarbadosCosta RicaCubaDominicaDominican RepEl SalvadorGuadeloupeGuatemalaHaitiHondurasJamaicaMartiniqueMexicoNicaraguaPanamaPuerto RicoSaint LuciaSt.VincentTrinidad Tob.
73
e6
1364
1225333533637784676
1857
10101210565
1145
204733
6122657
105
12103448
2020
4934
1312
74
8
61466
1025333532637784777
1656
101013114
• 75
1135
215733
6132647
105
1210343 •''8
2020
4934
1212
75
9
71476
1125333662637784678
1855
10101211365
1138
215733
61326
67
1059
103439
20194984
1212
76
9
71586
1126333752637784678
1759
10101211365
113
1020
6733
61325
77
1059
1034397
174974
1213
77
9
715
' 77
1226343652538784778
1759
10101210455
112
11196733
6132577
105
10834393
164974
1213
78
9
61477
1313343652638784678
1858
10109
11554
112
11144733
6132557
105
10835395
164884
1213
79
9
71467
1014343652638784679
20589
101611355
113
11134733
51325
37
105
12834393
134883
1213
80
9
71477
1023343762638784669
17589
101211354
113
13207733
51324
47
105
12934693
104783
1212
81
9
71567
1225343752638654679
25579
101211453
113
131810733
51324
47
105
12934593
144783
1212
82
9
71567
1114343752638754679
13579
101311453
113
11169733
61324
47
107
12944893
184783
1213
83
9
71577
1125343652638744669
15679
101411353
113
121810744
6142457
106
13944
1993
184783
1213
84
10
71576
11273436526397
104679
16679
108
11353
113
124510734
61424
47
106
151444
1893
184783
1112
85
10
81577
1228343662638774679
1467
11108
11354
113
122910734
61424
47
105
13944
1893
184773
1112
continued

TABLE 3 (CONTINUED)CatMva yitU, 1961-85 (t/ha)
Country
SOUTH AMERICAArgentinaBoliviaBrazilColombiaEcuadorFrench GuianaParaguayPeruSurinameVenezuelaASIABrunei Darus.BurmaChinaEast TimorIndiaIndonesiaKampuchea Dm.LaosMalaysiaPhilippinesSingaporeSri LankaTaiwanThailandVletNamOCEANIACook IslandsFijiFr.PolyntsiaNew CaledoniaPacific Is.Papua N.GuineaSolomon Is.TongaWallis Etc.
DEVELOPINGNATIONS
DEVELOPEDNATIONS
61
12131213697
14108
10
86
1112378
121095
138
13178
103611177
1010859
8
...
62
13121013697
14109
13
86
1012378
15796
148
12177
113611177
1110889
8
...
63 „
13121114688
14108
14
8S
1011377
13796
146
13157
113611177
11108
139
8
...
64
13121114688
14108
13
95
11112
128
1910107
148
14157
113711178
11108
149
8
...
65
131111146
108
14119
12
86
11122
137
1710107
136
14157
113711178
11108
149
8
...
66
131212146
108
14126
13
96
11122
137
171396
136
15157
113012188
10108
149
8
...
67
14121214
•\ 6',) 12u 8Vs
1269
86
10122
137
111496
135
16157
113012188
10109
149
8
...
68
14111215698
1511'••Vy e8
96
10123
138
121396
126
16157
113711178
10108
149
9
...
69
141213156
118
151268
98
11123
137
101395
116
15167
1128121889
109
1410
9
...
70
141113158
118
151388
98
11113
157
111495
116
15157
1127121889
109
1410
9
...
71
141213158
107
131378
98
10122
158
111495
106
15147
1227121889
109
1410
9
...
72
14101315897
131278
98
1012
1177
111511585
16127
1236121889
108
1410
9
...

Country
SOUTH AMERICAArgentinaBoliviaBrazilColombiaEcuadorFrench GuianaParaguayPeruSurinameVenezuelaASIABrunei Darus.BurmaChinaEast TimorIndiaIndonesiaKampuchea Dm.LaosMalaysiaPhilippinesSingaporeSri LankaTaiwanThailandVietNamOCEANIACook IslandsFijiFr.PolynesiaNew CaledoniaPacific Is.Papua N.GuineaSolomon Is.TongaWallis Etc.DEVELOPINGNATIONS
DEVELOPEDNATIONS
73
129
13138
107
141278
108
10122
1889
1516585
16137
1226121889
117
1410
8
74
12131312997
151277
108
11122
1799
15167
114
16137
1228121989
118
1410
8
...
75
121513138
1011151158
1189
12it*
1699
15126
115
15157
1232121969
119
1410
9
...
76
121014128
1110151168
1189
12...1798
15108
115
16158
1232121989
119
1410
9
77
129
131297
10151167
1189
12...1797
161010116
16148
1232121989
11111410
9
...
78
128
141297
10151187
1189
12...
1697
151010118
15148
12321219
99
11111310
9
...
79
129
131299
10151177
1189
13...17107
151012111015137
11.-32""~~12
1999
11121310
9
...
80
12101212109
11151258
128
1615...17106
151011111015157
1132121999
11121210
9
...
81
129
1112109
11151058
128
1015...18106
151011 ,119
14147
1132121899
11131310
9
...
82
119
131199
11151178
128
1115...16106
15119
111014166
11331120
79
11141410
v,9
.•••
83
119
12119
1011151168
13101216...
18109
15109
111315196
11321117
79
11141510
9
...
84
1298
129
1011151168
128
1217*n
18117
14127
111214156
1132111769
11141510
10
...
85
1299
1299
11151068
138
1216...18117
14118
111312166
1233121779
11151510
10
...
NOTES: See Table 1.

TABLE 4Edibto aroid production, 1961-85 (OOOt)
Country
WORLDAFRICABtninBurundiCent.Afr.Rep.ChadCoted'lvoireEgyptGabonGhanaGuineaLiberiaMftdKSfttCftrMauritiusNigeriaRwandaSltrra LeoneTogoZairaN.& C.AMERICABarbados CubaDominicaDominican Rp.PanamaTrinidad Tob.SOUTH AMERICAFrench GuianaPeruVenezuelaASIAChinaCyprusJapanKorea Rep.LebanonMaldivesPhilippinesTaiwanThailand
OCEANIAAmerican SamoaFijiKiribatiNew CaledoniaNiuePapua N.GuineaSamoaSolomon Is.TongaWallis Etc.
61
4129
24668
13540
51202540
7492713OAIW
11147
10251819
711
251323
45
6675
54
1306700
4484
110
9422
0
2213
36131
121201024
2
62
4660
292017
13540
51502140
7623013860
154510251822
751
25132755
7095
56
1366730
4506
110
101210
2293
36131
1252110272
63
4802
294018
140406
1522738
7752513A7Of
11551
10201721
931
45132455
7295
58
1464750
7581
110
104200
2343
36131
1292111272
64
4805
301910
145406
1563138
7882013an tyy0
162111201615
941
43132656
6753
59
1388750
8493
010
112240
2373
34131
1342211272
65
4895
30556
14540
61603335
8252813Q13f i
01602
11201723
981
47142556
7256
61
1426800
18478
110
106220
2453
37131
1382211272
66
4933
30238
135406
1603535
964261392• • 7*>
01433
10181830
1241
71142657
7759
63
1462800
20521
010
99210
2483
34131
143231227
2
67
5043
320513
140406
1623735
8972714930
164810211845
981
421427
6«11
7968
65
1417820
18459
010
9721
0
2433
26131
145231227
2
68
4911
296711
14542
61624332
9772714o«>3f9
01327
7191942
102
(43//IBi 29
9.'/ "
8049
67
1510850
15527
110
96200
2514
30131
1472512282
69
5415
342913
135476
1784132
9992614970
172534231940
961
35153169
844
1269
1551900
8524
120
93230
2545
30131
1492512272
70
5585
361515
134446
1823130
11362814Q4S7^
01791
31222038
751
121532
69
775
1556
1562900
5542
121
9120
0
2563
31131
152251227;-2
71
5247
32267
137466
1893230
11362614QQyy0
140022232039
781
141633
69
859
1858
1596920
6558
121
8821
1
2624
31131
154271228
2
72
5159
31296
125476
1954128
9452813890
150024232039
931
26163479
859
2353
1587950
6520
220
8620
1
2664
32131
156271328
2
DEVELOPING NATIONS 3645 4153 4222 4312 4417 4413 4583 4384 4891 5043 4689 4640
DEVELOPEDNATIONS 484 508 581 493 478 521 459 527 524 542 558 520

Country
WORLDAFRICABeninBurundiCfnt.Afr.Rep.ChadCott d'lvoireEgyptGabonGhanaGuineaLiberiaMadagascarMauritiusNigeriaRwandaSierra LeoneTogoZaireN. & C. AMERICABarbadosCubaDominicaDominican Rp.PanamaTrinidad Tob.
SOUTH AMERICAFrench GuianaPeruVenezuelaASIAChinaCyprusJapanKorea Rep.LebanonMaldivesPhilippinesTaiwanThailand
OCEANIAAmerican SamoaFijiKiribatiNew CaledoniaNiuePapua N.GuineaSamoaSolomon Is.TongaWallis Etc.
73
5783
3875a
140486
2003829
1325281366
11850
19232141
921
2016378
10
76102441
1472970
6385
111
87200
2694
32131
158271328
2
74
6032
40628
11248
6206
6132
1510291577
01850
20232342
1001
261739
810
78102643
1521970
4430
211
8923
1
2724
33131
160271328
2
75
5715
377710
143507
2636336
11002915650
187018232243
1071
3317388
10
76102145
1479980
5370
211
9327
1
2774
33221
1623014292
76
5617
358812
145506
2577739
7732915840
200016201846
1171
4418368
10
623
2236
15671000
5426
311
11218
1
2834
33221
164321429
2
77
5735
341412
148516
2607239
722301557
01900
19201746
1641
861941
810
683
1747
18041200
3430
311
12440
2
2854
33231
1663214292
78
5832
344712
140527
2758343
7263015720
190018201737
2941
21720378
10
544
1633
17501200
3341
310
140603
2883
33231
1693314292
79
5988
351512
136528
2870947
749301576
01900
37201830
2721
1961641
810
595
1737
18491200
4447
311
14548
1
2922
34231
172341429
2
80
5878
3469129552
8297
9450
643311580
02000
30202024
2301
1611736
410
585
1736
18231200
3459
311
11145
1
2974
34231
174351529
2
81
5683
337312
100538
2059550
631311577
02000
31202025
1711
9917384
11
675
1745
17691220
2386
411
10549
1
3044
34231
176381529
2
82
5552
32221298538
2029155
6283116780
185031212227
1271
5018389
11
675
1744
18301250
3400
412
11358
1
3064
34231
1783816292
83
5463
309212
100558
19510955
7203116850
160035222227
1271
6018297
11
725
1849
18701300
3393
412
11553
1
3024
25231
180372029
2
84
5741
327913
10357
820210060
730321793
01760
32212130
1361
601839
711
815
1858
19391400
3347
412
12062
1
3064
25331
182372130
2
85
5797
347313
105589
23510051
6503217940
200033222332
1421
5818477
11
795
1856
17801200
3350
412
15565
1
3234
38331
1843822302
DEVELOPINGNATIONS 5398 5602 5345 5192 5304 5492 5541 5419 5297 5152 5070 5394 5447
DEVELOPEDNATIONS 38S 430 370 426 430 341 447 459 386 400 393 347 350
NOTES: See Table 1.

TABLESEdibto arokJ area, 1961-85 (000 ha)
Country
WORLDAFRICABeninBurundiCent.Afr.Rep.ChadCote d'lvoireEgyptGabonGhanaGuineaLiberiaMadagascarMauritiusNigeriaRwandaSierra LeoneTogoZairnN. & C. AMERICABarbadosCubaDominicaDominican Rp,PanamaTrinidad Tob.SOUTH AMERICAFrench GuianaPeruVenezuelaASIAChinaCyprusJapanKorea Rep.LebanonMaldivesPhillippinesTaiwanThailandOCEANIAAmerican SamoaRjiKiribatiNew CaledoniaNiuePapua N.GuineaSalomom Is.SamoaTongaWallis Etc.DEVELOPINGNATIONS
DEVELOPEDNATIONS
61
686
SOS1
27169
13017
10042
130
1813443
12061410
1311
11
12462
040000
1840
3316010
181330
647
40 :
62
819
6313
27169
13817
10252
130
2953444
13061410
1311
i 11
12965
041
000
1940
3416010
191330
779
• 41
63
789
5953
27169
14017
10342
130
2573443
170
111410
1311
11
13065
140000
2040
3416010
191330
749
40
64
824
6231
2716
; 9i: 142
17
10542
130
2843443
170
101411
1311
11
13670
140000
2140
3515010
201330
784
40
65
832
6311
27169
14517
11042
130
2823444
180
111411
1311
11
13470
139
000
2040
3616010
211330
793
39
66
816
6111
27169
14717
12442
130
2463445
220
151411
1311
11
13370
139
000
1940
3715010
211340
777
39
67
854
6562
27159
14917
12242
130
288344//
7
16091411
1311
11
13270
139000
1930
3614010
2213
;; 4!! 0
815
39
68
815
6172
271510
15027
12742
130
2432447
180
101511
1302
11
12970
137000
1830
3715010
221440
778
37
69
891
6902
271610
17326
13042
130
2847447
16081511
1402
11
13475
137
000
1830
3815010
221440
854
37
70
1070
8733
271610
18216
26042
140
3288446
11032511
12039
135750
39000
1730
3815010
231440
1031
39
71
1032
8331
271610
18216
26042
150
2905546
11032511
13039
13675
040
000
1730
3915•-' o'• r0
231440
992
40
72
1061
8531
251610
18626
25842
140
3105546
17082511
14049
13880
037000
1830
3915010
231440
1024
37

Country
WORLDAFRICABenin
O BurundiCent.Afr.Rsp.ChadCote d'rvoireEgyptGabonGhanaGuineaLiberiaMadagascar /•MauritiusNigeria >RwandaSierra LeoneTogoZaireN.&C AMERICABarbadosCubaDominicaDominican Rp.PanamaTrinidad Tob.SOUTH AMERICAFrench GuianaPeruVenezuela
ASIAChinaCyprusJapanKorea Rep.LebanonMaldivesPhilllpplnesTaiwanThailandOCEANIAAmerican SamoaFijiKiribatiNew CaledoniaNiuePapua N.GuineaSalomom Is.SamoaTongaWallis Etc.DEVELOPINGNATIONS
DEVELOPEDNATIONS
73
1067
8661
271610
19125
26142
140
3154546
16072611
11046
13480
033000
1720
4015010
241440
1034
33
74
1145
9401
251610
24236
28442
120
3155557
18082611
12057
13583
031000
1730
4115011
241440
1113
31
75
1107
8912
271710
26136
20542
140
3205547
17072611
12048
145850
31000
2630
4115011
241440
1076
31
76 77 78 79 80 81 82
1107 1092 1139 1156 1142 966 979
874 851 888 904 895 725 736222
27 27 2717 17 1710 10 10
222225 24 24 2417 17 18 1810 10 10 10
273 273 300 313 324 154 153323778
33338888
167 147 155 158 137 134 1465 5.52 22
12 9 11000
55552222
11 12 12 120000
330 330 330 330 330 330 3305555554 4 4777
18 25 300008 14 202 2 26661 1 11 1 1
12 11 100 0 1433887'-'' \\
4577555544447888
32 27 23 200000
21 17 13 102222677711111111
11 10 11 11000033337778
161 162 168 " 167 166 162 16790 91 92000
93 95 96 98I 0 0 0 0
31 31 31 31 32 29 290 000 00000
37 37 38336000
42 42 431 1 15550001 1 11 1 1
25 25 251 1 1555444000
I 0 0 0 000000000
37 34 32 3454560000
44 44 45 4511115555000011111111
26 26 26 271111555544440000
1076 1061 1108 1125 1110 937 950
31 31 31 31 32 29 29
83
990
7452
241811
15938
14752
130
3307548
190
102511
12038
170100
029000
3560
4414011
271540
961
29
84
1003
7502
241810
1603 ,-8
15052
140
3307548
190
102511
13039
177105
029000
3670
4514011
271540
975
29
85
1024
7692
251810
160, 3' 8
12449
2140
3307548
210
102711
13039
175100
029000
3870
4716011
281540
995
29
NOTES: See Tablet

TABLESEdibtoaroid yield, 1961-85 (t/ha)
• Country
I WORLD
I AFRICABeninBurundiCent.Afr.Rep.ChadCoted'rvoireEgyptGabonGhanaGuineaLiberiaMadagascar
:< MauritiusNigeriaRwandaSierra LeoneTogoZaireN.&C AMERICABarbadosCubaDominicaDominican Rp.PanamaTrinidad Tob.SOUTH AMERICAFrench GuianaPeruVenezuelaASIAChinaCyprusJapanKorea Rep.LebanonMaldivesPhillippinesTaiwanThailandOCEANIAAmerican SamoaFijiKiribatiNew CaledoniaNiuePapua N.GuineaSalomon Is.SamoaTongaWallis Etc.DEVELOPINGNATIONS
DEVELOPEDNATIONS
61
6
575311
2067676864658
634
1077
11
51255
111114128
111056...
7664357
2237
13
6
12
62
6
575311
2567777754656
634
1066
11
51555
111113137
101056...
7664357
2238
13
5
13
63
6
575311
2158677
1164556
534
1066
11
6155,i5
1112121477
1055...
7664357
2248
13
6
14
64
6
575311
2568577
1164546
534
1066
11
5845
1011121268
1056...
7664357
2348
13
5
12
65
6
575311
2658777
1064556
534
1066
11
5855
1111221278
1056...
7664357
2348
13
6
12
66
6
575311
2858677
1164556
635
1066
11
6866
1111231397
1056...
7664357
2348
13
6
13
67
6
565311
2957687
1364556
635
1076
12
61166
1112231295
1056
7664357
2348
14
6
12
68
6
565311
2658687
1254556
634
1066
12
61066
1212211489
1057
...
7764357
2538
14
6
14
69
6
555311
2458687
1265556
634
1076
12
61066
1212151488
1058
10
7964357
2537
14
6
14
70
5
455311
2554687
1054556
734
1076
12
62566
1212191488
1057
10
7564357
2437
14
5
14
71
5
465311
2554687
1154556
735
1076
12
72756
12122114108
1058
10
7664337
2637
14
5
14
72
5
455311
2454676
1255556
533
1076
(,' 12
627
56
1212211498
1058
10
7664337
2637
14
5
14
,\ ' ^

Country
WORLDAFRICABeninBurundiCtnt.Afr.Rvp.ChadCot* d'lvoireEgyptGabonGhanaGuineaLiberiaMadagascarMauritiusNigeriaRwandaSierra LeoneTogoZaireN.4C. AMERICABarbadosCubaDominicaDominican Rp.PanamaTrinidad Tob.
SOUTH AMERICAFrench GuianaPeruVenezuelaASIAChinaCyprusJapanKorea Rep.LebanonMaldivesPhilippinesTaiwanThailandOCEANIAAmerican SamoaFijiKiribatiNew CaledoniaNiuePapua N.GuineaSalomom Is.SamoaTongaWallis Etc.DEVELOPINGNATIONSDEVELOPEDNATIONS
73
5
465311
2365776
1464556
633
1077
12
725
56
111222128
151058
10
7664337
2537
14
5
12
74
5
474311
2465786
1264556
633
1077
11
725
66
111215149
151059
10
7665317
2537
14
5
14
75
5
465311
2565786
1863566
634
1077
11
62156
101217129
15104
1110
7665327
2837
14
5
12
76
5
475311
2665787
1363456
635
1067
11
5765
1011171410151037
10
7675327
3037
14
5
14
77
5
476311
3065786
1963456
736
1077
11
6766
111316149
15103
1310
7665327
3037
14
5
14
78
5
475311
3165787
1164455
103
111067
11
5755
101326119
13104
1010
7475327
3137
15
5
11
79
5
475311
326568786
10454
939
1077
11
61165
111327149
14104
1010
7375327
3237
15
5
14
80
5
474311
3265787
1166453
839
1067
11
61165
111327149
12103
1010
7665327
3237
15
5
14
81
6
574311
3365686
1064453
738
1067
11
61166
111322139
14103
1010
7666427
3537
15
6
13
82
6
474311
3474786
1164553
635
1067
11
61166
111324149
16103
1010
7666427
3437
15
5
14
83
6
474311
3275786
1055553
736
1067
11
61156
111325149
181039
10
7666427
3347
13
5
14
84
6
474311
32756B6
1354554
736
1086
11
61156
111328129
17103
1010
7666327
3447
13
6
12
85
6
574311
3165187
1065554
736
1076
11
61156
101227129
171049
10
7666527
3447
13
5
12
NOTES: See Table 1.

TABLETPotato production, 1961-85 (0001)
Country 61
WORLD 270914
AFRICAAlgeriaAngolaBurundiCameroonCap* VerdeCtnt.Afr.Rap.ChadCongoCoted'lvoireEgyptEthiopiaKenyaLibyaMadagascarMalawiMauritaniaMauritiusMoroccoMozambiqueNigeriaReunionRwandaSenegalSouth AfricaSudanSwazilandTanzaniaTunisiaUgandaZaireZambiaZimbabweN.& C.AMERICABermudaCanadaCosta RicaCubaDominicaDominican Rp.El SalvadorGuatemalaHaitiHondurasJamaicaMexicoNicaraguaPanamaUnited StatesSOUTH AMERICAArgentinaBoliviaBrazilChileColombiaEcuadorParaguayPeruUruguayVenezuela
2021244
15312030800
392130194
147260
22
15011182
973
33222
21542
100173
20
157981
201216
113064
16229
30317
13305
70212072516
1080843551271
41492
11874
62
253328
2068250
15312030900
355132194
158562
22
21612193
744
33422
11841
110154
22
146871
21361788
084
14a2
38017
12018
64191184531
1134765872305
41416
87121
63
270401
2225206254032
31910
420134195
139264
25
22514203
666
39924
12052
110183
23
149731
20991786084
14429
41417
12306
65211453546
1168848573275
61427115111
64
284952
2119188304039
31
1010
376135190
139266
26
1881721
3305
39924
1265V
120183
22
136711
215718750
154
21529
41317
10941
70791492
5611264808867324
81531
100124
65
271233
2303233
30442330
1010
441138190
89168
24
27017223
435
38825
11658
120252
22
157961
20871983
0165
2362
13319
110
13211
80092489575
1246703762396
91568125136
66
282300
221917030441730
1110
324143195
9967028
27530233
573
411252
1868
13027
220
169801
249019
1040
185
2063
14348
19
13939
70491484549
1329803760347
101499142126
67
296621
2319204
31452530
1110
278148195
1010078
29
2053623
3107
5484
252
2979
13028
221
166011
213020
1040
204
2073
13399
16
13872
76571797520
1467717800399
101712
105133
68
304201
256627232451330
1220
472152195
129980
210
16031242
795
547253
4060
14029
120
164421
240821
1200
204
24747
41518
13402
80541967
5981606725850511
101592
52143
69
278942
2722224344125
20
1220
487156200
129784
26
3003925
2129
6525264
2661
140303
22
172211
23621995
023
427
749
48018
14181
84932340627
1507603831457
121856138124
70
298514
2954262344526
20
1220
549161218
109486
27
2754024
0126
661726
45567
150283
22
179701
25101677
023
330748
50816
14774
88562336655
1583684913542
41896118125
71
281744
2917274
344531
11
1220
451165200
2312583
29
2754126
1148
1606
237
6880
12830
323
172161
20661775
0243
2874
13479
112
14485
87701958698
1580836869681
31880
150115
72
273727
3240268
344738
10
1220
596170230
4913485
28
2804227
2131
3675
205
6010016230
324
161021
18692276
025
52174
16597
113
13443
75961340704
1589733823473
51713
106109
continued

Country 73
WORLD 312451
AFRICAAlgeriaAngolaBurundiCameroonCape VerdeCent.Afr.R0p.ChadCongoCote d'lvoireEgyptEthiopiaKenyaUbyaMadagascarMalawiMauritaniaMauritiusMoroccoMozambiqueNigeriaReunionRwandaSenegalSouth AfricaSudanSwazilandTanzaniaTunisiaUgandaZaireZambiaZimbabwe
N.& C.AMERICABermudaCanadaCosta RicaCubaDominicaDominican Rp.El SalvadorGuatemalaHaitiHondurasJamaicaMexicoNicaraguaPanamaUnited States
SOUTH AMERICAArgentinaBoliviaBrazilChileColombiaEcuadorParaguayPeruUruguayVenezuela
3572299354740
11
1220
79817526078
117235
210
2804327
1140
255922
67371
177323
25
164831
205623550
291024749
6401
1313608
77681535730
1337624
1031539
31713133124
74
293910
3687395353638
11
1230
70819028079
116240
29
2754227
2110
4648
216
7280
19932
325
188821
25112488
0301139
74
15603
216
15531
91302173749
167210121012503
41722
129152
75
284903
4029575
324540
11
1010
72020033389
122245
210
19540283
1505
71227
266
100221333
20
177591
220524
1170
277
4674
14693
29
14605
83111349834
1655738
1320499
41640
121152
76
291860
435649335464021
1111
89421034280
134250
312
1704230
3170
5684259
15510534533
324
195401
234725
1450
224
53748
6872
1116223
87701526824
1898539
1516499
41667166132
77
298740
455447240484021
1212
101121534199
148255
311
30040303
1775
757226
10485
267343
22
195471
252525
1370
122
63848
6312
1116118
91981769659
1896928
1609417
51616
120179
78
315621
4632473
35382520
1215
77322536189
181260
412
4745535
4219
7701
256
154105293
343
21
203931
251326
1980
124
6196
12923
29
16616
96401593738
2014981
1996343
71695
102171
79
320929
493550140422420
131
10101923536090
183260
48
5685735
5215
7696
256
21212513135
322
196751
275227
2010
114
51106
111053
212
15533
96001694730
2154770
1966255
91695
135191
80
264165
523959140202420
132
151214238350103166265
212
54365355
2178
686256
200120213363
20
176890
247827
2390
126
33987
10652
1713785
89341568787
1940903
1727323
91380
99199
81
286974
54545284023
10030
132
20119524052297
161268
216
3966535
5254
9659256
20013517536
320
193631
264728
2730
116
3498
12661
220
15450
105862247
867191210072100
3928
1705177171
82
288494
5856415
4035
14510
132
241184240640108201270
013
5396538
4269
10996
256
200110196383
25
202111
278129
2580
146
28997
9412
1716109
104251817900
2155842
2149416
91771
149217
83
287558
58574914036
17010
132
241095242600115253270
115
57260424
29610
851256
200150210393
23
188871
255642
2071
196
30998
8352
1615146
88832013316
1827684
2187314
81200109225
84
311559
60185214037
16030
132
241200
18263393
264272
121
5506044
5251
10980206
20013522540
323
204661
279830
2591
147
3099
12830
216
16448
107052118668
217110362463
3907
1463144245
85
2992236681
8004037
18031
142
241300210650110264274
123
57060426
27010
1112256
200150230
423
23
225651
295339
3071
117
3099
11840
215
18331
98552000
7211989909
1900385
61590164191
confinuea
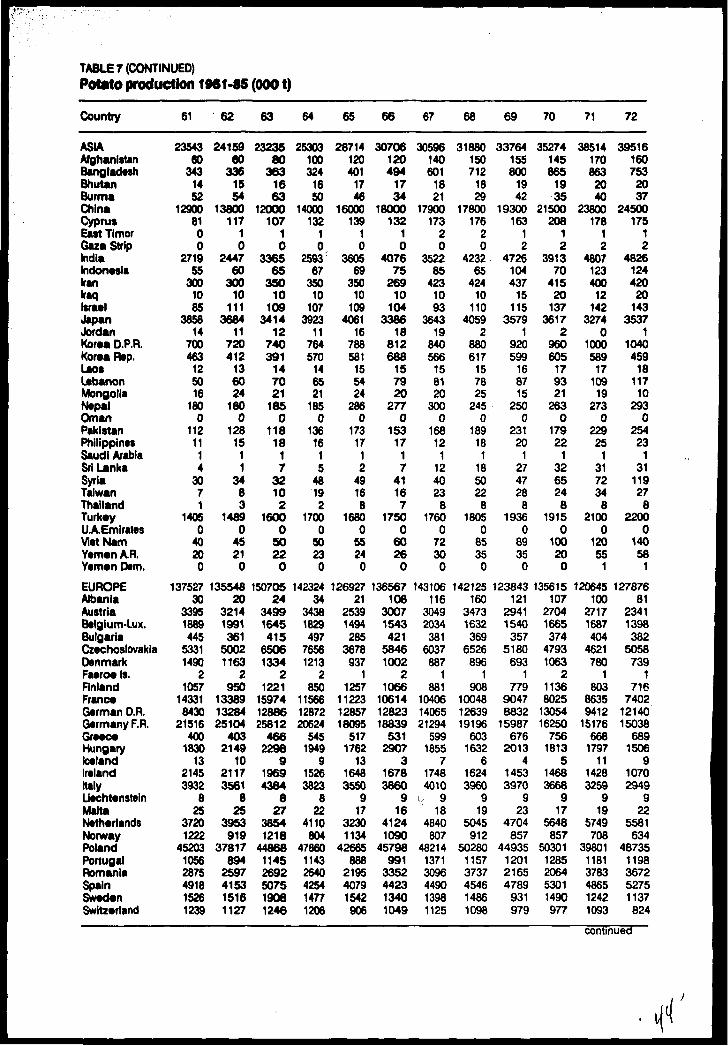
TABLE 7 (CONTINUED)Potato production 1961-85 (0001)
Country
ASIAAfghanistanBangladeshBhutanBurmaChinaCyprusEast TimorGaza StripIndiaIndonesiaIranIraqIsraelJapanJordanKorea D.P.R.Koraa Rep.LaosLebanonMongoliaNepalOmanPakistanPhilippine*Saudi ArabiaSri LankaSyriaTaiwanThailandTurkeyUAEmiratesVietNamYemen A.R.Yemen D*m.EUROPEAlbaniaAustriaBelgium-Lux.BulgariaCzechoslovakiaDenmarkFaeroe Is.RnlandFranc*German D.R.Germany F.R.GreeceHungaryIcelandIrelandItalyLiechtensteinMaltaNetherlandsNorwayPolandPortugalRomaniaSpainSwedenSwitzerland
61
2354300
3431452
129008100
271955
3001085
385814
700463
125016
1800
11211
14
3071
14050
40200
13752730
33951889445
53311490
21057
143318430
21516400
183013
21453932
825
37201222
4520310562875491815261239
62
2415960
3361554
13800117
10
244760
30010
1113684
11720412
136024
1800
12815
11
3483
14890
45210
13554820
32141991361
50021163
2950
133891328425104
4032149
1021173561
825
3953919
37817894
2597415315161127
63
2323580
3631663
12000107
10
336565
35010
1093414
12740391
147021
1850
11818
17
32102
16000
50220
15070524
34991645415
65061334
21221
159741288625812
4662298
919694384
827
38541218
4486811452692507519061246
64
25303100324
1650
14000132
10
259367
35010
1073923
11764570
146521
1850
13616
15
48192
17000
5023
0
14232434
34381829497
76561213
2850
115661287220624
5451949
915263823
822
4110804
4786011432640425414771206
65
28714120401
1746
16000139
10
360569
35010
1094061
16788581
155424
2860
17317
12
49168
16800
5524
0
12692721
25391494285
3678937
11257
112231285718095
5171762
1316483550
917
32301134
42665888
219540791542906
66
30706120494
1734
18000132
10
407675
26910
1043386
18812688
157920
2770
15317
17
41167
17500
60260
136567108
30071543421
58461002
21066
106141282318839
5312907
316783860
916
41241090
45798991
3352442313401049
67
30596140601
1821
17900173
20
352285
4231093
364319
840566
158120
3000
16812
1124023
81760
072300
143106116
30492034
3816037887
1881
104061406521294
5991855
717484010
Vr 918
4840807
4821413713096449013981125
68
31880150712
1829
17800176
20
423265
42410
1104059
2880617
157825
2450
18918
1185022
81805
08535
0
142125160
34731632369
6526896
1908
100481263919196
6031632
616243960
919
5045912
5028011573737454614861098
69
33764155800
1942
19300163
12
4726104437
15115
35791
920599
168715
2500
23120
1274728
81936
08935
0
123843121
29411540
3575180
6931
77990478832
15987676
20134
14533970
923
4704857
44935120121654789
931979
70
35274145865
1935
21500208
12
391370
41520
1373617
2960605
179321
2630
17922
13265248
19150
100200
135615107
27041665374
47931063
211368025
1305416250
7561813
514683668
917
5648857
503011285206453011490977
71
385141708632040
23800178
12
4807123400
12142
32740
1000589
17109
19273
022925
1317234
82100
012055
1
120645100
27171687404
4621780
1803
86359412
15176668
179711
14283259
919
5749708
3980111813783486512421093
72
39516160753
2037
24500175
12
4826124420
20143
35371
1040459
18117
10293
025423
131
11927
82200
014058
1
12787681
23411398382
5058739
1716
74021214015038
6891506
910702949
922
5581634
487351198367252751137824
continued

Country
ASIAAfghanistanBangladeshBhutanBurmaChinaCyprusEast TimorGaza StripIndiaIndonesiaIranIraqIsraelJapanJordanKorea D.P.R.Korea Rep.LaosLebanonMongoliaNepalOmanPakistanPhilippinesSaudi ArabiaSri LankaSyriaTaiwanThailandTurkeyUAEmiratesVietNamYemen A.R.Yemen Dem.
EUROPEAlbaniaAustriaBelgium-Lux.BulgariaCzechoslovakiaDenmarkFaeroe Is.RnlandFranceGerman D.R.Germany F.R.GreeceHungaryIcelandIrelandItalyLiechtensteinMaltaNetherlandsNorwayPolandPortugalRomaniaSpainSwedenSwitzerland
73
46420165
''! 7592150
31700163
12
4451173481
••' 35165
34180
1052470
1811735
2920
241250
26110277
22000
15064
1
12901281
21171476328
5087778
1669
73591140113676
7651355
613322889
1020
5771672
51928114826445579947910
74
49227175730
2158
34500152
12
486112053325
1522942'
41100469
179423
3040
239202
27105266
22750
18064
1
131099104
19961796345
4522928
1525
75011340414549
7781720
1311112849
1020
6095847
485191184411956931257929
75
55311195880
2246
38200117
03
622512450644
1633261
51200660
123541
3070
28920
022
12540
52490
0200
712
109818108
15791300318
3565696
1680
66427673
10853878
16306
10182900
1018
5003435
46429109827165338837908
76
60553354903
2255
41000200
03
730615455074
1753742
91300569
203036
3140
32119
128
132443
28500
26076
5
112589115
1746879350
4214606
1948
43266816980810181396
711792923
1022
4858521
499511003478856591058769
77
64336200735
2357
45000216
03
7171248697
64214
35208
1400558
224545
2691
318190
29164306
28001
369100
4
116449117
13521680383
3760954
1737
78031031311368
10161650
815313080
1020
5842651
411481292420758811279713
78
725962509142354
51950163
04
8135233932104221
331610
1488304
287049
2711
29420
529
199296
27502
630107
5
121219119
14011575391
3995932
1746
74671077710510
9081883
1310082843
1117
6231625
466481225446553641339893
79
70741265909
2455
47500190
05
10133204997
88211
33817
1500356
3111272
2791
39232
438
235367
28703
684116
6
124014119
14941460424
3725844
1674
71481224310205
9681512
611433020
1122
6277473
495721110456256371284871
80
70936283917
24121
48500208
05
8327230
127097
1723421
131546446
3413538
2781
449373
5129236
73000
1862127
5
9326699
12641450301
2695842
1736
66189214793210841392
15880
29231127
6267571
263911200413557371084853
81
68643300999
25139
45000220
04
9599217
1540104218
30957
1560554
3514040
2751
39437
466
311287
30002
577138
7
111707119
13101494403
37431053
1478
643910378842210561608
11665
28791115
6445529
42562928
4447547012061048
82
72951310
109625
12448000
21506
9912180
181493
2003775
81600539
4012675
3201
477413
77279
307
30003
418150
9
99702101
11211614469
36081229
1601
67978883782110211459
14855
25721112
6219526
319511082500652221036960
83
74851315
114926
14050000
23006
9956219
1740105199
356613
165041944
12598
3731
518344
90315228
30503
262163
10
95050136
10121208427
3177853
1804
57317063629911061234
12639
25021115
5412470
34473100762095163939711
84
75343320
116627
15648000
23507
12152180
1550120198
370717
1700436
46120126383
151042
568
322368
32003
291195
16
112191135
11381648418
39781121
1745
696411908805010531551
13800
24501214
6673489
374371138639159801307923
85
74623330
116027
17345500
26008
12642190
1550115200
373512
1850575
49120114420
1520487
70394
288
41003
235165
15
111212136
10421700380
34501073
1708
781411500870411001371
14700
23971213
7150470
365461239668357811117848
continued
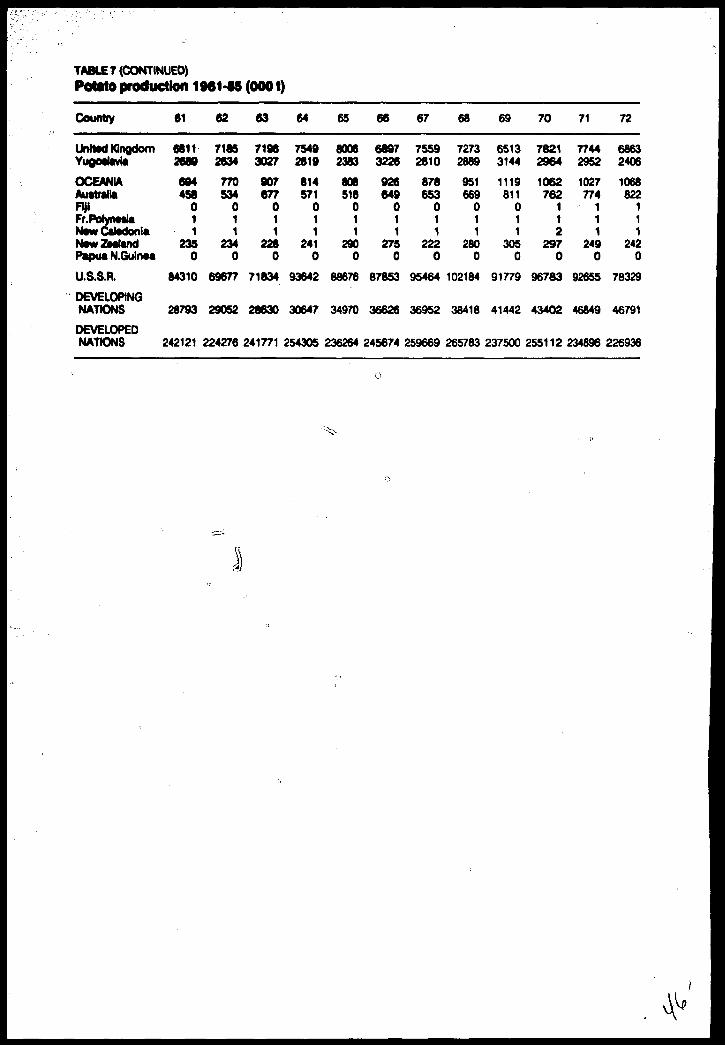
TABLE 7 (CONTINUED)Potato production 1M1-S5 (0001)
Country 61 62 63 64 65 66 67 68 69 70 71 72
United Kingdom 6811 7185 7186 7549 8006 6897 7559 7273 6513 7821 7744 6863 Yugotltvi* 2689 2634 3027 2819 2383 3226 2810 2889 3144 2964 2952 2406
OCEANIA Australia
604 770 907 814 808 926 878 951 1119 1062 1027 1068458 534 677 571 516 649 653 669 811 762 774 822
FijiFr.PoryrwtiaN*w CaledoniaNawZtalandPapua N.Gulrwa
011
2350
011
2340
011
2280
011
2410
011
2900
011
2750
011
2220
011
2800
011
3050
112
2970
111
2490
111
2420
U.S.S.R. 84310 69677 71834 93642 88676 87853 95464 102184 91779 96783 92655 78329
DEVELOPINGNATIONS 28793 29052 28630 30647 34970 36626 36952 38418 41442 43402 46849 46791
DEVELOPEDNATIONS 242121 224276 241771 254305 236264 245674 259669 265783 237500 255112 234896 226936

ICountry 73 74 75 76 77 78 79 80 81 82 83 84 85
United Kingdom 7091 7157 4787 4789 6621 7331 6485 7105 6214 6875 5857 7398 6850 Yugoslavia 2074 3127 2394 2828 3034 2501 2724 2440 2774 2636 2580 2458 2413
OCEANIA 997 863 972 950 1005 1016 1006 1079 1082 1165 1122 1321 1287858 1020 992 122 333 222
256 295 288 001
U.S.S.R. 106201 81022 88703 85102 83652 86124 90956 67023 72139 78185 82908 85515 73000
DEVELOPINGNATIONS 54441 59147 64470 70053 74507 83901 82384 82265 81784 85590 86165 88407 87400
DEVELOPEDNATIONS 258010 234763 220433 221807 224233 231720 238545 181901 207190 202905 201392 223153 211822
NOTES: Saa Table 1. ~
Auttralia Rji Fr.PolynatiaNawCaladonla NewZaaland Papua N.Gulnta
721 1 2 2
271 0
649 1 2 2
208 0
742 12 1
226 0
697 2 2 1
248 0
728 2 2 2
270 0
772 2 42
237 0
798 2 41
203 0
857 24 3
214 0
866 2 3 2
209 0
919 1 4 3
239 0

TABLESruwo BIN, ivoi-oa \vu» nmj
Country
WORLDAFRICAAlgeriaAngolaBurundiCameroonCape VerdeCtnt.Afr.Rtp.ChadCongoCot* d'rvoirtEgyptEthiopiaKenyaUbyaMadagascarMalawiMauritaniaMauritiusMoroccoMozambiqueNigeriaReunionRwandaSenegalSouth AfricaSudanSwazilandTanzaniaTunisiaUgandaZaireZambiaZimbabweN. & C. AMERICABermudaCanadaCosta RicaCubaDominicaDominican Rp.El SalvadorGuatemalaHaitiHondurasJamaicaMexicoNicaraguaPanamaUnited States
SOUTH AMERICAArgentinaBoliviaBrazilChileColombiaEcuadorParaguayPeruUruguayVenezuela
61
23700
2672338700200
2326273
112000
15320
190
441156
11302
7900
1252
100113001
4601
599
967203108191964932
1258
209
62
23576
2892538700200
2426273
122100
23220
160
511166
12302
7270
117280114001
4601
545
938143109196
917533
1253
2016
63
23552
3042259900200
252728
3122100
25320
261
511166
12302
7200
117280114001
5001
536
961166112200896932
22542315
64
23070
28127
59
1000210
2327273
1322
00
18320
131
401187
13302
6960
113270215001
4801
515
10001791102098576392
2622515
65
22847
286285
10900210
242827
21323
00
26320
141
351157
13402
7410
121280215001
3901
560
1018204115202
9167442
2512616
66
22832
286255
11700310
2228282
132301
26420
100
381158
15502
7860
130290315012
4101
592
970165110199767644
22552616
67
22454
300325
11400300
1729282
1425
01
24520
171
411189
15502
7780
124290315001
4101
591
999163103217777948
12722216
68
22363
32040
512600300
282928
21425
01
20420
181
3811
119
16502
7480
124^
70316011
4201
560
1019200
88227
808149
1262
1517
69
22024
340435
12900300
303028
21425
00
28620
171
432289
16601
7690
1252
100317011
4601
573
1055203
92221
767941
1304
2216
70
22288
358425
111000300
323031
2152600
28620
181
4622
159
17501
7750
129280307011
4801
575
102719095
214728447
1289
2114
71
21723
366445
111300300
2831283
2026
01
28620
210
4212
161017602
7410
110290307011
4301
563
103017997
208808853
1286
2414
72
21846
385505
111500300
35323210282601
20620
191
3712
151017602
6820
100250406012
5401
507
976147112202799038
1271
2313
continued

Country
WORLDAFRICAAlgeriaAngolaBurundiCameroonCape VerdeCent.Afr.Rep.ChadCongoCote d'K/oireEgyptEthiopiaKenyaUbyaMadagascarMalawiMauritaniaMauritiusMoroccoMozambiqueNigeriaReunionRwandaSenegalSouth AfricaSudanSwazilandTanzaniaTunisiaUgandaZair*ZambiaZimbabweN. & C. AMERICABermudaCanadaCosta RicaCubaDominicaDominican Rp.El SalvadorGuatemalaHaitiHondurasJamaicaMexicoNicaraguaPanamaUnited StatesSOUTH AMERICAArgentinaBoliviaBrazilChileColombiaEcuadorParaguayPeruUruguayVenezuela
73
22165
46253
5111400300
45323716257001
20620
190
4013
201020602
7130
106260417111
5501
528
935117116189679944
1268
2512
74
22428
47860
5101300300
40334016247001
20620
201
4513
251022602
7650
1152
11041
10111
5402
563
970127118192939239
1268
2614
75
22029
514705
111500300
41344619217201
19620
231
4811
211035601
7050
10629040
11112
5701
510
94211112819172
11039
1251
2614
76
21205
548695
111500300
543547142274
01
16620
261
4813
271048602
7500
1072
11030
13111
5601
555
963108130200
68125
410
2532613
77
21846
557756
111500300
643647172274
01
25620
271
5013
181134
702
7520
1122
12020
15111
5401
550
97111112519686
13036
1247
2316
78
22006
5697368
1000301
55374816307501
34630
321
5013
221037701
7720
1113
10020
16111
6901
556
1029115157211
9114230
1247
1916
79
21813
57677
6111000301
603849143075
01
40530
301
5013
301021702
7450
1133
13020
14111
8701
509
1013110163204
8114827
1242
2117
80
20750
5907668
1200301
70394815297601
38630
321
5013
301124
701
6840
1073
14010
10111
8002
464
95611216918189
14230
1194
2018
81
20458
6497769
4000302
67396315267701
28630
411
7013
309
25701
7090
1113
160107111
6801
499
98511717717190
16032
1202
2115
82
20471
707746
107500302
64397615297801
38630
401
7013
301025702
7240
1133
150106111
6802
513
98610215918377
16535
1225
2117
83
20520
71977
6107000302
584078153978
01
40630
411
7013
301030
702
7190
1134
130206111
7402
503
83210810816967
16127
1156
1917
84
20364
726726
107000302
703672154179
01
42630
371
7513
301230802
7440
1182
160106111
7002
527
91411414317381
16033
1172
1919
85
20115
778976
117500302
72378016418001
44630
401
7513
301432
802
7700
1213
150106111
7002
550
93211419815763
13935
11892214
comTnuea

TABLES (CONTINUED)Potato area, 1961-85 (000 ha)
Country
ASIAAfghanistanBangladeshBhutanBurmaChinaCyprusEast TimorGaza StripIndiaIndonesiaIranIraqIsraelJapanJordanKorea D.P.R.Korea R«p,LaosLebanonMongoliaNepalOmanPakistanPhilippinesSaudi ArabiaSri LankaSyriaTaiwanThailandTurkeyUAEmiratesVietNamYemen A.R.Yemen Dem.
EUROPEAlbaniaAustriaBelgium-Lux.BulgariaCzechoslovakiaDenmarkFaeroe Is.FinlandFranceGerman D.R.Germany F.R.GreeceHungaryIcelandIrelandItalyLiechtensteinMaltaNetherlandsNorwayPolandPortugalRomaniaSpainSwedenSwitzerland
61
38GB6
562
192800
700
3751517
14
2182
7248
262
410
15201310
1470340
88834
1727241
51372
077
890682977
56269
186
37903
13353
2819108301416
8751
32
39566
562
212900
900
3651517
15
2162
7348365
410
14301310
1370340
89314
1696843
506620
74862742964
56238
185
37703
13050
2910102305409
8149
63
41098
582
203000
1200
4131720
15
2092
7545
373
420
13301410
1400340
89033
1616143
50264
077
844747925
57263
183
38603
13452
28401073324118247
64
402910553
162900
900
4151820
15
2212
7847363
420
15301520
1450340
84934
1585341
49154
071
691745852
58248
174
35603
12549
2830109321365
6945
65
42811255
315
3125900
4291920
15
2132
8060
343
430
19301411
1450440
78594
1455037
22441
073
575725783
56245
171
34803
12548
2765101312368
6239
66
44941261
314
3300900
4791915
14
1962
8260
263
420
17301411
1500440
785212
1375534
43640
068
53769473255
2370
68347
03
13145
2712109317375
5439
67
42011470
38
30001100
4732225
14
1832
8358
273
430
19301421
1500440
779716
1345833
40737
065
515686707
56208
165
33903
13840
2741126322376
5538
68
43401576
37
31001200
5011625
15
1880
8560
283
430
20302421
1480540
758122
1305031
37235
065
471672659
54183
059
31903
14738
2720115334382
5637
69
44811684
39
32001000
5242325
15
1780
8856
393
430
21303421
1570640
722122
1134529
32534
058
420604589
55177
155
30613
14533
2718115321377
5333
70
4723158538
35001100
4961326
15
1590
9054393
460
17303621
1550640
728720
1104931
33737
060
361667597
59174
157
28613
15834
2732120301397
5331
71
46351587
39
3400900
4821822
16
1560
9352393
490
20403631
1690860
700916
1054429
331320
50347658554
51155
152
23813
15431
2669116307394
5029
72
50371576
38
3800900
492172426
1520
9543
393
510
233
> O/\ fa
//2x/'\1\Vv/5
0850
675715
1013930
320290
4831064750352
1221
44194
13
14929
26561203134014526
continued

Country
ASIAAfghanistanBangladeshBhutanBurmaChinaCyprusEast TimorGaza StripIndiaIndonesiakanIraqIsraelJapanJordanKorea D.P.R.Korea Rep.LaosLebanonMongoliaNepalOmanPakistanPhilippinesSaudi ArabiaSri LankaSyriaTaiwanThailandTurkeyU.A. EmiratesVietNamYemen A.R.Yemen Oem.EUROPEAlbaniaAustriaBelgium-Lux.BulgariaCzechoslovakiaDenmarkFaeroe Is.RnlandFranceGerman D.R.Germany F.R.GreeceHungaryIcelandIrelandItalyLiechtensteinMaltaNetherlandsNorwayPolandPortugalRomaniaSpainSwedenSwitzerland
73
527015803
104000
900
5052225
46
1470
10042393
510
23403821
1800
1060
672213844427
304320
46318650481
56124
148
18212
15729
26781172984094525
74
55141680
311
4200700
5431829
36
1381
10043
394
530
233-"•• o3821
1850
1560
667416824231
27733
048
314635467
56137
140
18112
14230
2684120310407
4724
75
558817943
114200
600
587173255
1390
10052
294
540
28303931
1780
1870
632216693730
250310
4928857441557
1301
41179
12
15123
25811233053854225
76
555220963
114100
1000
622203185
1380
10549365
530
29303
1030
1860
2570
626016733929
240350
5328159941565
1151
47174
12
16126
24661303013914625
77
616719773
124700
1000
620225066
1311
11550
366
520
26303
1331
1800
4090
628716604334
23438
046
299587400
69122
153
18513
17026
2437136306403
4724
78
65631890
311
5000700
6652666
76
1281
11839
477
500
30303
1521
1800
6590
598516573737
22034
044
277579355
64116
141
17213
16223
2360130305371
4524
79
654419974
114800
800
8072271
66
1250
12034
477
510
38404
1431
1690
10310
1
592516583839
213320
4327554932563
1051
41169
12
16620
2441117294355
4224
80
585419964
124200
900
685248755
1231
12537
477
510
43405
1931
1830
82110
568516533935
19534 ,0
41229513306
6593
142
16113
17220
2344123286355
4125
81
572320
1024
144000
1000
73230
'/ "(/ 5
5126
013041
495
500
38405
2221
1800
7212
1
549317503636
198,i 36
037
211505274
6288
135
15312
16520
2258118299343
4125
82
574820
1084
154000
1000
76323
11655
1270
13036598
520
45406
1721
1800
4512
1
540216463840
19835
039
2105042656284
137
14812
16621
2178125311338
4124
83
593720
1094
154198
1100
73528
11554
1281
13530
58
10590
52407
2021
1850
3212
1
538416413541
192300
452044832496577
132
14712
16321
22201253193404024
84
580222
1104
174000
1000
79425
11075
1311
14026
58
10590
50406
1821
1900
31132
529914413740
19331
041
210488243
6077
135
13912
16019
2147126312348
4023
85
594225
1114
184000
1200
85326
11076
1301
1453168
10660
50406
2321
245, 0
2812
1
521016384540
186300
392084802436070
130
13712
16919
20951313203233923
continued
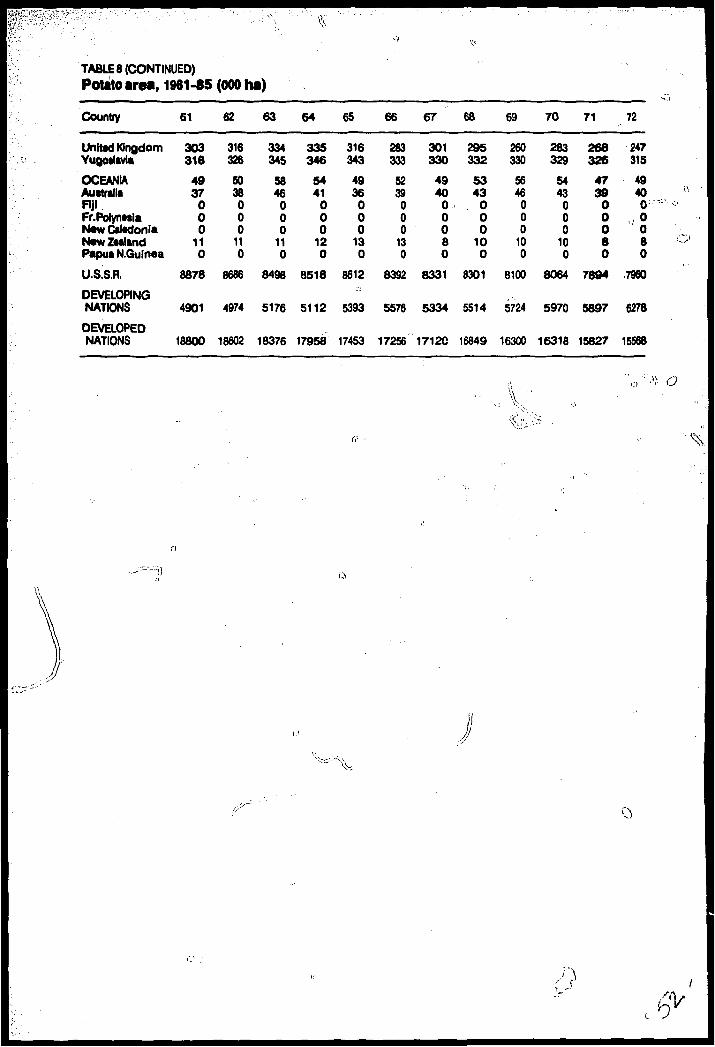
TABLE 8 (CONTINUED)Poutoarea, 1961-85 (000 ha)
Country
United KingdomYugoilaviaOCEANIAAustraliaFijiFr.PorynttiaNawCatedoniaNawZMlandPapua N.Guinea
U.S.S.R.
61
303318
4937
000
110
8878
62
316326
5038000
110
8686
63
334345
5846
000
110
8498
64
335346
5441
000
120
8518
65
316343
4936000
130
8612
66
283333
5239
000
130
8392
67
301330
4940
00080
8331
68
295332
5343000
100
8301
69
260330
5646
000
100
8100
70
283329
5443
000
100
8064
71
268326
4739
00080
7894
72
247315
49400
>> ~080
7960
DEVELOPING NATIONS 4901 4974 5176 5112 5393 5576 5334 5514 5724 5970 5897 6278
DEVELOPED NATIONS 18800 18602 18376 17958 17453 17256 1712C 16849 16300 16318 15827 15568
V» o
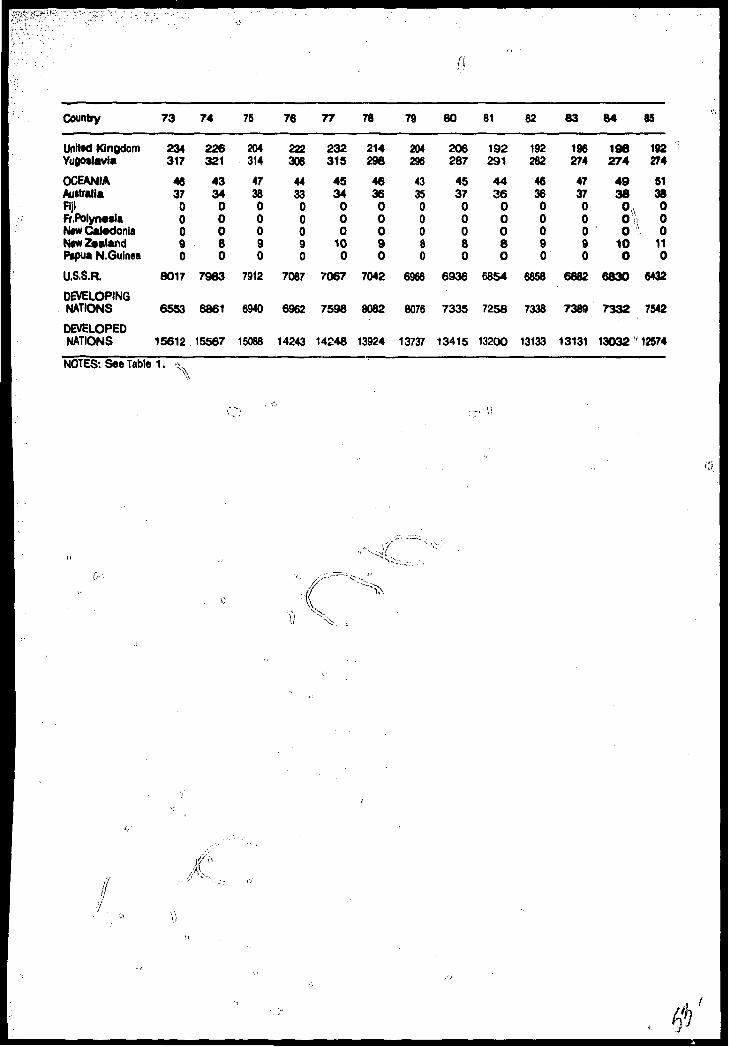
I
Country 73 74 75 76 77 78 79 80 81 82 83 84 85
Unttad KingdomYuootiaviaOCEANIAAustraliaFIJIFr.PolyneaJaN»w CaledoniaN«w ZealandPapua N.GuineaU.S.S.R.
234317
4637
00090
8017
226321
4334
00080
7983
204314
473800090
7912
222306
4433
00090
7087
232315
4534
000
100
7067
214298
463600090
7042
204296
433500080
6966
206287
4537
00080
6936
192291
4436
00080
6854
192282
463600090
6858
196274
4737
00090
6882
198274
4938
O sOYi0
100
6830
192274
5138000
110
6432
DEVELOPINGNATIONS 6553 6861 6940 6962 7598 8082 8076 7335 7258 7338 7369 7332 7542
DEVELOPED NATIONS 15612 15567 15088 14243 14248 13924 13737 13415 13200 13133 13131 13032 ' 12574
NOTES: See Table 1. -x "

TABLE 9Potato yieW, 1961-S5 (t/ha)
Country
WORLDAFRICAAlgeriaAngolaBurundiCameroonCape VerdeCtnt.Atr.R»p.ChadCongoCoted'hoir*EgyptEthiopiaKtnyaLibyaMadagascarMalawiMauritaniaMauritiusMoroccoMozambiqueNigtriaRtunionRwandaSenegalSouth AfricaSudanSwazilandTanzaniaTunisiaUgandaZaireZambiaZimbabwe
N.&C. AMERICABermudaCanadaCosta RicaCubaDominicaDominican Rep.El SalvadorGuatemalaHaitiHondurasJamaicaMexicoNicaraguaPanamaUnited StatesSOUTH AMERICAArgentinaBoliviaBrazilChileColombiaEcuadorParaguayPeruUruguayVenezuela
61
11
811543
10242...
17>57573
188
10498598
16337969
10
20111610115765
155674
1022
710569
1183668
62
11
710543
10142
• ••
1557573
19895
1084
126
1623795
109
209
1810115774
165684
1022
78568
1293648
63
11
79544
10242in
1757563
191395
1083
128
1723896
1210
219
1610115874
155
1084
1023
7956
10894658
64
12
87644
10242ti>
1657573
2012106
1162
101017238969
13
209
1910115774
165794
1021
7856
101184648
65
12
88643
10242...
1657473
209
106
11153
11111823897
1013
21111710115784
156984
1024
812568
1194658
66
12
87642
10243...1457473
2016118
121569
111834995
1011
22151910125784
156894
1024
7957
111085668
67
13
86646
10244...1657573
211698
121477
121834995
1013
2113171012
5784
156
12104
1023
811579
1088658
68
14
87642
10255
• «*
1757573
201787
121357
1418347957
13
22131910165774
1568
104
1024
810779
10108648
69
13
85643
13256...1657673
2113117
131189
1217237959
15
229
1910105774
166
10104
1025
812778
11118668
70
13
86643
13257...1757763
2116107
12979
1317347958
15
2319199
105774
1579
114
1026
91277
1011113769
71
13
66642
10258
**•
1557763
2016107
131377
1418446859
15
2320191085784
157
10114
1026
91178
1010134768
72
13
85643
10257IK
1757553
1814147
141175
181634
111059
15
242019101557
164
1589
114
1126
896899
136658
confinuea
(A

Country
WORLDAFRICAAlgeriaAngolaBurundiCameroonCap* VerdeCtnt.Afr.Rtp.ChadCongoCot* d'lvoireEgyptEthiopiaKenyaLibyaMadagascarMalawiMauritaniaMauritiusMoroccoMozambiqueNigeriaReunionRwandaSenegalSouth AfricaSudanSwazilandTanzaniaTunisiaUgandaZaireZambiaZimbabweN. & C. AMERICABermudaCanadaCosta RicaCubaDominicaDominican Rep.El SalvadorGuatemalaHaitiHondurasJamaicaMexicoNicaraguaPanamaUnited States
SOUTH AMERICAArgentinaBoliviaBrazilChileColombiaEcuadorParaguayPeruUruguayVenezuela
73
14
86643
10257
**•
1857553
1517147
14975
1417247959
15
232019121057
174
1457
125
1026
813679
1012665
10
74
13
87643
10258
**•
1867553
1317147
1413
55
1417238959
15
25192211
857
174
145
11115
1128
91769
111113765
11
75
13
88643
12245
««•
1767563
1215107
141776
152123
10659
15
251621121257
184
1457
124
1129
91279
101213775
11
76
14
87643
212458
1767663
1315107
141976
141936
11759
15
262022121457
184
1357
124
1329
9146
108
1212876
11
77
14
86743
192559
1667673
1315127
141876
1517267859
15
26162311115794
1558
124
1129
9165
101112128
• 75
11
78
14
86643
17255
101468663
1717149
14217
11141927
11859
15
261523101957
134
1578
134
1230
9145
10111412975
11
79
15
96742
17255
101767663
111614111426
711141927
13659
15
261324101557
144
17119
124
1431
9154
1110139976
12
80
13
98732
17256
111767763
101714121421
713141927
11959
15
266
23101759
203
15147
134
1130
9145
11101211975
11
81
14
87733
17256
111868663
1021141114206
16121927
15759
15
279
249
1758
205
15101013
42031
11195
11111312988
11
82
14
86742
11256
1219
..;;.: 687734
23141114177
16141927
11859
15
2811259
175
12195
15139
144
1231
11186
12111312987
13
83
14
867428256
1219688735
20141014147
14121927
16759
15
26102312165
11195
151210114
1130
11193
11101412
986
14
84
15
87742
23256
1217596634
2513101521
714131827
12859
15
27102414165
1219
515129
124
1131
12195
13131512898
13
85
15
98742
17266
1218687634
2713101421
714151927
11759
15
2910241521
513195
15129
124
1033
11184
13141411787
14
continued

TABLE 9 (CONTINUED)Potato yWd, 1961-85 (t/ha)
Country
ASIAAfghanistanBangladeshBhutanBurmaChinaCyprusEast TimorGaza StripIndiaIndonesiaIranIraqIsraelJapanJordan
, Korea D.P.R.• Xorea Rtp.LaosLsbanonMongoliaNepalOmanPakistanPhilippinesSaudi ArabiaSri LankaSyriaTaiwanThailandTurkeyUAEmiratesVietNamYemen A.R.Yemen Dem.
EUROPEAlbaniaAustriaBelgium-Lux.BulgariaCzechoslovakiaDenmarkFaeroe Is.RnlandFranceGerman D.R.Germany F.R.GreeceHungaryIcelandIrelandItalyLiechtensteinMaltaNetherlandsNorwayPolandPortugalRomaniaSpainSwedenSwitzerland
61
6106635
114it*
74
181019188
101068
104.,,
7595
1298
10iti
1365
157
20261110211314161222
77
19251020
82823161010121824
62
6106635
134
«»*
74
181021176
1095
1054!••
9692
1188
11***
1565
155
19298
1019141316182679
14259
208
30181399
101923
63
610663494
>*>
84
181021168
1096
1184
11*
9799978
11**t
1765
178
2227101321141619172889
13241120
9292416118
122327
64
6106635
144it*
64
181024187
10126
1184
• *.
9696
10127
12*it
1765
179
22341216221212171724
98
122111207
33161710
B122127
65
7107635
164
• >•
84
181022191010106
1297in
9793
11136
12tii
1465
166
1830
816231317201823
97
18231022
626231597
112523
66
7108635
158ii*
94
181024171010117
1377
**i
97999
138
12nt
1575
179
2228121325161620182610129
251122
63224179
11122527
67
7109636
158in
74
171021201110107
1267„.
9598
11128
12in
1885
187
23351115241414202030119
132712227
3520181110122630
68
7109646
158
,,,
84
17102322
510107
1086
Ml
969
1011118
12tii
1795
197
27331218261514211929119
16271223
73424181011122630
69
8109656
168
1695
17152420
210116
1056
*.•
11799
11128
12• •<
1595
176
263412162114132215271211
82613189
322617107
131830
70
71010646
198
1785
161528232011117
1076
Ml
11
88
1011108
12HI
1755
195
253412142917192220271310
82613187
362618117
132832
71
81110757
201418107
181226211311117
1266*ii
1178
1012128
12in
1595
176
2638141425131625142713128
2814197
3723151012122538
72
81110656
198
18107
181026231111117
1346...
11789
15128
13ti*
18125
195
2336131625131524193013128
2415199
3722181012132532
confinuea

Country
ASIAAfghanistanBangladeshBhutanBurmaChinaCyprusEast TimorGaza StripIndiaIndonesiaIranIraqIsraelJapanJordanKorea D.P.R.Korea Rsp.LaosLebanonMongoliaNepalOmanPakistanPhilippinesSaudi ArabiaSri LankaSyriaTaiwanThailandTurkeyUAEmiratesVietNamYemen A.R.Yemen Dem.EUROPEAlbaniaAustriaBelgium-Lux.BulgariaCzechoslovakiaDenmarkFaeroe Is.RnlandFranceGerman D.R.Germany F.R.GreeceHungaryIcelandIrelandItalyLiechtensteinMaltaNetherlandsNorwayPolandPortugalRomaniaSpainSwedenSwitzerland
73
91110
. 75B
197
1898
19102923
411117
13106
• •*
10688
13127
12• ••
15125
196
2533121725131523182814119
2816199
372319109
142136
74
9119758
218
1897
188
2721
611117
1166»t
10678
12127
12• ••
12115
207
244311162815112421311413132816198
4329181013142739
75
10119749
19• *i
18117
168
33231112137496*it
10637
13137
141511119
177,23 '
35111422131423132615139
2516198
33191899
142037
76
1118975
1020i«»
18128
181032272112127586
***
11659
13137
1517101117
187
2422121817141815112416129
2517199
3020208
16142331
77
10111075
1023in
1812111411332713121177853
126
...9
13101116219
1213
198
223911162514162618281513102917198
3425171014152730
78
11141075
1024it*
14129
14153426151388
11753
106
11101412111518101210
208
254311182714172719301416132416197
3927209
15143037
79
1114975
1023***
15139
141535271513118
161053
108
129
16121117197
1210
218
2639111827141626223115148
2818199
3824209
16163136
80
1215107
101223it*
17129
152134281712128
19553
1098
111612111615101211
166
24379
14251418291826171515211819113628111014162735
81
1215107
101123it*
20137
161940251812148
16963
1010101214121117108
1212
207
264211192914133121311718131919197
392619
815162943
82
13161079
1222it*
16138
161942301712159
151063
11107
1217141117129
1211
186
254312183614153218301617152317197
3725159
16152640
83
13161179
1222i**
16148
152045281912149
151063
108
101316111116108
1312
189
253410172814182815251716122017198
3322168
19152330
84
13151179
1223
• •*
16157
141737281912179
151374
1011161117151117109
1511
219
284411213614183324331820132318197
4226179
20173340
85
1313107,
101122• ii
17157
141636291913199
151164
1011161217141117108
1311
219
283810193614183824361819142317197
4225179
21182937
continued

1TABLE 9 (CONTINUED)Potato yMd, 196145 (t/ha)
Country
United KingdomYugoslaviaOCEANIAAustraliaFIJIFr.PoryiMSiaNawCaMoniaNswZsalandPapua N.Guintau.s.s.aDEVELOPINGNATIONS
DEVELOPEDNATIONS
61
226
14125
106
217
9
6
13
62
238
16145
106
216
8
6
12
63
229
16155
108
205
8
6
13
64
238
15145
109
204
11
6
14
65
257
16154
107
224
10
6
14
66
2410
18175
108
214
10
7
14
67
259
18165
107
286
11
7
15
68
259
18165
108
293
12
7
16
69
2510
20185
10B
301
11
7
15
70
289
20186
109
307
12
7
16
71
299
22206
106
307
12
8
15
72
288
22206
128
3111
10
7
15

I
Country
UnHtd KingdomYugoslaviaOCEANIAAustraliaFijiFr.PotynMiaNawCaMoniaNawZMlandPapua N.QuinaaU.S.S.R.DEVELOPINGNATIONS
DEVELOPEDNATIONS
73
309
22206
10113030
f
8
17
74
3210
20196
101028a
10
9
15
75
238
21206
101025
1
11
9
15
76
229
22216
107
264
12
10
16
77
2910
23226
105
274
12
10
16
78
348
22218
105
284
12
10
17
79
329
23236
104
275
13
10
17
80
349
24236
109
287
10
11
14
81
3210
24246
105
278
11
11
16
82
369
2525
5107
273
11
12
15
83
309
2423576
295
12
12
15
84
379
2727684
305
13
12
17
85
369
2526684
269
11
12
17
NOTES: SM Table 1.

TABLE 10Swttt potato production, 1961-85 (0001)
Country
WORLDAFRICAAngolaBeninBurkina FawBurundiCameroonCape VerdeChadComoro!CongoCotedlvoireEgyptEq.GuinaaGabonGuineaKenyaLiberiaMfcVlfcVUBGeiTMaliMauritaniaMauritiusMozambiqueNigerNigeriaReunionRwandaSenegalSierra LeoneSomaliaSouth AfricaSudanSwazilandTanzaniaTogoUgandaZaireZambiaZimbabweN.& C.AMERICABarbadosCubaDominicaDominican Rp.GrenadaGuadeloupeHaitiHondurasJamaicaMartiniqueMexicoPuerto RicoSaint LuciaSt. VincentTrinidad Tob.United StatesSOUTH AMERICAArgentinaBoliviaBrazilChile
61
96461
3281902932
470121
74876
1788252
83140
83033021
3127
1493
4521692
41107
21o5
495299
111
11959
1421
720
12180
194
9213
151
654
2091388
101356
7
62
105688
3570100
6132
470110
8SO77
187725
287
1508
2903021
3130
1543
6571692
44108
2104
550295
121
140412
2011
770
12190
184
10313
151
777
2131365
111448
8
63
984113421
1253640
470101
745
87
1882252
81160
8OOAoou
3121
3124
1593
4211592
36108
2115
605291
130
13518
2401
750
13200
1114
12613
151
652
2273366
111546
9
64
93645
32291402135
480917
4098
1988252
84170
8ooo odo3120
3124
1643
239792
39128
1957
610266
140
13166
2501
770
13210
1154
12912
151
589
2312342
111598
10
65
108690
31721503635
480111
735108
2086252
85180
8141 O41
3220
3220
1693
2036
142
36128
2006
600192
150
14207
2501
7706
2201
155
11414
171
702
2378341
111721
10
66
120076
32251254835
50096
630119
218325
285
19911
T4Q 3^9
3220
217
1743
2571121
235128
2378
520227
151
13787
2401
7706
2301
205
14514
172
620
2613362
111913
12
67
119007
35581455033
500104
728109
216825
285
20012
35733
20
2213
1794
3601520
241148
2548
658252
161
13647
2301
7512
2401
115
15913
152
612
3013444
112226
12
68
118546
35901406016
500112
32611102178252
80210
123643420
2910
1854
36819122
40168
2539
660253
161
13506
2331
7816
2601
125
12310
151
607
2815379
112120
14
69
126563
3757145
7126
500125
42510102191273
82220
1236735
20
409
1904
3241620
336188
2297
800260
161
14085
2401
8416
2501
156
14311
152
638
3020480
122175
14
70
137227
41321477334
425149
2251010218527
382
23012
QCA OOU
3520
408
1135
41310193
4320
8245
11200264
171
13786
2301
8716
2601
136
15510
141
597
2969438
122134
14
71
126532
42961505434
435128
12612112184283
82240
133283520
409
1155
3998
203
37247
2292
1425267
171
13137
2451
9116
2701
206
1299142
522
2998454
132156
14
72
121596
40961555032
390155
02712112186283
75250
12119 iJI4»
3020
4212
1205
4145
193
42327
2233
1224274
181
13268
2461
9506
2501
207
1267131
552
2951373
132249
10
continued

Country 73
WORLD 149411
AFRICAAngolaBtnlnBurkina FaaoBurundiCtmaroonCapeVerdeChad'ComorosCongoCoted'lvoireEgyptEq.GulneaGabonGuinea vKtnyaUbariaMadagascarMaliMauritaniaMauritiusMozambiqueNigarNigariaReunionRwandaSanegalSlwra LaoneSomaliaSouth AfricaSudanSwazilandTanzaniaTogoUgandaZairaZambiaZimbabweN.&C. AMERICABarbadosCubaDominicaDominican Ftp.GrenadaGuadeloupeHaitiHondurasJamaicaMartiniqueMexicoPuerto RicoSaint LuciaSt.VincentTrinidad Tob.United StatesSOUTH AMERICAArgentinaBoliviaBrazilChile
43031605427
445144
12512122160283
68260
1224630
10
4216
1805
4268
193
4130
4380
41231285
182
12924
2411
9306
2601
167
967133
552
2657474
151828
9
74
129397
50411655227
355150
12613122360292
69270
1426735
20
407
1905
6127
193
43457
3846
1786294
192
13652
2481
9306
2901
21. 7
768123
605
2252295
161595
9
75
1280005479
1605535
450140
1301312247530
169
28015
27935
20
3513
1905
6756
193
3940
9459
61953300
192
13354
2481
8006
2951
157
788123
585
2405418
161600
8
76
115313
58301855740
460140
1321312226930
171
23515
47240
20
4055
2005
6945
113
414110
5136
2002306
201
13663
2501
8405
3001
166
818133
603
2109348
191378
8
77
1253885442
1706040
465135
1331412206832
171
25815
38840
20
4041
2005
7028
103
4440
3527
6165930720
1
13525
2631
7804
3461
225
747113
540
177033020
10748
78
129288
58851706440
625135
1341412186333
172
33015
32545
20
4024
2204
7739
113
44409
6966
1689298
201
14385
3111
9905
3061
395
568123
595
1563320
14882
7
79
116881
57261806042
468130
135151316
10433
173
34015
36548
20
4528
2301
8687
113
474110
5936
1576300
201
13612
3161
5905
2652
215
639112
606
1487322
14819
7
80
115713
52751803644
470130
6351513148634
168
33015
37349
20
4517
2401
8717
123
4642
8550
71200303
201
12535
3251
6805
2822
215
289122
497
1323302
15726
7
81
105543
55621803044
490140
7351613128634
168
36416
3995020
4516
2401
9588
134
4543
2540
7130033520
1
13333
3281
3208
2822
247
4910
112
581
1292247
8762
7
82
107477
61101802743
490140
235161312
12534
169
53016
3565120
4530
2501
10278
134
4443
1530
71600345
210
14444
3301
2108
3131
178
51• 10112
673
1470368
9747
7
83
116626
60051803143
502110
2351613128334
169
26517
46353
20
4531
2601
10078
134
4743
1530
71700355
221
13774
3321
3509
3462
247
5110
122
548
1318310
5682
7
84
1150865991
1803442
517130
2381713129035
170
28017
4635420
4531
2802
7316
134
52405
5007
1900355
221
14542
3351
5808
3502
367
5010
122
589
1429325
8763
7
85
110842
63051803843
520140
240181312
10035
170
28018
4505520
4532
2602
9008
134
5644
5530
72000
36022
1
14952
3301
4608
3502
307
508122
654
1365325
7750
7
continued

TABLE 10 (CONTINUED)SWMI potato production, 1961-85 (0001)
Country
EcuadorParaguayPeruUruguayVenezuelaASIABangladeshBrunei Darus.BurmaChinaEatl TimorHong KongIndiaIndonesiaIsraelJapanKampuchea Dm.Koraa D.P.R.Korea Rsp.LaotMalayalaPakistanPhilippinesSingaporeSri LankaTaiwanThailandVWNamEUROPEGraacaItalyPortugalSpainOCEANIAAuttraliaCook IslandFijiFr.PolynasiaNew CaledoniaN»w ZealandPacific Is.Papua N.GulnMSolomon to.TongaDEVELOPINGNATIONS
DEVELOPEDNATIONS
61
2272
14587
4
01334330
14
740201035
12612464
06491
27220938
7135
7696
458
3234165
1226
1932
2750
114
3671251334
2953914
91077
7384
62
2370
14656
4
98025350
15
800001229
8583680
06330
27228
11518
1408
7495
433080
1901133
1892
2950
106
3702251334
2964014
98343
7345
63
1774
15987
4
90798370
15
736001329
8503070
06732
29240
14048
1418
7845
522148
2081100
1972
3255
107
3722251334
2964214
90790
7621
64
1686
16679
4
86231400
06
665001519
8553958
05936
30248
265112
1459
7255
683348
1801121
1831
366086
3742251343
2984214
86892
6753
65
810012460
3
101173440
09
833001320
10982651
15025
21256
299715
1359
7015
513131
1961100
1692
366567
378\\2
261343
3004314
102752
5938
66
890
133804
112312454
08
947501312
9912476
•>14946
13256
269015
15710
6874
633460230
1076
1552
327051
3941261543
3154414
114315
5762
67
890
15070
3
110516733
012
942501311
12972144
14132
13260
167115
15510
6724
733720247
1084
1552
367443
4002261363
3204514
114059
4949
68
785
14549
4
110246772
012
936501510
16642364
13713
16264
204915
14610
7064
763445
2501065
1462
347040
3991271363
3204214
114032
4514
69
1194
15674
4
117827806
013
101350187
19442260
12968
22268
212315
12711
7314
663702
2651126
1412
297040
4101271373
3304214
122771
3793
70 71
10 799 99
178 16879 854 4
128182 117345852 832
0 115 17
111900 10185016 122 2
2397 24402175 2211
0 02670 2132
23 17272 280
2136 190115 15
125 10511 12
657 6514 4
72 573441 3391280 295
1120 1120
139 1402 2
26 2568 6942 45
428 4401 12 17 71 13 38 73 3
348 36041 4113 15
133769 123692
3459 2840
72
972
15466
4
112621747
116
98100112
22672066
02061
20292
1877159312
6483
562928305
1101
1402
246845
4643171383
3804215
118791
2806
V

Country
EcuadorParaguayPtfUUruguayVenezuelaASIABangladeshBrunei Darus.BurmaChinaEast TimorHong KongIndiaIndonesiaIsraelJapanKampuchea Dm.Korea D.P.R.Korea Rep.Lao*MalaysiaPakistanPhilippinesSingaporeSri LankaTaiwanThailandViatNamEUROPEGreeceItalyPortugalSpainOCEANIAAustraliaCook IslandFijiFr.PolynesIaNew CaledoniaNew ZealandPacific Is.Papua N.GuineaSolomon Is.TongaDEVELOPINGNATIONS
DEVELOPEDNATIONS
73
886
15873
4
140554691
117
12610014
120822387
01613
20300
1669168513
7483
913204
3191179
1312
216643
4743171383
3884316
147062
2349
74
1197
14679
4
120117637
119
106700152
15502470
01435
21320
1450136814
9162
1572708340
1200
1352
236842
4883171393
4004416
127166
2231
75
14105162793
118144719
118
10460002
16582433
01418
17332
1953107915
9861
1942403385920
1312
236738
5062172373
4204316
125817
2183
76 77
17 6114 119163 15860 50
4 4
105360 116171791 756
1 119 18
92300 1033500 01 1
1811 15552381 2460
1 11279 1431
22 23344 360
1783 156014 1879 7512 8
829 8881 1
186 1281851 1695326 324
1328 1520
140 1403 . 4
26 2567 6543 46
507 5123 31 18 82 23 36 63 3
422 42544 4515 16
113241 123223
2072 2165
78
411715360
5
119742783
117
10675001
15892083
11371
19365
1627227410
10371
1331463330
2067
1334
216543
52631823
153
4304516
127126
2162
79
410614960
5
107646795
019
9480000
16232194
11360
14368
138725579
11231
1491225335
2162
1354
216546
5263182383
4364516
1 14721
2160
80
31129460
4
107189791
019
9515000
13132079
11317
15374
1103285712
10481
1271055340
2358
1344
216544
53941823
163
4404516
113693
2014
81
41158560
4
96685704
021
8485000
15022094
11458
14380
1109295912
10101
159834348
2100
1239
204647
548419
.. 23
104
4504917
103321
2221
82
511915160
4
97788668
024
8700000
16961676
21384
17400843
305620
10381
153741355
1665
1162
174850
5494161374
4555117
105248
2229
83
7115127806
107258714
024
9625000
15872213
11379
25400
1012355220
8130
118560355
1700
1144
175340
5553161373
4605217
114526
2100
84 85
8 7110 102141 10060 60
7 7
105551 101001713 683
0 024 25
94400 900000 00 0
1566 15232338 1876
2 21400 1527
30 30450 470895 78738 4050 5021 22
777 10050 0
147 140424 465355 355
1900 .2000
101 1104 4
15 1340 4542 48
560 5664 51 28 81 1
.,448 83 3
464 46949 5017 17
112930 108481
2156 2361
NOTES: See Tablet

TABLE 11Swt«t potato area, 1961-tS (000 ha)
Country
WORLD
AFRICAAngolaBeninBurkina FasoBurundiCameroonCape VerdeChadComorosCongoCote d'rvoireEgyptEq.GuineaGabonGuineaKenyaLiberiaMadagascarMallMauritaniaMauritiusMozambiqueNigerNigeriaReunionRwandaSenegalSierra LeoneSomaliaSouth AfricaSudanSwazilandTanzaniaTogoUgandaZaireZambiaZimbabwe
N.& C.AMERICABarbadosCuivoDominicaDominican Rp.GrenadaGuadeloupeHaitiHondurasJamaicaMartiniqueMexicoPuerto RicoSaint LuciaSt.VincentTrinidad Tob.United States
SOUTH AMERICAArgentinaBoliviaBrazilChile
61
11849
610157
156747
39119561
1025
160
32062
130
60330802
311
14150
20
1751
320801
35010
155020
74
21938
1137
1
62
12272
67115172567423
10119461
1026
16032062
130
82230
1402
321
15750
20
1991
460901
37010
155020
82
22336
1145
1
63
11842
656171512673938119461
1026
15332062
130
81230
1502
291
1735020
2021
550901
39010
185030
69
23336
1152
1
64
11454
634185
156833
3711
10461
1027
15432062
140
70130
1502
292
17445
20
2011
600901
40020
194030
61
23835
1158
1
65
10047
6361811156844
3611
10461
1027
154
32061
140
58160
1502
352
17037
20
2061
600901
42020
145030
68
24936
1168
1
66
11189
59316131570333512
10461
1028
15532051
140
37280
1502
362
1504120
•••2051
600901
44031
165030
63
25336
1175
1
67
10517
58017141670353512
11361
1028
15632051
150
48380
1512
372
1065120
1981
600800
46021
184020
56
26742
1185
1
68
10070
50817168
7036
1512
11461
1029
15732061
150
53860
1412
382
1185220
1991
620901
50021
143010
55
26141
1182
1
60
10241
77517181270472512
11472
1029
15833081
160
614.T!
0.'14
12
342
270522o
2001
620
1001
48021
153010
55
272462
1851
70
10265
913IB181270392512
11472
1030
16133081
150
69270
1312
401
4005320
1991
630901
50021
163010
52
26944
2181
1
71
10118
10081815127039
1512
11482
1030
16034081
150
67370
1312
421
4955421
1931
630
1101
52021
122010
46
26742
2183
1
72
10003
103418151270
.-;-- 410512
11482
1031
16534081
140
73170
1312
421
51055
31
1891
630
1201
48031
112010
46
255352
1741
continued

Country
WORLDAFRICAAngolaBeninBurkina FasoBurundiCameroonCap* VerdeChadComorosCongoCott d'lvoireEgyptEq.GuineaGabonGuineaKenyaLiberiaMadagascarMaliMauritaniaMauritiusMozambiqueNigerNigeriaReunionRwandaSenegalSierra LeoneSomaliaSouth AfricaSudanSwazilandTanzaniaTogoUgandaZaireZambiaZimbabweN. & C. AMERICABarbadosCubaDominicaDominican Rp.GrenadaGuadeloupeHaitiHondurasJamaicaMartiniqueMexicoPuerto RicoSaint LuciaSt.VmcentTrinidad Tob.United StatesSOUTH AMERICAArgentinaBoliviaBrazilChile
73
10276
9241813107039
1512
113829
311
5332082
140
74380
1311
561
4005731
1880
630
1201
5002192010
45
246422
1591
74
9946
10591813107043
1512
123829
321
6034081
150
82480
1322
572
50658
31
1940
640
1201
5503171010
48
22733
2148
1
75
9869
11211814127040
1612
134919
322
6034081
150
87380
1321
672
55060
31
1930
650
1001
5702171010
46
24341
2153
1
76
9442
1175IB14157040
1612
113919
342
7945098
160
90350
1322
762
56461
31
1960
660
1101
5702172020
46
227383
1381
77
9643
10781815157039
1622
10391
1036
273
45096
160
92250
1321
802
4676230
1980
670
1000
6303172010
43
20436
3117
1
78
9938
11161816158539
162293
101
10372
7045094
180
96250
1321
902
4766330
2100
800
1401
5605162010
45
182343
981
79
9046
8961915158038
162284
111
1038
278
42095
180
106150
1321
852
24863
30
2090
800801
6302152010
46
175343
921
80
8820
8781912157538
362274
111
1038
277
42094
190
114260
1321
852
23163
30
2050
800
1001
6312122010
41
16034
384
1
81
8490
1011197
157538
362264
121
1036
286
42094
190
121260
1321
852
35067
30
2060
810601
6403131010
44
14924
184
1
82
8285
1082196
157539
162265
121
10532
8642095
190
121260
1321
852
4006930
2080
820401
6502131010
47
16232
282
1
83
8141
1086196
157535
162263
121
1029
296
52095
200
121260
1320
842
4207130
2110
830601
7003131010
41
15028
177
1
84
7940
1096197
157637
162264
121
1030
297
52095
200
93260
1421
842
45072
30
2140
840701
7004131010
42
15731
281
1
85
7913
1100197
157837
162264
121
10302
9152095
200
100260
1421
842
4507230
2130
830701
7003131010
43
15231
280
1
continued

TABLE 11 (CONTINUED)Sweet potato area, 1961-85 (000 ha)
Country
EcuadorParaguayPeruUruguayVenezuelaASIABangladeshBrunei Darus.BurmaChinaEast TimerHong KongIndiaIndonesiaIsraelJapanKampuchea Dm.Korea D.P.R.Korea Rep.LaosMalaysiaPakistanPhilippinesSingaporeSri LankaTaiwanThailandVietNamEUROPEGreeceItalyPortugalSpainOCEANIAAustraliaCook IslandsFijiFr.PolynesiaNew CaledoniaNew ZealandPacific Is.Papua N.GuineaSolomon Is.TongaDEVELOPINGNATIONS
DEVELOPEDNATIONS
61
58
12152
ii110743'( 37
01
911423
163366
0336
21662
191
135^1
11236
22225
180279
850010101
7445
11413
436
62
:7 5•'7
1.2U2
11077,', 394 o••' /• 19258
23
138544
0330
3167629
>•- 1152
110
23426
234
170278
860010101
7445
11829
443
63
58
13162
10S464101
888024
133484
0318
317
, 91291
1581
16227
28231
180288
86n010101
7445
11422
420
64
49
13162
102784401
834522
130620
0301
418
133291
1461
14246
27233
160286
860010100
7545
11060v\
393
65
31112162
97544602
803922
155416
0261
320
1522
101
1391
1423427
229
150285
870010100
7545
10587
360
66
39
1214
1
10038440\'!2
83352•-••-•j. 1
179402
0249
219
148291
1321
15235
34225
150294
870010100
7545
10847
342
67
29
1213
1
93695902
7705r 2.*<*' 1
206360
0219
120
1372
\91
1321
19236
31226
150293
880010100
7645
10211
306
68
28
1211
1
8908e7
02
719721
223404
0191
220
136261
1351
2024032
226
140293
900010100
7845
9795
275
69
39
1313
1
68887003
723631
242369
0158
220
135261
1350
19233
32222
140293
920010100
8045
9999
242
% ~ - -
39
14142
87767303
720730
213358
0133
321
127251
1280
16229
32223
140184
940010100
824
•<;/
10054
212
71
29
1413
1
854073
04
699430
220357
0111
221
111261
1390
15225
33223
150194
950010100
8345
9934
185
^72
31213132
85056703
703030
195339
0952
21104
261
1440
1521134
233
130184
970010100
8546
"~Sv
^9926
167
\\

Country
• ,D feu***// Paraguay
I-/ PeruI Uruguay
VenezuelaASIABangladeshBrunei Darus.
'%. Burma,'•------China-East TimorHong KongIndiaIndonesiaIsraelJapanKampuchea Dm.Korea D.P.R.Korea Rep.LaosMalaysiaPakistanPhilippinesSingaporeSri LankaTaiwanThailandVietNamEUROPEGreeceItalyPortugalSpainOCEANIAAustraliaCook IslandsRjiFr. PolynesiaNew CaledoniaNew ZealandPacific Is.Papua N.GuineaSc.omon Is.Tonga
\\
DEVELOPINGNATIONS
DEVELOPEDNATIONS
73
21213142
880664
03
729530
205379
0763
2297241
1600
2720135
230
140194
1000010100
8746
10128
149
74
21313142
835161
04
685830
233333
068
32480
231
1900
4118038
230
130183
1030010110
9046
9804
142
75
3131414
1
81946704
675000
231311
069
22495
131
1960
48157
41195
130193
1060010100
9346
9728
142
76
3141415
1
772472
04
625600
251301
066
32487231
2090
4612434
244
130194
1060010110
9346
9302
139
77
1141515
1
8043710
046517
00
234326
064
32577241
2220
2810936
321
130184
1070010110
9446
9508
135
78
1151415
1
830972
04
678400
238301
065
22674
241
2280
219236
360
130193
1090010110
9546
9801
137
79
1141415
1
7G43730
, 46142
00
220287
064
22761
331
2380
167436
392
120193
1120010110
9846
8909
137
80
1148
151
745372
04
594300
207276
065
22855331
2360
146238
443
12, 0"v. 1
93
1120010111
9846
8687
133
81
1156
151
700168
04
561100
209275
065
22950341
2210
175439
350
100163
1130010111
9946
8357
134
82
1151315
1
670966
05
535300
225220
066
23045331
2090
164640
380
100163
1140010101
10047
8148
136
83
1151115
1
65706605
520000
217280
0653
3042331
1830
143640
382
100173
1150010101
10147
8011
130
84
2141015
1
634965
05
500000
216283
065
33037
431
1640
162840
390
90153
1160010111
10247
7810
130
85
2137
151
632162
05
500000
202211
066
33233
431
2140
163040
400
100163
1170010111
10347
7779
133
NOTES: See Table 1.

TABLE 12Swttt potato yWd, 1961-85 (t/ha)
Country
WORLDAFRICAAngolaBeninBurkina FasoBurundiCameroonCapeVsrdeChadComorosCongoCotedlvoireEgyptEq.GuineaGabonGuineaKenyaLiberiaMadagascarMaliMauritaniaMauritiusMozambiqueNigerNigeriaReunionRwandaSenegalSierra LeoneSomaliaSouth AfricaSudanSwazilandTanzaniaTogoUgandaZaireZambiaZimbabweN.& C.AMERICABarbadosCubaDominicaDominican Rp.GrenadaGuadeloupeHaitiHondurasJamaicaMartiniqueMexicoPuerto RicoSaint LuciaSt.VincentTrinidad Tob.United StatesSOUTH AMERICAArgentinaBoliviaBrazilChile
61
8
56427325852
194286
105
12185
121112863
105
254754665
784
1095
13529
10633339
1010101010
62
9
57317335852
204296
105
121B5
121212B73
103
255744665
7104
1095
13528
10733339
1010111010
63
8
57237326952
204286
106
121
125
151212563
102
255753675
774
1095
13528
10733239
1010111011
64
8
58427326
1062
204286
106
121
125
141212363
103
v 27
7̂ '44673
774
1095
13528
1073323
10
1010111011
65
10
58327326
1062
204297
106
131
125
131212352
102
274634573
774
1095
1053B
1083323
10
109
11, 1 °
v 11
66
11
58427326
1162
214297
10
121
1257
1212753
102
274743676
774
1095
10537
1093323
10
10109
1112
67
11
69327336
1062
214297
106
131
145
111214863
103
284736578
784
1095
10537
1093333
11
1111101212
68
12
68427335
1162
214287
10
131
1458
1215722
10 •','3
274756575
784
1095
10536
1093343
11
119
101214
69
12
59427325
1062
224288
106
131
1457
1217553
103
264743574
79
• 41085
10538
1094353
12
11117
1214
70
13
58436415
1062
204288
106
131
12568
18663
103
254613573
7104
1095
10537
10103333
12
11107
1214
71
13
48436315
1062
224288
105
131
13578
19633
103
294523573
7104
1086
10538
10113333
11
11118
1214
72
12
49336415
1062
23328895
120
125B9
23663
103
254532572
7104
10B5
10538
10113335
12
12118
1310
continued

Country
WORLDAFRICAAngolaBeninBurkina FasoBurundiCameroonCape VerdeChadComorosCongoCoted'lvoireEgyptEq.GuineaGabonGuineaKenyaUberiaMadagascarMaliMauritaniaMauritiusMozambiqueNigerNigeriaReunionRwandaSenegalSierra LeoneSomaliaSouth AfricaSudanSwazilandTanzaniaTogoUgandaZaireZambiaZimbabweN.& C.AMERICABarbadosCubaDominicaDominican Rp.GrenadaGuadeloupeHaitiHondurasJamaicaMartiniqueMexicoPuerto RicoSaint LuciaSt.VincentTrinidad Tob.United StatesSOUTH AMERICAArgentinaBoliviaBrazilChile
73
15
5a436415
1072
18328895
120
1358
1323632
103
244743572
7104
1085
10538
1010332
1112
11118
119
74
13
59435425
1062
203188
104
130
1456
1323722
103
25S744572
7104
1085
10538
1010732
1013
1098
119
75
13
59436425
1072
203189
105
120
134
121323
822
103
246734572
7104
1085
10547
1011652
1113
10107
108
76
12
59437426
1072
213187
106
110
1857
1323
822
103
246734582
7104
1085
105489
11452
1013
996
108
77
13
59437326972
214187
105
110
4457
1322852
103
246734582
7104
1085
10648
1010452
1012
99697
78
13
59437326B62
2231B9
105
110
1356
1320852
103
2416834582
7104
1075
10648
1010452
1113
99597
79
13
69436326872
243189
105
121
1356
1312852
104
2418736572
774
11B59449
1014
452
1113
910597
80
13
69336326872
243179
105
121
1754
138852
104
2515645572
613
41073
10439
1012452
1112
89597
81
12
59537426872
23317
10105
121
1154
138B52
103
252644572
6134
10629449
1415852
1113
910597
82
13
69537426872
23317
10104
121
1056
138852
103
251644572
7134
10629549
1416852
1114
912697
83
14
695
- '3
7326872
253179
115
121456
136852
104
251644572
7134
1063
10539
1318852
1113
911497
84
14'
59537426872
263179
115
121
1356
149852
104
275644572
784
1083
10539
1317852
1114
911497
85
14
69637426872
263179
115
121
1356
138952
104
265644572
784
10639539
1317852
1115
910497
cominuea

TABLE 12 (CONTINUED)Swtat potato yMd, 1961-85 (t/ha)
Country
EcuadorParaguayPeruUruguayVenezuelaASIA ^BangladeshBrunei Darus.BurmaChinaEast TimorHong KongIndiaIndonesiaIsraelJapanKampuchea Dm.Korea D.P.R.Korea Rap.LaosMalaysiaPakistanPhilippinesSingaporeSri LankaTaiwanThailandVkMNamEUROPEGreeceItalyPortugalSpainOCEANIAAustraliaCook IslandsFijiFr.PolynesiaNew CaledoniaNew ZealandPacific Is.Papua N.GuineaSolomon Is.TongaDEVELOPINGNATIONS
DEVELOPEDNATIONS
61
4101262
997565
1087
20191414157
1611585
1475
117
157
13
48
25835
18' 4
4103
8
17
62
4101242
996596967
30199
14155
1611594
1375
117
177
13
49
24835
1844
113
8
17
63
4101262
996587866
30211014155
1611593975
117
177
14
49
24835
1644
113
8
18
64
4101352
a94587976
40208
1420•;> a1511595
1475
117
188
14
49
24835
1774
113
8
17
65
39
1142
101035
107976
50198
13208
1411594
1375
119
198
14
49
24835
1174
113
10
17
66
2101163
111034
117966
3320
813188
1711594
1575
109
168
13
59
14835974
113
11
17
67
4101252
121235
126
1166
30199
13128
1711594
1685
1110188
12
56
14834
1474
123
11
16
68
3111242
121235
137
1076
28198
13158
2211594
1485
1010178
12
46
241044
1674
113
12
16
69
4111263
131235
147
1186
20199
13168
22125
103
1685
1012188
13
46
1810
44
1574
113
12
16
70
4111362
151235
1669
116
18208
13178
24125
105
1595
1022179
10
56
171045
1874
113
13
16
71
3111273
141135
155
11116
27199
13178
1712584
1595
99
187
11
56
241044
1674
113
12
15
72
36
1153
131145
144
11126
40221114188
1512494
1495
1123209
11
59
241055
1774
113
12
17
-A<

Country
EcuadorParaguayPsruUruguayVenezuelaASIABangladeshBrunal Dvus.BurmaChinaEast TimorHong KongIndiaIndonesiaIsraelJapanKampuchea Dm.Korea D.P.R.Korea Rep.LaosMalaysiaPakistanPhilippinesSingaporeSri LankaTaiwanThailandVletNamEUROPEGreeceItalyPortugalSpainOCEANIAAustraliaCook IslandsFIJIFr.PolynesiaNew CaledoniaNew ZealandPacific Is.Papua N.GuineaSolomon Is.TongaDEVELOPINGNATIONSDEVELOPEDNATIONS
73
47
1252
161145
176
12106
3521
814178
22135
103
1695
1013198
12
511131055
1774
113
15
16
74
58
// 12- 6
2
141145
166
1777
4521
813188
20145
124
1595
101420
812
511141055
1874
113
13
16
75
SB
1162
141145
15
1378
4021
91421
824145
124
1S ,9'
5
1018198
12
510231055
1775
113
13
15
76
68
1243
141145
15*•*
778
40199
14209
24144
124
15105
101422
812
510171055
1175
112
12
15
77
58
1134
141144
16• •*
3178
40229
14209
21154
125
1695
111821
813
512231055
1175
112
13
16
78
58
1144
141144
16*•>
2077
4021
814229
20165
136
1696
101821
815
510231054
1575
113
13
16
79
58
1144
141144
15tti
2478
4021
714231017165
129
1696
111820
817
510231054974
113
13
16
80
48
1244
141145
16• «•
2868
4020
813201016154
129
1795
112020
816
512231064
2374
113
13
15
81
58
1544
141055
15• ••
2478
41228
13221016145
12101596
124620
816
512231055
1575
123
12
17
82
58
1143
151045
16*••
2788
3821
913191016155
129
1694
1117188
16
51224935
1675
133
13
16
83
58
1244
161155
19to
2778
37218
13241117154
128
1694
111821
815
51226934
1665
133
14
16
84
58
1445
171155
19,.,
287'
840221015241117155
129
1595
121821
816
514261025
1675
123
14
17
85
58
1544
IB1155
18...
3089
40231015241117165
129
1695
111821
815
514271025
1675
133
14
18
NOTES: See Table 1.
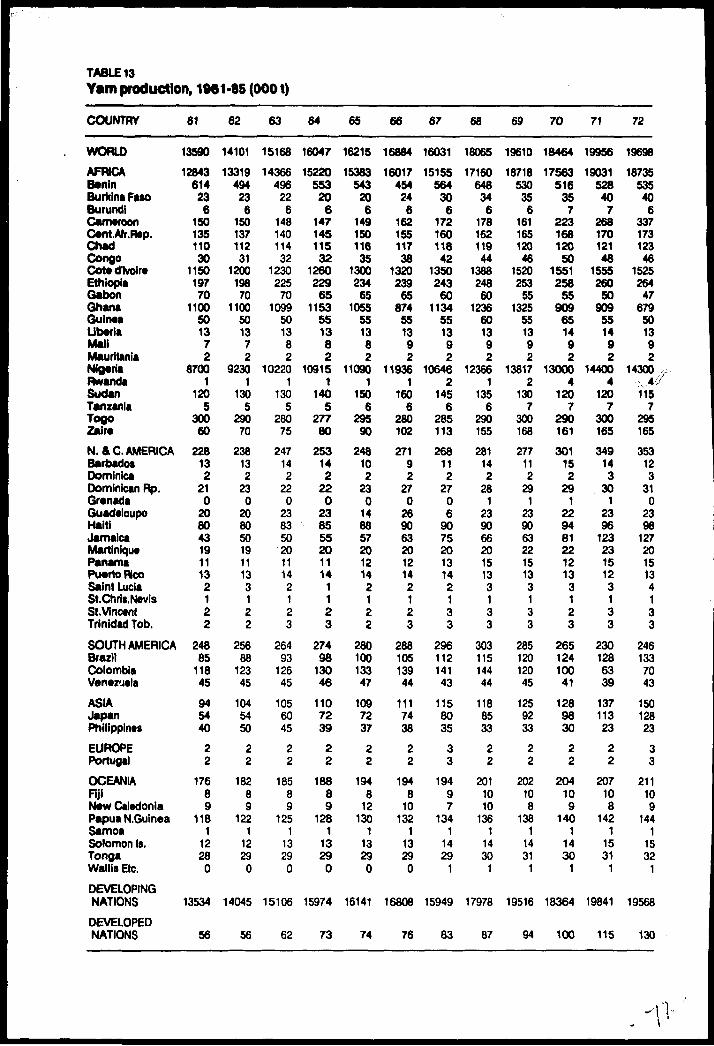
TABLE 13Yam production, 1861-85 (0001)
COUNTRY
WORLD
AFRICABeninBurkina FasoBurundiCameroonCent.Afr.Rep.ChadCongoCoted'tvoireEthiopiaGabonGhanaGuineaLiberiaMaliMauritaniaNigeriaRwandaSudanTanzaniaTogoZaireN.& C.AMERICABarbadosDominicaDominican Rp.GrenadaGuadeloupeHaitiJamaicaMartiniquePanamaPuerto RicoSaint LuciaSt.Chrli.NevIsSt.VincentTrinidad Tob.SOUTH AMERICABrazilColombiaVenezuela
ASIAJapanPhilippinesEUROPEPortugal
OCEANIAFijiNew CaledoniaPapua N.GuineaSamoaSolomon Is.TongaWallis Etc.
DEVELOPINGNATIONS
DEVELOPEDNATIONS
61
13590
12843614236
15013511030
115019770
1100501372
87001
1205
30060
228132
210
2080431911132122
24885
11845
945440
22
17689
1181
1228
0
13534
56
62
14101
13319494
236
150137112
311200
19870
1100501372
92301
1305
29070
238132
230
2080501911133122
25688
12345
1045450
22
18289
1221
1229
0
14045
56
63
15168
14366496
226
14814011432
1230225
701099
501382
102201
1305
28075
247142
220
238350201114
2123
26493
12645
1056045
22
18589
1251
1329
0
15106
62
64
16047
1522055320
614714511532
1260229
651153
551382
109151
1405
27780
253142
220
238555201114
1123
27498
13046
1107239
22
18889
1281
13290
15974
73
65
16215
15383543
206
14915011635
1300234
651055
551382
110901
1506
29590
248102
230
1488572012142122
28010013347
1097237
22
1948
12130
113290
16141
74
66
16884
16017454
246
16215511738
1320239
65874
551392
119361
1606
280102
27192
270
2690632012142123
28810513944
1117438
22
1948
10132
11329
0
16808
76
67
16031
15155564306
17216011842
1350243
601134
551392
106462
1456
285113
268112
2706
90752013142133
29611214143
1158035
33
19497
1341
1429
1
15949
83
68
18065
17160648346
17816211944
138824860
1236601392
123661
1356
290155
281142
281
2390662015133133
30311514444
1188533
22
2011010
1361
1430
1
17978
87
69
19610
18718530
356
16116512046
1520253
551325
551392
138172
1307
300168
277112
291
2390632215133133
28512012045
1259233
22
202108
1381
1431
1
19516
94
70
18464
17563516
357
22316812050
1551258
55909
651492
130004
1207
290161
30115
229
1229481221213
3123
26512410041
1289830
22
204109
1401
1430
1
18364
100
71
19956
19031528407
26817012148
1555260
50909
551492
144004
1207
300165
349143
301
2396
1232315123133
2301286339
13711323
22
207108
1421
1531
1
19841
115
72
19698
1873553540
633717312346
1525264
47679
501392
14300•.x 4-;iis
7295165
353123
310
2398
1272015134133
2461337043
15012823
33
211109
1441
1532
1
19568
130

•D-
COUNTRY
WORLD
AFRICABeninBurkina FasoBurundiCameroonCent.Afr.Rtp.ChadCongoCotedlvoireEthiopiaGabonGhanaGuineaLiberiaMaliMauritaniaNigeriaRwandaSudanTanzaniaTogoZaireN.& C.AMERICABarbadosDominicaDominican Rp.GrenadaGuadeloupeHaitiJamaicaMartiniquePanamaPuerto RicoSaint LuciaSt.Chris.NevisSt.VincentTrinidad Tob.SOUTH AMERICABrazilColombiaVenezuela
ASIAJapanPhilippines
EUROPEPortugal
OCEANIAFijiNew CaledoniaPapua N.GuineaSamoaSolomon Is.TongaWallis Etc.DEVELOPINGNATIONS
DEVELOPEDNATIONS
73
20105
19140500457
35617511650
162426249
686541392
145005
1097
396175
35483
310
241001282015134143
2421407032
15313023
33
215119
1461
1532
1
19973
133
74
20749
19770428
416
364180115
111680265
52850
561592
150005
1137
400172
35953
330
221061312016134123
2501447432
14912425
22
218119
1481
1633
1
20623
127
75
21174
20187446
387
380180130
122172
27056
709561592
150006
1158
403174
36473
320
221081342016133123
2561507333
14512421
33
21999
1501
1633
1
21047
127
76
21316
20310599357
390183135
12203228062
575571592
152006
1158
406183
34663
290
22110120
1617143123
29015410530
14512124
33
22299
1521
1734
1
21192
124
77
21534
20435552327
400185140
12189328567
5357515102
155006
1138
416183
34764
321
10120125
1116134123
35516016233
16714027
22
2279
10155
11734
1
21391
143
78
2239221215
64327
6417188145
13198427073
5447615102
160005
1158
498177
3697
-- • 4""' 26
08
123150
1116134134
37716517637
19817128
22
2309
11157
11734
1
22219
173
79
23034
21922699
286
425190150
132068274
76602
7615102
165004
1138
483180
33963
1917
110143
916144133
34917514132
18916227
33
2331011
1591
1734
1
22870
165
80
23864
2275969428
5421190165
132340
27679
6507716102
170005
1138
484184
33184
1407
110133
919154134
38017816933
153134
19
33
2361011
1621
1834
1
23726
137
81
24152
23094666
286
402193175
132220
27885
5915816102
175006
1158
528195
33244709
115136
720154144
33318411929
152134
18
33
2391011
1641
1834
1
24016
137
82
2535224345
672306
355193190
14254028087
5885916112
185006
1159
473201
3145461
10115117
921144143
2911847730
158140
18
33
2421011
1661
1835
1
25209
143
83
23637
22598620296
37519519514
2450282
88866
5917112
166259
1159
424207
3325490
10120131
919134143
3101809634
15413222
11
2439
11168
11835
1
23504
133
84
25699
24602731
286
375197200
142600
21290
8806018122
185006
1109
342210
3473570
10120149
919134143
31718010334
18316023
33
2471012
1701
1935
1
25536
163
85
28816
27721812
317
380196210
14290021580
9006118123
212007
1159
336215
34225
130
10120140
1018124144
3101809733
19116130
33
2491011
1721
1935
1
28652
164
NOTES: See Tablet

TABLE 14Yam art*, 1961-85 (000 ha)
Country
WORLDAFRICABeninBurkina FMOBurundiCameroonCmt.Afr.Rtp.ChadCongoCoted'lvoireEthiopiaGabonGhanaGuineaLiberiaMaliMauritaniaNigeriaRwandaSudanTanzaniaTogoZaireN. & C. AMERICABarbadosDominicaDominican Rp.GrenadaGuadeloupeHaitiJamaicaMartiniquePanamaPuerto RicoSaint LuciaSt.Chrii.NevisStA/incentTrinidad Tob.
SOUTH AMERICABrazilColombiaVenezuelaASIAJapanPhilippinesEUROPEPortugalOCEANIAFijiNew CaledoniaPapua N.GuineaSamoaSolomon Is.TongaWallis Etc.DEVELOPINGNATIONS
DEVELOPEDNATIONS
61
2124
20298991
3624159
1505410
1506110
14160
401
308
3510202
2032121000
3310158
153
11
00
121170020
2120
3
62
2007
19145891
3625159
1555510
1506110
13030
401
3010
3510202
2032221000
3210157
133
10
00
131180020
2004
3
63
2288
21935791
3625159
1605410
1626110
15660
401
3010
3710202
2132230000
3410159
1249
00
131180020
2285
4
64
2366
22715951
3626159
1605510
1716110
16270
501
3010
3710202
2142230000
3511159
1248
00
131180020
2364
4
65
2323
22256151
3626159
1685610956110
16430
501
3012
3810201
2242230000
3511159
1248
00
131180020
2319
4
66
2023
19225451
39261510
171 '571087
7110
13440
501
3014
4110202
2352230000
3612159
1248
00
141190020
2019
4
67
2081
19775861
50271611
168579
997110
13720
481
3015
4110300
2372231000
3612159
1258
00
141190020
2076
5
68
2048
19436381
52271611
171589
1197110
13000
461
3021
4210302
2362221000
3713159
1257
00
141190020
2043
5
69
2063
19585671
47271612
209599
1177110
12920
441
3022
4210302
2362221000
3513129
1367
00
151190120
2057
6
70
2328
22246061
62281612
195609
1727110
15000
401
3021
4410302
2472121000
3314109
1367
00
151190120
2322
6
71
2216
21104961
61281612
193609
1727110
14000
391
3022
4810302
24112221000
301479
1377
00
1511
100120
2209
7
72
2143
20335261
60291612
198619
1346110
13500
391
3422
5010302
25112221000
311579
1376
00
1521
100120
2135
7

Country
WORLD
AFRICABeninBurkina FMOBurundiCameroonCtnt.Afr.Rtp.ChadCongoCoted'lvoireEthiopiaGabonGhanaGuineaLiberiaUallIvIVHI
MauritaniaNigeriaRwandaSudanTanzaniaTogoZaire
N. & C. AMERICABarbadoaDominicaDominican Rp.GrenadaGuadeloupeHaitiJamaicaMartiniquePanamaPuerto RicoSaint LuciaSt.Chris.NevIsSt.VincentTrinidad Tob.
SOUTH AMERICABrazilColombiaVenezuela
ASIAJapanPhilippines
EUROPEPortugal
OCEANIAFijiNew CaledoniaPapua N.GuineaSamoaSolomon Is.TongaWallis Etc.
DEVELOPINGNATIONS
DEVELOPEDNATIONS
73
2148
20404461
70291612
203619
1306110
13501
371
3923
5010302
25112221000
291676
1376
00
1621
100120
2140
8
74
2148
20374251
7830163
198619
1337210
13501
381
3923
5000301
27112311000
311678
1377
00
1621
100120
2141
7
75
2179
207045
S1
7930173
240629
1177210
13501
391
3923
5210301
27122321000
291776
1275
00
1611
100120
2172
7
76
2246
213263
S1
8031183
246639
1007210
14001
391
4024
5100301
28112321000
3417106
1376
00
1611
100130
2239
7
77
2260
213760
41
8131183
2546410899210
14001
391
4524
5400401
29112321000
3718146
1678
00
1611
100130
2252
8
78
2296
21676851
8332193
2656210959210
14001
391
4724
5710301
31132321000
3918146
1798
00
1611
110130
2287
9
79
2375
22456751
8532193
2746310
1059210
14501
391
5424
5810201
34122321000
3819126
1789
00
1711
110130
2366
8
80
2391
226071
51
853220
3225
" 6410
1137210
15001
391
5624
5800301
34122221000
4020156
1688
00
1711
110130
2383
8
81
2411
22817951
8534213
2266410
1167210
15001
401
5826
5800101
35122221000
3921136
1688
00
1711
110130
2403
8
82
2481
235480
51
8634223
2566510
1117220
15501
402
5327
5700101
35102221000
3721115
1688
00
1812
110130
2473
8
83
2446
23148451
8036233
2716510
1137220
15001
402
4327
5900101
36112221000
4020146
1587
00
1812
110130
2438
8
84
2484
23498151
8038223
2805910
1127220
15501
382
3028
6100101
36132221000
4020146
1688
00
1812
110130
2476
8
85
2468
23348651
8140233
3006010
1137220
15002
402
3028
6100201
36132221000
3820136
1789
00
1812
110130
2459
8
NOTES: See Table 1.

TABLE 15YamytoU,lMl-M(t/ha)
Country
WORLDAFRICA^-—i— BeninBurkina FatoBurundiCameroonCent.Afr.Rtp.ChadCongoCote d'tvoireEthiopiaGabonGhanaGuineaLiberiaMaliMauritaniaNigeriaRwandaSudanTanzaniaTogoZaireN. & C. AMERICABarbadosDomin'caDominican Rp.GreradaGuadeloupe;7HaitiJamaicaMartiniquePanamaPuerto RicoSaint LuciaStChrie.NevisSt.VlncentTrinidad Tob. ;
SOUTH AMERICABrazilColombiaVenezuela
ASIAJapanPhilippinesEUROPEPortugalOCEANIAFijiNew CadelonlaPapua N.GuineaSamoaSolomon h,TongaWallis Etc.DEVELOPINGNATIONS
DEVELOPEDNATIONS
61
66936468484778
10876
1037
108
71210103
13.4"-,14 '•'118535
1016
8985
6173
88
1488
1614291211
6
16
62
7
7836468484778
10877
1037
107
71410103
134
15117S45
1016
8986
8175
88
1588
1614291211
7
16
63
7
7936468484778
10877
113798
71410103
134
15116545
1016
8985
8175
88
1488
1614281211
7
17
64
7
7946468484779
10877
123798
71210103
134
15116545
1016
8995
10195
88
1488
1614281311
7
19
65
7
79464684847
119
10877
1338
108
71110103
104
15117555
1016
8995
919
5
88
158
111613281311
7
18
66
8
88564684847
108
1097983798
71210113
114
131175459
16
8995
10185
88
1489
1613281311
8
18
67
8
810563684847
118
10978837
108
61110113
154
11117555
1116
8995
9185
88
1476
1513281313
8
17
68
9
910463684847
109
1097
10637
107
71210113
154
11118555
1116
89
105
10175
88
1469
1513281313
9
17
69
10
109563684746
118
1087
11637
108
71010113
154
111166559
16
89
105
10175
B8
1467
1514281313
9
16
70
8
8966468484659
10879937
108
71310113
154
111186558
16
89
105
1016
4
88
147B
1514281313
8
16
71
9
91176468484658
1077
10937
108
71310113
154
121286559
16
8994
10173
88
1477
1514281313
9
17
72
9
91076668484558976
1193797
71310113
154
111066S5
1016
89
105
1218
4
88
1478
1514281313
9
18

rCountry
WORLDAFRICABeninBurkina FMOBurundiCameroonCmt.Afr.Rip.ChadCongoCot* dtvolrtEthiopiaGabonGhanaGuineaUberiaMaliMauritaniaNigeriaRwandaSudanTanzaniaTogoZaireN. & C. AMERICABarbadosDominicaDominican Rp.GrenadaGuadeloupeHaitiJamaicaMartiniquePanamaPuerto RicoSaint LuciaSt.Chris.NevIsSt.VlncentTrinidad Tob.
SOUTH AMERICABrazilColombiaVenezuelaASIAJapanPhilippinesEUROPEPortugalOCEANIAFijiNew CadelonlaPapua N.GuineaSamoaSolomon Is.TongaWallis Etc.DEVELOPINGNATIONS
DEVELOPEDNATIONS
73
9
911B6567484559975
11637
108
71310113
164
11106655
1116
89
105
12184
88
1478
1514281313
9
17
74
10
101096567484669
1076
11637
107
71310113
154
12106
1055
1016
89
104
1118
4
88
1478
1514281413
10
18
75
10
101086568594669
1085
11638
107
71310113
174
11107845
1016
99
106
12184
88
1478
1514291413
10
18
76
9
10986568584769
1076
11637
108
71310103
184
1187955
1117
99
105
11184
88
1478
1514291313
9
17
77
10
10976568574769
1076
1153698
613109394
1167845
1118
109
126
11193
1111
1479
1514291313
9
19
78
10
10966568574869
1076
11536
117
610108384
1166845
1118
109
126
1220
3
1010
1479
1514291313
10
19
79
10
101066568584868
1076
1163797
6101010373
1146845
1019
99
116
1120
3
1010
1479
1514291313
10
20
80
10
1010655685
10486
11976
1153698
616106373
114
10745
1118
99
12G
9172
1212
1479
1514291313
10
17
81
10
108655685
104958976
1243698
618107383
124
11745
1019
9995
1017
2
1111
1479
1514291313
10
17
82
10
108754695
104958976
1243698
618106383
114
11645
1018
8976
1018
2
1212
1477
1514291313
10
18
83
10
10765558594988976
11636
108
618106383
114
10645
1017
8976
10173
1111
146.7
1514291313
10
17
84
10
10965559594989976
12536
128
69
1063
103
114
10645
1018
8976
1220
3
1010
1476
1515281312
10
19
85
12
129755595
104889976
14436
118
68
107383
1149645
1018
8986
11204
1010
1477
1515281312
12
19
NOTES: See Table 1.

TABLE 16Umpttifitd production, 1961-85 (0001)
Country
WORLDAFRICABotswanaBurkina FMOCameroonCapeWrdeCongoEthiopiaGuinea-BissauLesothoMozambiqueNamibiaSao Tom* Prn.ZaireN. & C. AMERICABelizeGranadaGuadeloupeHaitiHondurasJamaicaMartiniqueMexicoPuerto RicoSaint LuciaSt.Chris.Nev!sSt.VtncentUnited StartsSOUTH AMERICABoliviaEcuadorGuyanaPeruSurinam*Venezuela
ASIABhutanEast TimorIndonesiaJapanKampuchea Dm.MacauMalaysiaMaldivesNepalPhilippinesTaiwanThailand
EUROPEBulgariaHungarySpainOCEANIACook IslandsFr.PolynesIaGuamKiribati
61
27561116
43
4501516
4173835
1408
18
113226
14283
221431
305
214431032
1170
12
1094110
84072
42
1104
401000
8512
2124615
62
2920
119243
5141617
41738
35
1508
19
120226
15283
271531
315
232431039
1270
12
1150110
88077
42
1204
42900
9522
2174615
63
3149
136043
6761417
422OQ O9
35
1508
20
13522
1615393
331731
275
221461232
1180
12
1208110
9208442
1204
441700
10532
2164615
64
3020
114643
4501617
4254035
1558
20
14522
16153
103
361831
324
212461238
1040
12
1275120
9609542
1305
462100
9532
2315615
65
3030
110353
3951518
4324035
1608
20
13122
13153
163
331631
184
258471633
1480
13
1303120
100086
42
1255
482100
6232
2295616
66
3155
115653
4371519
4404045
1608
21
14122
15183
163
351931
184
230471423
1320
14
13831238
10409243
1155
502120
7133
2395716
67
3406
1361, 5
3629
1319
4494045
1658
22
12822
15203
123
271831
164
247501619
1470
15
14221339
108091
43
1105
5223
21
6132
2415716
68
3511
141453
6681619
4584045
1658
23
12622
1622
3103
301241
154
228501920
1230
16
14921340
117074
43
1055
5422
30
5032
2465717
69
3531
137353
6131520
4674045
1709
23
12912
1624
3113
321341
134
264511724
1550
17
15111341
121074
43
835
5620
30
5032
2485717
70
3722
148354
7151520
477*3R •33
45
1709
24
14412
16263
213
351541
124
302561726
1860
17
15351341
123067
43
875
5821
51
7034
2525717
71
3657
138654
6041020
48635
45
1759
30
15412
1628
3273
391341
124
28356IB27
1650
17
15701442
125079
53
775
6023103
9045
2555717
72
3765
143264
6391021
49635
45
1759
30
17522
1630
330
3561131
124
277601827
1520
19
16171443
130090
53
665
6220
91
8044
2573717
continued

Country
WORLDAFRICABotswanaBurkina FasoCameroonCap* VerdeCongoEthiopiaGuinea-BissauLesothoMozambiqueNamibiaSao Tome Prn.Zaire
N. & C. AMERICABelizeGrenadaGuadeloupeHaitiHondurasJamaicaMartiniqueMexicoPuerto KcoSaint LuciaSt.Chris.NevisSt.VincentUnited StatesSOUTH AMERICABoliviaEcuadorGuyanaPeruSurinameVenezuelaASIABhutanEast TimorIndonesiaJapanKampuchea Dm.MacauMalaysiaMaldivesNepalPhilippinesTaiwanThailand
EUROPEBulgariaHungarySpain
OCEANIACook IslandsFr.PolynesiaGuamKiribati
73
37941475
64
6258
215503555
1809
27
15322
16324
264
311231
174
254461628
1490
15
16381444
1293104
73
805
631951
9046
2645718
74
4157
180564
8519
2?6'.035
55
1801030
17112
16344
285
41153'1
174
253481822
1490
16
16491446
12939573
905
6421100
10047
2706718
75
3303
183564
8309
23700
3054
1851030
168228
364
327
3714
41
154
244442023
1450
12
7721546
43089
63
805
6523100
10046
2756718
76
3041
176765
8109
236503054
1851130
16732
10384
3010351441
133
266632222
1410
18
552150
2438373
975
662490
10037
2796818
77
3160
186275
7907
2375040
54
1901131
173329
384
299
411341
154
279592324
1570
16
553150
2388874
1006
671990
10037
2826819
78
3251
192675
8155
21800
3554
1901129
21032
1039
434
9741142
154
261462322
1540
16
559160
2389964
956
681890
10028
2856819
79
3365
197685
7925
2185045
65
2001129
191328
394
358
561342
143
231369
18152
014
669160
3559844
906
6917110
11037
2887819
80
3365
201075
7764
219004565
2001130
172328
394
308
431342
143
230399
13153
016
650160
35086
54
856
7016120
1202
10
290781
10
81
3403
210575
8204
22950
3565
2101230
186335
424
288
581042
153
262691015
1540
14
541170
23589
53
856
711711
1
1604
12
294781
10
82
3271
199686
6584
221000
3565
2101231
184335
434
2610551042
163
274652416
1551
14
508170
2108263
856
721754
1402
12
295761
10
83
3455
217885
7754
221050
4065
2201231
191336
444
259
65942
163
249253017
1601
17
533170
2229283
807
791861
10027
295741
10
84
3307
194075
8003
227884065
2201232
194335
454
319
60842
163
268422817
1601
20
600170
2159594
857
1431881
8026
297741
10
85
3394
201675
8103
22850
4065
2241232
193335
455
319
6074 v2v,
16 j3 I
281523018
1621
19
594180
21095
94
857
1401881
9027
301742
11
continued

•03
TABLE IC(CONTINUED) :|UiMptcHtod production, 1981-85 (0001)
.Country
Papua NGuinaa.Samoa . ffVanuatuWaHiaEte.
1 . : * $ ' 'DEVELOPINGNATIONS
DEVELOPEDNATIONS ,,
61
1681
261
2871
8S
62
1721
271
2829
91
63
1701
271
3050
98
64
1851
271
2911>'
109
65
1821
281
2933
97
66
1901
281
3052
103
67
1921
281
3305
101
66
1952
281
3428
83
69
1972
291
3448
^ 83
,-..70-
2002
291
3645
78
71
2022
29 .1
3565'
'•^92
72
2052
291
3663,
102

/Country
Papua N.Gu!n«SamoaVanuatuWHIIiEtc.DEVELOPINGNATIONS ,
DEVELOPEDNATIONS
73
2102
301
si3676
113
74
2143
301
4048
109
75
. ti 218
330
1
3200
103
76
\s 221
330
1
2945
96
77
2243
301
,3058
102
78
2263
301
3138
113
79
2283
301
3253
112
80
2303
301
3264
101
81
2333
301
3295
108
82
2363
301
3172
100
83
2383
301
3350
104
84
2403
301
3201
106
85
2434
301I-
3288
107
NOTES: SM Table 1.

TABLE 17Unsptcffltd root crop ma, 1961-85 (000 ha)
Country
WORLDAFRICABotswana :\>Burkina FaaoCameroonCape VerdeCongoEthiopiaGulnea-BiaaauLesothoMozambiqueNamibiaSao Tome Prn.ZaireN.&C. AMERICABelizeGrenadaGuadeloupeHaitiHondurasJamaicaMartiniqueMexicoPuerto RicoSaint LuciaSt.Chrli.NevisSt.VineentUnited StatesSOUTH AMERICABoliviaEcuadorGuyanaPeruSurinameVenezuela
ASIABhutanEast TimorIndonesiaJapanKampuchea Dm.MacauMalaysiaMaldivesNepalPhilippinesTaiwanThailand
EUROPEHungarySpainOCEANIACook IslandsFr.PolynesiaGuamKiribati
61
506
30710
9643
175701
1713
25001
10110351020
481335
2502
20320
168510
1718300
000
130000
62
616
31210
10243
175701
1713
25001
10110451020
511336
2702
21320
176510
1818200
000
130000
63
679
36310
15043
177701
1713
27002
10110451020
521445
2602
22420
184510
181g400
100
130001
64
672
34310
12733
179701
1813
29001
11110461020
501446
2403
23620
192510
2019500
000
140001
65
652
30610
8933
181701
1813
28001
11120461010
601446
3403
24320
200510
191
10500
000
140001
66
677
31710
9733
183701
1813
33002
13120471020
571434
3403
25424
208510
181
10500
100
150001
67
800
43111
20733
187701
1813
32002
14110461010
5915
33
3603
26224
216510
171
10600
100
150001
68
814
43211
20333
191701
1913
31002
15110441020
551533
3103
28024
234410
171
11600
100
150001
69
835
43911
20633
195701
1913
32002
16120441010
621523
3803
28624
242410
151
11500
100
160001
70
845
438/f11
20133
199701
1913
33002
16120541110
701634
4403
28624
240510
161
12510
100
160101
71
858
~il44311
20233
203701
1914
34002
17130441110
671634
4004
29724
250610
141
12610
101
170101
72
873
45311
20823
207701
1914
34002
17130531110
651734
3804
30324
258610
121
12610
100
170101
continued
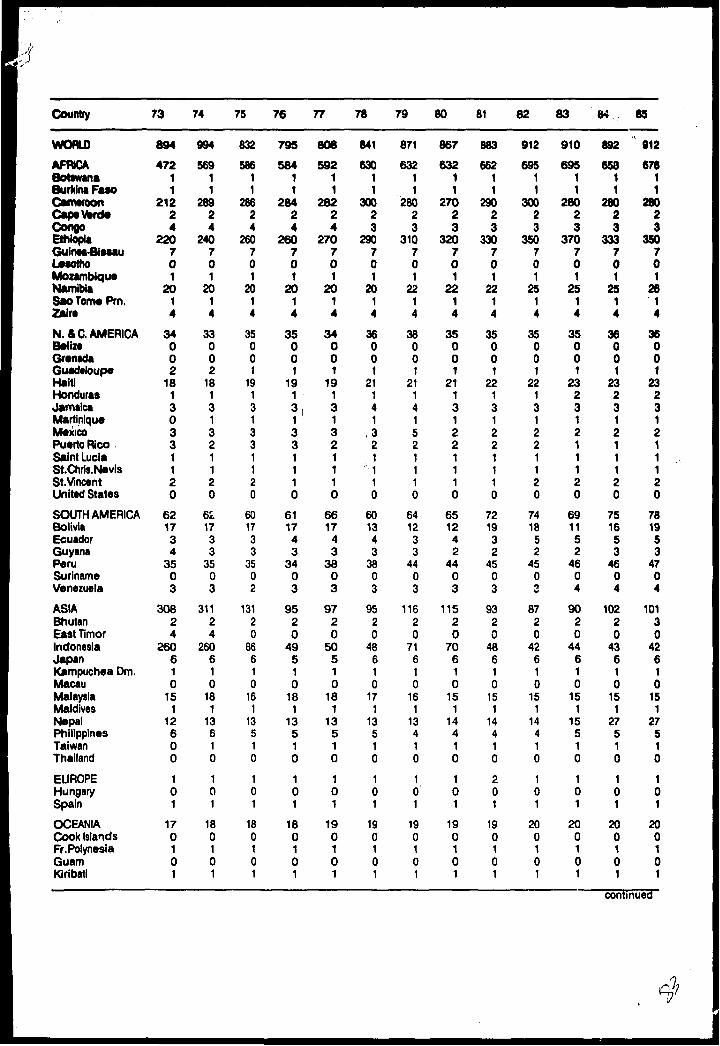
Country
WORLDAFRICABotswanaBurkina FatoCameroonCape VerdeCongoEthiopiaQuln«a-BitMu(jMOttlOMozambiqueNamibiaSao Tom* Prn.ZaireN.&C. AMERICABelizeGrenadaGuadeloupeHaitiHondurasJamaicaMartiniqueMexicoPuerto RicoSaint LuciaStChris.NevisSt. VincentUnited StatesSOUTH AMERICABoliviaEcuadorGuyanaPeruSurinameVenezuelaASIABhutanEast TimorIndonesiaJapanKampuchea Dm.MacauMalaysiaMaldivesNepalPhilippinesTaiwanThailand
EUROPEHungarySpainOCEANIACook IslandsFr.PolynesiaGuamKiribati
73
894
47211
21224
220701
2014
34002
18130331120
621734
3503
30824
260610
151
12600
101
170101
74
994
56911
28924
240701
2014
33002
18131321120
611733
3503
31124
260610
181
13610
101
180101
75
832
58611
28624
260701
2014
35001
19131331120
601733
3502
13120
86610
161
13510
101
180101
76
795
58411
28424
260701
2014
35001
19131331110
611743
3403
9520
49510
181
13510
101
180101
77
808
59211
28224
270701
2014
34001
19131321110
6617
43
3803
9720
50510
181
13510
101
190101
78
841
63011
30023
290701
2014
36001
21141
.,321110
601343
3803
9520
48610
171
13510
101
190101
79
871
63211
28023
310701
2214
38001
21141521110
641233
4403
11620
71610
161
13410
101
190101
80
867
63211
27023
320701
2214
35001
21131221110
6512
42
4403
11520
70610
151
14410
101
190101
81
883
66211
29023
330701
2214
35001
22131221110
721932
4503
9320
46610
151
14410
201
190101
82
912
69511
30023
350701
2514
35001
22131221120
7418
52
4503
8720
42610
151
14410
101
200101
83
910
69511
28023
370701
2514
35001
23231211120
691152
4604
9020
44610
151
15510
101
200101
84
892
65811
28023
333701
2514
36001
23231211120
751653
4604
10220
43610
151
27510
101
200101
85
912
67611
28023
350701
2614
36001
23231211120
781953
4704
10130
42610
151
27510
101
200101
continuea
flj

iK»««J&5:S * irf^tfr*
TABLE 17 (CONTINUED)UiMpacHtod rool crop area, 1961-85 (000 ha)
Country
Papua N.OuirwaSamoaVanuatuWaNfe Etc.DEVELOPINGNATIONSDEVELOPEDNATIONS
61
11010
591
5
62
11010
610
5
63
11010
673
5
64
11010
666
6
65
11010
647
6
66
12010
671
6
67
12010
794
6
68
12010
809
5
69
13010
830
5
70
13010
839
6
71
13010
851
7
72
13010
866
7

Country
Papua N.GuintaSamoaVanuatut**^Ml- »._wwra etc.
DEVELOPINGNATIONS
DEVELOPEDNATIONS
73
14010
887
7
74
14010
987
7
75
14010
825
7
76
15020
788VvC7
7
77
15020
802
7
78
15020
834
7
79
15020
864
7
80
15020
859
8
81
15020
875
8
82
16020
904
8
83
16120
902
7
84
16120
884
7
85
16120
904
• 7
NOTES: SM Tablet

TABLE 18unvpejcnivu nx* crop ywia, i VOI-TO W"*/
Country
WORLDAFRICABotewanaBurkina FaaoCameroonCap* VerdeCongoEthiopiaGuinea-BissauLesothoMozambiqueNamibiaSao Tome Prn.ZaireN.& C.AMERICABelizeGrenadaGuadeloupeHaitiHondurasJamaicaMartiniqueMexicoPuerto RicoSaint LuciaSt.Chris.NevIs tSt.Vinc*nt 'United StatesSOUTH AMERICABoliviaEcuadorGuyanaPeruSurinameVenezuelaASIABhutanEast TimorIndonesiaJapanKampuchea Dm.MacauMalaysiaMaldivesNepalPhilippinesTaiwanThailand
EUROPEHungarySpainOCEANIACook IslandsFr.PolynesiaGuamKiribati
61
6
44654626
1558
137
5166
1013
10107343
1422
4336556
57
• ••
5165
106754K.
10
2710101632132010
62
5
44654626
1559
137
5176
1013
10107343
1423
5336545
57,,,
5165
107554
• <•
10
21109
1632132110
63
5
44754626
1559
137
5186
1013
10108343
1423
4336s55
57,,,
5185
107554
,,,
10
19109
1632132110
64
4
34745626
1559
137
5186
12139
109343
1422
4336445
57
• ii
5185
107554,,,
10
20109
1732132110
65
5
44745626
1559
137
5176
1013
10108343
1524
4346435
57ii*
5175
107554
• i*
10
14109
1631132010
66
5
44645626
1459
127
41669138
108343
1125
4356445
57
115
185
106554
1010
11109
1620141610
67
4
34634626
1459
127
41769138
108343
i 1123
4366455
57
115
195
106554
1010
11109
1628141610
66
434635626
1459
1284
17// 6
10137
107343
1025
4386455
57
115
175
106554
1010
1010101629141610
69
4
34635626
14•'"' 5
9127
4186
10237
108343
1123
4377455
57
115
165
106554
1010
1010111629141610
70
4
34645625
1359
126
4176
10239
108443
1120
4377455
57
115
145
105554
1010
1010'JO1629141610
71
4
34634625
1359
128
5186
10239
1010343
1021
4376455
57
115
145
106554
1010
1010101520141610
72
4
34635625
1359
128
5186
10239
1012343
1022
4477455
57
115
155
106553
1010
1010101534141710
o
continued

Country
WORLDAFRICABotswanaBurkina FanCkWWfOOACap* VerdeCongoCiilljmlM.CTrnOfMQuinM-BiwuLMOtnOMozambiqueNamibiaSao Tome Prn.Zaire
N. & C. AMERICABelizeGranadaGuadeloupeHaitiHondurasJamaicaMartiniqueMexicoPuerto RicoSaint LuciaSt.Chris.NevisSt.VincentUnited StatesSOUTH AMERICABoliviaEcuadorGuyanaPeruSurinam*VenezuelaASIABhutanEast TimorIndonesiaJapanKampuchea Dm.MacauMalaysiaMaldivesNepalPhilippinesTaiwanThailandEUROPEHungarySpainOCEANIACook IslandsFr.PolynesiaGuamKiribati
73
4
3463463S
1359
127
4186
10239
1010343
1021
4367465
57
115
177
106553
1010
101010
1526141710
74
4
34834635
1359
128
5186
1023
101014843
1022
4367455
57
115
167
105554
1010
101010
1528141710
75
4
3S634635
1349
138
5196823
101012453
1019
4377465
67tit
5167
105554
1010
101010
1530141610
76
4
35635635
1349
137
5216
1023
101412453
1018
4466455
67
**i
5157
105555
1010
101010
1531141610
77
4
356
•o 3S636
134
10138
52069239
1315643
1119
4367445
67in
5167
106554
1010
101010
1531141610
78
4
35633635
134
10137
620
610239
1322
743
1019
4467445
67nt
5176
1065549
10
101010
1532141610
79
4
36633637
1659
137
520
5923
101212743
1019
4337365
67
>*•
5166
106554
1110
101010
1533141610
80
435833837
1659
137
520
69239
1121743
1023
4327355
67in
5147
106554
1110
101010
1533141510
81
4
35633835
15 ,5Y
10147
5206923
101226
743
1120
4437354
67n*
5148
106554
1010
101010
1533131510
82 ,,
4
36623635
1558
147
5207923
101226743
1022
4457354
67
• ••
5138
1065546
10
101210
1533121510
83
4
36532636
1559
147
520
71023
101229743
1017
4267364
67
tn
51410106554
1010
101010
15338
1510
84
4
35532626
1559
148
5206
1023
101227743
1019
4357355
67
10
51511106554
1310
109
10
1533
81510
85
4
3553°2626
15S9
14 o8
(( 520
61023
101227
643
1019
4367354
67
• ti
51511106554
1310
999
1533
81510
continued
d '

TABLE 18 (CONTINUEO)unapccima root crop ymo, ivoi-«9{i/na;
Country
Papua N.GuinaaSamoaVanuatuWaft* Etc.DEVELOPING ^NATIONS ^
DEVELOPEDNATIONS
61
167
266
\, 5^^
17
62
167
256
5
17
63
167
256
5
18
64
177
246
4
19
65
167
236
5
17
66
166
236,
5
17
67
167
227
4
16
68
166
227
' 4
16
,»
156
227
4
16
70
156
217
4
13
71
156
217
4
14
72
157
21. '7
4
15

' •
Country
Papua N.GuinaaSamoaVanuatuWaNtoEto.OEVELOPINQNATIONS
DEVELOPEDNATIONS
73
157
207
4
16
74
157
207
4
15
75
157
207
4
15
V157
207
4 .;
15
77
157
207
4
15
78
157
207
4
16
70
157
207
O
4
15
80
157
207
4
13
81
157
207
4
14
82
157
207
4
13
83
157
207
4'
// U
84
157
207
4
14
85
157
20• 7
4
14
NOTES: SMTabtol.

TABLE 10nooi crop prouucuon •umnwry, ivo^-oa \uuu i;
Country
WORLD
AFRICAAlgeriaAngolaBeninBotswanaBurkina PasoBurundiCameroonCape VerdeC*nt.Afr.Rtp.ChadComorosCongoCot* d'lvoireEgyptEq.GuineaEthiopiaGabonGambiaGhanaGuineaGuinea-BissauKenyaLesothoLiberiaLibyaMadagascarMalawiMaliMauritaniaMauritiusMoroccoMozambiqueNamibiaNigerNigeriaReunionRwandaSao Tome Prn.SenegalSierra LeoneSomaliaSouth AfricaSudanSwazilandTanzaniaTogoTunisiaUgandaZaireZambiaZimbabwe
N& C.AMERICABahamasBarbadosBelizeBermudaCanadi
Cassava
131792
545100
1950690
042
492640
289327390
6031313
0540
2526
2728497
0421
0320
02060
29973
000
31600
18011583
5449
315
105360
1260
5500417
03900
15046210
77
88311000
Edible aroids
5667
328100
1300
10300
57800
211103
00
550
70032
000
170
9100000000
17870
3300
2100000
2200
3000
13501000
Potato
299446
6185604
40000
37170
20
1302
241198
0211
00000
62800
106260272
01
2056460
00
43.5
2720
1000
981236
2000
145222
403
23
206390001
2769
Sweet potato
114185
61000
180340
43513127
20
3817131291350100
700
2750
170
4590
54200
450
31267
1879
08
134
5242
4520
70
186735722
1
144203000
Yam
26051
2497300
7210
296
3770
197202
014
265000
23686
088260
000
18000
12200000
187750700000
11309
36700
21100
34103000
Unspecified
3385
2044000750
7953000
22000
8960000
4006000000005
2210000
120000000000
3200
19300300
Total
580526
97095604
21701458
7119
11502108
91147534107654
42101392
891344394
64310658
401323
6371106
2870571138
520
5643270
221212
3245411
16411533
13940
1033305
106229
813145
598815714
235101
236322831
2769
continued

TABLE 19 (CONTINUED)now crop pronucnon •umnwry, ivw-ao \vw i;
Country
Cost* RicaCubaDominicaDominican Rp.B SalvadorGranadaGuadeloupeGuatemalaHaitiHondurasJamaicaMartiniqueMexicoNicaraguaPanamaPuarto RicoSaint LuciaSt.Chris.NevisSt.vlncentTrinidad Tob.United States
SOUTH AMERICAArgentinaBoliviaBrazilChileColombiaEcuadorFrench GuianaGuyanaParaguayPeruSurinameUruguayVenezuela
ASIAAfghanistanBangladeshBhutanBrunei Darus.BurmaChinaCyprusGaza StripIndiaIndonesiaIranIraqIsraelJapanJordanKampuchea Dm.Korea O.P.R.Korea Rep.LaosLebanonMacauMalaysiaMaldives
Cassava
20300
111925029
2657
190
432734210330
27479140279
221420
1459223
80
2554351
30
322
486860001
633867
00
559913399
00000
9500
7700
3670
Edible aroids
0591838000000000070000
110
77ol00000500
1800
54
1863•i 0
0000
13003000000
363000401002
Potato
37258
115600
3099
100
8352
1600000
16642
98142044
5691996876
2183363
007
14180
139220
74939322
1159270
15647833
2427
11583196
1613113199
3669140
173347746
122000
Sweet potato
0332
1460080
3492
307
500091022
597
1371320
7732
70700
109123
0606
1046030
70300
2493550
00
15652142
002
14350
284408983800
510
Yam
004900
100
1200
140900
191341430
31200
1800
990000000
34
1760000000000000
151000000000
Unspecified
00000350
454
299
6200842
1603
2660
40000
290
170
16110
19
57600
17000000
216000
940900004
837
Total
56949
25228
314
2639
78722
22826
990297633103
2520
17242
393202504
89425049
8833741
6221317
26702070
4199655
230844322
186244
1244
146550245
71874715953
1613113201
571314
13221731378
161122
4501
8
continued

TABLE 19 (CONTINUED)Root crop production summary, 198345 (0001)
CountryEdlblt Sweet
Cassava aroids Potato potato Yam Unspecified Total
MongoliaNepalOmanPakistanPhilippine!Saudi ArabiaSingaporeSri LankaSyriaTaiwanThailandTurkeyUAEmiratesVietNamYemen AR.Yemen Dem.
EUROPE cAlbaniaAustriaBelgium-Lux.BulgariaCzechoslovakiaDenmarkFaeroe Is.FinlandFranceGerman O.R.Germany F.R.GreeceHungaryIcelandIrelandItalyLiechtensteinMaltaNetherlandsNorwayPolandPortugalRomaniaSpainSwedenSwitzerlandUnited KingdomYugoslavia
OCEANIAAmerican SamoaAustraliaCook IslandsFijiFr.PolynesiaGuamKiribatiNew CaledoniaNew ZealandNiuePacific Is.Papua N.Guinea
0000
188900
7180
7319673
00
286700
00000000000000000000000000000
233004
905003C0
10101
0000
1300000
60100000
00000000000000000000000000000
311400
290033010
182
113392
1516
4150
76344298
34503
263174
14
106151136
10641519408
35351015
1752
683610157768410861385
13713 ;,
2450 '1214
6412476
361521128642856411121828
67022484
12430
957013002
280000
000
21865
00
1350
483355
00
186700
10800000000000400
. 01500000
460
430000
56004171003803
464
0000
2500000000000
20000000000000000000002000000
246000
10000
11000
170
0121
00
1800007100000
90000000000002000000000070000
298007041
100000
240
113513
1537
296951
929344652
200373450'•'"•'3
4996174
14
106270136
10641519
40835351015
1752
683610157768410901387
13713
24651214
6412476
361521176642856911121828
67022484
28914
96112
137132
1322
288"V 2
; 1311C8
continued

ITABLE 19 (CONTINUED)Root crop production summary, 1983-85 (0001)
CountryEdible Sweat
Cassava aroids Potato potato Yam Unspecified Total
SamoaSolomon to.TongaVanuatuWallisEtc.
U.S.S.R
DEVELOPINGNATIONS
DEVELOPEDNATIONS
01
1602
0
131792
0
3721300•2
o,\i
5304
363
00000
80474
87324
212122
0SO1700
0
111979
2206
11935
01
0
25898
153
300
301
0
3280
105
429198
< 306
80474
365576
214950
1
Derived from FAO, Basic Data Unit, Production Account (unpublished, May 1986 update). Includes countries producing an average of 50f\tons or more of root crops during the period. Regional totals Include figures for countries no listed. All calculations were done with unrounded numbers.
ff

TABLE20Root crop iraa tummary, 1983-85 (000 ha)
oCountry
Edible Sweet Cassava aroids Potato potato Yam Unspecified Total
V.ORLD
AFRICAAlgeriaAngolaBtninBottwanaBurkina FasoBurundiCameroonCape VerdeCent.Afr.Rep.ChadComorosCongoCote d'rvoireEgyptEq.GuineaEthiopiaGabonGambiaGhanaGuineaGuinea-BissauKenyaLesothoLiberiaLibyaMadagascarMalawiMaliMauritaniaMauritiusMoroccoMozambiqueNamibiaNigerNigeriaReunionRwandaSao Tome Prn.SenegalSierra LeoneSomaliaSouth AfricaSudanSwazilandTanzaniaTogoTunisiaUgandaZaireZambiaZimbabwe
N. & C. AMERICABahamasBarbadosBelizeBermudaCanada
13823
73860
130100
06
43400
0300-''663094
2500
250
422
31270
064
087
0339
468000
5400
251200
043
06
3130
450
45015
0403
21296119
15800000
1006
75500200
2400
181000
16030080
14020
00020
1400000000
3300700500000
•-)'; 400800
2000000
20333
741826000
1072003002
670
370''•'' 0000
7700
154079001
4260030
390100
7313
300
123180i
7440000
117
7998
10940
1970
157636
1062264
120100
100
30020
/'/ 9505200905
200
1050260
1421
,8420
4407230
2130C000
2466
233200
83051
800
3823
03
28400
61100
113700020002000000
1o170100000
3902
3400
2800
6000000
904
676000110
28020003000
3510000700000000001
25000010000000000400
36000J,\
46531
1298482
155192
127
155868
335610732
1027017337
45061
2565107
7170
09315
487125
1431
42556
2531
30701
196''' 1
841
48788
4565
5512
8742248
6421
12310100
117
continued

TABLE 20 (CONTINUED)now crop mnm summary, i vw-oo \vw ni;
Country /;
Costa RicaCuba .//DominicaDominican Rp.B SalvadorGrenadaGuadeloupeGuatemalaHaitiHondurasJamaicaMartiniqueMexicoNicaraguaPanamaPuerto RicoSaint LuciaSt.Chrls.NevIsSt.VlncentTrinidad Tob.United States
SOUTH AMERICAArgentinaBoliviaBrazilChileColombiaEcuadorFrench GuianaGuyanaParaguayPeruSurlnameUruguayVenezuela
ASIAAfghanistanBangladeshBhutanBrunei Darus,BurmaChinaCyprusGaza StripIndiaIndonesiaIranIraqIsraelJapanJordanKampuchea Dm.Korea D.P.R.Korea Rep.LaosLebanonMacauMalaysiaMaldives
Cassava
546
020
2003
6502027 .5000000
23891630
19150
16123
10
17033
10
40
387000005
24000
3101279
00000
1300500
340
Edible aroids
0102500000000001000010
130000000003009
17400000
1020000000
29000000000
Potato
3140100061110
710200000
526
89311215016670
15332001
1720
2017
589422
11040
164066
110
79426
11265
13010
14029
58000
Sweet potato
083070010
7003130010010
42
15330
279
10100
1490
151
64130
64005
506700
212258
000
6503
313730030
Yam
00020010
360
122002210000
3900
200
1400000006
1600000000000008000000000
Unspecified
00000010
23231200111200
740
160005030
46004
97002000000
4300060100000
151
Total
8153
3li 34
2138
1943
224
797953132
568
3561158197
218071
S2862
13
185264
13577
1646422
17460
269474
110
13161606
11265
2381
16171671480
522
continued

TABLE 20 (CONTINUED)Root crop area summary, 1983-85 (000 ha)
CountryEdible Sweet
Cassava aroids Potato potato Yam Unspecified Total
MongoliaNepalOmanPakistanPhilippinesSaudi ArabiaSingaporeSri LankaSyriaTaiwanThailandTurkeyUAEmiratesVietNamYemen A.R.Yemen Dem.
EUROPEAlbaniaAustriaBelgium-Lux.BulgariaCzechoslovakia .DenmarkFaeroe Is.RnlandFranceGerman D.R.Germany F.R.GreeceHungaryIcelandIrelandItalyLiechtensteinMaltaNetherlandsNorwayPolandPortugalRomaniaSpainSwedenSwitzerlandUnited KingdomYugoslavia
OCEANIAAmerican SamoaAustraliaCook IslandsFijiFr.PolynesiaGuamKiribatiNew CaledoniaNew ZealandNiuePacific Is.Papua N.Guinea
0000
23400
5605
119400
49500
0000000000.600000 .0000000000000
2100080000001
10
0000
3600006000000
0000000000Of '
g00000000000000000
4510050001010
27
10610
504006
2021
2070
3013
1
529815403940
19030
042
207>4B4
2456275
132
14112
16420
2154127317337
4023
195274
490
38000000
10000
0001
18700
150'31
4000
39100
100000000000000001000006030000
11600010001001
102
0000800000000000
00000000000000000000000000000
1800010002000
11
02300500001000000
10000000000000000000000010000
2000001010000
16
10640
52474
00
782046
1234207
0916
131
530915403940
190300
42207484245
6275
132
14212
16420
2154134317340
4023
195274
2681
380
151014
1012
166
continued

TABLE 20 (CONTINUED) ''Root crop area summary, 1983-85 (000 ha)
Country
SamoaSolomon Is.TongaVanuatuWallls Etc.
U.S.S.R.
DEVELOPINGNATIONS
DEVELOPEDNATIONS
Cassava
00100
0
13823
0
Edible aroids
51400
0
977
29
Potato
00000
6715
7421
12912
Sweet potato
04700
0
7867
131
Yam
01300
0
2458
B
Unspecified
10020
0
897
7
Total
66
1521
6715
33443
13088
NOTES: See Table 19.
It
\r

TABLE 21Root crop yteM summary, 1983-85 (t/ha)
Country
WORLD
AFRICAAlgeriaAngolaBeninBotswanaBurkina FuoBurundiCameroonCape VerdeCant.Afr.Rtp.ChadComorosCongoCota d'lvoiraEgyptEq.GuinaaEthiopiaGabonGambiaGhanaGuinaaGuinaa-BissauKanyaLesothoUbariaLibyaMadagascarMalawiMaliMauritaniaMauritiusMoroccoMozambiqueNamibiaNigerNigeriaReunionRwandaSao Tome Prn.SenegalSierra LeoneSomaliaSouth AfricaSudanSwazilandTanzaniaTogoTunisiaUgandaZaireZambiaZimbabwe
N. & C. AMERICABahamasBarbadosBelizeBermudaCanada
Edible Sweet Cassava aroids Potato potato Yam Unspecified
10
7,,,
157m
711
2734365
• >t
2,,,
6397ni
7*M
4,.,
669
• •>
15• *«
6.,,
710101011
33
11...3
*i>
1228...
10734
61424.........
6 15
4 877
7nt ttt
*•• «••
4 42
163 21 5
**• tl.
61 12
32 18••• ..*
67...5 ...2•** t«»
8 ;*<t tt»
87
6 63
>•• «•»
411 24
1310
tt. ttt
75 14
195 7
ttt •••
145
"! 131927
5127
4 59
15
7 28t,t >i>
3•tt ttt
1024
14 11 4
6 11 3 x"• Itt Ml
95 9
63657 535 32 ... 2
56 986562 9
263
4 31 9
...8
7 96
915
11 9nt ... ,i>
5tn it in
12 71 68
Ml IM IM
5 ... 59
613 1288 5
1452
104
26 346 53 11
Mt II Ml4 .!!58872
7654
10 1120
7...
continued
.. n, ,\ l !

TABLE 21 (CONTINUED)Root crop yield tummary, 1983-85 (t/ha)
Ediblt Sweet Country Cassava arolds Potato potato
CostoHcaCuba'Dominic*Dominican Rp.El SalvadorGrenadaGuadeloupeGuatemalaHaitiHondurasJamaicaMartiniqueMexicoNicaraguaPanamaPuerto RicoSaint LuciaSt.Chris.NevisSt. VincentTrinidad Tob.United States
SOUTH AMERICAArgentinaBoliviaBrazilChileColombiaEcuadorFrench GuianaGuyanaParaguayPeruSurinameUruguayVenezuela
ASIAAfghanistanBangladeshBhutanBrunei Darus.BurmaChinaCyprusGazaStripIndiaIndonesiaIranIraqIsraelJapan 'JordanKampuchea Dm. r,\KoreaD.P.R. vKorea Rep. :Laos iLebanonMacauMalaysiaMaldives
4 ... 137 6 18
10 10 56 7 12
13 ... 197
114 ... 54 ... 15
18 ... 129 ... 93
18 ... 124 ... 47 7 1183 5
91112 11
32
12 6 119 ... 189 ... 4
12 ... 1212
9 ... 1410 ... 1111 11•i* «.i ti>15 .;. e
11 5 86
78 6 13
13 11 1314117
912 ... 916 13 12
27 2216
18 ... 1510 ... 7
141739
13 2819
712
9 161)14 ... 9
17 15.11 I.I It!
11
4 10
4107539
«M
539
1317,,,
HI
8552
1114
911497
m
5*..
,,,
813544
16ttt
11t*i
55
18,,,
...
78
*<i
...
3922tn
9142411
t«t
174
Yam Unspecified
...
106
• i*
39
in
3it*
114
HI
,,,
9645
1018...ft -„ C»
XI
9• ii
7.............11.11in6
'•i1
.11
in
.if
>..
...
i.*
...
«i«
»*l
...
...
19• ..
...
,,,
...
ii.
.11
...
...
• tl
*tl
I.IIII
,610...
23
101228
4*t.
643
10...19
4in
3nt
t.t
• •*
6t*i
7.1.35
...
4
6.11
...
73....!<.........5
in
15
11
...
...
1065
continued
'J\

TABLE 21 (CONTINUED)Root crop yMd summary, 1983-85 (t/ha)
CountryEdible Sweet
Cassava aroids Potato potato Yam Unspecified
MongoliaNepalOmanPakistanPhilippinesSaudi ArabiaSingaporeSri LankaSyriaTaiwanThailandTurkeyUAEmiratesvietNamYemen A.R.Yemen Oem.
EUROPEAlbaniaAustriaBelgium-Lux.BulgariaCzechoslovakiaDenmarkFaeroe Is.FinlandFranceGerman D.R.Germany F.R.GreeceHungaryIcelandIrelandItalyLiechtensteinMaltaNetherlandsNorwayPolandPortugalRomaniaSpainSwedenSwitzerlandUnitedKingdomYugoslavia
OCEANIAAmerican SamoaAustraliaCook IslandsFijiFr.PolynesiaGuamKiribatiNew CaledoniaNew ZealandNiuePacific Is.Papua N.G 'inea
i\\\
... .*.
*»» *..
»*• **.
8 4... ...
1113... ..*
14 916 10... ' ...
... .*.
6•*. ttt
...
...
... it.
... it*
*.. t*.
... ...
... ti.
... itt
ttt ..*
»*. ti.
... i*.
•*. it*
.*. it.
.,, ,,,
•*. ...
... tt.
... ...
... ...
... tti
*** ttt
• »* it.
... tt.
... it.
... ttt
... it*
... ...
... ttt
... it.
...
11 74 6... . . ...
3212 617... tti
66 4
*** ...
4 29
11 7
1164
101014.it
1217141117109
1411
209
273910193314183321311819132217197
3924179
20172836349
25.t.
25• ti
68i.i
...
528ti.
7
itt
t.i
155
in
129in
159tit
in
5tit
...
11in
HI
III
lit
Itl
III
...
Ill
tit
III
III
18
HI
"t
21
ttt
...
HI
it.
8.11
15
-, «, Ml
' '" v"m
*;?>,5in
13261022lit
51625
75
5to .it
... *t*
3 4<tt .11
7tti i*t
HI in
12105
.11 .**
... in
in ••>
.„
10 10HI ...
t.i i.i
01 tti
HI .11
iti KI
lit t*t
HI »«i
ttt itt
tit ...
it* in
iti ttt
HI in
9tit tit
10 III
,,, ...
0. Ill
10
...
... ..t
.0 t.l
10 10tl. ...
10... ...
Itt ...
../;\...
14 152i.. ...
337
81510
6.0 ...
2tll (tl
15 15
continued

TABLE 21 (CONTINUED)nooi crop ywtu •umnwry, ivoj-oa 1V""/ y '
EdibleCountry
SamoaSolomon Is.TongaVanuatuWallisEtc.U.S.S.R.
DEVELOPINGNATIONS
DEVELOPEDNATIONS
Sweet -::"I)
Cassava aroids Potato potato Yam Unspecified
121415IM
10...
10
...
7197
• *•
13...
5
13
1513 293 13
*• •*• •••
1212
12 14 11
16 17 19
7 o>•*
(It
207...
4
14
NOTES: See Table 19.
0

TABLE 22Par capita root crop production and quantHitt available for conaumptlon and to supply dietary anargy and prottki, 1984
QProduc-
Gountry
WORLD
AFRICAAlgeriaAngolaBeninBotswanaBurkina FasoBurundiCameroonCape VerdeCent.Afr.Rep.ChadComorosCongoCote d'rvoireEgyptEq.GulneaEthiopiaGabonGambiaGhanaGuineaGuinea-BissauKenyaLesothoLiberiaLibyaMadagascarMalawiMaliMauritaniaMauritiusMoroccoMozambiqueNamibiaNigerNigeriaReunionRwandaSao Tome Prn.SenegalSeychellesSierra LeoneSomaliaSouth AfricaSudanSwaziland
/TanzaniaTogoTunisiaUgandaZaireZambiaZimbabwe
tionkg
28
1040
228177
06
111665
35757
209354130
0141
0216
10310840
310
1510
2104410000
2320
29128
9553232
288060
258155
0261517
339
Wl.kg .-
16
780
193154
04
6844
5283
51184357
58000
1979
15275
0300
1510
12940
9000
2230
2485
65829
22
286050
197135
0183431
319
issava Edible aroidsConsumptionEnergy
kcal
14
790
210169
05
6548
50
570
36264
000
20810
167830
330
1660
1344010000
2450
27847
5732
22
317060
198139
01964283410
Protein 8
85
4820
16601384
040
305396
410
4630
2189526
000
147081
1367677
0270
01357
091523884020
19960
21927357
287255
1414
255570
480
1236907
015002374
27981
Production kg
1
1700300
2200
23200
21200
530
55500080
1000000000
1905000600000700100
Wt.kg
1500300
2200
19100
15200
<v 480
53400070500000000
1405000500000600100
ConsumptionEnergy
kcal
1o400200
19000100
13200
410
45400060500000000
1204000500000500100
Proteing
15
7100
4300
337000
2000
2242700
7150
79064
000
1050
7900040000
2070
74000
8000000
9300
1500
^— •-»— roiatoProduc- Consumption
tion kg
66
1125
50008
17803013
260400000
3200
272740
o,0
2026
4000
1043
02000
311
1090
1915
103
Wl.kg
32
828
403060
1202013
190320000
2601
31182502
191740009
3503900
211670
2010
102
Energy kcal
22
620302040801012
130010000
1800
2213IB01
131230007
2502700
150450
147102
Proteing
535
122415
571
510
840
1750
300
1847
28100
266005
38408
462272376
123
281259
56015
140526
049
13532
3158
92108
4304155
156
34
continued
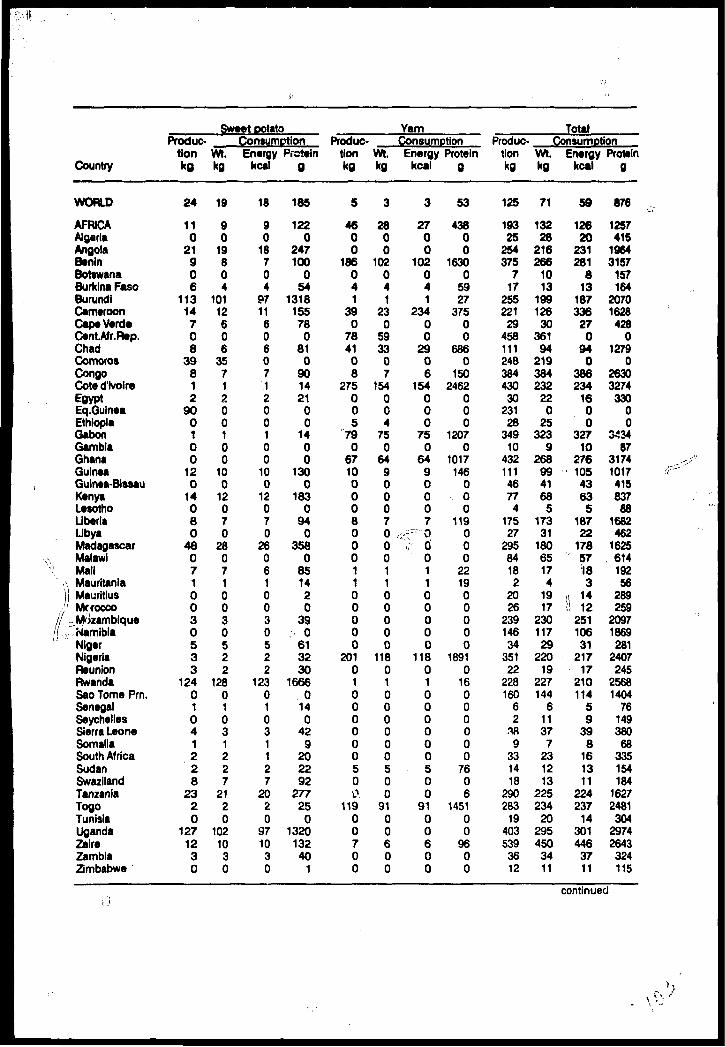
Sweet potato
Country
WORLD
AFRICAAlgeriaAngolaBeninBotswanaBurkina FasoBurundiCameroonCape VerdeCent.Afr.Rep.ChadComorosCongoCote d'lvoireEgyptEq.GuineaEthiopiaGabonGambiaGhanaGuineaGuinea-BissauKenyaLesothoLiberiaLibyaMadagascarMalawi
:. Mali• Mauritaniajj Mauritius/' Morocco
II .Mozambiquell.. Namibia
NigerNigeriaReunionRwandaSao Tome Prn.SenegalSeychellesSierra LeoneSomaliaSouth AfricaSudanSwazilandTanzaniaTogoTunisiaUgandaZaireZambiaZimbabwe
Produc tionkg
24
110
21906
11314708
39812
900100
120
14080
480710030533
12401041228
2320
1271230
ConsumptionWt.kg
19
90
19804
10112606
3571200100
100
12070
280710030522
12801031227
2120
1021030
Energy kcal
18
90
18704
9711606071200100
100
12070
260610030522
12301031127
2020
9710
30
Proteing
185
1220
247100
054
131815578
081
0901421
00
1400
1300
1830
940
3580
851420
39, 0
613230
16660
140
429
202292
277250
132013240
1
Productionkg
5
4600
186041
390
784108
275005
790
671000080001100000
20101000000500.
11900700
Wt.kg
3
2800
102041
230
5933
07
154004
750
64900070001100000
11801000000500
9100600
YamConsumptionEnergy
kcal
3
2700
102041
23400
2906
154000
750
6490007,-<"•" o
> 601100000
11801000000500
9100600
Proteing
53
43800
16300
5927
37500
6860
1502462
000
12070
1017146
000
119000
221900000
18910
16000000
7606
145100
9600
TotalProduc- Consumption
tion kg
125
19325
254375
717
255221
2945811124838443030
23128
34910
4321114677
417527
29584182
2026
23914634
35122
228160
62.•w9
331418
290283
194035393612
Wt.kg
71
13228
216266
1013
19912630
36194
219384232
220
25323
9268
9941685
17331
18065174
1917
23011729
22019
227144
611377
231213
225234
20295450
3411
Energy kcal
59
12620
231281
813
187336270
940
386234
1600
32710
27610543635
18722
17857183
\\ 14•I 12
25110631
21717
210114
59
398
161311
224237
14301446
3711
Proteing
876
1257415
19643157
157164
20701628428
01279
026303274
33000
343487
31741017415837
881682462
162561419256
289259
20971869
2812407245
25681404
76149380
68335154184
16272481304
29742643324115
continued
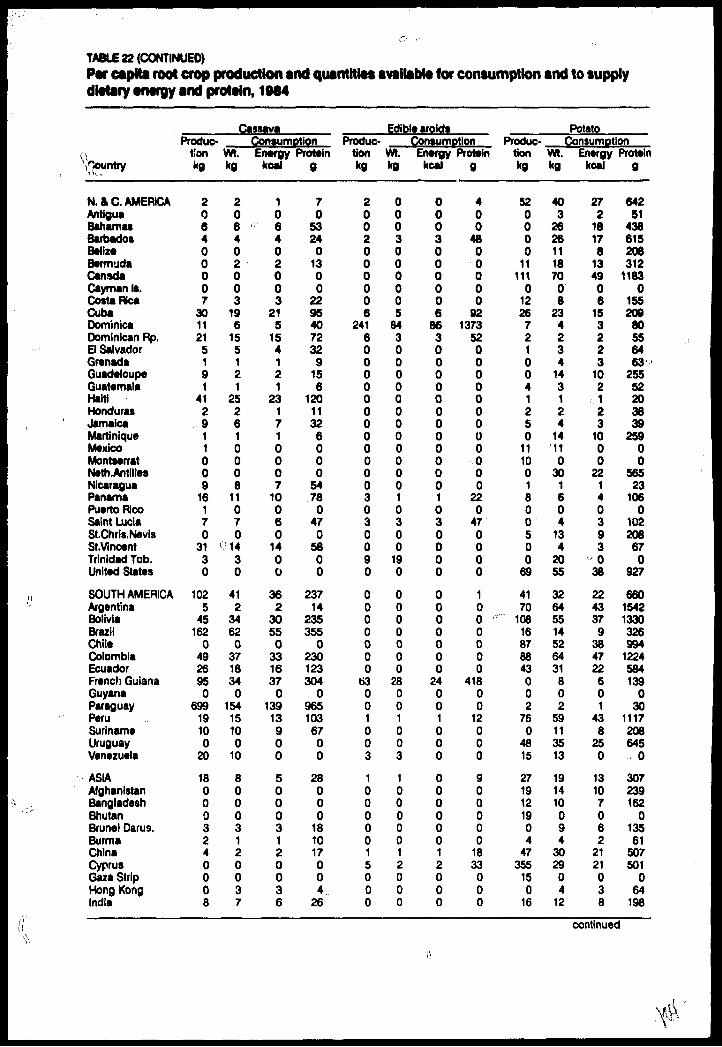
TABLE 22 (CONTINUED)raw capita root crop proouction ana quantum avanaow tor consumption ana to vuppiy diatary anargy and protain, 1984
CassavaProduc-
Vi », ;
N.&C. AMERICAAntiguaBahamasBarbadosBelizeBermudaCanadaCayman to.Costa RicaCubaDominicaDominican Rp.El SalvadorGrenadaGuadeloupeGuatemalaHaitiHondurasJamaicaMartiniqueMexicoMontserratNeth.AntlllesNicaraguaPanamaPuerto RicoSaint LuciaSt.Chris.NevisSt.VincentTrinidad Tob.United States
SOUTH AMERICAArgentinaBoliviaBrazilChileColombiaEcuadorFrench GuianaGuyanaParaguayPeruSurinameUruguayVenezuela
ASIAAfghanistanBangladeshBhutanBrunei Darus.BurmaChinaCyprusGaza StripHong KongIndia
tionkg
206400007
3011215191
412911009
16170
3130
1025
45162
04926950
69919100
20
180003240008
Wt.kg
206402003
196
155121
252610008
11070
0 1430
412
34620
3718340
15415100
10
80003120037
ConsumotionEnergy
kcal
106402003
215
154121
231710007
10060
1400
362
30550
3316370
13913900
50003120036
Proteing
70
53240
1300
22954072329
156
12011326000
5478
0470
5800
23714
235355
0230123304
09651036700
28000
181017004..
26
Edible aroidsProduc
tionkg
2002000006
24160000000000003030090
0000000
63001003
10000015000
Wt.kg
0003000005
84300000000000010300
190
0000000
28001003
10000012000
ConsumotionEnergy
kcal
0003000006
8630000000000001030000
0000000
24001000
00000012000
Protting
400
4800000
921373
52000000000000
220
470000
100 '0000
41800
12000
900000
1833
000
Productionkg
520000
11111
012267210041250
111001800500
69
4170
10816878843002
760
4815
2719121904
47355
150
16
PotatoConsumotion
Wt.kg
403
262611187008
234234
143124
14110
301604
134
2055
32645514526431
802
59113513
191410094
302904
12
Energykcal
272
18178
134906
153223
102
:< 1
23
1000
221403930
38
2243379
384722601
438
250
13107062
2121038
Proteing
64251
438615206312
11830
155209
80556463
25552203839
25900
56523
1060
102206670
927
66015421330326994
1224584139
030
1117208645
0
307239162
013561
507501
064
198
continued

Sweet ootato! Produc
tion Country kg
N. & C. AMERICAAntiguaBahamasBarbadosBelizeBermudaCanadaCayman Is.Costa RicaCubaDominicaDominican Rp.El SalvadorGrenadaGuadeloupeGuatemalaHaitiHondurasJamaicaMartiniqueMexicoMontserratNeth.AntillesNicaraguaPanamaPuerto RicoSaint LuciaSt.Chris.NevIsSt.VincentTrinidad Tob.United States
SOUTH AMERICAArgentinaBoliviaBrazilChileColombiaEcuadorFrench GuianaGuyana .\,ParaguayPeruSurinameUruguayVenezuela
ASIAAfghanistanBangladeshBhutanBrunei Darus.BurmaChinaCyprusGaza StripHong KongIndia
412801000
34191002
250
550
1621
110003
113
1422
511
1610100
3170
200
3807011
920002
Wl.kg
313701000
271070260
440
1320
100000
103332
410
1310100
2660
150
2907011
710002
ConsumptionEnergy
k-.al
313601000
26960250
420
131700000092302
391200100
2250
130
2806011
710002
Protein g
341335710
13500
2969372
118720
4803
142238
000000
1021929
027
3699
828
60b00
258593
1470
2830
59055
707002
18
Production kg
100
13000100
60104
300
190
6527
000094
301638
30
10010400000002
00000000000
Wt.kg
100
11000000
3720470
150
57.11"
000040
261423
50
10010400000002
00000000000
YamConsumption
Energy kcal
100
10, 0
00000
3320370
130
5110000040
241320
00
10010400000000
00000000000
Protein g
13130
202000000
78737
080
1560
2690
1201223
0000
800 ,
477302471
00
1500
140
75000000
, 00
10000000000
TotalProduc- Consumption
tion kg
6118
271912
1111
1996
338406
3179
5123
g10876
/1411'0
1036108254
2371771
15086
16118588
.4173
15818
732111126841
8419193247
144360
150
26
Wt.kg
465
3551242270
01175
14129
83238
591
59379130
329
230
7957964956
7877957953
I'd527014
18286225029
5714160
126
10432
08
20
Energy kcal
324
2740191649
01068
136287
2932
3 (l' 84 ,\
48468
00
248
210
704989
040
62547168<K)
A406712
162651838
0
4710130
104
9523
09
16
Proteing
70476
527960365338
11880
192692
237328897
518607
58957
6615561128
00
59979
310/0
1109962
14900
955
95616551626724
10001529737861168
12531349296792
0
629239222
016275
1250534
081
243
continued

TABLE 22 (CONTINUED)rar capnei root crop proaucmm ana quamnws avauaDw ior consumption ana to supply dMary anargy and protain,i9M
CassavaProduc-
"
Country
IndonesiaIranIraqIsraelJapanJordanKampuchea Dm.Korea D.P.R.Korea Rep.KuwaitLaos :LebanonMacauMalaysiaMaldivesMongoliaNepalOmanPakistanPhilippinesSaudi ArabiaSingaporeSri LankaSyriaTaiwanThailandTurkeyUAEmiratesVtotNam ,,Yemen A.R. kYemen Dem. \vyf
EUROPEAlbaniaAustria vBelgium-Lux.-BulgariaCzechoslovakiaDenmarkFaeroe Is.RnlandFranceGerman D.R.Germany F.R.GreeceHungaryIcelandIrelandItalyLiechtensteinMaltaNetherlandsNorwayPolandPortugalRomaniaSpainSweden
tionkg
8700000
13000
1900
2400000
2900
4304
39700
50'•' 0 ''0
00000000000000000000000000
Wl.kg
6200000
13000
1403
2000000
340
143200
1800
4200
00000000000000000000000000
Edible arc-IdsConsumotion Produc-Energy
kcal
000000
13000
1403
2000000
350
1333
00
1700
4300
00000000000000000000000000
Proteing
000000
89000
830
19129
00000
2360
59225
00
70v,0
0295
00
00000000000000000000000000
tionkg
00003000000000
100000200003000000
00000000000000000000000000
Wl.kg
0000200000000090000200000000000
00000000000000000000000000
ConsumotionEnergy
kcal
000020000000007000 ,0100000000000
00000000000000
. 000000000000
Proteing
0000
42000200300
1690000
32000
„ 00000000
00000
,00000000000000
. 0000000
PotatoProduc- Consumption
tionkg
1368
473160
85110
11* 45
000
6824
151004
3220
6625
298
22945
15116147
257219
3215312771413210614553
22443
43337
463118
1014112282157157
Wt.kg
230
83631160
626
189
32130
3816041973
2500
52174
279
81346289307971
010275
14678655564
126390
238282
1169471
10872
Energykcal
0216
2619110
44406
23020
2711030752
1800
37123
196
582345652257510
7353
1065546394788280
1659588569527952
Proteing
0505111615264269
01059
1060
156541
10510
641275
0719
15512745
42402
87729272
462146
1360571
10471514514
13351174
017241267247712981098929
10962003646
0384
1369139619801606120218381219
continued

Sweet ootatoProduc
tion Country kg
IndonesiaIranIraqIsraelJapanJordanKampuchea Dm.Korea D.P.R.Korea Rep.KuwaitLaosLebanonMacauMalaysiaMaldivesMongoliaNepalOmanPakistanPhilippinesSaudi ArabiaSingaporeSri LankaSyriaTaiwanThailandTurkeyUAEmiratesVietNamYemen A.R.Yemen Dem.
EUROPEAlbaniaAustriaBelgium-Lux.BulgariaCzechoslovakiaDenmarkFaeroe Is.RnlandFranceGerman D.R.Germany F.R.GreeceHungaryIcelandIrelandItalyLiechtensteinMaltaNetherlandsNorwayPolandPortugalRomaniaSpainSweden
14000
1204
2322
0900300000
150090
22700
3200
00000000000000000000004010
ConsumptionWt.Kg
13000504
1870
1900100000
1400600600
23 a00
000000000000000010010
,,o1010
Energy kcal
0000504
1870
1800100000
1300600600
2200
00000000000000001001001010
Protein g
0001
490
3617567
0173
00860002
13530
5800
6300
20500
3000000000004000
1000
1100
140
110
Produc tion kg
00r> o0100000000000000000000000000
00000000000000000000000000
YamConsumption
Wt. Energy Protein kg kcal g
0000100000000000000000000000000
00000000000000000000000000
0000100000b00000000000000000000
00000000000000000000000000
0000
1600000000000000400000000000
00000000000000000000005000
TotalProduc- Consumption
tionKg
103368
4748ti
18108330
39451333476833
15
4700
563231
40466
287298
22945
15116147
257219
3215312771413210614553
22443
43337
463118
1014116282158157
Wt.kg
7730
8364016188013184232172445382004
5110214125'0
2452176927
9
81346289307971
010275
14678655564
126390
238382
1169671
10972
Energy Protein kcal g
021
62627111862110
3923162340271503
507
2940180
23371267196
582345652257510
7353
1065546394788290
1d60588570528052
0505111615382271143
1234177
0412548243191746641339
073
421160229327424
0135877292571462146
1363571
10471514514
13351174
017241267 :247712981102930
10962004
6560
3841379139619801625120218491219
continued

TABLE 22 (CONTINUED)Par capita root crop production and quantttias availablt for consumption and to aupply dlttary tnargy and protaln, 1984
CassavaProduc-
Country i: -~
SwitzerlandUnited KingdomYugoslavia
OCEANIAAmerican SamoaAustraliaCook WandsFijiFr.PolynesIaGuamKiribatiNew Caledonia
.'Me* ZealandNiuePacific Is.Papua N.GuineaSamoaSolomon Is.TokelauTongaTuvaluVanuatuWallis Etc.
U.S.S.R.
DEVELOPINGNATIONS
DEVELOPEDNATIONS
tionkg
000
1010
,-201128
3100
190
176730240
15300
200
0
38
0
Wt.
000
600
v. 0902400
10000
252400000
0
22
o
ConsumotionEnergy
kcal
0" Vl
00
600 ,..0
912400
10000
252
., 400000 ;,
0
19
0
Proteina
000
44000
628169
00
67000
i176.1/19
310000
0 o0
114
0
Edible aroidsProduc
tion kg
000
18103
00
3700
4019
0433
053
23081
0276
00
133
0
1
0
Wt.kg
000
10000
2900
389000
4318277
0221
000
0
1
0
ConwmotionEnergy
kcal
000
8000
2300
337000
33142600
190000
0
1
0
Proteing
000
177000
52900
571167
000
76632861381
03308
000
0
18
4
PotatoProduc- Consumotion
tionkg
142130107
550
6602
1900
10910000000000
311
25
186
Wt.kg
5010255
460
580
182100
23560012000010
110
17
75
Energy kcal
357440
330
420
131500
1641
0011000010
78
12
53
Proteing
8481721942
8640
11040
301363
00
3871061
00
17310000
220
1870
295
1244
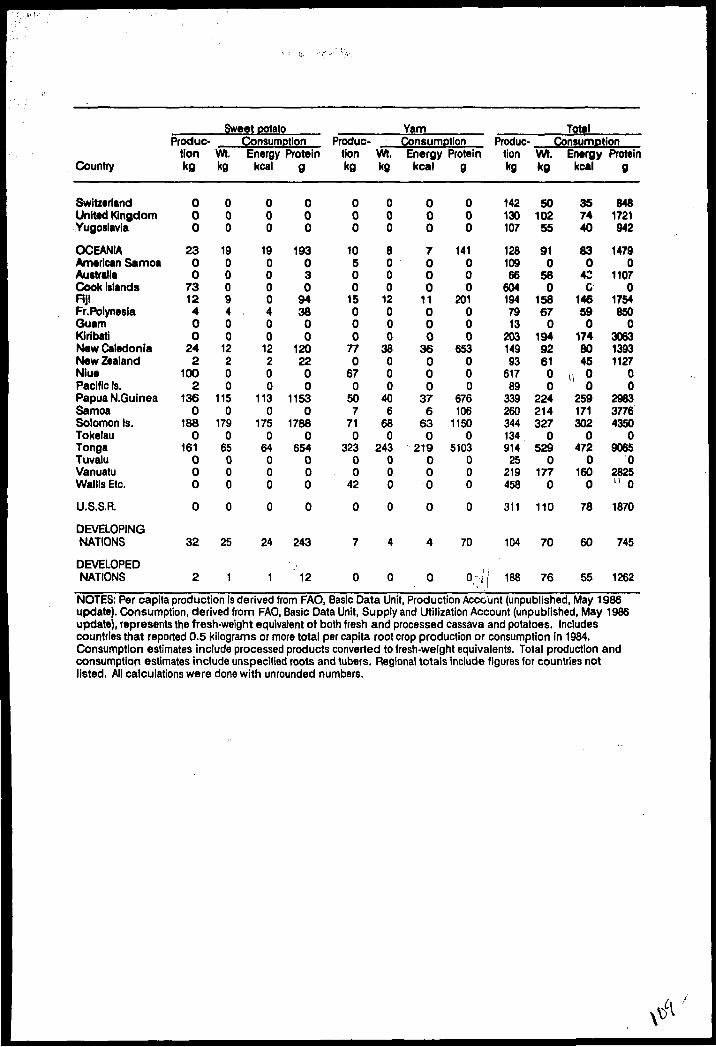
Sweet potatoProduc-
Country
SwitzerlandUnited KingdomYugoslavia
OCEANIAAmerican SamoaAustraliaCook IslandsFijiFr.PolynesiaGuamKiribatiNew CaledoniaNew ZealandNiuePacific Is.Papua N.GuineaSamoaSolomon Is.TokelauTongaTuvaluVanuatuWallls Etc.
U.S.S.R.
DEVELOPINGNATIONS
DEVELOPEDNATIONS
tionkg
000
2300
7312400
242
1002
1360
1880
161000
0
32
2
Wt.kg
000
190009400
12200
1150
1790
65000
0
25
1
ConsumptionEnergy
kcal
000
190000400
12200
1130
1750
64000
0
24
1
Proteing
000
193030
943800
1202200
11530
17880
654000
0
243
12
Production kg
000
10500
15000
770
670
507
710
32300
42
0
7
0
Wt,kg
000
8000
12000
38000
406
680
243000
0
4
0
YamConsumptionEnergy kcal
000
7000
11000
36000
376
630
219000
0
4
0
Proteing
000
141000
201000
653000
676106
11500
5103000
0
70
0->,
TotalProduc- Consumption
tionkg
142130107
12810966
6041947913
20314993
61789
339260344134914
25219458
311
104
188
Wt.kg
so10255
910
580
15867
0194926100
224214327
0529
0177
0
110
70
76
Energy kcal
357440
830
43G
146590
1748045
0 °0
259171302
0472
0160
0
78
60
55
Proteing
8481721942
14790
11070
1754850
0306313931127
00
298337764350
09065
02825u 0
1870
745
1262
NOTES: Per capita production is derived from FAO, Basic Data Unit, Production Account (unpublished, May 1986 update). Consumption, derived from FAO, Basic Data Unit, Supply and Utilization Account (unpublished, May 1986 update), represents the fresh-weight equivalent of both fresh and processed cassava and potatoes. Includes countries that reported 0.5 kilograms or more total per capita root crop production or consumption in 1984. Consumption estimates include processed products converted to fresh-weight equivalents. Total production and consumption estimates include unspecified roots and tubers. Regional totals include figures for countries not listed, All calculations were done with unrounded numbers.
tft
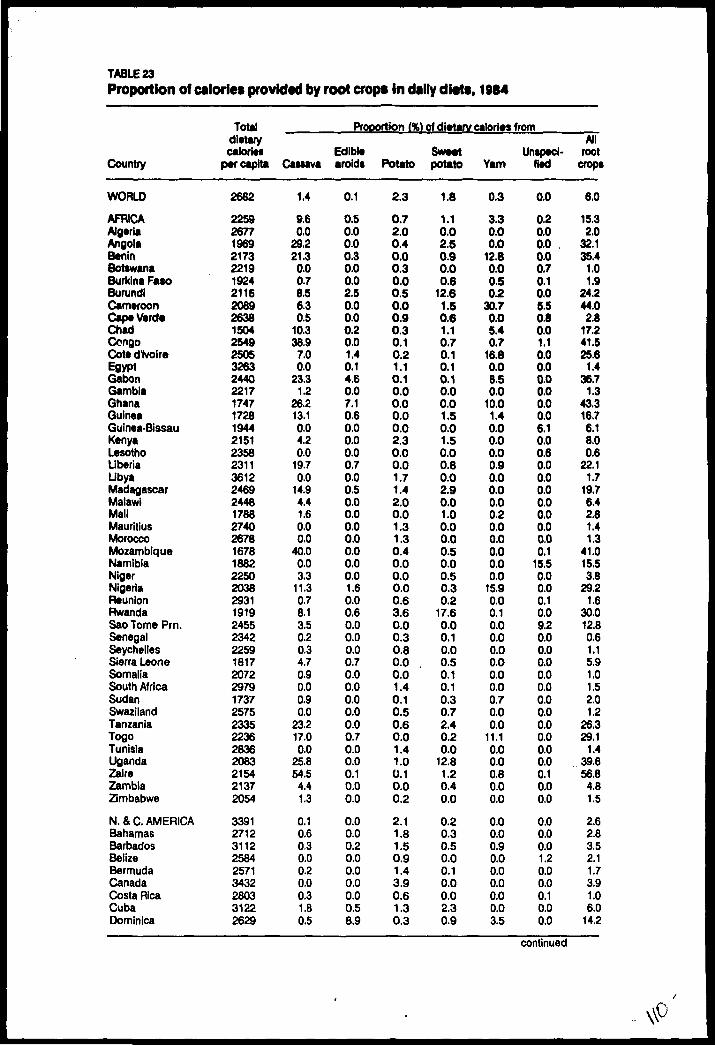
TABLE 23Proportion of calories provided by root crops in dslly diets, 1984
Country
WORLD
AFRICAAlgeriaAngolaBeninBotswanaBurkina FasoBurundiCamtroonCapt VerdeChadCongoCot* d'lvoireEgyptGabonGambiaGhanaGuineaGuinea-BissauKenyaLesothoLiberiaLibyaMadagascarMalawiMaliMauritiusMoroccoMozambiqueNamibiaNigerNigeriaReunionRwandaSaoTomePrn.SenegalSeychellesSierra LeoneSomaliaSouth AfricaSudanSwazilandTanzaniaTogoTunisiaUgandaZaireZambiaZimbabwe
N. & C. AMERICABahamasBarbadosBelizeBermudaCanadaCosta RicaCubaDominica
Total dietary calories
per capita
2682
225926771969217322191924211620892638150425492505326324402217174717281944215123582311361224692448178827402678167818822250203829311919245523422259181720722979173725752335223628362083215421372054
339127123112258425713432280331222629
Proportion (%) of dietary calories from
Cassava
1.4
9.60.0
29.221.30.00.78.56.30.5
10.338.9
7.00.0
23.31.2
26.213.10.04.20.0
19.70.0
14.94.41.60.00.0
40.00.03.3
11.30.78.13.50.20.34.70.90.00.90.0
23.217.00.0
25.854.5
4.41.3
0.10.60.30.00.20.00.31.80.5
Edible aroidi
0.1
0.50.00.00.30.00.02.50.00.00.20.01.40.14.60.07.10.60.00.00.00.70.00.50.00.00.00.00.00.00.01.60.00.60.00.00.00.70.00.00.00.00.00.70.00.00.10.00.0
0.00.00.20.00.00.00.00.58.9
Potato
2.3
0.72.00.40.00.30.00.50.00.90.30.10.21.10.10.00.00.00.02.30.00.01.71.42.00.01.31.30.40.00.00.00.63.60.00.30.80.00.01.40.10.50.60.01.41.00.10.00.2
2.11.81.50.91.43.90.61.30.3
^••aaiat V**W1
potato
1.8
1.10.02.50.90.00.6
12.61.50.61.10.70.10.10.10.00.01.50.01.50.00.80.02.90.01.00.00.00.50.00.50.30.2
17.60.00.10.00.50.10.10.30.72.40.20.0
12.81.20.40.0
0.20.30.50.00.10.00.02.30.9
Yam
0.3
3.30.00.0
12.80.00.50.2
30.70.05.40.7
16.80.08.50.0
10.01.40.00.00.00.90.00.00.00.20.00.00.00.00.0
15.90.00.10.00.00.00.00.00.00.70.00.0
11.10.00.00.80.00.0
0.00.00.90.00.00.00.00.03.5
Unspeci fied
0.0
0.20.00.00.00.70.10.05.50.80.01.10.00.00.00.00.00.06.10.00.60.00.00.00.00.00.00.00.1
15.50.00.00.10.09.20.00.00.00.00.00.00.00.00.00.00.00.10.00.0
0.00.00.01.20.00.00.10.00.0
All root
crops
6.0
15.32.0
32.135.4
1.01.9
24.244.02.8
17.241.525.6
1.436.7
1.343.316.76.18.00.6
22.11.7
19.76.42.61.41.3
41.015.53.8
29.21.6
30.012.80.61.15.91.01.52.01.2
26.329.1
1.439.656.8
4.81.5
2.62.83.52.11.73.91.06.0
14.2
continued

TABLE 23 (CONTINUED)Proportion of calorie* provided by root crop* in daily dieta, 1984
Country
Dominican Rp.El SalvadorGrenadaGuadeloupeHaitiHondurasJamaicaMartiniqueNeth.AntillesNicaraguaPanamaSaint LuciaStChris.NevisSt.VincentUnited States
SOUTH AMERICAArgentinaBoliviaBrazilChileColombiaEcuadorFrench GuianaGuyanaParaguayPeruSurinameUruguay
ASIAAfghanistanBangladeshBrunei Darus.ChinaCyprusHong KongIndiaIranIraqIsraelJapanJordanKampuchea Dm.Korea D.P.R.Korea Rep.LaosLebanonMacauMalaysiaMaldivesMongoliaNepalPhilippinesSaudi ArabiaSingaporeSri LankaSyria
Total dietary calories
per capita
246121482362268518552211258528192860242524192460224126853663
2627322121462633260225742054278125022796217126812695
2459222118992811258734602698218931222926306028562947211031512841222829932161268420412807203423413128277123853168
Proportion (%) of dietary calories from
Cassava
1.60.50.20.23.40.20.70.10.00.81.20.70.01.40.0
3.70.23.95.70.03.52.13.70.0
13.61.70.90.0
0.50.00.00.30.20.00.30.80.00.00.00.00.01.70.00.01.70.00.42.00.00.00.04.10.01.33.70.0
Edible arotd
0.40.00.00.00.00.00.00.00.00.00.20.30.00.00.0
0.00.00.00.00.00.00.02.30.00.00.10.00.0
0.10.00.00.00.10.10.00.00.00.00.00.20.00.00.00.00.00.00.00.01.00.00.00.20.00.00.00.0
flfif » trtroraio
0.20.30.31.00.10.20.31.02.10.10.50.31.10.32.9
2.33.74.71.04.05.03.00.60.00.15.40.82.6
1.51.21.00.62.21.70.31.01.90.52.41.81.10.03.80.40.82.10.10.20.02.61.50.00.60.50.21.5
SweetMJ*AAAApotato
0.70.00.20.66.20.01.31.70.00.00.01.00.30.30.1
0.30.70.10.30.10.00.10.00.02.20.60.01.3
3.20.00.90.17.50.00.00.20.00.00.00.50.00.51.50.62.20.00.00.10.00.00.01.60.00.00.70.0
Yam
0.20.00.40.72.00.05.50.90.00.00.52.61.62.10.0
0.10.00.00.10.00.40.00.00.00.00.00.00.0
0.00.00.00.00.00.00.00.00.00.00.00.10.00.00.00.00.00.00.00.00.00.00.00.00.00.00.00.0
Unspeci fied
0.00.02.30.60.80.11.03.00.20.00.12.93.05.00.0
0.00.00.40.00.00.00.20.01.30.00.40.10.0
0.00.00.00.10.00.00.20.00.00.00.00.10.00.10.00.00.00.01.50.14.40.00.50.00.01.10.00.0
All root
crops
3.10.93.33.3
12.50.58.96.62.30.92.47.86.09.13.0
6.44.69.17.04.19.05.46.61.3
15.98.21.83.9
5.21.21.91.0
10.11.80.92.01.90.52.42.61.12.35.41.14.72.12.02.45.42.62.05.90.62.94.61.5
continued

TABLE 23 (CONTINUED)Proportion of calorits provided by root crops in daily ditts, 1984
Country
ThailandTurkeyU.A. EmiratesVletNamYemen A.R.Yemen Dem.
EUROPEAlbaniaAustriaBelgium-Lux.BulgariaCzechoslovakiaDenmarkFinlandFranceGerman D.R.Germany F.R.GreeceHungaryIcelandIrelandItalyMaltaNetherlandsNorwayPolandPortugalRomaniaSpainSwedenSwitzerlandUnited KingdomYugoslavia
OCEANIAAustraliaFijiFr.PolynesiaKiribatiNew CaledoniaNew ZealandPapua N.GuineaSamoaSolomon Is.TongaVanuatu
U.S.S.R.
DEVELOPINGNATIONS
DEVELOPEDNATIONS
Total dietary calories
per capita
246231673625224022502337
340627263514369236633465354730263359379134743721348230973831353825523343323932803161338533583097343231313602
316633892936289926732934338621812433212228792344
3440
2438
3397
ProDortion (%) of dietary calories from
Cassava
1.80.00.05.20.00.0
0.00,00.00.00.00.00.00.00.00.00.00.00.00.00.00.00.00.00.00.00.00.00.00.00.00.00.0
0.60.08.52.30.00.90.03.20.30.50.00.0
0.0
2.1
0.0
Edible arokJ
0.00.00.00.00.00.0
0.00.00.00.00.00.00.00.00.00.00.00.00.00.00.00.00.00.0
1,0.0; o.o
0.00.00.00.00.00.00.0
0.70.02.10.03.40.70,04.2
16.07.7
18.10.0
0.0
0.1
0.0
Potato
0.03.20.90.42.30.7
4.72.33.54.81.74.54.06.64.37.74.33.43,14.26.32.21.74.94.97.16.04.26.44.62.86.53.1
2.93.41.21.40.01.53.30.10.10.00.00.1
6.2
1.3
4.3
Sweet pciato
0.70.00.02.60.00.0
0.00.00.00.00.00.00.00.00.00.00.00.00.00.00.00.10.00.10.00.00.10.00.10.00.00.00.0
1.60.00.90.30.01.10.2
14.20.0
22.76.10.0
0.0
2.7
0.1
Yam
0.00.00.00.00.00.0
0.00.00.00.00.00.00.00.00.00.00.00.00.00.00,00.00.00.00.00.00.00,00.00.00.00.00.0
0.60.01.00.00.03.30.04.60.68.1
20.80.0
0.0
0.5
0.0
Unspeci fied
0.00.00.00.00.00.0
0.00.00.00.00.00.00.00.00.00.00.00.00.00.00.00.00.00.00.00.00.00.00.00.00.00.00.0
0.80.00.01.5
14.50.00.26.32.20.00.0
18.6
0.0
0.0
0.1
All root
crops
2.63.20.98.22.30.7
4.72.33.54.81.74.54.06.64.37.74.33.43.14.26.32.21.75.04.97.16.14.26.54.62.86.53.1
7.23.4
13.75.6
17.97.53.7
32.619.239.045.018.8
6.2
6.7
4.4
NOTES: Per capita production is derived from FAO, Basic Data Unit, Production Account (unpublished, May 1986 update). Includes countries in which the proportion of dietary calories from all root crops is 0.5 percent or greater. Regional totals include figures for countries not listed. All calculations were done with unrounded numbers.
\x

TABLE 24
Cassava balanct shaat, 1984
Utilization (% availability)
Country !(
WORLD
AFRICAAngolaBeninBurkina FaaoBurundiCameroonCap* VerdeCent.Afr.Rep.ChadComorosCongoCoted'h/oireGabonGambiaGhanaGuineaKenyaLiberiaMadagascarMalawiMaliMozambiqueNigerNigeria.ReunionRwandaSao Tome Prn.SenegalSierra LeoneSomaliaSudanTanzaniaTogoUgandaZaireZambiaZimbabwe
N.& C.AMERICABahamasBarbadosCanadaComlnican Rp.Costa RicaCubaDominicaDominican Rp.El SalvadorGuadeloupeGuatemalaHaitiHondurasJamaicaMexicoNicaraguaPanamaSaint LuciaSt.Vmcent
Food
40
5275879537659053908861457095499097
10047489594654075539044
1006090466060519595
509591
070376352
1009040603894758690639528
Feed
17
23000
10035505002500800201
1000
21/ 0-•--'• o
0007100
1904
6700
202000
50070010
160
23
Seed
0
0000000000000000000000000000000000000
00000008000000000000
Processed
36
361400
5500
3700
3740270
47000
2952
520
480
440
23000
4539173700
2100
332063
50000
3443
01540
170
45
Waste
7
109
1358
25107572
10452530
16002
1511153
10120
201091
171255
10540
100
12200
10106
126
101010553
continued

TABLE 24 (CONTINUED)Cassava balance sheet, 1984
Utilization
Country
Trinidad Tob.United States
SOUTH AMERICAArgentinaBoliviaBrazilColombiaEcuadorFrench GuianaParaguayPeruSurinameVenezuela
ASIABrunei Darus.BurmaChinaHong KongIndiaIndonesia •''JapanKampuchea Dm.Korea Rep.LaosMacauMalaysiaPhilippinesSingaporeSri LankaThailandVietNam
EUROPEBelgium-Lux.Denmark :FranceGermany F.R.IrelandItalyNetherlandsPortugalSwitzerlandUnited Kingdom
OCEANIAFijiFr.PolynesiaNew CaledoniaPapua N.GuineaSolomon Is.Tonga
DEVELOPINGNATIONS
DEVELOPEDNATIONS
Food
880
3243743053673521799542
409390453145650
950
6510068888870
585
00000000000
6970705085870
44
0
Feed
3100
2934112718184963100
25
350
191002
10009056000
10
9910010097
1009999
100730
96
12151030
01047
7
97
(% availability)
Seed
00
00000000000
000000000000000000
00000000000
0000000
0
0
Processed
00
28150
312401710
29
5300
33555124900
100170
25680
950
10030110
27100
4
50
10000
42
40
3
Waste
90
117
15125
15159
1055
42
10344905090203
3005
00000000000
14151020153
11
8
0
NOTES: See Table 29.

TABLE 25Edible aroid balance theet, 1984
Utilization <%availabi!itvl
Country
WORLD
AFRICABeninBurundiCent.Afr.Rep.ChadCote d'rvoireEgyptGabonGhanaGuineaLiberiaMadagascarNigeriaRwandaSierra LeoneTogoZaire
N. & C. AMERICABarbadosCubaDominicaDominican Rp.PanamaTrinidad Tob.
SOUTH AMERICAFrench GuianaPeruVenezuela
ASIAChinaCyprusJapanKorea Rep.LebanonMaldivesPhilippines
OCEANIAFijiKiribatiNew CaledoniaPapua N.GuineaSamoaSolomon Is,Tonga
DEVELOPINGNATIONS
DEVELOPEDNATIONS
Food
82
7986
1008580708490958090557290908595
81959036818790
85417792
8790588090909780
8380975080949583
82
80
Feed
2
10000000000
3000000
300
21000
34400
55
1250005
3103
30060
12
2
5
Seed
2
25005
20650
100000000
200
11080
90
138
30
1210000
10
00000000
1
10
ProoMMd
0
00000000000000000
0000000
0000
00000000
00000000
0
0
Watt*
13
1890
1515101055
101015281010155
145
1032196
10
315100
55
185
101035
14100
2020055
14
5
NOTES: See Table 29.

TABLE 26Potato balance ahatt, 1984
Utilization (% availability)
Country
WORLD
AFRICAAlgtriaAngolaBotswanaBurundiCameroonCape VerdeChadCongoCota d'rvoireEgyptEthiopiaGabonKenyaLiberiaLibyaMadagascarMalawiMauritaniaMauritiusMoroccoMozambiqueNigeriaReunionRwandaSenegalSeychellesSierra LeoneSomaliaSouth AfricaSudanSwazilandTanzaniaTogoTunisiaUgandaZaireZambiaZimbabwe
N.& C.AMERICABahamasBarbadosBelizeBermudaCanadaCosta RicaCubaDominicaDominican Rp.El SalvadorGuadeloupeGuatemalaHaitiHondurasJamaicaMartiniqueMexico
Food
47
73777795690
9075 .78937878958095836762878571857783758783
1009068816578
1008269708588
778195997763828248789381818388738285
Feed
23
30000
1800000000006400400000000
10000000000
60000
2842
30009000050
Seed
12
1313130
2767
510125
11170
100
12152435
141085
15300099
301207
1120107
70000845
121020
1272
1205
Processed
10
10000000000000000000000200
12009000020000
31700
200000003000090
Waste
8
10101054
185
is102
1155
1055
12101010115
1510101050
105
105
100
10201055
725130
10101011577
1011155
10
continued
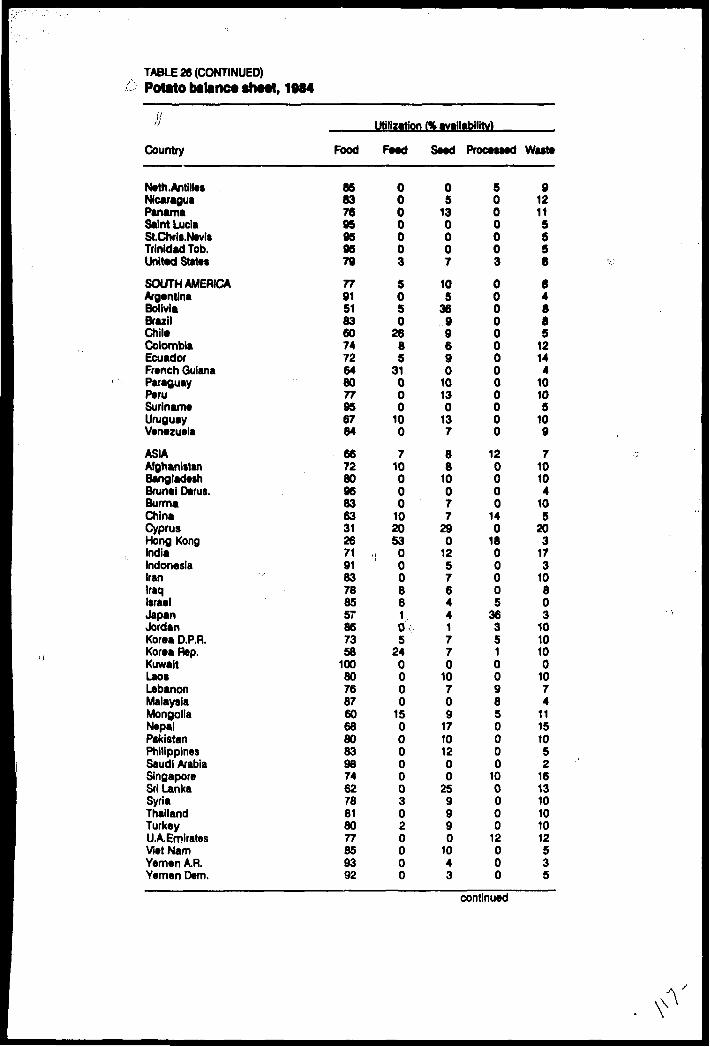
TABLE 26 (CONTINUED)Potato balance shatt, 1984
// I.I
Country
Neth.AntillesNicaraguaPanamaSaint LuciaSt.Chris.NevisTrinidad Tob.United States
SOUTH AMERICAArgentinaBoliviaBrazilChiltColombiaEcuadorFranch GuianaParaguayPtruSurinam*UruguayVenezuela
ASIAAfghanistanBangladashBrunei Darus.BurmaChinaCyprusHong KongIndiaIndonesiaIranIraqIsraelJapanJordanKorea D.P.R.Korea Rep.KuwaitLaoaLebanonMalaysiaMongoliaNepalPakistanPhilippinesSaudi ArabiaSingaporeSri LankaSyriaThailandTurkeyUAErplratesVietNamYemen A.R.Yemen Dem.
Utilization (% availability)
Food
85837685959579
77915183607472648077956784
6672809683633126719183788557867358
1008076876068808398746278818077859392
Feed
0000003
5050
2685
31000
100
710000
102053
0008610\\5
240000
150000003020000
Seed
05
130007
105
3699690
10130
137
88
10077
290
12576441770
10709
17101200
259990
1043
Processed
5000003
0000000000000
120000
140
1800005
36351009850000
100000
12000
Waste
912115558
84885
12144
10105
109
710104
105
203
173
10803
1010100
1074
11151052
161310101012535
continued

TABLE 26 (CONTINUED)Potato bilanc* slMtt, 19*4
Utilization (% availability)
Country
EUROPEAlbaniaAustriaBelgium-Lux.BulgariaCzechoslovakiaDenmarkFinlandFranceGerman D.R.Germany F.RGreeceHungaryIcelandIrelandItalyMaltaNetherlandsNorwayPolandPortugalRomaniaSpainSwedenSwitzerlandUnited KingdomYugoslavia
OCEANIAAustraliaFijiFr.PolynesiaNew CaledoniaNew ZealandPapua N. Guinea
U.S.S.R.
DEVELOPINGNATIONS
DEVELOPEDNATIONS
Food
34753667573226546120S36444
10048816117601182247041357150
8388
\\ 875976
j 6577 94
35
69
39
Feed
345
221921267
164
691911250
17404
13543
40125
501422
3214540
32
6
30
Seed
10974
13106
106769
190
117
185
11141578668
21
54279
101
19
9
13
PfOOtSMG
140
2620
135420194
13530747
7816100
160
42151
400
260
160
7
8
11
Waste
" '81097
101970
1008
11100
174
1410
111
13106726
55
104
1055
8
8
8
NOTES: See Table 29.

TABLE 27SwMt potato telanct strati, 1984
Utilization (% availabilitv)
Country
WORLD
AFRICAAngolaBeninBurkina FasoBurundiCameroonCape VerdeChadComorosCongoCote d'rVoireEgyptGabonGuineaKenyaLiberiaMadagascarMaliMauritaniaMozambiqueNigerNigeriaReunionRwandaSenegalSierra LeoneSomaliaSouth AfricaSudanSwazilandTanzaniaTogo 'UgandaZaireZambiaZimbabwe
N. & C. AMERICABahamasBarbadosCanadaCubaDominicaDominican Rp.GuadeloupeHaitiHondurasJamaicaMartiniqueMexicoSaint LuciaSt.VlncentTrinidad Tob.United States
Food
77
839090859088908090908589958586905895909090808090859080889090928080839090
8395909680528825808885909390509087
Feed
13
3000020550000000
300000050000
1000000200
4050
10200
60000000
5004
U Seed Processed
•n>10
>.> 0000000000004000000000000000000
1000
30000800000000009
3
000000000000000000000000000000000000
00000000000000000
Waste
6
13101015101010155
1015115
151010125
1010102015101510202
10108
20205
1010
9554
10201215201215107
100
100
continued
Y

TABLE 27 (CONTINUED)gitwipwMiu Dvwncv «nv*i, ive>*
Utilization (% availability)
Country
SOUTH AMERICAArgentinaBoliviaBrazilChileEcuadorParaguayPeruUruguayVenezuela
ASIABangladeshBurmaChinaHong KongIndiaIndonesiaJapanKampuchea Dm.Korea O.P.R.Korea Rep.LaosMalaysiaPakistanPhilippinesSaudi ArabiaSri LankaThailandVletNam
EUROPEBelgiun-Lux.Germany F.R.GreeceItalyNetherlandsPortugalSpain
OCEANIAAustraliaFijiFr.PolynesiaNew CaledoniaNew ZealandPapua N.GuineaSolomon Is.Tonga
DEVELOPINGNATIONS
DEVELOPEDNATIONS
Food
67926250957084807390
779090778495884295773180259590
100719070
5300
9089
1002085
849080855090859541
77
55
Feed
2100
350
206
10100
1400
151102
130
,517 ;1060
I000
10
37100100
500
605
25
105
30500
44
13
13
Seed
00
280000070
}\ 0000000402".._.- ••'•'t '• — "" ^0500000
15
00000000
000000000
0
4
Processed
000000(r o000
4003300
3906
3900000000
5000
100
100
000000000
3
25
Waste
128
10155
1010101010
51010525
1035
10101010550
29105
500510
1010
145
101020
5155
15
6
3
NOTES: See Table 29.

TABLE 28Yam balance sheet, 1984
\
Utilization (% avallabilitvi
Country
WORLD
AFRICABeninBurkina FasoBurundiCameroonCent.Afr.Rep.ChadCongoCote d'tvoireEthiopiaGabonGhanaGuineaLiberiaMaliMauritaniaNigeriaRwandaSudanTanzaniaTogoZaire
N. & C. AMERICABarbadosDominicaDominican Rp.GuadeloupeHalt!JamaicaMartiniquePanamaSt.Chrls.NevisSaint LuciaStVincentTrinidad Tob.
SOUTH AMERICABrazilColombiaVenezuela
ASIAJapanPhilippines
EUROPEPortugal
OCEANIAFijiNew CaledoniaPapua N.GuineaSamoaSolomon Is.Tonga
DEVELOPINGNATIONS
Food
62
615578
, 100"^-•' ' 60
758090568095
£909590599090957683
82956290258092258690907390
69519082
808453
9595
79805080909576
62
Feed
1
0000005040000000000002
50
200
6000
60000
150
193600
555
o,,iO/
4.1030
0100
14
1
Seed
15
1635130
201000
2010000000
160009
10
0080000090000
1008
106
37
00
0000000
16
PTOOMMQ
0
0000000000000000a00000
0000000000000
0000
000
00
0000
'•:- -, 000
0
Waste
22
2210100
20151510201055
10105
102510105
155
135
10101520
8155
10101210
11121010
555
55
1710202005
10
22
NOTES: See Table 29.
V

TABLE 29Unspecifiad root* and tubers balance sheet, 1984
\\
Utilization (% availability)
Country
WORLD
AFRICABotswanaBurkina FasoCameroonCape VerdeCongoEthiopiaGuinea-BissauLesothoMauritiusMozambiqueNaTniblaReunionSao Tome Prn.Zaire
N.& C.AMERICABelizeCosta RicaGrenadaGuadeloupeHaitiHondurasJamaicaMartiniqueMexicoNeth.AntillesPanama ;iSaint LuciaSt.Chrls.NevisSt. VincentUnited States
SOUTH AMERICABoliviaEcuadorGuyanaPeruVenezuela
ASIABangladeshHong KongIndonesiaJapanKampuchea Dm.LebanonMacau '.MalaysiaMaldivesNepalPhilippinesSaudi ArabiaSingaporeSyriaThailandU.A.Ernirates
Food
67
77SB
100569088959090
09580909075
8770
1009060808595609595
100909069
100
7378857770 ,,73 'I
6010083609095
1009713978584
10074
000
Feed
5
600
1500000
10000 t>000
41000
30000
3000000
100
105000
50005000000000
10061
100
Seed P
100000000000000
15
0000000000000000
151200
2016
00000000000
1000000
yocese*
16
000000000000000
00000000000000
120
000100
340
14380000
850010
260
390
d Waste
10
17120
2910125
101005
20101010
9200
101020155
10550
1010100
111010221011
2031550323
15500000
continued

TABLE 29 (CONTINUED)Unspecified roots and tubwi balance th««t, 1984
Utilization (% availability)
Country Food Feed Seed Processed Wastt
EUROPEDenmarkFranceRalyNetherlandsPortugalSpainUnited Kingdom
OCEANIAFr.PolynesiaKiribatiNew ZealandPapua N.GuineaSamoaVanuatu
DEVELOPINGNATIONS
DEVELOPEDNATIONS
30
3700000
487095SO449680
67
63
5110063
100803
5544
3105
5002
12
5
22
00000000
0000000
1
0
46000
40974556
391000
4400
17
13
00000000
101000
1108
10
3
Derived from FAO, Basic Data Unit, Supply and Utilization Account (unpublished, May 1966 update). Includes countries with 500 tons or more domestic availability. Small quantities of "other uses* are included under the heading 'processed.* Regional totals include figures for countries not listed. All calculations were done with unrounded numbers.

TABLE 30Root crop trade, 1984 (0001)
CassavaCountry Imp
WORLD 26406AFRICAAlgeriaAngolaBotswanaCap* VtrdaCongoCot* d'lvoir*EgyptEthiopiaGabonLesothoLiberiaLibyaMadagascarMalawiMauritaniaMauritiusMoroccoReunionSenegalSeychellesSierra LeoneSomaliaSouth AfricaSudanTogoTunisiaZimbabweN. & C. AMERICABahamasBarbadosBelizeBermudaCanadaCosta RicaCubaDominicaDominican Rp.El SalvadorGuadeloupeGuatemalaHondurasJamaicaMartiniqueMexicoNeth.AntillesNicaraguaPanamaSaint LuciaSt.VincentTrinidad Tob.United StatesSOUTH AMERICAArgentinaBrazilColombiaFrench Guiana
0000000000000000000000000000
1380000600010000001000000
130
00000
Exp
31605
210
180000000000210000000000000
4300000
1700
2600000000000000
200
2000
Edible arolds
Imp
14
0000000000000000000000000000
14000000000000000000000
140
00000
Exp
28
0000000000000000000000000000
2100000001
2000000000000000
00000
PotatoImp
7757
418254
23218
40020190032
241
14110821
360
6617721
1630
3000
136
15116
2193110
25349
553501
Exp
7695
200000000
133200000000
530100050041
5190000
228080200
130001000000
266
50010
Sweet potato
Imp
1320000000000000000000000000000
110000
10000000000000000010
00000
Exp
48
6000000600000000000000000000
1100000000
1000001000000100
00000
YamImp
3
0000000000000000000000000000
300000000000000000000030
00000
Exp
17
0000000000000000000000000000
700000000000006000000100
90640
TotalImp
34542
422254
23218
40023190033
241
14110821
360
8598721
1783
3001
136
15116
22103510
43502
563501
Exp
39575
2280
180001
140200002100
530100050041
6180000
2281781
5900
1308010000
100
273
360
2640
continued

TABLE 30 (CONTINUED)Root crop trade, 1984 (0001)
CassavaCountry
PtruSurinam*UruguayVenezuelaASIABangladeshBrunei Darus.ChinaCyprusHong KongIndiaIndonesiaIranIraqIsraelJapanJordanKorea Rep.KuwaitLebanonMalaysiaMongoliaPakistanPhilippinesSaudi ArabiaSingaporeSri LankaSyriaThailandTurkeyUAEmiratesViet MamYemen Dem.
EUROPEAlbaniaAustriaBelgium-Lux.BulgariaCzechoslovakiaDenmarkFinlandFranceGerman D.R.Germany F.R.GreeceHungaryIcelandIrelandItalyMaltaNetherlandsNorwayPolandPortugalRomaniaSpainSwedenSwitzerland
Imp
0000
12230000
6000000
5480
5480010000
614000000
2504800
303500
180
9710
6587000
68399
013406
001000
85
Exp
0000
2656900
1643010
139500000000
470010
1500
234680000
495000
175000040
420000
100
47070000000
Edible aroids
Imp
0000
00000000000000000000000000000
0000000000000000000000000
Exp
0000
10000000000000000000000000000
0000000000000000000000000
PotatoImp
14
1229
754120
11111
030
700
14838
0308050620
10847
01200
3003
52780
5037065
46414
57835
127931166
98549
6512220
1102074
23138
Exp
0005
60400
132174
195
1210
431600
9000307
220
100
73420
61612
14432
93
30109
7380
632106
190
24331
53066
172
16
1291030
Sweet potato
Imp
0000
40000100000000000000300000000
11600
24000000
340000
420
150000000
Exp
0000
1200
100000001000000000000000000
18006000000900000010000200
YamImp
0000
00000000000000000000000000000
0000000000000000000000000
Exp
0000
00000000000000000000000000000
0000000000000000000000000
TotalImp
14
1229
21461020
11191
030
700
69638
548308153620
113143
46000
8003
304500
503429
654
8214
155235
790032166
166990
613936
220
1112074
231123
Exp
0006
2734300
178617425
51407
10
451600
90165
0317
400
1023468
733420
111352
14613
93
3109
7420
684106200
24342
57777
172
16
1301030
continued

TABLE 30 (CONTINUED)HOOT crop mat), ivo« \guu ij
CassavaCountry
United KingdomYugoslaviaOCEANIAAustraliaRjlFr.PolynesiaNew CaledoniaNew ZealandPapua N.GuineaSamoaTongaU.S.S.R.DEVELOPINGNATIONS
DEVELOPEDNATIONS
Imp
4790
000000000
0
678
25731
Exp
120
200000002
0
26655
4950
Edible ariods
Imp
00000000000
0\\'l4
f/
0
Exp
00
700000
i) o// 6
1
0
28
0
PotatoImp
107429
286
12321300
563
1241
6516
Exp
2081
215000
16000
184
786
6909
Sweet ootato
Imp
000000000000
6
126
Exp
000000000000
29• ;•
19
YamImp
00
• 000000000
0
3
c
Exp
00
000000000
0
17
0
TotalImp
155529
466
1232
19300
563
2118
32424
Exp
2211
305000
16063
184
27683
11892
Derived from FAO, Basic Data Unit, Supply and Utilization Account (unpublished, May 1986 update). Rgures include processed cassava and potatoes converted to fresh-weight equivalent. These data differ from those in the FAO Trade Yearbooks, which include only trade in fresh potatoes. Includes countries with total root crop imports or exports of 500 tons or more. Total imports and exports include unspecified roots and tubers. Regional totals include figures for countries not listed. All calculations were done with unrounded numbers.

TABLE 31Farm-gate root crop prices (at official and black market exchange rates), 1981
Price (USS/ton)
Countries
AFRICAAlgeria
AngolaBeninBurkina FasoBurundiCameroonCape VerdeCent.Afr.Rep.ChadComorosCongoCote d'tvolreEgypt
Ethiopia
GabonGambiaGhana
Guinea
Kenya
LesothoLiberiaLibya
MadagascarMalawi
MaliMauritaniaMauritiusMorocco
MozambiqueNigerNigeria
ReunionRwandaSao Tome Prn.SenegalSierra LeoneSomaliaSouth Africa
Sudan
SwazilandTanzania
TogoTunisiaUganda
Local currency
Dinar(bl mkt)
Escudo*FrancFrancFrancFranc
Escudo*FrancFrancFrancFrancFranc
Pound(bl mkt)
Dollar(bl mkt)
FrancDalasi
New Cedi(bl mkt)
Syli(bl mkt)Shilling(bl mkt)
RandDollarDinar
(bl mkt)Franc
Kwacha(bl mkt)Franc*Franc
RupeeDirham(bl mkt)
Escudo*FrancNaira
(bl mkt)FrancFranc
EscudoFrancLeone
ShillingRand
(bl mkt)Pound
(bl mkt)Lilangeni
Shilling(bl mkt)
FrancDinar
Shilling(bl mkt)
Exchange rate
4.3213.9561.26
271.73271.73
90.00271.73
48.54271.73271.73270.20271.73271.73
0.700.842.073.11
271.731.972.75
16.6720.9275.00
9.0510.500.871.000.300.50
271.730.901.82
540.20241.48
9.015.175.45
50.22271.73
0.610.925.40
92.8438.35
271.731.166.300.870.990.541.110.878.28
27.00271.73
0.4950.05
205.00
Potato
3013386in
• ••
176460109221371
IK
46055
125104174116
XI
II*
III
1..Ill
8270
320in
446266272107
53lit
343289379360178
,,,
310207807
98in
297
162143379183334487149
in
192450110
Sweet potato
in
in
311109272
1844074
185220414
357562.1,
in
640• it
<i.
*t*
96274438in
104in
...
228in
...
126213395
*n
*n
93258196131500
52in
14033449120918414670
259402123287
• it
32479
Cassava
...
...39
12911097885055
235175368
44• i*
...
...
i.i
526107
1357224109306657i**
89...
41341696i*.
280• *•
...
9477
2281533637063
148168469
ii.
...
14670in
8526
152.!•
32479
Yam
...
.1.
...
125110111258
1*1
184315
.•*
18444
• i.
.1.
14596
460.11
1483245
5716*ii
...
148in
• i.
41..i
...
126213
...
...
...
...
244164
.,,
99
in
...
• it
in
!••
4321...
453139287
...
• •i
...
Taro
•>*...
129>i.
97• ••
• *•
166225
• ••
i»
31258215
• ii
• •i
802...
14832455716...
...
...
94• ••
...
228• ••
...
ii.
in
280...
• ••
...
228153
77
168
• >•
...
...
...
• ••
152...
...
continued

TABLE 31 (CONTINUED)Farmgate root crop prices, 1981
Price OJSS/ton)
Countries
Zaire
Zambia
Zimbabwe
N.& C.AMERICAAntiguaBahamasBarbadosCanada
Costa RicaCuba
DominicaDominican Rp.
El Salvador
GranadaGuadeloupeGuatemalaHaitiHondurasJamaicaMartiniqueMexico
Neth.AntillesNicaragua
PanamaPuerto RicoSaint LuciaSt.VincentTrinidad Tob.United StatesSOUTH AMERICAArgentina
Bolivia
Brazil
Chile
ColombiaEcuador
Paraguay
PeruSuriname
UruguayVenezuela
Local currency
Zaire(bl mkt)Kwacha(bl mkt)Dollar*
(bl mkt)
DollarDollarDollarDollar
(bl mkt)Colon
Peso(bl mkt)
DollarPeso
(bl mkt)Colon
(blmkt)DollarFranc
QuetzalGourde
LemplraDollarFrancPeso
(bl mkt)Guilder
Cordoba(bl mkt)Balboa
DollarDollarDollarDollarDollar
Pesos(blmkt)
Peso(bl mkt)
Cruzeiro(bl mkt)
Pesos(bl mkt)
PesoSucre
(bl mkt)Guaran!(bl mkt)
SolGuilder(bl mkt)
PesoBolivar
(bl mkt)
Exchange rate
4.3810.000.871.350.691.35
2.701.232.011.171.20
21.760.79
20.002.701.001.342.504.502.705.401.005.002.001.785.40
24.5125.50
1.8010.0525.25
1.001.002.702.702.401.00
4,400.008,500.00
25.0035.0093.00
108.0039.0042.5054.4925.0029.60
126.00142.00422.00
1.792.70
10.824.294.30
Potato
342150588379327168
,,.
»•*
i»
102100282221
923724017917296**«
722245658246617600347333
.*.
256102417
in
itt
n*
in
119
332172190136291251161148177254214270239158
it*
in
285533533
wW90tpotato
35415550632510353
3275590»i
MI
ii*
1265
18513810317296
556722
...134148420804184177
• ••
...
tn
.it
334285133546300
300155147105
9380
16114816014712412711382
549363161391391
Cassava
33814814291
10353
20655
119*••
• *•
21126
51331501128648
55695430
13472
309465138133
...
14357
11531813085
471...
3321721541106253in
*••
1601201011039292
331219
**i
294293
Yam
338148
**i
it*
• ii
...
793i**
90*.t
• i*
• »
*••
.1.
185252188
1*1
• i*
6521356
*•*
200*..
4021893
...
1*1
*••
iti
298548285174981
...
...
...
...6253*i*
...
149• *i
I : ,,,
\i '••//
*.*
*•*
...
...
589588
Tare
338148
• *.
*••
• ••
...
793...
90***
• ••
..*
• *•
...
185...
IK
*.*
>ii
ii.
.*•
i.*
...
...
...
...
.i.
i*.
.•i
i**
...
*•*
»*«
285...
981...
...
...
..»*.*.*.,,,
I**•i*i*.......in...
...*..•I*...
continued

TABLE 31 (CONTINUED)Firmgate root crop prices, 1981
Price (USS/ton)
Countries
ASIAAfghanistan
Bangladesh
BhutanBurma
Cyprus "
Hong Kong
India
Indonesia
Iran
Iraq
Israel
Japan
JordanKorea Rep.
LaosLebanonMalaysiaMaldivesNepal
Pakistan
Philippines
Saudi ArabiaSingaporeSri Lanka
Syria
Thailand
Turkey
VietNam
Yemen A.R.Yemen Dem.
EUROPEAustria
Belgium-Lux.
Bulgaria
Czechoslovakia
Local currency
Afghani(blmkt)
Taka(blmkt)Rupee*
Kyat(ver)(bl mkt)Pound
(bl mkt)Dollar
(bl mkt)Rupee
(blmkt)Rupiah(bl mkt)
Rial(blmkt)Dinar*
(bl mkt)Pound"(bl mkt)
Yen(bl mkt)
DinarWon
(bl mkt)Kip (bl mkt)
PoundRinggitRupeeRupee
(bl mkt)Rupee
(bl mkt)Peso
(bl mkt)Riyal
DollarRupee
(bl mkt)Pound
(bl mkt)Bant
(bl mkt)Lira
(bl mkt)Dong
(bl mkt)Rial
Dinar
Schilling(bl mkt)B.Franc(bl mkt)
Lev*(bl mkt)Koruna(blmkt)
Exchange rate
49.4855.9017.9934.008.627.30
35.000.420.415.625.558.66
10.30631.80669.0078.33
300.000.300.43
10.8712.65
220.54225.00
0.33681.03720.0040.004.312.307.55
12.3413.509.90
13.707.908.353.382.11
19.2521.353.936.11
21.8221.40
111.22115.50
3.9432.004.560.34
15.9316.8537.1340.550.922.315.89
28.65
Potato
1581407439
23416835
20520921722023319636434423160
11578
180155450441364270255249175
«.>...
2382186849
362343624
...
381343355228150153191184
2711334921441
9792
10092
28711417155
Sweet potato
*<•
...
5831.,,
10422
1921951221039287,
...
...
...177152865848
244231187
...
357281
...
...
1631189691...
18511099......
165168
...
...
57671
>*>
...
...
...
...
...
...
,,,
...
Cassava Yam
,,, ,,,
...
... ...
...
... ...
14931... ..
... t.
... ..
».. ..
91778176... ..
... ..
... ..
it* ..
... ..
... ..
17861751
... ...
... HI
... ...
118<>* ...
283... ...
>.. ...
... ...
... ...
...
60 9057 85... ...
1428274... ...
... ...
2121... ...
... ...
39348... ......
166157
... .........
... ...
Taro
...
...
...
...
...
...
...
741756
...
..t
...
...
...
...
...
...
...
...
...
...
10661045
...
331313
...
175t..
281
... '
...
8783...
...
...
...
...
...
...
...
...
...
...
...
...
...
...
...
...
...
...
ii*
...
continued
\
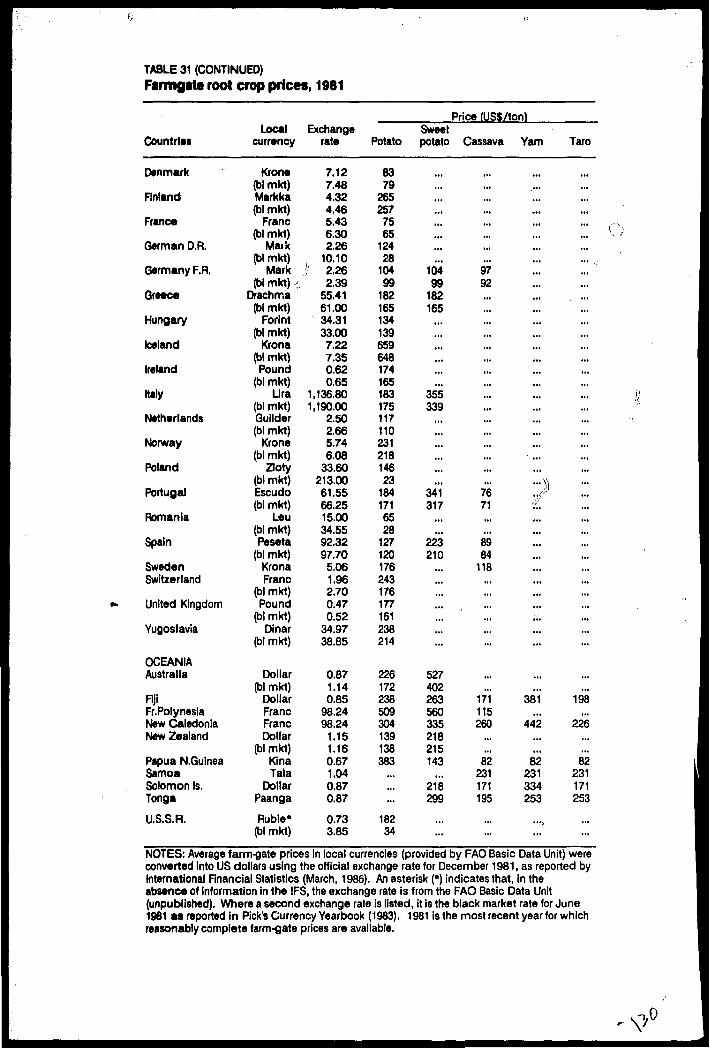
TABLE 31 (CONTINUED)Farmgate root crop prices, 1981
Countries
Denmark
Finland
France
German D.R.
Germany F.R.
Greece
Hungary
Iceland
Ireland
Italy
Netherlands
Norway
Poland
Portugal
Romania
Spain
SwedenSwitzerland
United Kingdom
Yugoslavia
OCEANIAAustralia
FijiFr.PolynesiaNew CaledoniaNew Zealand
Papua N.GuineaSamoaSolomon Is.TongaU.S.S.R.
Local currency
Krone(bl mkt)Markka(blmkt)
Franc(bl mkt)
Maik(bl mkt)
Mark(bl mkt) *..
Drachma(bl mkt)
Forint(blmkt)
Krona(bl mkt)Pound
(bl mkt)Lira
(bl mkt)Guilder(bl mkt)
Krone(bl mkt)
Zloty(bl mkt)Escudo(bl mkt)
Leu(bl mkt)Peseta
(bl mkt)KronaFranc
(bl mkt)Pound
(bl mkt)Dinar
(bl mkt)
Dollar(bl mkt)
DollarFrancFrancDollar
(bl mkt)KinaTala
DollarPaangaRuble*
(bl mkt)
Exchange rate
7.127.484.324.465.436.302.26
10.10!i 2.26
2.3955.4161.0034.3133.007.227.350.620.65
1,136.801,190.00
2.502.665.746.08
33.60213.0061.5566.2515.0034.5592.3297.705.061.962.700.470.52
34.9738.85
0.871.140.85
98.2498.24
1.151.160.671.040.870.87
0.733.85
Potato
8379
265257
7565
12428
10499
18216513413965964817416518317511711023121814623
1841716528
127120176243176177161238214
226172238509304139138383
,,,
<ii
...
18234
Sweet potato
• •i
(t
tt
,.
,,
,.
10499
182165
• ••
...
t*.
• *>
>n
355339
..*
• *t
,,,
...
.i«
in
341317
in
,,,
223210
in
in
,,
,,
,.
,,
••
527402263560335218215143
in
218299
Price (US$/ton)
Cassava Yam Taro
.,,in,,,4.*
...
II.
...
9792in
IK
in
.1.
in
in
in
HI
1.1.11
,,,
IK
lit
1..
...
...
7671
IM
II.
8984
118HI
.11
...
HI
...
it.
in
171 38115260 44
HI
,,.
..., ,,,
,,,
1 III
•I.I ...
. M.
( III
..
t(
1 1*
I 1.
• 1.
• It
,,
•}}
t // tl
/
„
1 ..
* 1.
1 1.
1 II
1. I.
.1 l.l
..
.( 1.1
1 198it i.i
2 226
ii ..i
82 82 82231 231 231171 334 171195 253 253
...
...
NOTES: Average farm-gate prices In local currencies (provided by FAO Basic Data Unit) were converted into US dollars using the official exchange rate for December 1981, as reported by International Financial Statistics (March, 1986). An asterisk (*) indicates that, in the absence of information in the IFS, the exchange rate is from the FAO Basic Data Unit (unpublished). Where a second exchange rate is listed, it is the black market rate for June 1981 as reported in Pick's Currency Yearbook (1983). 1981 is the most recent year for which reasonably complete farm-gate prices are available.
!,0