underemployment in alabama workforce … underemployment report.pdfalabama workforce investment...
TRANSCRIPT

Underemployment in Alabama Workforce
Investment Advisory Areas
2012
April 2013
Center for Business and Economic Research
Institute for Social Science Research
University Center for Economic Development
for
ALABAMA DEPARTMENT OF LABOR
LABOR MARKET INFORMATION DIVISION

2013 Underemployment in Alabama WIAAs CBER, UA i
Underemployment in Alabama Workforce
Investment Advisory Areas
2012
April 2013
by Samuel Addy, Ph.D., Director and Research Economist Ahmad Ijaz, Director of Economic Forecasting Kilungu Nzaku, Ph.D., Assistant Research Economist
Center for Business and Economic Research Culverhouse College of Commerce and Business Administration The University of Alabama Box 870221, Tuscaloosa, AL 35487-0221 Tel: (205) 348-6191 Fax: (205) 348-2951
Acknowledgments
Completion of this project was due to the timely contributions of many people, notably: Tonya Lee, Alabama Department of Labor Michael Conaway and Debra McCallum, Institute for Social Science Research, The University of Alabama Nisa Miranda, University of Alabama Center for Economic Development, The University of Alabama Officials and staff of the Alabama Department of Labor’s Labor Market Information Division and our colleagues at the Center for Business and Economic Research.

CBER, UA 2013 Underemployment in Alabama WIAAs ii
2013 Underemployment in Alabama WIAAs CBER, UA iii
Contents
Executive Summary iii
Introduction 1
Underemployment in Alabama 10
Underemployment in Workforce Investment Advisory Area, Region 1 28
Underemployment in Workforce Investment Advisory Area, Region 2 39
Underemployment in Workforce Investment Advisory Area, Region 3 50
Underemployment in Workforce Investment Advisory Area, Region 4 61
Underemployment in Workforce Investment Advisory Area, Region 5 72
Underemployment in Workforce Investment Advisory Area, Region 6 86
Underemployment in Workforce Investment Advisory Area, Region 7 96
Underemployment in Workforce Investment Advisory Area, Region 8 107
Underemployment in Workforce Investment Advisory Area, Region 9 117
Underemployment in Workforce Investment Advisory Area, Region 10 130
Underemployment in Workforce Investment Advisory Area, Jefferson 143
Underemployment in Workforce Investment Advisory Area, Mobile 149

CBER, UA 2013 Underemployment in Alabama WIAAs iv

2013 Underemployment in Alabama WIAAs CBER, UA v
Executive Summary
This report presents estimates of underemployment and some characteristics of the employed, underemployed, and nonworkers for the state as a whole, each workforce investment advisory area (WIAA), and the counties that the WIAAs cover. The study involved a telephone survey of about 11,300 respondents; less than half were employed.
Alabama had a 2012 underemployment rate of 23.8 percent, which identifies 479,296
potential workers in addition to the 140,897 unemployed, for a total available labor pool of 620,193 For every unemployed person there are roughly three underemployed in the state.
Underemployment ranges from 22.0 percent for WIAA Region 10 to 26.2 percent for
WIAA Region 6. Among counties, Franklin and Walker have the highest rate of underemployment, with 35.1 percent, and Winston has the lowest rate with 12.0 percent. Thirty-three counties had underemployment rates above the state’s 23.8 percent.
The available labor pool is willing to commute farther and longer for better jobs. Many are
willing to commute for 20 or more minutes longer and cover 20 or more extra miles.
The underemployed have less job tenure and earn less than the employed. Eighty-five percent of the underemployed—compared to 63 percent of all employed—believe they are qualified for a better job based on their education and training, skills, and experience.
A lack of job opportunities in their area, low wages at available jobs, living too far from jobs,
other family or personal obligations, and owning a house in their area are the primary reasons given for being underemployed. By comparison, nonworkers’ main reasons for not working are (i) retirement, (ii) disability or other health concerns, (iii) lack of job opportunities in their area, and (iv) social security limitations.
The underemployed are more active in the labor market than other workers. Over one third
have sought better jobs in the preceding three months, compared to a fifth of all workers.
For up to 15 percent higher wages, 32 percent of the underemployed will consider leaving their current jobs, compared to 27 percent of all employed. More of the underemployed will leave their current jobs for any level of additional income except for 15 to 30 percent more income. Eight percent of the underemployed will accept a 5 percent higher income to leave current jobs while 56 percent of them want more than 15 percent higher earnings.
The underemployed have lower job satisfaction than the employed; 54 percent are satisfied or completely satisfied with their jobs compared to 76 percent of all employed.
Workers are willing to train for better jobs but the underemployed are much more willing. Sixty-nine percent of the underemployed are willing to train compared to 58 percent of all workers. The willingness to train is higher if the government pays all or part of the training cost.

CBER, UA 2013 Underemployment in Alabama WIAAs vi

2013 Underemployment in Alabama WIAAs CBER, UA 1
Introduction
Overview
This report presents estimates of underemployment and characteristics of the employed, underemployed, and nonworkers for the state as a whole, each workforce investment advisory area (WIAA), and the counties that the WIAAs cover. For this report, underemployed persons are workers who believe that their education and training, skills, or experience (i) are not fully utilized in their current jobs and (ii) qualify them for higher paying or more satisfying jobs for which they could leave their current positions. The report relies on the results of a telephone survey of workers and nonworkers in the state using a questionnaire designed specifically for estimating underemployment and the aforementioned characteristics. Two University of Alabama (UA) units worked together on the project: Institute of Social Science Research (ISSR) conducted the survey and the Center for Business and Economic Research (CBER) designed the questionnaire, analyzed the results, and prepared the report. The narrative focuses mainly on workers and the underemployed but the results tables include characteristics of nonworkers as well. Covered are:
1. Characteristics of the underemployed and employed a. demographics (age, gender, race, marital status, educational attainment) b. employment status (full-time, part-time, nonworker) and industry c. occupation and income d. job fitness and experience e. commute time and distance f. reasons for being underemployed and job search activity g. willingness for additional commute and for how much more income h. job satisfaction (overall and selected aspects) and willingness to train for a better job
2. Characteristics of nonworkers a. demographics (age, gender, race, marital status, educational attainment) b. reasons for not working
It is important to note that while the results are very reliable for the large geographic regions (the state and WIAAs), they are not as reliable at the county level especially with respect to occupation and industry of workers because of county sample size. Larger county samples will be needed to guarantee the same kind of reliability for counties as for the state and WIAAs.
Another important point is that no official U.S. government statistics are currently available on the underemployed, although underemployment presents economic development potential.1 Attempts at measuring this economic potential can be made. However, this is extremely difficult because of uncertainty regarding the additional income that the underemployed can bring to an area.
1 The reason given for this, according to the U.S. Bureau of Labor Statistics (BLS) website, is a difficulty of developing
an objective set of criteria which could be readily used in a monthly household survey. This difficulty probably comes from a preference to indirectly estimate the underemployment rate from a survey that does not ask respondents directly whether or not they are underemployed.

CBER, UA 2013 Underemployment in Alabama WIAAs 2
Background and Rationale
Labor force data on counties or county groups are often limited to what is available from government sources. Existing data provide information on the employed and the unemployed. While valuable, such information may not be complete from the perspective of employers. New or expanding employers are interested in “underemployment” as well because incumbent workers are also potential employees. In fact, the kind of “quality” worker that many prospective employers want is not unemployed.
Workers in occupations that underutilize their experience, training, and skills are underemployed. These workers might be receiving salaries below what they believe they can earn; they might also not be satisfied with their jobs. Underemployment occurs for various reasons including (i) productivity growth, (ii) spousal employment and income, and (iii) family constraints or personal preferences. Productivity growth creates underemployment as workers learn to do their jobs better and in shorter time. Spousal employment and income and extended family relationships or responsibilities may limit workers’ ability to be in jobs that make full use of the value of their education, training, skills, and experience. Geographic immobility due to family constraints or personal preferences is another contributing factor. The various contributing factors combined with economic, social, and geographic characteristics make underemployment unique to areas. Indeed, demographic and socioeconomic characteristics of the underemployed may be very different among communities.
Underemployment provides opportunities for selective job creation and economic growth. For example, a firm with needs for skills prevalent among the underemployed could locate in an area with underemployed workers, regardless of its unemployment rate. Low unemployment, suggesting limited labor availability, is not a hindrance to such a firm.
The underemployed present a significant pool of labor because they tend to respond to job opportunities that better match their skills, training, and experience. They also create opportunities for entry level workers as they leave lower-paying jobs and move into better-paying ones. Even if their previously held positions are lost or not filled (perhaps due to low unemployment), there is economic growth for the area in gaining higher-paying jobs. Clearly, no labor profile is complete without an underemployment estimate. Other labor data can be combined with underemployment to construct a more comprehensive labor profile for each WIAA that will be valuable to community and regional leaders, educators, planners, policy makers, economic developers, and prospective employers.
Existing literature indicates that underemployment rates have been estimated for some states and communities.2 For example, underemployment has been estimated for Kentucky, Nebraska, and certain areas in Alabama as part of workforce analysis studies (Bollinger et al. 2003; Bonnal et al. 2009; and Nebraska Underemployment Study 2002).3
2 An internet search using keywords such as underemployment, workforce analysis, available labor, and labor supply leads to
numerous commissioned studies and reports on underemployment. 3 Bollinger, C.R., P. Coomes, and M. Berger. 2003. Measuring Underemployment at the County Level. University of Kentucky
Center for Poverty Research Discussion Paper Series #2003-08 (http://www.ukcpr.org/Publications/DP2003-08.pdf).
2013 Underemployment in Alabama WIAAs CBER, UA 3
The definition of underemployment must be explicitly stated in any study to enable proper understanding and use of the results. Underemployment has been defined very narrowly in some cases to just account for surplus high skill labor (e.g., Moore 2005).4 The International Labor Organization (ILO) views underemployment as reflecting underutilization of the productive capacity of the employed population, not just the highly-skilled. In defining underemployment, the ILO focuses on a time-related concept that is used by several countries.5 By the ILO definition, the underemployed include all employed persons who:
a. are willing to work additional hours—it is recommended that those who have actively sought to work additional hours be distinguished from those who have not
b. are available to work additional hours, within a specified subsequent period c. worked less than a threshold (determined by country) relating to working time—this
threshold for the United States is the 35-hour reference week used by the BLS as the boundary between full-time and part-time work.
The ILO definition, while a vast improvement on the narrow definition, omits one important cause of underemployment—labor productivity growth. Workers become underemployed as their productivity rises because they learn to do their jobs better and faster. Such workers can do more work in the same time but they are not counted under the ILO time-related underemployment concept. To incorporate labor productivity growth effect in any measure of underemployment, it is necessary to let respondents declare whether or not they are underemployed. This approach has been taken in many studies. We use this last approach as well because our purpose is to estimate the full underemployment in the state, WIAAs, and counties.
Methodology
The questionnaire that CBER designed specifically for estimating underemployment was used to survey the labor force. Figure I1 lists the questions on the instrument. To probe for underemployment, respondents are asked questions about employment status, nature of employment, willingness to work full-time if part-time, number of jobs, commute time and distance, occupation and industry, job tenure, income, job fitness, job satisfaction, income incentive to leave current job for a better one, willingness to train for a better job, incremental commute time and distance, and job search activity. The BLS 35-hour week threshold is used to distinguish between full-time and part-time for respondents who are not sure of their time status. Respondents are then asked whether or not they are underemployed, following a brief explanation of the concept. The
Bonnal, M., Lira, C., and Addy, S.N. 2009. Underemployment and Local Employment Dynamics: New Evidence. The Review of
Regional Studies Vol. 39, No. 3, pp. 317-335 Nebraska Underemployment Study: A Comparative Analysis 1992-2000. 2002. Nebraska Workforce Development,
Department of Labor, Labor Market Information Center (http://www.NebraskaWorkforce.com). 4 Moore, S. 2005. Regional Asset Indicators: Tapping the Skills Surplus in Rural America. Center for the Study of Rural
America, Federal Reserve Bank of Kansas City (http://www.kc.frb.org/RuralCenter/mainstreet/MSE_0205_text.pdf). 5 The ILO definition was adopted most recently in a resolution concerning the measurement of underemployment and
inadequate employment situations by the Sixteenth International Conference of Labor Statisticians in October 1998 (for details, go to http://www.ilo.org/public/english/bureau/stat/download/res/underemp.pdf). BLS sends U.S. time-related underemployment estimates to the Organization for Economic Cooperation and Development (OECD).

CBER, UA 2013 Underemployment in Alabama WIAAs 4
Figure I1. Questions on the Underemployment Survey Instrument
General 1. Do you currently work anywhere for pay? [Go to #21 if answer is “no”] 2. Do you work for pay at more than one job? 3. On average, how many hours a week do you work at your job(s) [primary job]? The primary job is the one you spend most of
your working time at. 4. Would you say that you work 35 or more hours a week? 5. Would you like a full time job? 6. How long have you been working in your current job [primary job]? 7. On average, how long does it take you to get to [your workplace] the workplace for your primary job? 8. How many miles from your home is your workplace [the workplace for your primary job]? 9. What is your occupation [at your primary job]? 10. Including the time before you got your [current job | primary job], how many years have you worked in this occupation? 11. What industry do you work in at your [current job | primary job]? 12. For statistical purposes only, was your income last month? (a) Less than $500 (b) $500-$1,000 (c) $1,000-$2,000
(d) $2,000-$3,000 (e) $3,000-$4,000 (f)$4,000-$6,000 (g) More than $6,000? Fitness Please consider your education and training, skills, and experience for the next couple of questions. 13. Does your [current job | primary job] fit well with your education and training, skills, and experience? 14. Are you qualified for a better job than the [one | primary job] you have now? 15. Which of the following reasons make you qualified for a better job? (Please respond to all that apply)
(a) Education and training (b) Skills (c) Experience 16. How much more would a new job need to pay for you to be willing to leave your [current job | primary job]?
(a) 0-5%, (b) 5-15% (c) 15-30% (d) 30-50% (e) More than 50% 17. How much farther are you willing to commute for a new job that paid that much more? (a) 0-10 miles (b) 10-20 miles
(c) More than 20 miles 18. How much more time are you willing to spend commuting one-way for such a job? (a) 0-10 minutes (b) 10-20 minutes
(c) More than 20 minutes 19. How satisfied are you with [current job | primary job]? How satisfied are you with your job earnings, retention, the work you
do, number of hours you work, your shift, working condition, and commuting distance? (a) Completely Dissatisfied (b) Dissatisfied (c) Neither dissatisfied
20. Have you looked for a better job in the past 3 months? 21. How willing are you to train for a better job? How willing are you to train if you are paying all the cost of training, government
pays part of the cost, or government pays all the cost? (a) Completely unwilling (b) Unwilling (c) Neither willing nor unwilling (d) Willing (e) Completely willing.
Underemployment The next few questions relate to underemployment. A person can think of himself or herself as underemployed for various reasons (e.g., if you can take on additional challenges or responsibilities for the same or better pay. You may also be underemployed by choice because your spouse has a really good job and you want to focus on the children, home-schooling, the family, or other personal/family matters). 22. Do you think you are underemployed in your current job? Reasons for being underemployed or unemployed 23. Which of the following reasons would you say make you underemployed? (Please respond to all that apply) (a) A lack of job opportunities in your area (b) The low wages at the available jobs (c) You live too far from [jobs | BETTER
jobs] (d) You are in school or undergoing training (e) Your spouse or partner has a really good job (f) You are retired or because of social security limitations (g) Disability or other health concerns (h) Child care responsibilities (i) You take care of someone other than a child (j)Other family or personal obligations (k) You own a house in your area (l) Because of something else
Demographics - Ask all respondents 24. Are you currently married? 25. Would you please confirm whether you are male or female? 26. What is your age? 27. What is the last grade of school you completed? (a) Some high school or less, no diploma (b) High School /GED (c) Some college, no degree (d) Jr. College/trade school,
associate degree (e) Four-year college graduate, Bachelor’s degree (f) Postgraduate/Masters etc. 28. Would you say you are Hispanic or non-Hispanic? 29. Would you say you are [RACE CATEGORIES]? 30. What [Alabama] county do you live in?

2013 Underemployment in Alabama WIAAs CBER, UA 5
underemployed and unemployed are asked to give reasons for that status. Demographic information is then collected to end the interview.
Respondents were contacted by calling a sample of random residential phone numbers. The sample was generated through list-assisted random digit dialing sampling.6 For each combination of area code and telephone exchange, residential blocks of telephone numbers were identified from a database of current working residential exchanges and working banks. The universe of possible phone numbers was generated by appending each possible two-digit ending to these blocks. Several passes through the possible phone numbers were made, in each pass every ith number was taken for the sample after starting each pass at a different random starting point. Several procedures were applied to the resulting sample to increase dialing efficiency. For example, business numbers were eliminated by reference to a database of known business numbers and disconnected numbers were also removed from the sample.
For each successful household contact, a respondent was randomly selected by asking for the adult who would be the next to have a birthday. Since the sequence of birthdays within a household tends to be random, the respondent within the household would be randomly selected. An interview was then attempted if the selected respondent was available. If not, the interviewer recorded identifying information about the selected respondent on the call record and attempted to determine an appropriate time to call again. If no call could be scheduled, the phone number was recalled randomly until another contact was made. To minimize any selection bias due to easy availability of the household or respondent, repeated attempts were made at intervals during the interviewing period to contact a household at each phone number in the sample and to complete an interview in that household with the selected respondent.
Respondents had to be at least 19 years of age. While this eliminates 16-, 17-, and 18-year olds from the sample, it is standard practice in studies of this kind for several reasons.7 Most 16-18 year olds are in school and so their participation in the labor force is limited. BLS data show that the eliminating 16-18 year olds results in samples that, at worst, are representative of about 98 percent the labor force and all employed persons. To interview 16-, 17-, and 18-year olds would require parental consent; this could increase survey time and costs remarkably. For these reasons and others, researchers follow the standard practice of limiting samples to the legal cut-off age. Underemployment rates estimated from studies are applied to total employed to yield the number of underemployed because of the recognition that underemployment can exist among 16-18 year olds as well. This indicates an implicit assumption that the estimated rate is the same for that age group.
ISSR conducted the telephone survey in 2012. A pretest of the questionnaire suggested that 100 completed responses per county and 500 each for Jefferson, Madison, Mobile, and Montgomery counties would be sufficient, for a total expected sample size of 8,300. Specific county targets on number of employed respondents were set, based on county population in year 2010 and economic activity. This created a total minimum number of 4,490 employed respondents statewide (Table I1). To achieve this target while ensuring a randomly selected and representative sample resulted in the collection of 11,272 completed survey responses. This is 36 percent more than the 8,300 expected
6 See http://www.m-s-g.com/web/genesys/resources.aspx for a more detailed account of this methodology. 7 For example, the Nebraska study uses age 19 as the cut-off and Bollinger et al. use age 18.

CBER, UA 2013 Underemployment in Alabama WIAAs 6
initially and was due to a large number of responses from nonworkers. More than half of the completed responses were from nonworkers.
Survey responses were statistically analyzed to estimate underemployment for the state, each WIAA, and each county. The survey results were also analyzed for the aforementioned characteristics of Alabama workers and nonworkers. We make the same assumption as with the underemployment rate; specifically, that 16-18 year olds constitute such a small component of the labor force that the characteristics can be said to apply to them as well.8
The results are presented in this report for each WIAA and the state. County estimates are presented in the WIAA sections. The results will enable community and regional leaders, planners, policy makers, educators, economic developers, prospective employers, and others to not only know the level of underemployment in each WIAA and county but also its nature. However, interpreting the results on characteristics of the underemployed is subject to the caveats following.
Caveats
While the underemployment estimates are reliable with 95 percent confidence for all areas and counties shown in Table I1, characteristics of the underemployed are not as reliable for the 61 counties in bold font in the table. This means that the margin of error on inferred characteristics of the underemployed for these counties is larger than for other counties; there is no such concern at the WIAA level. These counties had fewer than 24 underemployed respondents, which are too few to infer characteristics.
With 23 occupational categories on the questionnaire, having fewer than 24 underemployed respondents means at best a uniform distribution across these categories. It is more likely that there will be no representation for underemployment in some occupations. There is a similar issue regarding the industry in which an underemployed respondent works, because we specify 20 industries. Larger county samples are needed to be able to make such inferences on the underemployed for these counties. As a result, except for Jefferson and Mobile, characteristics of the underemployed are not discussed for counties. Madison and Montgomery are two additional counties that could have been discussed, but are not because of the scope of the study.
Economic surveys target establishments and thus provide better information on occupations and industries. The underemployment survey targeted households. Hence, responses to the questions on occupation and industry should only be used for making comparisons between the employed and the underemployed and not for indicating worker distribution by occupation or industry.
8 One must be careful of specific characteristics such as educational attainment for 16-18 year olds, since they are most
likely to have some high school or less but no diploma.

2013 Underemployment in Alabama WIAAs CBER, UA 7
Table I1. Survey Response Count
County Resp Emp Target Und County Resp Emp Target Und
Autauga 114 59 55 12 Houston 154 67 65 18Baldwin 185 89 75 16 Jackson 119 60 55 13Barbour 173 56 55 12 Jefferson 542 252 250 65Bibb 114 52 50 10 Lamar 155 50 50 14Blount 139 67 55 11 Lauderdale 174 66 65 17Bullock 123 52 50 14 Lawrence 158 58 55 12Butler 127 54 50 18 Lee 237 115 75 26Calhoun 172 67 65 16 Limestone 112 58 55 20Chambers 187 56 55 14 Lowndes 115 55 50 14Cherokee 140 57 55 16 Macon 147 52 50 18Chilton 130 56 55 9 Madison 500 264 250 64Choctaw 111 51 50 13 Marengo 120 56 55 15Clarke 152 57 55 10 Marion 128 59 55 16Clay 117 51 50 14 Marshall 133 60 55 9Cleburne 121 54 50 8 Mobile 675 255 250 61Coffee 122 56 55 9 Monroe 153 55 50 14Colbert 165 57 55 8 Montgomery 500 254 250 68Conecuh 168 62 50 14 Morgan 204 83 75 16Coosa 145 55 50 13 Perry 115 54 50 13Covington 143 59 55 10 Pickens 124 57 50 12Crenshaw 116 54 50 11 Pike 153 65 55 19Cullman 152 68 65 14 Randolph 140 52 50 10Dale 145 59 55 13 Russell 155 59 55 14Dallas 151 57 55 17 St. Clair 139 63 55 12DeKalb 137 58 55 15 Shelby 155 81 75 21Elmore 122 57 55 13 Sumter 134 54 50 12Escambia 169 56 55 13 Talladega 153 57 55 11Etowah 166 73 65 23 Tallapoosa 132 57 55 14Fayette 148 61 50 10 Tuscaloosa 164 80 75 25Franklin 129 57 55 20 Walker 190 57 55 20Geneva 137 52 50 9 Washington 116 53 50 12Greene 127 51 50 14 Wilcox 118 50 50 14Hale 162 65 50 15 Winston 123 50 50 6Henry 126 55 50 13 Alabama 11,272 4,798 4,490 1,142
Area Resp Emp Target Und WIAA Region 1 877 347 335 79 WIAA Region 2 1,357 651 610 151 WIAA Region 3 994 416 375 100 WIAA Region 4 1,295 576 545 138 WIAA Region 5 1,286 523 495 125 WIAA Region 6 638 271 260 71 WIAA Region 7 1,094 533 510 136 WIAA Region 8 849 334 285 86 WIAA Region 9 1,729 678 635 153 WIAA Region 10 1,153 469 440 103 Jefferson Region 542 252 250 65 Mobile Region 675 255 250 61 Alabama 11,272 4,798 4,490 1,142
Resp – Number of respondents Emp – Number of employed respondents
Target – Target number of employed respondents Und – Number of underemployed respondents
Note: Underemployment estimates for all counties are reliable. However, any inferences on the characteristics of the underemployed for the 61 counties in bold are not as reliable. There were too few underemployed respondents to permit making such inferences.

CBER, UA 2013 Underemployment in Alabama WIAAs 8
Definitions
Except for better job, nonworker, underemployed persons, and underemployment rate, the definitions below follow the BLS glossary.
Better job A job that requires the same skills, education and training, and experience as another but provides more satisfaction and/or higher earnings. It is better from the perspective of the jobholder.
Civilian noninstitutional population Persons 16 years of age and older who are not inmates of institutions (e.g., penal and mental facilities, homes for the aged) and who are not on active duty in the Armed Forces.
Educational attainment The highest diploma or degree, or level of work towards a diploma or degree, which an individual has completed.
Employed persons Persons 16 years and over in the civilian noninstitutional population who, during a reference period, (a) worked as paid employees; worked in their own business, profession, or on their own farm, or worked 15 hours or more as unpaid workers in an enterprise operated by a member of the family; and (b) all those who were not working but who had jobs or businesses from which they were temporarily absent for various reasons whether or not they were paid for the time off or were seeking other jobs. Reasons for absence could include vacation, illness, bad weather, childcare problems, maternity or paternity leave, labor-management dispute, job training, or other family or personal reasons. Each employed person is counted only once, even if he or she is a multiple jobholder. [Note: Persons whose only activity involved work around their own house (painting, repairing, or own home housework, etc.) or volunteer work for religious, charitable, and other organizations are not considered to be employed by this definition.]
Full-time workers Persons who work 35 hours or more per week; sometimes employees are classified as full-time or part-time as defined by their employer.
Industry A group of establishments that produce similar products or provide similar services. For example, all establishments that manufacture automobiles are in the same industry.
Labor force The labor force includes all persons 16 years and older classified as employed or unemployed. Those who have a job or are actively looking for one are classified as being in the labor force. All others—those without jobs and not looking for one (e.g. some retirees and students)—are counted as "not in the labor force."
Labor force participation rate The labor force expressed as a percent of the civilian noninstitutional population.
Labor productivity Labor productivity refers to the relationship between economic output and the labor time used in generating that output. It is the ratio of output per hour.

2013 Underemployment in Alabama WIAAs CBER, UA 9
Multiple jobholders Employed persons who in a reference period (a) had two or more jobs as a wage and salary worker, (b) were self-employed and also held a wage and salary job, or (c) worked as an unpaid family worker and also held a wage and salary job. Excluded are self-employed persons with multiple businesses and persons with multiple jobs as unpaid family workers.
Nonworkers (Not employed) This refers to all persons 16 years and over who are classified as unemployed as well as those classified as not in the labor force. Not employed is the BLS term for nonworkers. To avoid any confusion between those who are “not employed” and the “unemployed,” preference is given for the term “nonworkers” in this report. In other words, the labor force is made up of workers and nonworkers; only employed persons are workers.
Not in the labor force Persons aged 16 years and older in the civilian noninstitutional population who are neither employed nor unemployed are not in the labor force.
Occupation An occupation defines a set of activities or tasks that employees are paid to perform. Employees that perform essentially the same tasks are in the same occupation, whether or not they work in the same industry. Some occupations are concentrated in a few particular industries; other occupations are found in many industries.
Part-time workers Persons who work less than 35 hours per week are part-time workers.
Productivity A measure of economic efficiency that shows how effectively economic inputs are converted into output. Productivity is measured by comparing the amount of goods and services produced with the inputs that were used in production.
Productivity growth Change in productivity, usually measured in percentage terms.
Underemployed persons Underemployed persons are those whose education and training, skills, or experience (i) are not fully utilized in their current jobs and (ii) qualify them for higher paying or more satisfying jobs for which they could leave their current positions.
Underemployment rate The number of underemployed expressed as a percentage of the employed.
Unemployed persons Persons aged 16 years and older who had no employment in a reference period but were available for work (except for temporary illness) and had made specific efforts to find employment in a longer period that ends with the reference period. BLS uses a week as the reference period and the 4-week period ending in the reference week as the longer period. Persons who were waiting to be recalled to a job from which they had been laid off need not have been looking for work to be classified as unemployed.
Unemployment rate The unemployment rate represents the number unemployed as a percent of the labor force.

CBER, UA 2013 Underemployment in Alabama WIAAs 10
Underemployment in Alabama
Workforce Investment Advisory Areas
Source: Alabama Department of Labor, WIAA Regions revised 29/1/2013

2013 Underemployment in Alabama WIAAs CBER, UA 11
Underemployment in Alabama
Underemployment rates for the state and WIAAs are shown in Table A1. The state rate was 23.8 percent, which means that about 479,296 employed Alabama residents were underemployed based on December 2012 labor force data. Adding the unemployed gives a total available labor pool of about 620,193 for the state. This pool is more than four times the number of unemployed and is a more realistic measure of the available labor in the state. However, prospective employers must be able to offer the underemployed higher wages, better benefits or terms of employment, or some other incentives to induce them to change jobs.
Table A1. Underemployed by Workforce Investment Advisory Area
Alabama Region 1 Region 2 Region 3 Region 4 Region 5 Region 6Labor force 2,154,744 119,704 401,382 126,196 520,430 189,368 33,350Employed 2,013,847 111,486 377,814 117,701 490,680 176,372 29,610Underemployment rate 23.8% 22.8% 23.2% 24.0% 24.0% 23.9% 26.2%Underemployed workers 479,296 25,385 87,653 28,295 117,567 42,153 7,758Unemployed 140,897 8,218 23,568 8,495 29,750 12,996 3,740Available labor pool 620,193 33,603 111,221 36,790 147,317 55,149 11,498 Region 7 Region 8 Region 9 Region 10 Jefferson Mobile Labor force 184,035 116,669 322,588 148,745 301,369 190,597 Employed 171,675 108,470 299,015 138,898 282,700 176,807 Underemployment rate 25.5% 25.8% 22.6% 22.0% 25.8% 23.9% Underemployed workers 43,811 27,931 67,488 30,502 72,908 42,292 Unemployed 12,360 8,199 23,573 9,847 18,669 13,790 Available labor pool 56,171 36,130 91,061 40,349 91,577 56,082
Note: Rounding errors may be present. Based on December 2012 labor force data and 2012 underemployment rates. Source: Center for Business and Economic Research, The University of Alabama and Alabama Department of Labor.
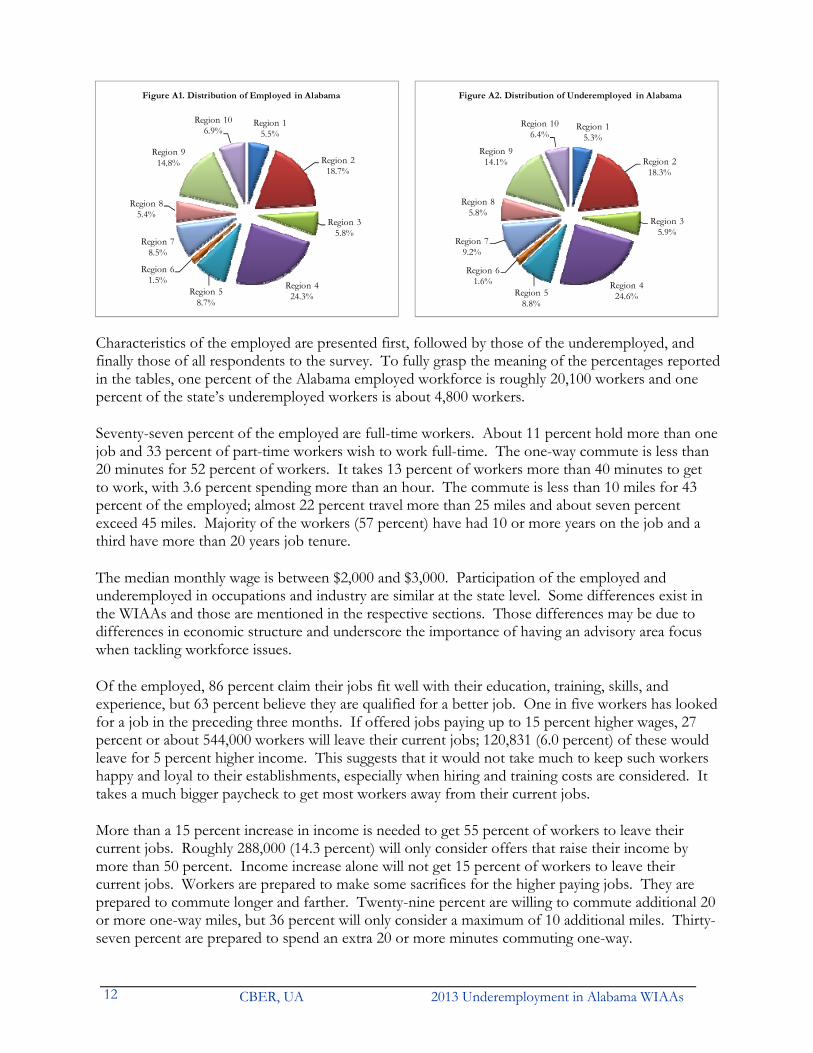
Among the WIAAs, underemployment ranged from 22.0 percent for Region 10 to 26.2 percent for Region 6. Region 4 has the most available labor, followed by Region 2; these two regions account for 42 percent of the state’s available labor pool. Population, labor force, and number of employed residents in these two regions are large. As a result, despite the difference in underemployment rates, they end up with large numbers of underemployed and available labor pool sizes. Region 6 has the least available labor pool as well as the least labor force and number of employed residents. Figures A1 and A2 show distributions of employed and underemployed by WIAA. One percent of the underemployed is about 4,800 workers. So although the regional shares of employed and underemployed do not seem to be very different, even a fraction of a percentage difference can be significant. Quantifying the size of the underemployed is a necessary first step in exploiting it for economic development, workforce training, planning, and other uses.
Underemployment Survey Results
Detailed underemployment survey results for the state and WIAAs are presented in Tables A2 and A3, respectively. The estimated underemployment rates are applied to the number of employed residents in the areas to get the number of underemployed workers in Table A1. This section focuses on the state, as results for the WIAAs are discussed in their respective sections.
CBER, UA 2013 Underemployment in Alabama WIAAs 12
Characteristics of the employed are presented first, followed by those of the underemployed, and finally those of all respondents to the survey. To fully grasp the meaning of the percentages reported in the tables, one percent of the Alabama employed workforce is roughly 20,100 workers and one percent of the state’s underemployed workers is about 4,800 workers.
Seventy-seven percent of the employed are full-time workers. About 11 percent hold more than one job and 33 percent of part-time workers wish to work full-time. The one-way commute is less than 20 minutes for 52 percent of workers. It takes 13 percent of workers more than 40 minutes to get to work, with 3.6 percent spending more than an hour. The commute is less than 10 miles for 43 percent of the employed; almost 22 percent travel more than 25 miles and about seven percent exceed 45 miles. Majority of the workers (57 percent) have had 10 or more years on the job and a third have more than 20 years job tenure.
The median monthly wage is between $2,000 and $3,000. Participation of the employed and underemployed in occupations and industry are similar at the state level. Some differences exist in the WIAAs and those are mentioned in the respective sections. Those differences may be due to differences in economic structure and underscore the importance of having an advisory area focus when tackling workforce issues.
Of the employed, 86 percent claim their jobs fit well with their education, training, skills, and experience, but 63 percent believe they are qualified for a better job. One in five workers has looked for a job in the preceding three months. If offered jobs paying up to 15 percent higher wages, 27 percent or about 544,000 workers will leave their current jobs; 120,831 (6.0 percent) of these would leave for 5 percent higher income. This suggests that it would not take much to keep such workers happy and loyal to their establishments, especially when hiring and training costs are considered. It takes a much bigger paycheck to get most workers away from their current jobs.
More than a 15 percent increase in income is needed to get 55 percent of workers to leave their current jobs. Roughly 288,000 (14.3 percent) will only consider offers that raise their income by more than 50 percent. Income increase alone will not get 15 percent of workers to leave their current jobs. Workers are prepared to make some sacrifices for the higher paying jobs. They are prepared to commute longer and farther. Twenty-nine percent are willing to commute additional 20 or more one-way miles, but 36 percent will only consider a maximum of 10 additional miles. Thirty-seven percent are prepared to spend an extra 20 or more minutes commuting one-way.
Region 15.5%
Region 218.7%
Region 35.8%
Region 424.3%Region 5
8.7%
Region 61.5%
Region 78.5%
Region 85.4%
Region 914.8%
Region 106.9%
Figure A1. Distribution of Employed in Alabama
Region 15.3%
Region 218.3%
Region 35.9%
Region 424.6%Region 5
8.8%
Region 61.6%
Region 79.2%
Region 85.8%
Region 914.1%
Region 106.4%
Figure A2. Distribution of Underemployed in Alabama

2013 Underemployment in Alabama WIAAs CBER, UA 13
The 23.8 percent underemployed cited lack of job opportunities, low wages at the available jobs, and living too far from jobs as the primary reasons for being underemployed, in order of importance. Nonworkers noted retirement and disability or other health concerns as wells as lack of job opportunities as their primary reasons for not working. Among the underemployed, 62 percent work full-time, 13 percent hold more than one job, and 52 percent of part-time workers want full-time jobs. More than half (52 percent) have less than a 20-minute one-way commute, but 14 percent drive for over 40 minutes, with three percent taking more than an hour. The commute is less than 10 miles for 44 percent of the underemployed. Twenty percent have more than 25 miles to travel, with six percent exceeding 45 miles. The underemployed have less job tenure and also earn less than the employed. Fifty-seven percent earn up to $2,000 monthly compared to 38 percent of all the employed. Fifty-one percent have had 10 or more years on the job.
About 71 percent of the underemployed say their jobs fit well with their education, training, skills, and experience. Eighty-five percent believe they are qualified for a better job and a quarter have sought better jobs in the preceding three months. More underemployed will leave current jobs at every wage level, except for when a 15 to 30 percent wage increase is offered. Thirty-two percent of the underemployed will leave their current jobs for up to 15 percent higher wages, compared to 27 percent of all employed. Eight percent of the underemployed will accept a 5 percent higher income to leave current jobs while 56 percent want more than 15 percent higher earnings. Fewer of them would not leave their jobs at all; eight percent compared to 15 percent of all employed. The underemployed are very active in the labor market and are willing to commute farther and longer.
Most Alabama workers are satisfied or completely satisfied with their jobs but fewer underemployed workers are satisfied than all employees. Fifty-four percent of the underemployed are satisfied or completely satisfied with their jobs compared to 76 percent of all workers. Workers are more satisfied with the work they do and least satisfied with their earnings. Workers are generally willing to train for a new or better job, with the underemployed being much more willing. About 69 percent of the underemployed are willing or completely willing to train for a new or better job versus 57 percent of all workers. The willingness to train is highest when the cost is fully borne by government and lowest when the trainee must pay the full costs. When the training cost burden is considered, the underemployed are more willing to train for the new or better job if the government bears at least part of the cost.
For the survey, a total of 11,272 complete responses were obtained. About 43 percent (4,798 respondents) were employed, of which 1,142 were underemployed. Sixty-seven percent of the employed, 50 percent of nonworkers, and 62 percent of the underemployed were married. Men were 44 percent of employed, 33 percent nonworkers, and 40 percent underemployed. The median age is 52 for employed, 50 for the underemployed, and 66 for nonworkers. Whites made up roughly 72 percent of employed, 68 percent of nonworkers, and 65 percent of underemployed; Hispanics were a tiny portion of about one percent. Five percent of the employed and underemployed do not hold a high school diploma or equivalent compared to 17 percent of nonworkers. Twenty-one percent of employed, 23 percent underemployed, and 11 percent of nonworkers hold a bachelor’s or higher degree. Clearly, Alabama has a large available labor pool that is willing to commute and is seeking higher wage jobs.

CBER, UA 2013 Underemployment in Alabama WIAAs 14
Table A2. Alabama Underemployment Survey Results (Percent)
General Employed Underemployed
1. Percent of adults that are working full-time 77.1 62.4 2. Percent of part-timers who would like to work full-time 32.7 51.6 3. Percent of workers with more than one job 10.6 13.1 4. Average commute time (one-way) Less than 20 minutes 51.7 51.7
20 to 40 minutes 31.4 30.840 minutes to an hour 9.9 10.4
More than an hour 3.6 3.2 5. Commute distance Less than 10 miles 42.8 43.7
10 to 25 miles 34.4 34.825 to 45 miles 15.2 14.6
More than 45 miles 6.5 5.9
6. Occupation Management 10.8 8.1 Business/Financial Operations 5.6 3.9
Computer/Mathematical 1.4 1.1Architecture/Engineering 2.7 2.0
Life/Physical/Social Science 0.7 0.9Community /Social Services 2.3 2.4
Legal 1.8 1.1Education/Training/Library 10.1 9.5
Arts/Design/Entertainment/Sports/Media 1.3 1.5Healthcare Practitioners/Technicians 5.7 5.0
Healthcare Support 4.9 4.7Protective Service 1.3 1.9
Food Preparation/Serving Related 3.0 4.2Building/Grounds Cleaning/Maintenance. 2.5 4.2
Personal Care/Service 2.1 2.5Sales and Related 7.6 8.5
Office/Administrative Support 6.2 6.7Farming/Fishing/Forestry 1.6 1.4
Construction/Extraction 2.7 2.7Installation/Maintenance/Repair 5.1 4.9
Production 4.3 4.6Transportation/Material Moving 4.0 4.2
other 12.6 14.1 7. Industry Agriculture/Forestry/Fishing/Hunting 3.4 3.2
Mining 0.3 0.2Utilities 2.6 1.1
Construction 4.4 4.6Manufacturing 9.5 8.8
Wholesale Trade 0.8 0.3Retail Trade 6.8 9.9
Transportation/Warehousing 4.4 4.4Information 0.8 0.9
Finance/Insurance 4.1 3.1Real Estate/Rental/Leasing 1.3 0.9
Professional/Scientific/Technical Services 2.8 1.9Management of Companies/Enterprises 1.0 0.4
Administrative/Support/Waste Management/Remediation Services 1.0 1.1Educational Services 12.8 14.3
Health Care/Social Assistance 15.6 16.2Arts/Entertainment/Recreation 1.0 1.0Accommodation/Food Services 3.4 3.9
Public Administration 4.2 3.4Other Services 7.1 7.2
Note: Rounding errors may be present. Responses to the questions on occupation and industry should only be used for making comparisons between the employed and the underemployed and not for indicating worker distribution by occupation or industry.

2013 Underemployment in Alabama WIAAs CBER, UA 15
Table A2. Alabama Underemployment Survey Results (Percent, continued) Employed Underemployed
8. Number of years at current/primary job Less than a year 14.6 16.9
1 to 3 years 7.3 8.9 3 to 5 years 6.7 8.1
5 to 10 years 13.3 13.8 10 to 20 years 22.6 22.7
More than 20 years 33.9 27.9 9. Monthly wages Less than $500 6.6 11.8
$500 up to $1,000 11.4 18.7 $1,000 up to $2,000 20.4 26.4 $2,000 up to $3,000 16.2 16.4 $3,000 up to $4,000 12.5 9.0 $4,000 up to $6,000 12.8 6.6
More than $6,000 12.5 5.7
Job Fitness
10. Percent of workers whose current job fits well with their education and training, skills, and experience
85.8 70.9
11. Percent of workers who believe they are qualified for a better job 62.7 85.0
Reasons: Education and training 92.7 95.0 Skills 95.4 95.9
Experience 94.7 95.4 12. Additional income for which workers would leave current job
0 to 5% more 6.0 8.2 5 to 15% more 21.3 23.5
15 to 30% more 26.5 25.6 30 to 50% more 14.1 14.3
More than 50% more 14.3 16.4 *** Would not leave current job 14.5 8.2
13. Additional commute for such a new job 0 to 10 miles 35.6 32.4
10 to 20 miles 33.2 33.5 more than 20 miles 28.7 31.6
14. Additional one-way commute time for this job 0 to 10 minutes 27.2 23.8
10 to 20 minutes 34.7 33.4 more than 20 minutes 36.5 41.4
15. Percent of workers who sought better job in past three months 20.4 36.7 16. Percent of workers who say they are currently underemployed 23.8 17. Reasons respondents give for being Underemployed Nonworkers
Lack of job opportunities in their area 63.8 26.2 Low wages at the available jobs 57.5 18.5
Live too far from jobs 35.3 17.6 In school or undergoing training 6.5 3.7
Spouse or partner has a really good job 17.8 9.4 They are retired 13.0 67.4
Because of social security limitations 8.0 25.9 Disability or other health concerns 8.7 46.3
Child care responsibilities 23.9 9.4 Care of someone other than a child 16.7 11.3
Other family or personal obligations 31.1 12.9 Owning a house in their area 31.6 17.9
Something else 17.2 20.1 Note: Rounding errors may be present.

CBER, UA 2013 Underemployment in Alabama WIAAs 16
Table A2. Alabama Underemployment Survey Results (Percent, continued) Selected Characteristics Employed Nonworkers Underemployed18. Married Respondents 67.3 49.6 62.4 19. Sex Female 56.4 66.7 60.2
Male 43.6 33.3 39.8 20. Median age (years) 52 66 50 21. Ethnicity Hispanic 1.1 1.1 1.4
21b. Race White 72.2 67.6 65.2 African-American or other ethnicity group 23.7 27.6 30.0
22. Last grade of school completed
Some high school or less but no diploma 4.5 17.4 4.8 High School or GED 27.1 36.6 25.1
Some college, no degree 16.3 15.9 17.1 Jr. College/trade school/associate degree 14.6 9.8 15.9
4-year college graduate/BA 21.4 11.1 23.0 Postgraduate/Masters 16.0 8.5 14.0
Job Satisfaction and Willingness to Train
Employed Underemployed
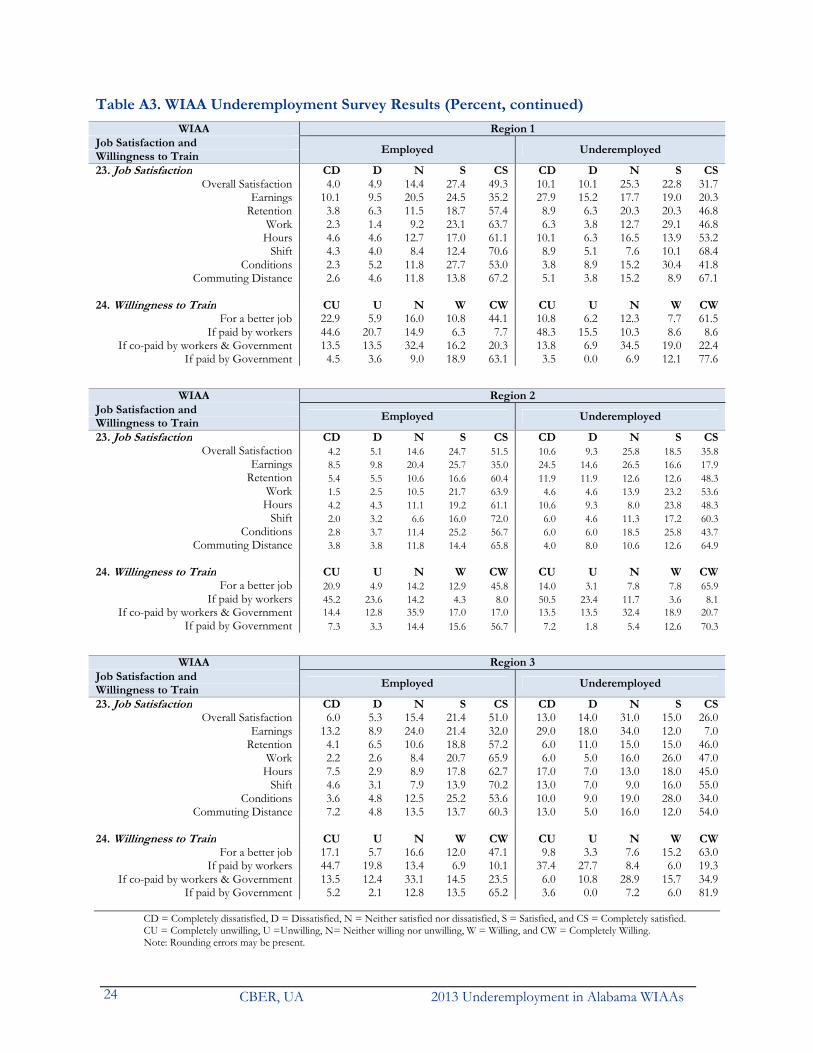
23. Job Satisfaction CD D N S CS CD D N S CSOverall Satisfaction 4.0 4.9 14.4 27.4 49.3 10.1 10.1 25.3 22.8 31.7
Earnings 10.1 9.5 20.5 24.5 35.2 27.9 15.2 17.7 19.0 20.3 Retention 3.8 6.3 11.5 18.7 57.4 8.9 6.3 20.3 20.3 46.8
Work 2.3 1.4 9.2 23.1 63.7 6.3 3.8 12.7 29.1 46.8 Hours 4.6 4.6 12.7 17.0 61.1 10.1 6.3 16.5 13.9 53.2
Shift 4.3 4.0 8.4 12.4 70.6 8.9 5.1 7.6 10.1 68.4 Conditions 2.3 5.2 11.8 27.7 53.0 3.8 8.9 15.2 30.4 41.8
Commuting Distance 2.6 4.6 11.8 13.8 67.2 5.1 3.8 15.2 8.9 67.1
24. Willingness to Train CU U N W CW CU U N W CWFor a better job 22.9 5.9 16.0 10.8 44.1 10.8 6.2 12.3 7.7 61.5
If paid by workers 44.6 20.7 14.9 6.3 7.7 48.3 15.5 10.3 8.6 8.6 If co-paid by workers & Government 13.5 13.5 32.4 16.2 20.3 13.8 6.9 34.5 19.0 22.4
If paid by Government 4.5 3.6 9.0 18.9 63.1 3.5 0.0 6.9 12.1 77.6
CD = Completely dissatisfied, D = Dissatisfied, N = Neither satisfied nor dissatisfied, S = Satisfied, and CS = Completely satisfied. CU = Completely unwilling, U =Unwilling, N= Neither willing nor unwilling, W = Willing, and CW = Completely Willing. Note: Rounding errors may be present.

2013 Underemployment in Alabama WIAAs CBER, UA 17
Table A3. WIAA Underemployment Survey Results (Percent) WIAA Region 1 Region 2 Region 3 Region 4
General Emp Und Emp Und Emp Und Emp Und
1. Percent of adults that are working full-time 75.0 59.0 76.6 57.7 74.8 58.8 78.6 62.7 2. Percent of part-timers who wish to work full-time 28.1 48.5 25.2 42.2 38.3 54.8 28.4 40.4 3. Percent of workers with more than one job 9.8 10.1 10.0 10.6 12.3 16.0 9.7 13.8 4. Average commute time (one-way) Up to 20 minutes 53.0 58.2 55.3 57.0 48.8 50.0 43.8 52.2
20 to 40 minutes 31.4 30.4 30.3 28.5 27.9 29.0 37.0 32.640 minutes to an hour 7.5 3.8 7.4 6.0 16.6 18.0 12.2 8.7
More than an hour 5.5 5.1 2.6 3.3 4.3 1.0 3.7 2.2 5. Commute distance Less than 10 miles 43.5 46.8 43.1 43.8 41.0 43.4 38.8 45.9
10 to 25 miles 36.7 39.0 38.7 39.0 26.1 33.3 34.5 35.625 to 45 miles 12.4 9.1 12.5 11.6 24.2 18.2 18.0 13.3
More than 45 miles 6.8 5.2 4.9 4.1 7.8 4.0 7.1 3.7 6. Occupation Management 7.5 3.8 11.2 8.6 11.5 9.0 13.0 8.0
Business/Financial Operations 3.8 1.3 6.0 5.3 5.5 4.0 8.0 3.6Computer/Mathematical 0.0 0.0 2.6 2.7 0.7 1.0 0.7 0.0
Architecture/Engineering 1.7 1.3 7.1 3.3 1.2 0.0 2.1 3.6Life/Physical/Social Science 0.6 0.0 0.5 0.7 0.7 1.0 0.7 1.5Community /Social Services 1.7 2.5 1.2 0.7 2.9 2.0 1.7 0.0
Legal 1.4 1.3 2.2 0.7 1.9 3.0 1.7 1.5Education/Training/Library 8.4 11.4 8.1 9.9 9.6 11.0 8.5 7.3
Arts/Design/Entertainment/Sports/Media 2.0 1.3 2.6 4.6 0.5 0.0 1.2 2.9Healthcare Practitioners/Technicians 4.9 5.1 4.9 5.3 3.6 2.0 7.6 8.7
Healthcare Support 5.2 5.1 3.4 2.7 6.3 6.0 6.6 5.8Protective Service 0.3 0.0 1.1 2.0 1.2 1.0 1.0 2.9
Food Preparation/Serving Related 3.2 2.5 2.3 4.6 4.1 6.0 3.3 5.8Building/Grounds Cleaning/Maintenance. 3.8 7.6 2.6 3.3 4.1 4.0 1.7 3.6
Personal Care/Service 2.3 3.8 2.3 2.7 2.9 1.0 2.1 2.2Sales and Related 8.7 11.4 8.6 7.3 6.7 8.0 7.8 9.4
Office/Administrative Support 6.3 8.9 4.9 7.3 6.0 4.0 6.8 6.5Farming/Fishing/Forestry 2.3 0.0 1.2 1.3 3.1 2.0 0.5 0.7
Construction/Extraction 3.8 2.5 2.3 2.7 1.4 2.0 2.8 0.0Installation/Maintenance/Repair 7.2 3.8 4.0 4.0 4.6 7.0 5.2 2.9
Production 7.8 3.8 2.8 3.3 4.3 4.0 1.9 3.6Transportation/Material Moving 6.9 8.9 2.5 2.0 4.3 4.0 3.1 4.4
other 10.4 13.9 15.7 15.2 12.7 18.0 11.8 15.2 7. Industry Agriculture/Forestry/Fishing/Hunting 2.3 0.0 3.1 2.7 5.8 4.0 1.2 0.0
Mining 0.6 0.0 0.0 0.0 1.2 0.0 0.9 0.0Utilities 2.6 0.0 2.3 0.0 1.7 2.0 2.8 0.7
Construction 6.1 5.1 4.2 4.0 3.6 3.0 6.6 6.5Manufacturing 13.3 7.6 8.5 5.3 11.1 8.0 5.2 4.4
Wholesale Trade 2.0 0.0 0.5 0.7 0.5 0.0 1.0 0.0Retail Trade 4.9 7.6 7.8 10.6 7.2 11.0 6.6 12.3
Transportation/Warehousing 6.3 10.1 3.1 2.0 2.4 1.0 4.7 5.8Information 0.3 1.3 1.4 2.0 0.2 1.0 1.0 0.7
Finance/Insurance 4.0 3.8 2.2 2.0 4.3 2.0 7.3 5.1Real Estate/Rental/Leasing 0.0 0.0 1.8 0.0 0.7 0.0 1.4 1.5
Professional/Scientific/Technical Services 0.6 0.0 5.8 4.6 1.9 3.0 3.1 2.2Management of Companies/Enterprises 1.2 0.0 1.1 0.0 1.4 0.0 1.2 1.5
Administrative/Support/Waste Management/Remediation 1.4 1.8 2.0 2.0 1.4 1.0 0.2 0.7Educational Services 10.4 12.7 9.7 11.9 15.1 19.0 11.5 9.4
Health Care/Social Assistance 14.1 16.5 11.8 11.3 16.6 15.0 19.6 22.5Arts/Entertainment/Recreation 1.7 1.3 1.8 2.7 0.2 0.0 1.0 2.2Accommodation/Food Services 4.0 2.5 2.9 2.7 4.1 8.0 3.8 4.4
Public Administration 4.0 3.8 5.7 5.3 4.1 2.0 3.3 2.9Other 8.9 11.4 7.7 12.6 6.0 8.0 5.0 6.5
Emp – Employed Und – Underemployed NnW – Nonworkers Note: Rounding errors may be present. Responses to the questions on occupation and industry should only be used for making comparisons between
the employed and the underemployed and not for indicating worker distribution by occupation or industry.

CBER, UA 2013 Underemployment in Alabama WIAAs 18
Table A3. WIAA Underemployment Survey Results (Percent) WIAA Region 5 Region 6 Region 7 Region 8
General Emp Und Emp Und Emp Und Emp Und
1. Percent of adults that are working full-time 77.6 65.6 75.1 66.2 78.1 70.2 76.7 57.1 2. Percent of part-timers who wish to work full-time 25.4 48.8 38.2 70.8 38.1 58.5 36.7 51.4 3. Percent of workers with more than one job 12.1 14.4 9.6 9.9 10.7 14.7 11.7 16.3 4. Average commute time (one-way) Up to 20 minutes 51.2 48.8 50.2 45.1 52.7 49.3 56.0 57.0
20 to 40 minutes 31.7 32.8 29.5 25.4 31.5 31.6 32.6 32.640 minutes to an hour 10.5 11.2 11.8 21.1 8.3 11.8 6.9 4.7
More than an hour 3.8 4.8 4.4 4.2 3.0 2.9 1.2 2.3 5. Commute distance Less than 10 miles 41.3 39.0 40.9 36.2 44.6 41.7 42.3 43.4
10 to 25 miles 32.7 32.5 32.6 33.3 34.7 33.3 40.2 44.625 to 45 miles 18.2 17.9 15.9 18.8 14.3 18.9 11.4 6.0
More than 45 miles 6.5 7.3 9.1 11.6 5.4 6.1 5.2 6.0 6. Occupation Management 10.5 11.2 7.8 9.9 11.4 8.1 11.1 7.0
Business/Financial Operations 6.1 5.6 5.9 2.8 4.7 3.7 5.1 2.3Computer/Mathematical 1.9 2.4 1.1 0.0 1.7 0.7 1.8 0.0
Architecture/Engineering 2.5 0.0 1.1 0.0 2.3 2.2 1.5 0.0Life/Physical/Social Science 1.0 1.6 0.4 0.0 0.9 0.0 0.3 0.0Community /Social Services 2.1 1.6 3.3 1.4 2.3 3.7 3.6 4.7
Legal 1.9 0.8 2.6 1.4 2.4 0.7 1.2 0.0Education/Training/Library 9.6 7.2 11.8 8.5 13.0 8.8 13.2 11.6
Arts/Design/Entertainment/Sports/Media 1.3 0.8 0.7 0.0 1.1 0.7 1.2 2.3Healthcare Practitioners/Technicians 5.4 4.0 5.5 2.8 5.8 5.9 5.4 5.8
Healthcare Support 3.6 5.6 6.3 4.2 3.8 2.2 4.2 3.5Protective Service 1.7 2.4 2.2 1.4 2.1 2.2 2.4 4.7
Food Preparation/Serving Related 2.9 4.0 3.3 5.6 2.6 2.9 3.3 3.5Building/Grounds Cleaning/Maintenance. 2.3 2.4 1.5 4.2 2.1 3.7 3.0 4.7
Personal Care/Service 2.3 1.6 2.2 1.4 1.7 2.2 2.1 4.7Sales and Related 4.8 5.6 6.3 5.6 6.9 9.6 8.1 15.1
Office/Administrative Support 5.5 4.8 4.1 1.4 7.9 8.8 6.9 8.1Farming/Fishing/Forestry 1.3 1.6 3.3 5.6 1.5 1.5 0.9 1.2
Construction/Extraction 4.2 2.4 2.6 5.6 2.6 4.4 1.2 1.2Installation/Maintenance/Repair 7.1 9.6 5.9 9.9 3.2 2.2 4.8 1.2
Production 5.4 6.4 7.4 9.9 4.9 4.4 3.0 2.3Transportation/Material Moving 4.6 7.2 5.5 5.6 3.4 5.2 3.0 2.3
other 12.1 11.2 9.2 12.7 11.8 16.2 12.9 14.0 7. Industry Agriculture/Forestry/Fishing/Hunting 2.5 1.6 5.2 7.0 3.4 2.9 3.3 3.5
Mining 0.2 0.8 0.4 0.0 0.0 0.0 0.0 0.0Utilities 3.8 1.6 3.0 2.8 1.9 0.7 1.5 2.3
Construction 4.6 6.4 2.2 2.8 3.8 4.4 3.3 5.8Manufacturing 14.3 16.0 12.9 18.3 7.1 7.4 4.8 4.7
Wholesale Trade 0.8 0.0 0.4 1.4 0.8 0.0 0.3 0.0Retail Trade 5.7 6.4 5.9 5.6 7.7 12.5 7.5 12.8
Transportation/Warehousing 5.2 8.0 5.9 2.8 3.6 2.9 3.3 1.2Information 0.6 0.8 1.1 0.0 1.3 0.7 0.6 0.0
Finance/Insurance 3.1 1.6 4.8 4.2 5.3 5.2 6.9 4.7Real Estate/Rental/Leasing 1.0 1.6 1.5 4.2 0.8 0.7 0.3 0.0
Professional/Scientific/Technical Services 1.5 0.0 1.1 1.4 2.8 0.7 2.4 2.3Management of Companies/Enterprises 0.6 0.0 1.1 1.4 0.6 0.7 1.5 0.0
Administrative/Support/Waste Management/Remediation 0.8 1.6 0.4 0.0 0.6 0.7 0.6 2.3Educational Services 11.7 11.2 14.4 12.7 16.5 18.4 17.7 19.8
Health Care/Social Assistance 15.5 20.0 14.4 9.9 13.0 13.2 16.2 14.0Arts/Entertainment/Recreation 1.2 0.0 0.0 0.0 1.1 0.0 0.9 2.3Accommodation/Food Services 3.6 4.8 5.2 9.9 3.0 3.7 3.6 3.5
Public Administration 3.3 2.4 4.8 2.8 6.2 6.6 4.2 2.3Other 8.6 6.4 7.4 4.2 7.3 3.7 7.5 4.7
Emp – Employed Und – Underemployed NnW – Nonworkers Note: Rounding errors may be present. Responses to the questions on occupation and industry should only be used for making comparisons between
the employed and the underemployed and not for indicating worker distribution by occupation or industry.

2013 Underemployment in Alabama WIAAs CBER, UA 19
Table A3. WIAA Underemployment Survey Results (Percent) WIAA Region 9 Region 10 Mobile County Jefferson County
General Emp Und Emp Und Emp Und Emp Und
1. Percent of adults that are working full-time 77.7 64.2 79.0 61.2 78.6 65.6 79.9 66.7 2. Percent of part-timers who wish to work full-time 32.0 55.4 44.0 60.0 24.1 33.3 38.5 54.6 3. Percent of workers with more than one job 9.9 11.8 11.1 12.6 9.8 14.8 12.3 18.5 4. Average commute time (one-way) Up to 20 minutes 49.9 46.4 57.6 54.4 47.8 47.5 46.0 50.8
20 to 40 minutes 32.6 33.3 27.5 29.1 38.8 37.7 41.7 35.440 minutes to an hour 10.0 12.4 8.1 8.7 6.7 9.8 5.2 4.6
More than an hour 4.1 3.9 3.6 2.9 2.8 1.6 2.8 1.5 5. Commute distance Less than 10 miles 42.0 43.9 50.3 52.0 44.4 50.0 41.2 46.8
10 to 25 miles 34.9 31.8 31.6 28.0 39.5 33.3 41.2 40.325 to 45 miles 13.6 15.5 11.3 14.0 10.5 11.7 12.4 9.7
More than 45 miles 7.7 7.4 5.9 5.0 4.0 1.7 2.9 0.0 6. Occupation Management 11.2 5.2 10.0 9.7 11.8 6.6 13.1 10.8
Business/Financial Operations 4.7 4.6 5.5 2.9 5.5 6.6 9.1 3.1Computer/Mathematical 0.9 1.3 1.9 1.0 2.4 3.3 0.0 0.0
Architecture/Engineering 2.1 2.0 3.0 5.8 2.8 0.0 2.0 4.6Life/Physical/Social Science 0.9 2.0 0.2 1.0 0.8 3.3 0.8 3.1Community /Social Services 2.7 3.9 2.4 3.9 1.2 1.6 2.0 0.0
Legal 1.2 1.3 1.7 0.0 1.2 0.0 2.4 1.5Education/Training/Library 9.3 9.2 11.7 12.6 10.2 11.5 5.2 3.1
Arts/Design/Entertainment/Sports/Media 1.0 0.7 0.4 0.0 1.2 0.0 1.6 4.6Healthcare Practitioners/Technicians 6.1 5.2 6.4 2.9 5.9 3.3 8.3 12.3
Healthcare Support 6.8 7.8 3.4 3.9 5.5 4.9 8.7 7.7Protective Service 0.7 0.7 1.3 1.9 1.2 1.6 0.8 1.5
Food Preparation/Serving Related 2.4 3.3 3.4 3.9 1.6 3.3 3.6 6.2Building/Grounds Cleaning/Maintenance. 2.1 3.9 2.6 6.8 1.2 3.3 2.0 3.1
Personal Care/Service 1.9 3.9 1.7 1.0 2.0 4.9 2.4 3.1Sales and Related 9.0 7.2 7.9 7.8 11.0 8.2 6.8 6.2
Office/Administrative Support 6.8 9.2 5.8 5.8 8.2 9.8 6.0 4.6Farming/Fishing/Forestry 1.3 0.7 2.1 1.9 0.4 0.0 0.4 0.0
Construction/Extraction 3.1 1.3 2.4 5.8 2.0 0.0 1.6 0.0Installation/Maintenance/Repair 4.4 5.2 5.8 4.9 3.9 4.9 4.4 1.5
Production 4.7 5.2 3.0 4.9 3.5 4.9 2.0 3.1Transportation/Material Moving 3.8 2.0 4.5 2.9 3.1 1.6 2.4 4.6
other 13.0 14.4 13.0 8.7 13.7 16.4 14.7 15.4 7. Industry Agriculture/Forestry/Fishing/Hunting 3.8 3.9 4.9 7.8 1.2 1.6 0.8 0.0
Mining 0.3 0.7 0.0 0.0 0.4 0.0 0.0 0.0Utilities 3.2 1.3 3.0 1.0 2.4 0.0 3.6 1.5
Construction 5.3 3.9 2.6 2.9 4.7 3.3 5.6 7.7Manufacturing 11.8 12.4 7.5 6.8 9.0 6.6 4.8 4.6
Wholesale Trade 0.9 0.0 0.6 1.0 2.0 0.0 0.4 0.0Retail Trade 6.2 9.2 7.9 8.7 7.5 11.5 6.8 13.9
Transportation/Warehousing 5.3 3.9 5.3 6.8 4.3 1.6 3.6 3.1Information 0.3 0.7 1.1 1.0 0.4 0.0 1.6 1.5
Finance/Insurance 2.1 2.0 3.2 1.0 3.1 3.3 7.9 4.6Real Estate/Rental/Leasing 2.1 1.3 1.9 0.0 2.0 1.6 1.6 1.5
Professional/Scientific/Technical Services 2.8 2.0 3.2 0.9 3.9 1.6 3.2 1.5Management of Companies/Enterprises 1.2 0.7 0.2 0.0 1.2 1.6 1.6 1.5
Administrative/Support/Waste Management/Remediation 1.2 0.7 1.3 1.9 0.4 0.0 0.0 0.0Educational Services 11.7 14.4 13.0 0.0 12.9 21.3 7.1 3.1
Health Care/Social Assistance 18.9 22.9 14.3 15.5 18.4 21.3 23.4 27.7Arts/Entertainment/Recreation 1.2 0.7 0.4 11.7 1.2 0.0 0.4 1.5Accommodation/Food Services 2.1 2.0 3.2 1.0 1.6 1.6 4.4 6.2
Public Administration 2.7 1.3 4.3 3.9 2.8 0.0 4.8 4.6Other 6.1 3.3 7.5 11.7 7.5 4.9 4.4 3.1
Emp – Employed Und – Underemployed NnW – Nonworkers Note: Rounding errors may be present. Responses to the questions on occupation and industry should only be used for making comparisons between
the employed and the underemployed and not for indicating worker distribution by occupation or industry.

CBER, UA 2013 Underemployment in Alabama WIAAs 20
Table A3. WIAA Underemployment Survey Results (Percent, continued) WIAA Region 1 Region 2 Region 3 Region 4
Emp Und Emp Und Emp Und Emp Und8. Years at current/primary job Less than a year 14.1 21.5 12.4 17.2 17.8 19.0 13.5 21.7
1 to 3 years 6.1 10.1 8.1 8.6 7.5 10.0 6.9 8.73 to 5 years 5.2 8.9 6.6 10.6 6.5 11.0 6.1 5.1
5 to 10 years 13.8 11.4 12.4 12.6 13.0 15.0 12.2 15.210 to 20 years 21.0 17.7 22.0 19.2 25.5 27.0 24.8 21.0
More than 20 years 38.9 27.9 36.9 30.5 27.2 17.0 35.2 26.1
9. Monthly wages Less than $500 5.5 11.4 6.9 14.6 6.7 9.0 5.2 11.6$500 up to $1,000 14.1 29.1 8.6 17.2 15.6 21.0 8.5 13.0
$1,000 up to $2,000 20.8 24.1 17.7 25.2 24.5 29.0 19.8 26.1$2,000 up to $3,000 17.0 15.2 15.4 15.2 15.9 20.0 16.7 15.9$3,000 up to $4,000 9.5 2.5 11.7 6.0 12.5 9.0 13.2 10.1 $4,000 up to $6,000 14.4 5.1 13.8 8.0 9.9 5.0 15.3 10.1
More than $6,000 10.1 5.1 17.5 8.6 7.9 7.0 13.9 5.8Job Fitness 10. Percent of workers whose current job fits well with their education and training, skills, and experience
87 66 88.0 74.8 85.3 71.0 84.0 68.1
11. Percent of workers who believe they are qualified for a better job
58 81 57.8 86.8 66.4 89.0 64.1 85.5
Reasons: Education and training 92 95 92.6 96.2 92.4 93.3 91.6 91.5Skills 95 97 95.5 95.4 95.3 94.4 95.1 93.2
Experience 94 94 91.2 91.6 92.4 92.1 96.2 96.6 12. Additional income for which workers would leave current job
0 to 5% more 4 5 6.8 12.3 5.2 4.4 5.1 6.4
5 to 15% more 18 15 22.2 22.8 23.3 23.9 23.8 23.815 to 30% more 28 30 26.7 21.1 28.0 28.3 23.8 19.130 to 50% more 14 15 12.7 14.0 15.0 15.2 12.6 15.9
More than 50% more 19 15 11.1 12.3 14.0 15.2 14.1 19.1 *** Would not leave current job 13 18 18.2 14.0 11.4 10.9 17.3 14.3
13. Additional commute for new job 0 to 10 miles 34 34 40.2 40.3 34.9 27.2 37.8 32.2
10 to 20 miles 34 31 32.3 33.3 30.6 33.7 36.8 39.7more than 20 miles 28 32 25.2 24.8 32.3 34.8 22.5 25.6
14. Additional one-way commute time 0 to 10 minutes 26 22 27.7 27.9 27.7 21.7 31.3 24.0
10 to 20 minutes 33 31 40.0 34.1 35.4 38.0 34.2 33.1more than 20 minutes 39 46 30.5 37.2 36.0 39.1 32.4 42.2
15. Percent of workers who sought better job in past three months
16.0 38.5 22.6 35.2 22.0 38.0 21.4 33.9
Underemployment 16. Percent of workers who say they are currently underemployed
22.8 23.2 24.0 24.0
17. Reasons respondents give for being Und NnW Und NnW Und NnW Und NnW
A lack of job opportunities in their area 65.8 24.5 48.3 21.4 73.0 29.4 55.8 20.9The low wages at the available jobs 51.9 18.7 48.3 13.9 64.0 20.6 44.2 16.8
They live too far from jobs 48.1 16.6 21.2 11.5 46.0 26.3 21.0 14.1They are in school or undergoing training 3.8 2.6 4.6 3.3 10.0 2.9 5.1 4.0
Their spouse or partner has a really good job 17.7 6.8 24.5 11.9 19.0 8.5 18.1 10.7They are retired 19.0 70.8 13.3 68.4 13.0 65.6 9.4 68.2
Because of social security limitations 12.7 24.2 7.3 20.0 9.0 30.3 8.0 26.7Disability or other health concerns 8.9 44.7 12.6 40.9 8.0 52.6 8.0 45.1
Child care responsibilities 20.3 8.3 21.9 12.0 26.0 8.7 26.8 9.3They take care of someone other than a child 20.3 10.2 14.1 11.5 15.0 11.3 15.2 11.7
Other family or personal obligations 24.1 12.3 17.9 14.0 34.0 13.7 36.2 13.2Owning a house in your area 48.4 13.5 31.3 18.3 33.3 21.8 21.6 16.9
Something else 10.1 21.7 23.8 20.1 12.0 20.6 18.8 20.2
Emp – Employed Und – Underemployed NnW – Nonworkers Note: Rounding errors may be present.

2013 Underemployment in Alabama WIAAs CBER, UA 21
Table A3. WIAA Underemployment Survey Results (Percent, continued) WIAA Region 5 Region 6 Region 7 Region 8
Emp Und Emp Und Emp Und Emp Und
8. Years at current/primary job Less than a year 13.4 13.6 15.5 14.1 15.0 14.7 8.9 17.41 to 3 years 6.9 8.8 8.5 7.0 7.1 6.6 7.6 12.83 to 5 years 5.9 4.8 8.5 8.5 6.8 9.6 7.6 9.3
5 to 10 years 16.6 16.0 11.8 9.9 15.8 19.9 11.6 8.110 to 20 years 21.6 26.4 22.5 23.9 23.1 20.6 25.1 26.7
More than 20 years 34.2 28.8 29.9 32.4 30.4 26.5 38.9 24.4
9. Monthly wages Less than $500 5.9 11.2 8.1 12.7 6.6 11.0 7.2 11.6$500 up to $1,000 10.5 20.0 16.6 18.3 10.9 16.2 13.2 22.1
$1,000 up to $2,000 23.7 30.4 21.4 25.4 19.5 24.3 22.5 27.9$2,000 up to $3,000 16.1 14.4 16.2 19.7 14.8 16.2 18.6 14.0$3,000 up to $4,000 13.2 10.4 10.0 7.0 15.6 17.7 9.0 7.0 $4,000 up to $6,000 13.4 5.6 10.0 5.6 10.7 5.2 13.5 5.8
More than $6,000 8.2 4.2 10.3 5.6 15.2 8.8 8.4 3.5Job Fitness 10. Percent of workers whose current job fits well with their education and training, skills, and experience
82.4 72.0 88.6 74.7 86.9 71.3 83.5 69.8
11. Percent of workers who believe they are qualified for a better job
62.1 83.2 67.2 81.7 62.3 84.6 69.5 86.1
Reasons: Education and training 95.1 96.2 90.1 94.8 94.0 94.8 92.7 94.6Skills 95.1 98.1 95.1 94.8 95.2 94.8 97.0 98.7
Experience 94.5 94.2 94.5 93.1 97.0 99.1 95.3 96.0 12. Additional income for which workers would leave current job
0 to 5% more 7.0 7.1 5.7 8.3 4.7 7.9 8.6 14.3
5 to 15% more 20.4 26.8 23.6 30.6 20.9 25.4 18.3 28.615 to 30% more 26.7 35.7 17.9 13.9 30.2 28.6 25.7 23.830 to 50% more 15.6 10.7 14.3 13.9 15.9 14.3 10.9 11.9
More than 50% more 14.1 16.1 20.7 25.0 11.6 9.5 17.1 14.3 *** Would not leave current job 12.2 1.8 10.7 2.8 12.8 6.4 17.1 7.1
13. Additional commute for new job 0 to 10 miles 33.3 29.0 31.9 35.8 35.6 32.8 35.3 32.5
10 to 20 miles 34.7 34.2 25.6 22.4 34.2 35.3 31.7 32.5more than 20 miles 29.7 35.1 39.5 38.8 27.9 31.0 28.8 28.9
14. Additional one-way commute time 0 to 10 minutes 25.1 21.9 24.4 25.4 26.6 27.6 27.3 19.3
10 to 20 minutes 35.2 35.1 30.7 31.3 34.0 29.3 36.7 39.8more than 20 minutes 37.9 42.1 43.3 41.8 37.4 43.1 33.5 37.4
15. Percent of workers who sought better job in past three months
19.1 34.2 15.1 22.4 19.8 37.9 24.5 39.8
Underemployment 16. Percent of workers who say they are currently underemployed
23.9 26.2 25.5 25.8
17. Reasons respondents give for being Und NnW Und NnW Und NnW Und NnW
A lack of job opportunities in their area 72.8 26.1 87.3 41.4 55.9 25.1 68.6 26.4The low wages at the available jobs 64.0 18.1 71.8 27.3 56.6 19.3 64.0 15.2
They live too far from jobs 44.8 17.7 67.6 32.7 30.9 14.8 31.4 17.7They are in school or undergoing training 8.0 3.4 8.5 7.6 10.3 4.3 2.3 2.9
Their spouse or partner has a really good job 16.0 7.6 15.5 11.7 19.9 9.1 15.1 8.2They are retired 12.8 67.5 8.5 57.2 11.8 66.1 12.8 67.0
Because of social security limitations 9.6 27.7 9.9 30.5 6.6 24.1 5.8 26.4Disability or other health concerns 11.2 49.0 5.6 48.5 6.6 41.7 10.5 48.7
Child care responsibilities 29.6 8.4 15.5 12.0 27.9 10.5 27.9 8.0They take care of someone other than a child 21.6 11.9 15.5 13.4 11.8 9.3 18.6 11.1
Other family or personal obligations 34.4 12.1 28.2 14.4 27.2 12.8 30.2 11.1Owning a house in your area 30.7 19.4 32.1 18.0 29.0 14.8 31.9 20.4
Something else 18.4 19.3 9.9 17.2 22.8 21.2 14.0 20.8
Emp – Employed Und – Underemployed NnW – Nonworkers Note: Rounding errors may be present.

CBER, UA 2013 Underemployment in Alabama WIAAs 22
Table A3. WIAA Underemployment Survey Results (Percent, continued) WIAA Region 9 Region 10 Mobile County Jefferson County
Emp Und Emp Und Emp Und Emp Und
8. Years at current/primary job Less than a year 14.3 13.1 15.8 18.5 12.6 8.2 11.5 18.51 to 3 years 7.7 11.8 6.4 4.9 7.1 9.8 7.9 9.23 to 5 years 8.0 7.2 4.9 6.8 8.6 6.6 5.6 6.2
5 to 10 years 11.7 11.1 14.7 14.6 9.4 11.5 13.5 15.410 to 20 years 20.5 22.2 20.9 24.3 20.4 21.3 22.6 18.5
More than 20 years 36.0 32.0 35.8 31.1 40.0 39.3 37.7 30.8
9. Monthly wages Less than $500 5.9 9.2 9.4 16.5 7.5 9.8 4.4 9.2$500 up to $1,000 10.3 20.3 11.9 15.5 5.5 14.8 9.5 12.3
$1,000 up to $2,000 19.0 24.2 18.3 28.2 16.9 21.3 18.7 24.6$2,000 up to $3,000 16.5 17.0 16.0 17.5 14.9 18.0 16.7 16.9$3,000 up to $4,000 12.5 7.8 14.5 8.7 13.7 11.5 13.9 12.3$4,000 up to $6,000 13.0 6.5 12.8 6.8 13.3 8.2 15.1 10.8
More than $6,000 13.9 5.9 10.7 4.9 18.8 6.6 15.5 9.2Job Fitness 10. Percent of workers whose current job fits well with their education and training, skills, and experience
86.4 75.2 86.1 63.1 85.9 72.1 81.8 66.2
11. Percent of workers who believe they are qualified for a better job
62.7 84.3 62.5 88.4 65.1 85.3 67.9 83.1
Reasons: Education and training 93.9 98.5 91.5 93.4 91.0 100.0 92.4 94.4Skills 94.8 96.9 96.3 96.7 94.6 94.2 93.0 92.6
Experience 95.8 99.2 95.6 95.6 97.0 100.0 95.9 98.2 12. Additional income for which workers would leave current job
0 to 5% more 6.2 10.8 6.5 4.4 5.0 8.8 4.8 7.1
5 to 15% more 20.9 23.0 20.9 15.2 19.2 20.6 26.4 28.615 to 30% more 26.8 20.3 27.9 37.0 28.4 20.6 27.2 21.430 to 50% more 15.6 17.6 13.0 13.0 14.9 14.7 10.4 17.9
More than 50% more 11.5 16.2 17.2 26.1 10.6 17.7 13.6 14.3 *** Would not leave current job 15.9 5.4 12.1 2.2 17.7 8.8 14.4 10.7
13. Additional commute for new job 0 to 10 miles 35.3 33.6 34.1 25.3 35.6 36.5 37.0 37.5
10 to 20 miles 32.8 31.4 35.1 36.4 37.6 38.5 38.0 35.7more than 20 miles 30.1 31.4 29.5 38.4 24.3 21.2 21.6 23.2
14. Additional one-way commute time 0 to 10 minutes 26.3 22.9 27.5 23.2 26.2 25.0 31.3 28.6
10 to 20 minutes 33.7 36.4 31.0 25.3 36.6 36.5 32.7 30.4more than 20 minutes 38.5 37.9 40.5 50.5 35.6 36.5 34.1 39.3
15. Percent of workers who sought better job in past three months
21.9 38.6 17.8 38.4 22.3 32.7 24.5 37.5
Underemployment 16. Percent of workers who say they are currently underemployed
22.6 22.0 23.9
25.8
17. Reasons respondents give for being Und NnW Und NnW Und NnW Und NnW
A lack of job opportunities in their area 64.1 27.0 66.0 26.3 47.5 22.4 55.4 19.7The low wages at the available jobs 60.8 19.0 60.2 19.9 50.8 17.1 44.6 15.5
They live too far from jobs 34.0 16.3 32.0 17.4 11.5 11.0 13.9 8.3They are in school or undergoing training 5.2 3.0 6.8 4.1 6.6 3.1 9.2 4.1
Their spouse or partner has a really good job 13.1 10.0 16.5 9.1 11.5 11.4 10.8 7.6They are retired 14.4 67.9 15.5 70.0 11.5 71.0 9.2 69.0
Because of social security limitations 6.5 25.6 6.8 26.2 8.2 25.2 3.1 25.9Disability or other health concerns 5.9 45.9 8.7 47.5 4.9 44.1 6.2 45.5
Child care responsibilities 25.5 9.3 11.7 7.8 26.2 10.7 21.5 6.6They take care of someone other than a child 15.0 11.1 18.5 12.1 9.8 12.9 9.2 11.0
Other family or personal obligations 30.7 12.6 34.0 13.3 27.9 14.5 29.2 11.0Owning a house in your area 31.1 17.6 36.8 18.1 19.2 17.5 18.5 18.1
Something else 15.0 19.7 17.5 19.7 21.3 21.9 29.2 16.6
Emp – Employed Und – Underemployed NnW – Nonworkers Note: Rounding errors may be present.

2013 Underemployment in Alabama WIAAs CBER, UA 23
Table A3. WIAA Underemployment Survey Results (Percent, continued)
WIAA Region 1 Region 2 Region 3 Region 4
Selected Emp NnW Und Emp NnW Und Emp NnW Und Emp NnW UndCharacteristics 18. Married Respondents 74.1 55.1 72.2 72.7 54.8 66.9 64.9 49.5 63.0 68.1 51.7 58.7 19. Sex Female 55.0 67.0 70.9 52.8 65.0 60.3 58.7 67.8 56.0 53.8 66.1 56.5
Male 45.0 33.0 29.1 47.2 35.0 39.7 41.4 32.2 44.0 46.2 33.9 43.5 20. Median age (years) 54 66 53 51 66 50 52 65 52 50 67 49.5 21. Ethnicity Hispanic 0.0 0.4 0.0 1.2 0.9 1.3 1.0 0.4 0.0 0.9 0.6 0.7
21b. Race White 88.5 84.3 87.3 81.1 81.9 79.5 71.2 62.3 61.0 80.0 79.0 76.1African-American/Other 7.8 11.1 6.3 13.8 10.8 13.9 26.9 33.1 36.0 16.7 16.7 19.6
22. Last school grade
High Sch./less, no diploma 7.2 21.1 7.6 2.8 13.6 1.3 4.3 17.8 5.0 3.8 15.9 1.5High School or GED 31.1 34.9 26.6 22.4 31.0 19.9 32.0 42.9 33.0 24.3 34.9 23.9
Some college, no degree 20.5 16.0 17.7 14.9 17.9 15.9 16.6 16.6 15.0 17.7 17.1 19.6Jr. College/trade
school/associate degree 13.3 8.9 16.5 14.4 11.5 17.9 18.8 9.0 14.0 13.0 9.9 16.7
4-year college graduate/BA 19.6 9.4 25.3 25.4 13.9 27.2 15.9 7.1 22.0 23.6 12.4 20.3Postgraduate/Masters 8.4 8.5 6.3 20.1 11.6 17.9 12.5 6.1 11.0 17.2 9.0 18.1
WIAA Region 5 Region 6 Region 7 Region 8
Selected Emp NnW Und Emp NnW Und Emp NnW Und Emp NnW UndCharacteristics 18. Married Respondents 68.5 52.6 60.0 63.8 42.0 63.4 59.6 43.5 47.6 61.7 41.9 58.1 19. Sex Female 53.2 66.2 53.6 61.6 70.0 63.4 63.2 68.8 61.1 64.1 63.9 70.9
Male 46.9 33.8 46.4 38.4 30.0 36.6 36.8 31.2 38.9 35.9 36.1 29.1 20. Median age (years) 51 66 50 53 62 52.5 47.5 64 46 51 66 51 21. Ethnicity Hispanic 0.4 1.3 0.8 2.6 0.8 4.2 1.5 1.4 2.4 1.2 1.0 1.2
21b. Race White 83.8 76.9 78.4 42.8 31.9 36.6 47.8 55.3 54.0 51.8 49.7 44.2African-American/Other 12.8 19.3 17.6 53.5 64.0 62.0 47.8 40.3 45.2 41.9 46.0 46.5
22. Last school grade
High Sch./less, no diploma 7.3 20.3 9.6 4.4 17.7 8.5 4.4 14.1 2.4 3.3 19.8 1.2High School or GED 27.2 37.6 26.4 32.5 42.2 29.6 21.3 30.8 20.6 28.7 37.1 26.7
Some college, no degree 15.9 15.1 20.0 12.2 13.4 16.9 14.7 16.2 18.3 17.7 13.0 20.9Jr. College/trade
school/associate degree 16.8 9.8 12.0 12.2 7.6 11.3 16.2 10.9 13.5 11.7 8.0 16.3
4-year college graduate/BA 21.4 9.3 21.6 19.6 11.2 19.7 29.4 14.4 25.4 18.9 12.6 17.4Postgraduate/Masters 11.5 7.0 10.4 18.8 6.8 14.1 14.0 12.7 19.8 19.5 8.2 17.4
WIAA Region 9 Region 10 Mobile County Jefferson County
Selected Emp NnW Und Emp NnW Und Emp NnW Und Emp NnW UndCharacteristics 18. Married Respondents 67.0 49.2 64.7 64.8 49.6 59.2 66.3 48.1 62.3 61.1 45.2 50.8 19. Sex Female 56.3 66.3 60.8 55.4 67.4 52.4 53.7 67.4 59.0 50.4 67.6 52.3
Male 43.7 33.7 39.2 44.6 32.6 47.6 46.3 32.6 41.0 49.6 32.4 47.7 20. Median age (years) 53 67 52 53 67 52.5 54 67 53.5 50 67 49 21. Ethnicity Hispanic 0.7 1.9 2.6 2.6 1.2 1.9 1.2 2.1 3.3 0.8 0.3 1.5
21b. Race White 69.2 63.5 63.4 75.1 71.1 63.1 69.4 62.6 63.9 65.5 63.1 63.1African-American/Other 26.7 31.6 31.4 20.3 23.8 33.0 27.8 30.7 32.8 29.8 32.1 29.2
22. Last school grade
High Sch./less, no diploma 3.2 16.5 2.6 7.3 18.4 10.7 2.0 15.7 1.6 3.6 11.0 0.0High School or GED 28.6 40.7 26.8 26.0 34.2 22.3 23.5 36.2 19.7 20.6 33.1 15.4
Some college, no degree 15.3 14.9 15.0 17.9 17.3 16.5 18.0 15.7 21.3 18.3 17.9 20.0Jr. College/trade
school/associate degree 17.0 9.5 19.6 13.7 11.1 14.6 12.9 10.7 9.8 10.3 11.7 16.9 4-year college graduate/BA 22.4 10.7 20.9 19.6 10.1 23.3 25.9 11.9 24.6 25.8 15.5 24.6
Postgraduate/Masters 13.3 7.0 14.4 15.4 8.5 12.6 17.3 8.8 21.3 21.0 10.0 23.1
Emp – Employed Und – Underemployed NnW – Nonworkers Note: Rounding errors may be present.
CBER, UA 2013 Underemployment in Alabama WIAAs 24
Table A3. WIAA Underemployment Survey Results (Percent, continued)
WIAA Region 1Job Satisfaction and
Employed Underemployed Willingness to Train 23. Job Satisfaction CD D N S CS CD D N S CS
Overall Satisfaction 4.0 4.9 14.4 27.4 49.3 10.1 10.1 25.3 22.8 31.7Earnings 10.1 9.5 20.5 24.5 35.2 27.9 15.2 17.7 19.0 20.3
Retention 3.8 6.3 11.5 18.7 57.4 8.9 6.3 20.3 20.3 46.8Work 2.3 1.4 9.2 23.1 63.7 6.3 3.8 12.7 29.1 46.8
Hours 4.6 4.6 12.7 17.0 61.1 10.1 6.3 16.5 13.9 53.2Shift 4.3 4.0 8.4 12.4 70.6 8.9 5.1 7.6 10.1 68.4
Conditions 2.3 5.2 11.8 27.7 53.0 3.8 8.9 15.2 30.4 41.8Commuting Distance 2.6 4.6 11.8 13.8 67.2 5.1 3.8 15.2 8.9 67.1
24. Willingness to Train CU U N W CW CU U N W CW
For a better job 22.9 5.9 16.0 10.8 44.1 10.8 6.2 12.3 7.7 61.5If paid by workers 44.6 20.7 14.9 6.3 7.7 48.3 15.5 10.3 8.6 8.6
If co-paid by workers & Government 13.5 13.5 32.4 16.2 20.3 13.8 6.9 34.5 19.0 22.4If paid by Government 4.5 3.6 9.0 18.9 63.1 3.5 0.0 6.9 12.1 77.6
WIAA Region 2Job Satisfaction and
Employed Underemployed Willingness to Train 23. Job Satisfaction CD D N S CS CD D N S CS
Overall Satisfaction 4.2 5.1 14.6 24.7 51.5 10.6 9.3 25.8 18.5 35.8 Earnings 8.5 9.8 20.4 25.7 35.0 24.5 14.6 26.5 16.6 17.9
Retention 5.4 5.5 10.6 16.6 60.4 11.9 11.9 12.6 12.6 48.3 Work 1.5 2.5 10.5 21.7 63.9 4.6 4.6 13.9 23.2 53.6
Hours 4.2 4.3 11.1 19.2 61.1 10.6 9.3 8.0 23.8 48.3 Shift 2.0 3.2 6.6 16.0 72.0 6.0 4.6 11.3 17.2 60.3
Conditions 2.8 3.7 11.4 25.2 56.7 6.0 6.0 18.5 25.8 43.7 Commuting Distance 3.8 3.8 11.8 14.4 65.8 4.0 8.0 10.6 12.6 64.9
24. Willingness to Train CU U N W CW CU U N W CW
For a better job 20.9 4.9 14.2 12.9 45.8 14.0 3.1 7.8 7.8 65.9 If paid by workers 45.2 23.6 14.2 4.3 8.0 50.5 23.4 11.7 3.6 8.1
If co-paid by workers & Government 14.4 12.8 35.9 17.0 17.0 13.5 13.5 32.4 18.9 20.7 If paid by Government 7.3 3.3 14.4 15.6 56.7 7.2 1.8 5.4 12.6 70.3
WIAA Region 3Job Satisfaction and
Employed Underemployed Willingness to Train 23. Job Satisfaction CD D N S CS CD D N S CS
Overall Satisfaction 6.0 5.3 15.4 21.4 51.0 13.0 14.0 31.0 15.0 26.0Earnings 13.2 8.9 24.0 21.4 32.0 29.0 18.0 34.0 12.0 7.0
Retention 4.1 6.5 10.6 18.8 57.2 6.0 11.0 15.0 15.0 46.0Work 2.2 2.6 8.4 20.7 65.9 6.0 5.0 16.0 26.0 47.0
Hours 7.5 2.9 8.9 17.8 62.7 17.0 7.0 13.0 18.0 45.0Shift 4.6 3.1 7.9 13.9 70.2 13.0 7.0 9.0 16.0 55.0
Conditions 3.6 4.8 12.5 25.2 53.6 10.0 9.0 19.0 28.0 34.0Commuting Distance 7.2 4.8 13.5 13.7 60.3 13.0 5.0 16.0 12.0 54.0
24. Willingness to Train CU U N W CW CU U N W CW
For a better job 17.1 5.7 16.6 12.0 47.1 9.8 3.3 7.6 15.2 63.0If paid by workers 44.7 19.8 13.4 6.9 10.1 37.4 27.7 8.4 6.0 19.3
If co-paid by workers & Government 13.5 12.4 33.1 14.5 23.5 6.0 10.8 28.9 15.7 34.9If paid by Government 5.2 2.1 12.8 13.5 65.2 3.6 0.0 7.2 6.0 81.9
CD = Completely dissatisfied, D = Dissatisfied, N = Neither satisfied nor dissatisfied, S = Satisfied, and CS = Completely satisfied. CU = Completely unwilling, U =Unwilling, N= Neither willing nor unwilling, W = Willing, and CW = Completely Willing. Note: Rounding errors may be present.
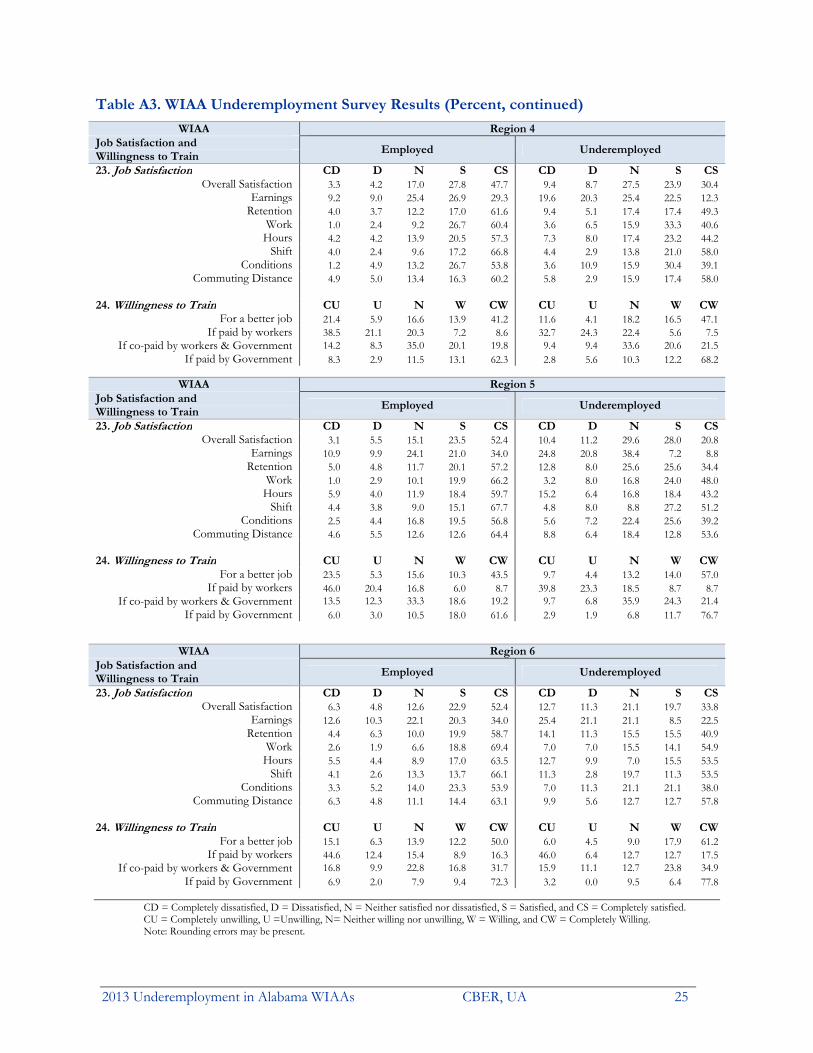
2013 Underemployment in Alabama WIAAs CBER, UA 25
Table A3. WIAA Underemployment Survey Results (Percent, continued)
WIAA Region 4Job Satisfaction and
Employed Underemployed Willingness to Train 23. Job Satisfaction CD D N S CS CD D N S CS
Overall Satisfaction 3.3 4.2 17.0 27.8 47.7 9.4 8.7 27.5 23.9 30.4 Earnings 9.2 9.0 25.4 26.9 29.3 19.6 20.3 25.4 22.5 12.3
Retention 4.0 3.7 12.2 17.0 61.6 9.4 5.1 17.4 17.4 49.3 Work 1.0 2.4 9.2 26.7 60.4 3.6 6.5 15.9 33.3 40.6
Hours 4.2 4.2 13.9 20.5 57.3 7.3 8.0 17.4 23.2 44.2 Shift 4.0 2.4 9.6 17.2 66.8 4.4 2.9 13.8 21.0 58.0
Conditions 1.2 4.9 13.2 26.7 53.8 3.6 10.9 15.9 30.4 39.1 Commuting Distance 4.9 5.0 13.4 16.3 60.2 5.8 2.9 15.9 17.4 58.0
24. Willingness to Train CU U N W CW CU U N W CW
For a better job 21.4 5.9 16.6 13.9 41.2 11.6 4.1 18.2 16.5 47.1 If paid by workers 38.5 21.1 20.3 7.2 8.6 32.7 24.3 22.4 5.6 7.5
If co-paid by workers & Government 14.2 8.3 35.0 20.1 19.8 9.4 9.4 33.6 20.6 21.5 If paid by Government 8.3 2.9 11.5 13.1 62.3 2.8 5.6 10.3 12.2 68.2
WIAA Region 5
Job Satisfaction and Employed Underemployed
Willingness to Train 23. Job Satisfaction CD D N S CS CD D N S CS
Overall Satisfaction 3.1 5.5 15.1 23.5 52.4 10.4 11.2 29.6 28.0 20.8 Earnings 10.9 9.9 24.1 21.0 34.0 24.8 20.8 38.4 7.2 8.8
Retention 5.0 4.8 11.7 20.1 57.2 12.8 8.0 25.6 25.6 34.4 Work 1.0 2.9 10.1 19.9 66.2 3.2 8.0 16.8 24.0 48.0
Hours 5.9 4.0 11.9 18.4 59.7 15.2 6.4 16.8 18.4 43.2 Shift 4.4 3.8 9.0 15.1 67.7 4.8 8.0 8.8 27.2 51.2
Conditions 2.5 4.4 16.8 19.5 56.8 5.6 7.2 22.4 25.6 39.2 Commuting Distance 4.6 5.5 12.6 12.6 64.4 8.8 6.4 18.4 12.8 53.6
24. Willingness to Train CU U N W CW CU U N W CW
For a better job 23.5 5.3 15.6 10.3 43.5 9.7 4.4 13.2 14.0 57.0 If paid by workers 46.0 20.4 16.8 6.0 8.7 39.8 23.3 18.5 8.7 8.7
If co-paid by workers & Government 13.5 12.3 33.3 18.6 19.2 9.7 6.8 35.9 24.3 21.4 If paid by Government 6.0 3.0 10.5 18.0 61.6 2.9 1.9 6.8 11.7 76.7
WIAA Region 6Job Satisfaction and
Employed Underemployed Willingness to Train 23. Job Satisfaction CD D N S CS CD D N S CS
Overall Satisfaction 6.3 4.8 12.6 22.9 52.4 12.7 11.3 21.1 19.7 33.8 Earnings 12.6 10.3 22.1 20.3 34.0 25.4 21.1 21.1 8.5 22.5
Retention 4.4 6.3 10.0 19.9 58.7 14.1 11.3 15.5 15.5 40.9 Work 2.6 1.9 6.6 18.8 69.4 7.0 7.0 15.5 14.1 54.9
Hours 5.5 4.4 8.9 17.0 63.5 12.7 9.9 7.0 15.5 53.5 Shift 4.1 2.6 13.3 13.7 66.1 11.3 2.8 19.7 11.3 53.5
Conditions 3.3 5.2 14.0 23.3 53.9 7.0 11.3 21.1 21.1 38.0 Commuting Distance 6.3 4.8 11.1 14.4 63.1 9.9 5.6 12.7 12.7 57.8
24. Willingness to Train CU U N W CW CU U N W CW
For a better job 15.1 6.3 13.9 12.2 50.0 6.0 4.5 9.0 17.9 61.2 If paid by workers 44.6 12.4 15.4 8.9 16.3 46.0 6.4 12.7 12.7 17.5
If co-paid by workers & Government 16.8 9.9 22.8 16.8 31.7 15.9 11.1 12.7 23.8 34.9 If paid by Government 6.9 2.0 7.9 9.4 72.3 3.2 0.0 9.5 6.4 77.8
CD = Completely dissatisfied, D = Dissatisfied, N = Neither satisfied nor dissatisfied, S = Satisfied, and CS = Completely satisfied. CU = Completely unwilling, U =Unwilling, N= Neither willing nor unwilling, W = Willing, and CW = Completely Willing. Note: Rounding errors may be present.

CBER, UA 2013 Underemployment in Alabama WIAAs 26
Table A3. WIAA Underemployment Survey Results (Percent, continued)
WIAA Region 7Job Satisfaction and
Employed Underemployed Willingness to Train 23. Job Satisfaction CD D N S CS CD D N S CS
Overall Satisfaction 2.4 4.1 14.6 28.9 49.9 7.4 7.4 22.8 27.2 35.3 Earnings 10.9 11.6 21.6 26.6 28.7 25.7 16.9 25.7 22.1 8.1
Retention 3.6 5.3 10.9 20.5 59.7 11.0 6.6 25.7 25.7 45.6 Work 0.8 2.8 7.5 25.7 63.2 2.2 4.4 11.0 28.7 53.7
Hours 3.8 2.8 11.1 19.5 62.9 8.1 3.7 15.4 15.4 57.4 Shift 3.0 3.0 8.4 18.2 67.4 5.2 5.2 9.6 19.1 61.0
Conditions 2.6 4.7 11.3 25.3 56.1 6.6 7.4 16.9 32.4 36.8 Commuting Distance 4.5 3.2 11.8 17.3 62.5 8.8 5.2 14.0 19.1 52.2
24. Willingness to Train CU U N W CW CU U N W CW
For a better job 21.9 5.4 16.2 11.9 42.6 16.4 2.6 15.5 11.2 54.3 If paid by workers 40.1 24.8 18.4 4.9 9.5 33.0 28.9 19.6 6.2 9.3
If co-paid by workers & Government 15.6 11.8 34.9 17.9 17.0 14.4 6.2 29.9 25.8 20.6 If paid by Government 6.6 2.9 11.5 16.4 61.4 2.1 2.1 9.3 12.4 74.2
WIAA Region 8Job Satisfaction and
Employed Underemployed Willingness to Train 23. Job Satisfaction CD D N S CS CD D N S CS
Overall Satisfaction 4.8 6.0 14.4 25.2 49.7 8.1 11.6 20.9 25.6 33.7 Earnings 14.4 10.8 21.6 24.3 28.7 30.2 16.3 22.1 17.4 14.0
Retention 5.7 5.1 13.5 18.6 56.0 12.8 7.0 18.6 18.6 39.5 Work 2.7 3.6 10.8 22.8 60.2 4.7 2.3 19.8 15.1 58.1
Hours 6.0 3.9 12.6 22.5 55.1 11.6 9.3 17.4 19.8 41.9 Shift 4.2 2.1 8.4 15.9 69.5 8.1 3.5 7.0 16.3 65.1
Conditions 5.4 3.6 15.6 23.4 52.1 8.1 4.7 14.0 30.2 43.0 Commuting Distance 4.2 6.6 8.4 15.3 65.6 5.8 7.0 9.3 14.0 64.0
24. Willingness to Train CU U N W CW CU U N W CW
For a better job 22.3 4.3 10.4 13.0 46.8 18.1 2.4 10.8 15.7 50.6 If paid by workers 43.5 16.2 24.1 5.1 8.3 33.8 22.1 25.0 5.9 10.3
If co-paid by workers & Government 18.1 9.3 31.0 18.1 20.8 14.7 10.3 22.1 23.5 26.5 If paid by Government 5.1 2.3 8.3 13.9 69.4 1.5 1.5 4.4 11.8 79.4
WIAA Region 9Job Satisfaction and
Employed Underemployed Willingness to Train 23. Job Satisfaction CD D N S CS CD D N S CS
Overall Satisfaction 3.7 5.0 16.1 24.5 50.7 7.8 10.5 24.8 23.5 33.3 Earnings 11.7 11.4 20.4 26.4 29.7 30.1 18.3 19.6 17.7 13.7
Retention 3.8 3.8 12.5 18.6 59.9 11.8 7.8 19.6 19.6 42.5 Work 1.8 3.2 8.4 22.1 64.3 4.6 7.8 12.4 25.5 49.7
Hours 5.6 4.1 9.1 20.2 60.6 14.4 7.2 12.4 18.3 47.7 Shift 3.4 3.1 9.3 14.3 69.5 6.5 4.6 13.1 12.4 62.8
Conditions 2.8 3.7 12.0 25.7 55.8 6.5 6.5 17.0 23.5 46.4 Commuting Distance 4.6 5.8 12.7 13.9 62.4 6.5 7.2 12.4 12.4 60.1
24. Willingness to Train CU U N W CW CU U N W CW
For a better job 20.1 4.3 14.5 14.0 45.5 14.3 2.9 12.1 12.9 55.0 If paid by workers 42.8 18.6 19.7 5.6 9.0 39.2 17.5 24.2 4.2 11.7
If co-paid by workers & Government 14.1 11.4 33.9 18.6 20.0 10.8 10.8 25.0 25.8 25.0 If paid by Government 6.3 2.0 10.3 14.6 64.8 4.2 0.0 7.5 12.5 72.5
CD = Completely dissatisfied, D = Dissatisfied, N = Neither satisfied nor dissatisfied, S = Satisfied, and CS = Completely satisfied. CU = Completely unwilling, U =Unwilling, N= Neither willing nor unwilling, W = Willing, and CW = Completely Willing. Note: Rounding errors may be present.

2013 Underemployment in Alabama WIAAs CBER, UA 27
Table A3. WIAA Underemployment Survey Results (Percent, continued)
WIAA Region 10Job Satisfaction and
Employed Underemployed Willingness to Train 23. Job Satisfaction CD D N S CS CD D N S CS
Overall Satisfaction 5.3 3.6 11.7 26.4 52.5 15.5 8.7 21.4 27.2 25.2 Earnings 9.0 10.5 23.2 21.8 35.4 24.3 20.4 27.2 9.7 18.5
Retention 4.7 3.0 11.3 19.6 59.1 15.5 5.8 22.3 22.3 34.0 Work 2.1 1.1 7.7 23.2 65.7 6.8 1.9 20.4 23.3 46.6
Hours 4.3 4.3 12.4 18.3 60.8 11.7 10.7 11.7 19.4 46.6 Shift 3.2 3.0 8.1 15.6 70.2 7.8 5.8 9.7 20.4 56.3
Conditions 3.6 3.6 13.4 23.7 55.4 8.7 6.8 26.2 23.3 34.0 Commuting Distance 5.1 5.3 7.9 12.4 69.1 9.7 7.8 9.7 13.6 59.2
24. Willingness to Train CU U N W CW CU U N W CW
For a better job 22.4 3.8 20.6 11.5 40.2 11.1 4.0 21.2 9.1 54.6 If paid by workers 47.9 15.7 24.3 3.3 6.6 46.6 17.1 22.7 2.3 8.0
If co-paid by workers & Government 13.4 13.4 35.4 17.7 18.4 8.0 9.1 38.6 17.1 26.1 If paid by Government 5.9 3.0 11.2 18.4 60.3 3.41 2.27 11.36 17.05 64.77
WIAA Mobile CountyJob Satisfaction and
Employed Underemployed Willingness to Train 23. Job Satisfaction CD D N S CS CD D N S CS
Overall Satisfaction 2.8 7.5 14.9 22.8 52.2 3.3 16.4 24.6 16.4 39.3 Earnings 11.8 12.9 18.4 23.1 32.6 26.2 19.7 23.0 14.8 14.8
Retention 3.5 3.1 11.0 19.6 61.6 9.8 6.6 26.2 26.2 44.3 Work 2.4 3.1 11.0 19.2 63.9 6.6 8.2 13.1 26.2 45.9
Hours 4.7 4.7 6.7 21.6 62.0 8.2 8.2 9.8 23.0 50.8 Shift 2.8 4.3 8.6 14.5 68.6 1.6 9.8 14.8 14.8 57.4
Conditions 1.6 3.5 15.7 23.9 54.9 3.3 6.6 27.9 23.0 39.3 Commuting Distance 3.9 4.7 12.9 13.7 63.9 3.3 6.6 13.1 16.4 60.7
24. Willingness to Train CU U N W CW CU U N W CW
For a better job 22.3 3.5 11.4 14.4 47.0 21.2 3.9 9.6 13.5 50.0 If paid by workers 41.4 17.2 17.8 8.3 10.2 36.6 19.5 17.1 7.3 12.2
If co-paid by workers & Government 15.9 10.2 31.2 17.2 22.9 9.8 9.8 22.0 26.8 26.8 If paid by Government 5.1 3.8 11.5 10.8 66.9 4.9 0.0 4.9 9.8 78.1
WIAA Jefferson CountyJob Satisfaction and
Employed Underemployed Willingness to Train 23. Job Satisfaction CD D N S CS CD D N S CS
Overall Satisfaction 2.8 4.8 17.9 29.4 45.2 7.7 10.8 24.6 30.8 26.2 Earnings 8.7 7.9 25.0 31.4 26.6 20.0 16.9 23.1 30.8 9.2
Retention 4.8 4.4 14.7 13.5 60.3 10.8 3.1 21.5 15.4 46.2 Work 1.2 3.2 9.9 28.2 57.5 4.6 9.2 13.9 38.5 33.9
Hours 3.2 4.0 14.3 23.4 55.2 6.2 10.8 16.9 32.3 33.9 Shift 3.2 2.0 8.7 19.8 66.3 4.6 1.5 9.2 29.2 55.4
Conditions 1.2 3.6 15.5 29.8 50.0 4.6 7.7 13.9 38.5 35.4 Commuting Distance 2.4 3.6 11.5 18.7 63.5 4.6 0.0 16.9 20.0 58.5
24. Willingness to Train CU U N W CW CU U N W CW
For a better job 19.7 5.8 15.4 13.5 43.8 8.9 1.8 21.4 16.1 48.2 If paid by workers 38.3 21.6 19.8 4.8 8.4 33.3 19.6 25.5 3.9 5.9
If co-paid by workers & Government 15.0 4.8 34.7 22.2 19.8 5.9 5.9 31.4 23.5 25.5 If paid by Government 4.2 2.4 13.8 10.2 66.5 2.0 3.9 7.8 9.8 74.5
CD = Completely dissatisfied, D = Dissatisfied, N = Neither satisfied nor dissatisfied, S = Satisfied, and CS = Completely satisfied. CU = Completely unwilling, U =Unwilling, N= Neither willing nor unwilling, W = Willing, and CW = Completely Willing. Note: Rounding errors may be present.

CBER, UA 2013 Underemployment in Alabama WIAAs 28
Underemployment in Workforce Investment Advisory Area, Region 1

2013 Underemployment in Alabama WIAAs CBER, UA 29
Underemployment in Workforce Investment Advisory Area, Region 1
WIAA Region 1 comprises of the six counties shown in Table 1.1. The area’s underemployment rate of 22.8 percent—which is lower than the state’s 23.8 percent—means that about 25,400 employed residents were underemployed in December 2012. Adding the unemployed gives a total available labor pool of about 33,600 for the area, roughly four times the number of unemployed and a more realistic measure of the region’s available labor. However, prospective employers must be able to offer higher wages, better benefits or terms of employment, or some other incentives to induce the underemployed to change jobs. The region’s lower underemployment rate gives it 5.3 percent of the state’s underemployed although it has 5.5 percent of the state’s workers.
Table 1.1 Region 1 Underemployed Alabama Region 1 Colbert Franklin Lauderdale Lawrence Marion Winston
Labor force 2,154,744 119,704 25,357 13,265 45,264 15,596 11,365 8,857Employed 2,013,847 111,486 23,670 12,326 42,477 14,493 10,462 8,058Underemployment rate 23.8% 22.8% 14.0% 35.1% 25.8% 20.7% 27.1% 12.0%Underemployed workers 479,296 25,385 3,323 4,325 10,942 2,999 2,837 967Unemployed 140,897 8,218 1,687 939 2,787 1,103 903 799Available labor pool 620,193 33,603 5,010 5,264 13,729 4,102 3,740 1,766
Note: Rounding errors may be present. Based on December 2012 labor force data. Source: Center for Business and Economic Research, The University of Alabama; Alabama Department of Labor; and U.S. Bureau of
Labor Statistics.
Underemployment Survey Results
Underemployment rates range from 12.0 percent in Winston County to 35.1 percent in Franklin. Three counties—Franklin, Lauderdale, and Winston—have higher underemployment rates than the state (Table 1.1). The rates are multiplied by the number of employed to get the number of underemployed workers. Table 1.2 shows the detailed underemployment survey results that include characteristics of the employed, underemployed, and nonworkers for all counties in the region. However, except for rates, detailed results for the underemployed at the county level are not discussed because they had too few underemployed respondents to the survey. At the county level, a low number of underemployed respondents can be used to estimate underemployment, but reliable inferences on characteristics cannot be made.
Of the employed, 75 percent are full-time workers, 10 percent hold more than one job, and 28 percent of part-time workers wish to work full-time. The one-way commute takes up to 20 minutes for 53 percent of the employed, but 13 percent take more than 40 minutes, with 5.5 percent spending more than an hour. Forty-four percent commute less than 10 miles; 19.2 percent travel more than 25 miles with 6.8 percent exceeding 45 miles. Sixty percent have 10 or more years on the job and 39 percent have more than 20 years job tenure. The median monthly wage is between $2,000 and $3,000. Eighty-seven percent of the employed say their jobs fit well with their education, training, skills, and experience. However, 58 percent believe they are qualified for a better job based on the same education and training, skills, and experience. Sixteen percent have sought better jobs in the preceding three months. When offered up to 15 percent higher wages, 23 percent would leave their jobs. Sixty-one percent will leave for more than 15 percent more pay with 18.9 percent wanting more than a 50 percent raise, but 13 percent would not leave their jobs. Thirty-four percent will add up to 10 miles to the one-way commute for the higher-paying job, but 29 percent are prepared to go 20 or more extra miles. For the better job, 39 percent will increase the one-way commute by more than 20 minutes while 26 percent will not consider adding more than 10 minutes.
CBER, UA 2013 Underemployment in Alabama WIAAs 30
Among the underemployed, 59 percent work full-time, 10 percent hold more than one job, and 49 percent of part-time workers want full-time work. About 58 percent commute for up to 20 minutes one-way, nine percent drive for over 40 minutes, and five percent take more than an hour. The commute is less than 10 miles for 47 percent of the underemployed; 14.2 percent have more than 25 miles to travel; and 5.2 percent exceed 45 miles. The underemployed have been in their current jobs for fewer years than the employed; 46 percent of the underemployed have been on their job for more than 10 years compared to 60 percent for all employed. Sixty-five percent earn up to $2,000 monthly versus 40 percent employed. More underemployed are in the health care and social assistance, educational services, other services, and transportation and warehousing sectors.
About 66 percent of the underemployed say their jobs fit well with their education, training, skills, and experience. Eighty-one percent believe they are qualified for a better job based on the same education and training, skills, and experience. Thirty-nine percent have sought better jobs in the preceding three months. Twenty percent would leave their current jobs for up to 15 percent more income; 60 percent would leave for more than 15 percent higher wages, with 15 percent wanting more than a 50 percent raise. Thirty-four percent will add up to 10 miles to the one-way commute for the new higher-paying job, but 32 percent are prepared to add more than 20 miles. Forty-six percent are willing to increase the one-way commute by more than 20 minutes for this new job while 22 percent will not consider driving more than 10 minutes.
Responses for overall job satisfaction and various aspects of the job show that most workers in Region 1 are satisfied or completely satisfied with their jobs but fewer underemployed workers are satisfied than all employees. About 54 percent of the underemployed are satisfied or completely satisfied with their jobs compared to 77 percent of all workers. Workers are more satisfied with the work they do and least satisfied with their earnings. The underemployed are most satisfied with their work shift. Workers are generally willing to train for a new or better job, with the underemployed being much more willing. About 69 percent of the underemployed are willing or completely willing to train for a new or better job versus 55 percent of all workers. The willingness to train is highest when the cost is fully borne by government and lowest when the trainee must pay the full costs. The underemployed are more willing to train even if they have to pay all the cost.
Of a total 877 respondents, 347 or 40 percent are employed. Primary reasons for underemployment are (i) lack of job opportunities in their area, (ii) low wages at available jobs, (iii) owning a house in an area away from jobs, and (iv) living too far from jobs. The main reasons for nonworker status are (i) retirement, (ii) disability or other health concerns, (iii) lack of job opportunities in their area, and (iv) social security limitations. Seventy-four percent employed, 55 percent nonworkers, and 72 percent underemployed are married. Men were 45 percent of employed, 33 percent nonworkers, and 29 percent underemployed. The median age is 54 for employed, 53 for underemployed, and 66 for nonworkers. Roughly 89 percent of employed, 84 percent of nonworkers, and 87 percent of underemployed are white; Hispanics are a tiny portion of the nonworkers respondents.
Seven percent of the employed and 21 percent of nonworkers do not hold a high school diploma or equivalent, compared to eight percent of underemployed. About 20 percent employed, 25 percent underemployed, and nine percent of nonworkers hold a bachelor’s or higher degree. WIAA Region 1 has a 33,600-strong labor pool that is willing to commute and is seeking higher wage jobs.

2013 Underemployment in Alabama WIAAs CBER, UA 31
Table 1.2 Underemployment Survey Results, Region 1 (Percent) County /WIAA Colbert Franklin Lauderdale Lawrence
General Emp Und Emp Und Emp Und Emp Und
1. Percent of adults that are working full-time 80.7 87.5 70.9 65.0 73.9 41.2 77.6 58.3 2. Percent of part-timers who wish to work full-time 0.0 0.0 29.4 42.9 50.0 70.0 7.7 0.0 3. Percent of workers with more than one job 10.5 0.0 10.5 15.0 9.1 11.8 10.3 8.3 4. Average commute time (one-way) Up to 20 minutes 61.4 62.5 57.9 60.0 50.0 58.8 44.8 58.3
20 to 40 minutes 31.6 37.5 29.8 30.0 28.8 29.4 43.1 25.040 minutes to an hour 7.0 0.0 10.5 10.0 9.1 5.9 5.2 0.0
More than an hour 0.0 0.0 0.0 0.0 9.1 5.9 6.9 16.7 5. Commute distance Less than 10 miles 49.1 62.5 46.4 35.0 40.6 47.1 39.7 50.0
10 to 25 miles 35.1 25.0 37.5 50.0 29.7 35.3 43.1 33.325 to 45 miles 14.0 12.5 10.7 10.0 17.2 5.9 15.5 16.7
More than 45 miles 0.0 0.0 5.4 5.0 10.9 11.8 1.7 0.0 6. Occupation Management 10.5 0.0 5.3 5.0 7.6 5.9 3.5 0.0
Business/Financial Operations 5.3 0.0 0.0 0.0 4.6 0.0 5.2 0.0Computer/Mathematical 0.0 0.0 0.0 0.0 0.0 0.0 0.0 0.0
Architecture/Engineering 1.8 0.0 0.0 0.0 4.6 0.0 0.0 0.0Life/Physical/Social Science 0.0 0.0 0.0 0.0 0.0 0.0 0.0 0.0Community /Social Services 1.8 0.0 0.0 16.7 1.5 0.0 1.7 8.3
Legal 7.0 0.0 0.0 0.0 0.0 0.0 1.7 8.3Education/Training/Library 8.8 12.5 12.3 15.0 10.6 17.7 5.2 0.0
Arts/Design/Entertainment/Sports/Media 8.8 0.0 1.8 0.0 3.0 0.0 1.7 0.0Healthcare Practitioners/Technicians 7.0 0.0 1.8 5.0 4.6 0.0 8.6 8.3
Healthcare Support 1.8 25.0 1.8 0.0 6.1 0.0 8.6 8.3Protective Service 1.8 0.0 0.0 0.0 0.0 0.0 1.7 0.0
Food Preparation/Serving Related 0.0 0.0 5.3 5.0 4.6 5.9 1.7 0.0Building/Grounds Cleaning/Maintenance. 10.5 0.0 1.8 5.0 7.6 17.7 5.2 8.3
Personal Care/Service 7.0 0.0 3.5 5.0 1.5 0.0 0.0 0.0Sales and Related 0.0 25.0 8.8 5.0 7.6 5.9 10.3 8.3
Office/Administrative Support 3.5 0.0 14.0 20.0 3.0 5.9 5.2 8.3Farming/Fishing/Forestry 0.0 25.0 3.5 0.0 4.6 0.0 1.7 0.0
Construction/Extraction 3.5 0.0 5.3 5.0 3.0 0.0 3.5 8.3Installation/Maintenance/Repair 1.8 12.5 10.5 0.0 6.1 5.9 6.9 0.0
Production 12.3 0.0 7.0 10.0 7.6 5.9 6.9 0.0Transportation/Material Moving 3.5 12.5 7.0 5.0 3.0 5.9 10.3 25.0
other 14.0 12.5 10.5 15.0 9.1 23.5 10.3 8.3 7. Industry Agriculture/Forestry/Fishing/Hunting 0.0 0.0 3.5 5.0 1.5 0.0 5.2 0.0
Mining 0.0 0.0 0.0 0.0 0.0 0.0 0.0 0.0Utilities 0.0 0.0 1.8 0.0 7.6 0.0 3.5 0.0
Construction 3.5 0.0 5.3 0.0 7.6 5.9 5.2 8.3Manufacturing 15.8 12.5 17.5 10.0 10.6 11.8 6.9 0.0
Wholesale Trade 1.8 0.0 3.5 0.0 3.0 0.0 0.0 0.0Retail Trade 3.5 0.0 3.5 0.0 4.6 5.9 5.2 8.3
Transportation/Warehousing 7.0 25.0 5.3 10.0 3.0 11.8 8.6 8.3Information 0.0 0.0 0.0 0.0 1.5 5.9 0.0 0.0
Finance/Insurance 0.0 0.0 3.5 5.0 4.6 5.9 6.9 0.0Real Estate/Rental/Leasing 0.0 0.0 0.0 0.0 0.0 0.0 0.0 0.0
Professional/Scientific/Technical Services 0.0 0.0 0.0 0.0 0.0 0.0 0.0 0.0Management of Companies/Enterprises 0.0 0.0 3.5 0.0 0.0 0.0 1.7 0.0
Administrative/Support/Waste Management/Remediation 5.3 0.0 0.0 0.0 0.0 0.0 1.7 0.0Educational Services 10.5 12.5 14.0 20.0 10.6 11.8 10.3 16.7
Health Care/Social Assistance 19.3 37.5 8.8 15.0 13.6 0.0 15.5 16.7Arts/Entertainment/Recreation 1.8 0.0 1.8 0.0 1.5 0.0 0.0 0.0Accommodation/Food Services 3.5 8.3 3.5 5.0 7.6 5.9 5.2 0.0
Public Administration 3.5 0.0 3.5 5.0 4.6 0.0 3.5 0.0Other 12.3 0.0 5.3 5.0 9.1 11.8 8.6 25.0
Emp – Employed Und – Underemployed NnW – Nonworkers Note: Rounding errors may be present. Responses to the questions on occupation and industry should only be used for making comparisons between
the employed and the underemployed and not for indicating worker distribution by occupation or industry.

CBER, UA 2013 Underemployment in Alabama WIAAs 32
Table 1.2 Underemployment Survey Results, Region 1 (Percent, continued) County /WIAA Marion Winston Region 1
General Emp Und Emp Und Emp Und
1. Percent of adults that are working full-time 74.1 62.5 72.3 40.0 75.0 59.0 2. Percent of part-timers who wish to work full-time 26.7 66.7 40.0 50.0 28.1 48.5 3. Percent of workers with more than one job 11.9 12.5 6.0 0.0 9.8 10.1 4. Average commute time (one-way) Up to 20 minutes 57.6 56.3 46.0 50.0 53.0 58.2
20 to 40 minutes 25.4 25.0 30.0 50.0 31.4 30.4 40 minutes to an hour 6.8 0.0 6.0 0.0 7.5 3.8
More than an hour 5.1 6.3 12.0 0.0 5.5 5.1 5. Commute distance Less than 10 miles 53.6 57.1 29.8 33.3 43.5 46.8
10 to 25 miles 30.4 35.7 46.8 50.0 36.7 39.0 25 to 45 miles 7.1 0.0 8.5 16.7 12.4 9.1
More than 45 miles 8.9 7.1 14.9 0.0 6.8 5.2 6. Occupation Management 3.4 6.3 16.0 0.0 7.5 3.8
Business/Financial Operations 5.1 6.3 2.0 0.0 3.8 1.3 Computer/Mathematical 0.0 0.0 0.0 0.0 0.0 0.0
Architecture/Engineering 3.4 6.3 0.0 0.0 1.7 1.3 Life/Physical/Social Science 1.7 0.0 2.0 0.0 0.6 0.0 Community /Social Services 3.4 6.3 2.0 0.0 1.7 2.5
Legal 1.7 0.0 4.0 0.0 1.4 1.3 Education/Training/Library 10.2 6.3 4.0 16.7 8.4 11.4
Arts/Design/Entertainment/Sports/Media 1.7 0.0 4.0 16.7 2.0 1.3 Healthcare Practitioners/Technicians 3.4 12.5 2.0 0.0 4.9 5.1
Healthcare Support 6.8 6.3 0.0 0.0 5.2 5.1 Protective Service 0.0 0.0 0.0 0.0 0.3 0.0
Food Preparation/Serving Related 5.1 0.0 0.0 0.0 3.2 2.5 Building/Grounds Cleaning/Maintenance. 3.4 625.0 2.0 0.0 3.8 7.6
Personal Care/Service 1.7 6.3 8.0 16.7 2.3 3.8 Sales and Related 6.8 18.8 8.0 16.7 8.7 11.4
Office/Administrative Support 3.4 6.5 6.0 0.0 6.3 8.9 Farming/Fishing/Forestry 3.4 0.0 0.0 0.0 2.3 0.0
Construction/Extraction 3.4 0.0 4.0 0.0 3.8 2.5 Installation/Maintenance/Repair 5.1 0.0 14.0 16.7 7.2 3.8
Production 8.5 0.0 4.0 0.0 7.8 3.8 Transportation/Material Moving 8.5 6.3 10.0 0.0 6.9 8.9
other 10.2 6.3 8.0 16.7 10.4 13.9 7. Industry Agriculture/Forestry/Fishing/Hunting 3.4 0.0 0.0 0.0 2.3 0.0
Mining 1.7 0.0 2.0 0.0 0.6 0.0 Utilities 1.7 0.0 0.0 0.0 2.6 0.0
Construction 6.8 6.3 8.0 0.0 6.1 5.1 Manufacturing 11.9 6.3 18.0 0.0 13.3 7.6
Wholesale Trade 1.7 0.0 2.0 0.0 2.0 0.0 Retail Trade 5.1 12.5 8.0 33.3 4.9 7.6
Transportation/Warehousing 5.1 6.3 10.0 0.0 6.3 10.1 Information 0.0 0.0 0.0 0.0 0.3 1.3
Finance/Insurance 5.1 6.3 4.0 0.0 4.0 3.8 Real Estate/Rental/Leasing 0.0 0.0 0.0 0.0 0.0 0.0
Professional/Scientific/Technical Services 1.7 0.0 2.0 0.0 0.6 0.0 Management of Companies/Enterprises 0.0 0.0 2.0 0.0 1.2 0.0
Administrative/Support/Waste Management/Remediation 0.0 0.0 2.0 0.0 1.4 1.8 Educational Services 11.9 6.3 4.0 0.0 10.4 12.7
Health Care/Social Assistance 17.0 25.0 10.0 16.7 14.1 16.5 Arts/Entertainment/Recreation 1.7 0.0 4.0 16.7 1.7 1.3 Accommodation/Food Services 1.7 0.0 2.0 0.0 4.0 2.5
Public Administration 5.1 12.5 4.0 0.0 4.0 3.8 Other 13.6 12.5 4.0 16.7 8.9 11.4
Emp – Employed Und – Underemployed NnW – Nonworkers Note: Rounding errors may be present. Responses to the questions on occupation and industry should only be used for making comparisons between
the employed and the underemployed and not for indicating worker distribution by occupation or industry.

2013 Underemployment in Alabama WIAAs CBER, UA 33
Table 1.2 Underemployment Survey Results, Region 1 (Percent, continued) County /WIAA Colbert Franklin Lauderdale Lawrence
Emp Und Emp Und Emp Und Emp Und
8. Years at current/primary job Less than a year 14.0 12.5 8.8 10.0 15.2 17.7 20.7 33.31 to 3 years 3.5 0.0 8.8 5.0 9.1 23.5 5.2 25.03 to 5 years 7.0 25.0 7.0 15.0 0.0 0.0 3.5 0.0
5 to 10 years 5.3 0.0 17.5 10.0 15.2 5.9 17.2 16.710 to 20 years 17.5 25.0 22.8 35.0 18.2 5.9 25.9 16.7
More than 20 years 50.9 25.0 35.1 25.0 42.4 47.1 27.6 8.3
9. Monthly wages Less than $500 3.5 12.5 3.5 5.0 4.6 11.8 10.3 16.7$500 up to $1,000 12.3 25.0 14.0 20.0 16.7 41.2 13.8 33.3
$1,000 up to $2,000 21.1 25.0 28.1 40.0 16.7 11.8 24.1 25.0$2,000 up to $3,000 15.8 25.0 14.0 10.0 13.6 11.8 19.0 8.3$3,000 up to $4,000 7.0 0.0 8.8 5.0 10.6 0.0 6.9 0.0$4,000 up to $6,000 22.8 0.0 10.5 10.0 10.6 0.0 12.1 16.7
More than $6,000 12.3 0.0 14.0 10.0 21.2 11.8 5.2 0.0Job Fitness 10. Percent of workers whose current job fits well with their education and training, skills, and experience
86.0 50.0 87.7 80.0 86.4 58.8 86.2 66.7
11. Percent of workers who believe they are qualified for a better job
54.4 87.5 63.2 75.0 62.1 76.5 55.2 75.0
Reasons: Education and training 93.6 85.7 91.7 93.3 85.4 92.3 96.9 100.0Skills 93.6 100.0 91.7 86.7 92.7 100.0 100.0 100.0
Experience 93.6 85.7 91.7 93.3 85.4 84.6 100.0 100.0 12. Additional income for which workers would leave current job
0 to 5% more 0.0 0.0 8.0 10.0 5.9 0.0 3.0 0.0
5 to 15% more 23.3 33.3 16.0 20.0 11.8 28.6 21.2 0.015 to 30% more 40.0 0.0 4.0 10.0 41.2 28.6 30.3 50.030 to 50% more 13.3 66.7 16.0 10.0 8.8 0.0 18.2 37.5
More than 50% more 16.7 0.0 24.0 10.0 20.6 28.6 9.1 12.5 *** Would not leave current job 6.7 0.0 32.0 40.0 8.8 14.3 15.2 0.0
13. Additional commute for new job 0 to 10 miles 40.8 42.9 28.9 26.7 32.8 43.8 29.8 30.0
10 to 20 miles 36.7 28.6 35.6 40.0 34.5 31.3 31.9 20.0more than 20 miles 20.4 28.6 28.9 26.7 29.3 25.0 36.2 50.0
14. Additional one-way commute time 0 to 10 minutes 34.7 14.3 24.4 20.0 20.7 12.5 27.7 40.0
10 to 20 minutes 32.7 28.6 26.7 26.7 44.8 62.5 31.9 10.0more than 20 minutes 32.7 0.0 46.7 53.3 31.0 25.0 40.4 50.0
15. Percent of workers who sought better job in past three months
16.3 42.9 17.8 33.3 17.2 37.5 14.9 30.0
Underemployment 16. Percent of workers who say they are currently underemployed
14.0 35.1 25.8
24.0
17. Reasons respondents give for being Und NnW Und NnW Und NnW Und NnW
A lack of job opportunities in their area 62.5 19.4 70.0 23.6 76.5 16.7 33.3 31.0The low wages at the available jobs 50.0 15.7 60.0 23.6 58.8 13.9 33.3 19.0
They live too far from jobs 37.5 16.7 55.0 11.1 35.3 13.0 25.0 15.0They are in school or undergoing training 0.0 0.9 5.0 1.4 0.0 3.7 8.3 2.0
Their spouse or partner has a really good job 50.0 3.7 20.0 8.3 11.8 8.3 8.3 4.0They are retired 0.0 72.2 5.0 65.3 35.3 75.0 25.0 67.0
Because of social security limitations 0.0 27.8 5.0 18.1 23.5 26.9 25.0 24.0Disability or other health concerns 12.5 37.0 15.0 47.2 94.1 34.3 16.7 48.0
Child care responsibilities 12.5 3.7 15.0 8.3 35.3 9.3 25.0 11.0They take care of someone other than a child 25.0 10.2 20.0 8.3 17.7 7.4 50.0 12.0
Other family or personal obligations 12.5 10.2 50.0 9.7 11.8 14.8 33.3 12.0Owning a house in your area 33.3 14.0 55.6 11.3 57.1 9.9 40.0 11.0
Something else 12.5 27.8 5.0 12.5 5.9 24.1 16.7 20.0
Emp – Employed Und – Underemployed NnW – Nonworkers Note: Rounding errors may be present.

CBER, UA 2013 Underemployment in Alabama WIAAs 34
Table 1.2 Underemployment Survey Results, Region 1 (Percent, continued) County/WIAA Marion Winston Region 1
Emp Und Emp Und Emp Und 8. Years at current/primary job Less than a year 11.9 31.3 14.0 33.3 14.1 21.5
1 to 3 years 1.7 0.0 8.0 0.0 6.1 10.1 3 to 5 years 11.9 12.5 2.0 0.0 5.2 8.9
5 to 10 years 13.6 18.8 14.0 16.7 13.8 11.4 10 to 20 years 22.0 6.3 20.0 16.7 21.0 17.7
More than 20 years 37.3 25.0 40.0 33.3 38.9 27.9
9. Monthly wages Less than $500 3.4 6.3 8.0 33.3 5.5 11.4 $500 up to $1,000 8.5 18.8 20.0 50.0 14.1 29.1
$1,000 up to $2,000 22.0 25.0 12.0 0.0 20.8 24.1 $2,000 up to $3,000 25.4 31.3 14.0 0.0 17.0 15.2 $3,000 up to $4,000 13.6 6.3 10.0 16.7 9.5 2.5 $4,000 up to $6,000 13.6 6.3 18.0 0.0 14.4 5.1
More than $6,000 1.7 0.0 4.0 0.0 10.1 5.1 Job Fitness 10. Percent of workers whose current job fits well with their education and training, skills, and experience
86.4 68.8 88.0 50.0 86.7 65.8
11. Percent of workers who believe they are qualified for a better job
54.2 81.3 56.0 83.3 57.6 80.7
Reasons: Education and training 93.8 100.0 89.3 100.0 91.5 95.2 Skills 96.9 100.0 96.4 100.0 95.0 96.7
Experience 100.0 100.0 96.4 100.0 94.0 93.6 12. Additional income for which workers would leave current job
0 to 5% more 0.0 0.0 13.6 33.3 4.4 5.0 5 to 15% more 27.8 11.1 4.6 0.0 18.3 15.0
15 to 30% more 22.2 55.6 27.3 0.0 28.3 30.0 30 to 50% more 13.9 0.0 13.6 0.0 13.9 15.0
More than 50% more 25.0 11.1 18.2 33.3 18.9 15.0 *** Would not leave current job 8.3 11.1 13.6 33.3 13.3 17.5
13. Additional commute for new job 0 to 10 miles 30.6 30.8 40.0 25.0 33.7 33.9
10 to 20 miles 32.7 30.8 32.5 25.0 34.0 30.8 more than 20 miles 30.6 30.8 25.0 50.0 28.5 32.3
14. Additional one-way commute time 0 to 10 minutes 28.6 23.1 20.0 25.0 26.0 21.5
10 to 20 minutes 18.4 15.4 42.5 25.0 33.0 30.8 more than 20 minutes 49.0 53.9 35.0 50.0 38.9 46.2
15. Percent of workers who sought better job in past three months
16.3 46.2 12.50 50.00 16.0 38.5
Underemployment 16. Percent of workers who say they are currently underemployed
27.1 12.0 22.8
17. Reasons respondents give for being Und NnW Und NnW Und NnW
A lack of job opportunities in their area 75.0 33.3 66.7 27.4 65.8 24.5 The low wages at the available jobs 56.3 17.4 33.3 26.0 51.9 18.7
They live too far from jobs 81.3 14.5 33.3 31.5 48.1 16.6 They are in school or undergoing training 0.0 2.9 16.7 5.5 3.8 2.6
Their spouse or partner has a really good job 12.5 4.4 16.7 13.7 17.7 6.8 They are retired 18.8 68.1 33.3 75.3 19.0 70.8
Because of social security limitations 6.3 18.8 16.7 26.0 12.7 24.2 Disability or other health concerns 6.3 59.4 0.0 50.7 8.9 44.7
Child care responsibilities 12.5 8.7 16.7 9.6 20.3 8.3 They take care of someone other than a child 6.3 11.6 0.0 12.3 20.3 10.2
Other family or personal obligations 12.5 14.5 0.0 12.3 24.1 12.3 Owning a house in your area 50.0 19.0 25.0 19.0 48.4 13.5
Something else 12.5 24.6 16.7 17.8 10.1 21.7
Emp – Employed Und – Underemployed NnW – Nonworkers Note: Rounding errors may be present.

2013 Underemployment in Alabama WIAAs CBER, UA 35
Table 1.2 Underemployment Survey Results, Region 1 (Percent, continued) County/WIAA Colbert Franklin Lauderdale Lawrence
Selected Emp NnW Und Emp NnW Und Emp NnW Und Emp NnW UndCharacteristics 18. Married Respondents 71.9 46.3 87.5 75.4 55.6 80.0 60.6 60.2 41.2 79.3 51.0 83.3 19. Sex Female 57.9 66.7 87.5 57.9 62.5 70.0 48.5 64.8 64.7 58.6 73.0 66.7
Male 42.1 33.3 12.5 42.1 37.5 30.0 51.5 35.2 35.3 41.4 27.0 33.3 20. Median age (years) 53 69 53 53 64 51 57 66 53 50.5 65.5 50.5 21. Ethnicity Hispanic 0.0 0.0 0.0 0.0 0.0 0.0 0.0 0.9 0.0 1.7 1.0 0.0
21b. Race White 84.2 84.3 87.5 98.3 88.9 100.0 87.9 83.3 82.4 72.4 74.0 66.7African-American/Other 10.5 12.0 12.5 1.8 9.7 16.7 12.1 11.1 17.7 15.5 17.0 0.0
22. Last school grade
High Sch./less, no diploma 1.8 14.8 0.0 12.3 23.6 15.0 9.1 15.7 11.8 6.9 25.0 0.0High School or GED 31.6 35.2 25.0 21.1 41.7 20.0 24.2 26.9 23.5 32.8 41.0 50.0
Some college, no degree 17.5 19.4 25.0 28.1 15.3 20.0 13.6 17.6 17.7 24.1 13.0 25.0Jr. College/trade
school/associate degree 5.3 9.3 0.0 17.5 2.8 20.0 12.1 10.2 5.9 12.1 7.0 8.3 4-year college graduate/BA 29.8 13.0 37.5 15.8 9.7 20.0 27.3 13.0 29.4 17.2 6.0 8.3
Postgraduate/Masters 14.0 6.5 12.5 5.3 6.9 5.0 13.6 15.7 11.8 6.9 6.0 8.3
WIAA Marion Winston Region 1 Selected Emp NnW Und Emp NnW Und Emp NnW Und Characteristics 18. Married Respondents 74.6 60.9 81.3 86.0 60.3 66.7 74.1 55.1 72.2 19. Sex Female 54.2 66.7 68.8 54.0 67.1 83.3 55.0 67.0 70.9
Male 45.8 33.3 31.3 46.0 32.9 16.7 45.0 33.0 29.1 20. Median age (years) 55 65 51.5 55 67 55 54 66 53 21. Ethnicity Hispanic 0.0 0.0 0.0 0.0 0.0 0.0 0.0 0.4 0.0
21b. Race White 96.6 84.1 93.8 92.0 95.9 83.3 88.5 84.3 87.3 African-American/Other 1.7 11.6 6.3 4.0 2.7 0.0 7.8 11.1 6.3
22. Last school grade
High Sch./less, no diploma 5.1 27.5 0.0 8.0 24.7 16.7 7.2 21.1 7.6 High School or GED 40.7 26.1 18.8 38.0 39.7 33.3 31.1 34.9 26.6
Some college, no degree 8.5 18.8 12.5 34.0 11.0 0.0 20.5 16.0 17.7 Jr. College/trade
school/associate degree 23.7 13.0 31.3 8.0 11.0 33.3 13.3 8.9 16.5
4-year college graduate/BA 15.3 7.3 37.5 10.0 5.5 16.7 19.6 9.4 25.3 Postgraduate/Masters 6.8 7.3 0.0 2.0 6.9 0.0 8.4 8.5 6.3
Emp – Employed Und – Underemployed NnW – Nonworkers Note: Rounding errors may be present.

CBER, UA 2013 Underemployment in Alabama WIAAs 36
Table 1.2 Underemployment Survey Results, Region 1 (Percent, continued) County/WIAA Colbert
Job Satisfaction and Employed Underemployed
Willingness to Train 23. Job Satisfaction CD D N S CS CD D N S CS
Overall Satisfaction 1.8 0.0 12.3 33.3 52.6 0.0 0.0 12.5 50.0 37.5Earnings 5.3 7.0 15.8 40.4 31.6 12.5 12.5 37.5 25.0 12.5
Retention 1.8 5.3 15.8 19.3 54.4 0.0 0.0 37.5 25.0 25.0Work 0.0 1.8 3.5 26.3 68.4 0.0 0.0 0.0 37.5 62.5
Hours 1.8 5.3 10.5 24.6 57.9 0.0 0.0 12.5 12.5 75.0Shift 5.3 3.5 12.3 14.0 64.9 0.0 0.0 0.0 12.5 87.5
Conditions 1.8 8.8 12.3 31.6 45.6 0.0 12.5 25.0 25.0 37.5Commuting Distance 0.0 5.3 8.8 17.5 68.4 0.0 0.0 12.5 12.5 75.0
24. Willingness to Train CU U N W CW CU U N W CW
For a better job 34.7 2.0 6.1 14.3 42.9 14.3 0.0 0.0 14.3 71.4If paid by workers 40.6 21.9 18.8 3.1 12.5 50.0 0.0 16.7 0.0 16.7
If co-paid by workers & Government 6.3 21.9 40.6 9.4 18.8 0.0 33.3 33.3 0.0 16.7If paid by Government 0.0 9.4 6.3 31.3 53.1 0.0 33.3 0.0 0.0 66.7
County/WIAA FranklinJob Satisfaction and
Employed Underemployed Willingness to Train 23. Job Satisfaction CD D N S CS CD D N S CS
Overall Satisfaction 3.5 7.0 15.8 33.3 40.4 0.0 20.0 30.0 20.0 30.0Earnings 14.0 8.8 22.8 17.5 35.1 35.0 15.0 25.0 10.0 15.0
Retention 3.5 3.5 7.0 22.8 61.4 5.0 5.0 20.0 30.0 40.0Work 1.8 1.8 10.5 22.8 63.2 0.0 5.0 25.0 35.0 35.0
Hours 5.3 0.0 5.3 10.5 79.0 5.0 0.0 5.0 20.0 70.0Shift 7.0 0.0 8.8 10.5 73.7 10.0 0.0 10.0 5.0 75.0
Conditions 3.5 1.8 14.0 29.8 50.9 5.0 0.0 25.0 40.0 30.0Commuting Distance 1.8 5.3 14.0 8.8 70.2 5.0 0.0 25.0 0.0 70.0
24. Willingness to Train CU U N W CW CU U N W CW
For a better job 20.0 6.7 24.4 11.1 35.6 6.7 6.7 20.0 13.3 46.7If paid by workers 33.3 27.8 13.9 11.1 5.6 21.4 35.7 14.3 7.1 14.3
If co-paid by workers & Government 22.2 8.3 30.6 8.3 27.8 14.3 0.0 35.7 14.3 28.6If paid by Government 2.8 5.6 13.9 13.9 63.9 21.4 0.0 0.0 0.0 78.6
County/WIAA LauderdaleJob Satisfaction and
Employed Underemployed Willingness to Train 23. Job Satisfaction CD D N S CS CD D N S CS
Overall Satisfaction 4.6 7.6 12.1 21.2 54.6 11.8 0.0 29.4 23.5 35.3Earnings 16.7 9.1 10.6 24.2 39.4 35.3 23.5 0.0 17.7 23.5
Retention 7.6 6.1 13.6 10.6 59.1 17.7 5.9 17.7 11.8 47.1Work 6.1 1.5 7.6 19.7 65.2 17.7 0.0 5.9 29.4 47.1
Hours 3.0 4.6 6.1 12.1 72.7 11.8 5.9 11.8 11.8 58.8Shift 6.1 4.6 10.6 16.7 62.1 5.9 5.9 5.9 17.7 64.7
Conditions 3.0 4.6 6.1 12.1 72.7 11.8 11.8 0.0 29.4 47.1Commuting Distance 6.1 4.6 15.2 15.2 59.1 11.8 5.9 17.7 11.8 52.9
24. Willingness to Train CU U N W CW CU U N W CW
For a better job 27.6 8.6 12.1 8.6 43.1 12.5 12.5 6.3 12.5 56.3If paid by workers 45.2 14.3 19.1 7.1 9.5 57.1 0.0 21.4 0.0 14.3
If co-paid by workers & Government 11.9 11.9 28.6 26.2 11.9 28.6 0.0 21.4 35.7 14.3If paid by Government 9.5 4.8 4.8 14.3 66.7 14.3 0.0 7.1 0.0 78.6
CD = Completely dissatisfied, D = Dissatisfied, N = Neither satisfied nor dissatisfied, S = Satisfied, and CS = Completely satisfied. CU = Completely unwilling, U =Unwilling, N= Neither willing nor unwilling, W = Willing, and CW = Completely Willing. Note: Rounding errors may be present.

2013 Underemployment in Alabama WIAAs CBER, UA 37
Table 1.2 Underemployment Survey Results, Region 1 (Percent, continued) County/WIAA Lawrence
Job Satisfaction and Employed Underemployed
Willingness to Train 23. Job Satisfaction CD D N S CS CD D N S CS
Overall Satisfaction 0.0 5.2 13.8 27.6 53.5 0.0 8.3 25.0 33.3 33.3Earnings 5.2 8.6 29.3 19.0 37.9 8.3 16.7 25.0 25.0 25.0
Retention 0.0 10.3 10.3 19.0 56.9 0.0 8.3 25.0 25.0 58.3Work 0.0 1.7 8.6 24.1 65.5 0.0 8.3 0.0 25.0 66.7
Hours 1.7 6.9 15.5 17.2 58.6 0.0 16.7 25.0 25.0 33.3Shift 1.7 1.7 6.9 6.9 82.8 0.0 0.0 8.3 16.7 75.0
Conditions 1.7 0.0 12.1 27.6 58.6 0.0 0.0 16.7 25.0 58.3Commuting Distance 3.5 5.2 8.6 12.1 70.7 0.0 8.3 8.3 16.7 66.7
24. Willingness to Train CU U N W CW CU U N W CW
For a better job 27.7 2.1 19.2 0.0 51.1 20.0 0.0 20.0 0.0 60.0If paid by workers 52.9 17.7 14.7 2.9 8.8 37.5 37.5 12.5 12.5 0.0
If co-paid by workers & Government 8.8 17.7 32.4 11.8 29.4 12.5 25.0 50.0 0.0 12.5If paid by Government 2.9 0.0 11.8 14.7 70.6 0.0 0.0 0.0 25.0 75.0
County/WIAA MarionJob Satisfaction and
Employed Underemployed Willingness to Train 23. Job Satisfaction CD D N S CS CD D N S CS
Overall Satisfaction 6.8 5.1 15.3 22.0 50.9 18.8 18.8 25.0 12.5 25.0Earnings 11.9 8.5 20.3 25.4 33.9 37.5 12.5 0.0 31.3 18.8
Retention 3.4 8.5 6.8 15.3 64.4 12.5 12.5 18.8 18.8 50.0Work 5.1 1.7 8.5 25.4 59.3 12.5 6.3 12.5 31.3 37.5
Hours 6.8 5.1 10.2 17.0 61.0 18.8 12.5 25.0 6.3 37.5Shift 5.1 6.8 5.1 15.3 67.8 12.5 12.5 6.3 6.3 62.5
Conditions 1.7 10.2 3.4 30.5 54.2 0.0 18.8 6.3 37.5 37.5Commuting Distance 1.7 1.7 13.6 13.6 69.5 6.3 0.0 12.5 12.5 68.8
24. Willingness to Train CU U N W CW CU U N W CW
For a better job 12.2 8.2 10.2 18.4 51.0 7.7 7.7 7.7 0.0 76.9If paid by workers 39.5 20.9 16.3 7.0 4.7 58.3 8.3 8.3 16.7 8.3
If co-paid by workers & Government 11.6 9.3 30.2 25.6 18.6 0.0 0.0 41.7 33.3 25.0If paid by Government 2.3 0.0 9.3 23.3 65.1 0.0 0.0 8.3 8.3 83.3
County/WIAA WinstonJob Satisfaction and
Employed Underemployed Willingness to Train 23. Job Satisfaction CD D N S CS CD D N S CS
Overall Satisfaction 8.0 4.0 18.0 28.0 42.0 50.0 0.0 16.7 0.0 33.3Earnings 6.0 16.0 26.0 20.0 32.0 16.7 0.0 50.0 0.0 33.3
Retention 6.0 4.0 16.0 28.0 46.0 16.7 0.0 0.0 0.0 66.7Work 0.0 0.0 18.0 20.0 60.0 33.3 0.0 50.0 0.0 16.7
Hours 6.0 6.0 26.0 16.0 46.0 33.3 0.0 33.3 0.0 33.3Shift 4.0 8.0 12.0 16.0 60.0 33.3 16.7 16.7 0.0 33.3
Conditions 2.0 2.0 18.0 28.0 50.0 0.0 16.7 33.3 0.0 50.0Commuting Distance 2.0 6.0 10.0 16.0 66.0 16.7 0.0 0.0 0.0 83.3
24. Willingness to Train CU U N W CW CU U N W CW
For a better job 12.5 7.5 27.5 12.5 40.0 100.0 0.0 0.0 0.0 0.0If paid by workers 57.1 22.9 5.7 5.7 5.7 25.0 0.0 25.0 0.0 50.0
If co-paid by workers & Government 20.0 14.3 34.3 11.4 17.1 0.0 0.0 0.0 25.0 75.0If paid by Government 8.6 2.9 8.6 17.1 57.1 100.0 0.0 0.0 0.0 0.0
CD = Completely dissatisfied, D = Dissatisfied, N = Neither satisfied nor dissatisfied, S = Satisfied, and CS = Completely satisfied. CU = Completely unwilling, U =Unwilling, N= Neither willing nor unwilling, W = Willing, and CW = Completely Willing. Note: Rounding errors may be present.

CBER, UA 2013 Underemployment in Alabama WIAAs 38
Table 1.2 Underemployment Survey Results, Region 1 (Percent, continued) County/WIAA Region 1
Job Satisfaction and Employed Underemployed
Willingness to Train 23. Job Satisfaction CD D N S CS CD D N S CS
Overall Satisfaction 4.0 4.9 14.4 27.4 49.3 10.1 10.1 25.3 22.8 31.7Earnings 10.1 9.5 20.5 24.5 35.2 27.9 15.2 17.7 19.0 20.3
Retention 3.8 6.3 11.5 18.7 57.4 8.9 6.3 20.3 20.3 46.8Work 2.3 1.4 9.2 23.1 63.7 6.3 3.8 12.7 29.1 46.8
Hours 4.6 4.6 12.7 17.0 61.1 10.1 6.3 16.5 13.9 53.2Shift 4.3 4.0 8.4 12.4 70.6 8.9 5.1 7.6 10.1 68.4
Conditions 2.3 5.2 11.8 27.7 53.0 3.8 8.9 15.2 30.4 41.8Commuting Distance 2.6 4.6 11.8 13.8 67.2 5.1 3.8 15.2 8.9 67.1
24. Willingness to Train CU U N W CW CU U N W CW
For a better job 22.9 5.9 16.0 10.8 44.1 10.8 6.2 12.3 7.7 61.5If paid by workers 44.6 20.7 14.9 6.3 7.7 48.3 15.5 10.3 8.6 8.6
If co-paid by workers & Government 13.5 13.5 32.4 16.2 20.3 13.8 6.9 34.5 19.0 22.4If paid by Government 4.5 3.6 9.0 18.9 63.1 3.5 0.0 6.9 12.1 77.6
CD = Completely dissatisfied, D = Dissatisfied, N = Neither satisfied nor dissatisfied, S = Satisfied, and CS = Completely satisfied. CU = Completely unwilling, U =Unwilling, N= Neither willing nor unwilling, W = Willing, and CW = Completely Willing. Note: Rounding errors may be present. Characteristics of the underemployed are not reported for Franklin, Marion and Winston counties because
they are statistically unreliable.

2013 Underemployment in Alabama WIAAs CBER, UA 39
Underemployment in Workforce Investment Advisory Area, Region 2
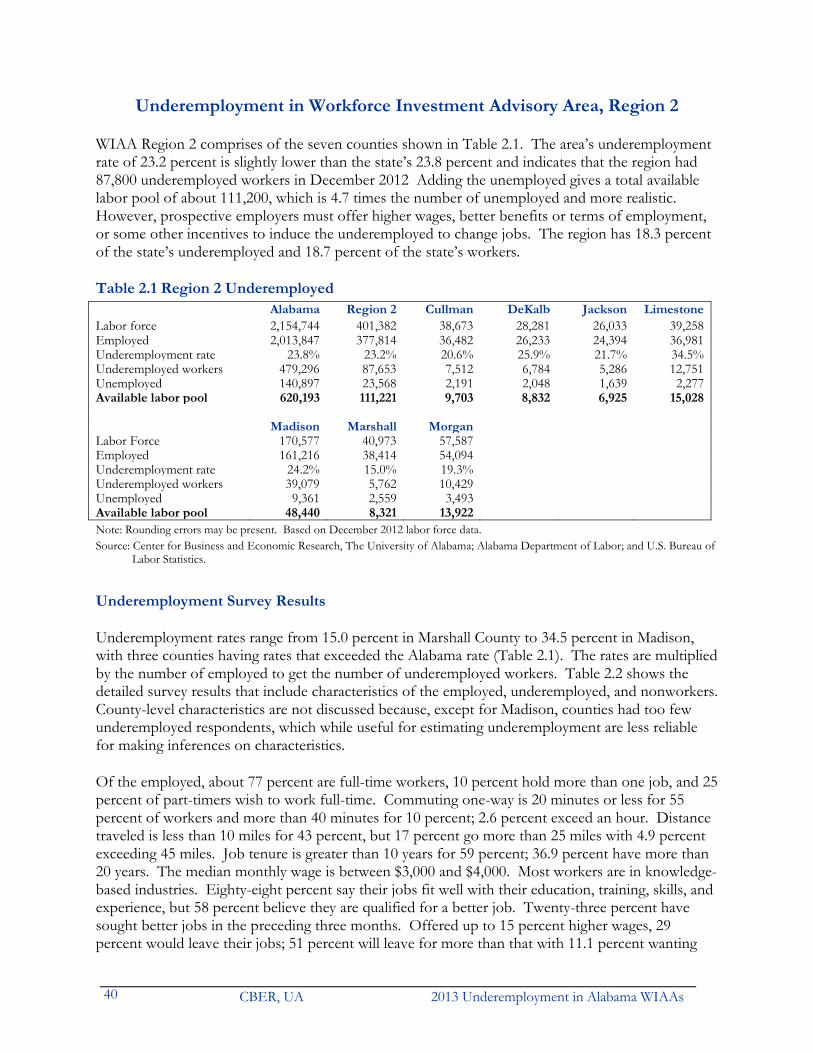
CBER, UA 2013 Underemployment in Alabama WIAAs 40
Underemployment in Workforce Investment Advisory Area, Region 2
WIAA Region 2 comprises of the seven counties shown in Table 2.1. The area’s underemployment rate of 23.2 percent is slightly lower than the state’s 23.8 percent and indicates that the region had 87,800 underemployed workers in December 2012 Adding the unemployed gives a total available labor pool of about 111,200, which is 4.7 times the number of unemployed and more realistic. However, prospective employers must offer higher wages, better benefits or terms of employment, or some other incentives to induce the underemployed to change jobs. The region has 18.3 percent of the state’s underemployed and 18.7 percent of the state’s workers.
Table 2.1 Region 2 Underemployed Alabama Region 2 Cullman DeKalb Jackson LimestoneLabor force 2,154,744 401,382 38,673 28,281 26,033 39,258Employed 2,013,847 377,814 36,482 26,233 24,394 36,981Underemployment rate 23.8% 23.2% 20.6% 25.9% 21.7% 34.5%Underemployed workers 479,296 87,653 7,512 6,784 5,286 12,751Unemployed 140,897 23,568 2,191 2,048 1,639 2,277Available labor pool 620,193 111,221 9,703 8,832 6,925 15,028 Madison Marshall Morgan Labor Force 170,577 40,973 57,587 Employed 161,216 38,414 54,094 Underemployment rate 24.2% 15.0% 19.3% Underemployed workers 39,079 5,762 10,429 Unemployed 9,361 2,559 3,493 Available labor pool 48,440 8,321 13,922 Note: Rounding errors may be present. Based on December 2012 labor force data. Source: Center for Business and Economic Research, The University of Alabama; Alabama Department of Labor; and U.S. Bureau of
Labor Statistics. Underemployment Survey Results
Underemployment rates range from 15.0 percent in Marshall County to 34.5 percent in Madison, with three counties having rates that exceeded the Alabama rate (Table 2.1). The rates are multiplied by the number of employed to get the number of underemployed workers. Table 2.2 shows the detailed survey results that include characteristics of the employed, underemployed, and nonworkers. County-level characteristics are not discussed because, except for Madison, counties had too few underemployed respondents, which while useful for estimating underemployment are less reliable for making inferences on characteristics.
Of the employed, about 77 percent are full-time workers, 10 percent hold more than one job, and 25 percent of part-timers wish to work full-time. Commuting one-way is 20 minutes or less for 55 percent of workers and more than 40 minutes for 10 percent; 2.6 percent exceed an hour. Distance traveled is less than 10 miles for 43 percent, but 17 percent go more than 25 miles with 4.9 percent exceeding 45 miles. Job tenure is greater than 10 years for 59 percent; 36.9 percent have more than 20 years. The median monthly wage is between $3,000 and $4,000. Most workers are in knowledge-based industries. Eighty-eight percent say their jobs fit well with their education, training, skills, and experience, but 58 percent believe they are qualified for a better job. Twenty-three percent have sought better jobs in the preceding three months. Offered up to 15 percent higher wages, 29 percent would leave their jobs; 51 percent will leave for more than that with 11.1 percent wanting

2013 Underemployment in Alabama WIAAs CBER, UA 41
more than 50 percent. For the higher-paying job, 40 percent would increase the one-way commute by up to 10 miles, but 25 percent would go 20 or more extra miles; 31 percent will increase one-way commute time by more than 20 minutes but 28 percent will only consider up to 10 minutes.
Among the underemployed, 58 percent work full-time, 11 percent hold more than one job, and 42 percent of part-time workers want full-time work. The one-way commute is 20 minutes or less for 57 percent and over 40 minutes for 9 percent—3.3 percent exceed an hour. Commute distance is less than 10 miles for 44 percent; 15.8 percent go more than 25 miles with 4.1 percent exceeding 45 miles. The underemployed have shorter job tenure; 50 percent have more than 10 years compared to 59 percent of employed. Fifty-seven percent earn up to $2,000 monthly versus 33 percent of the employed. More underemployed are in educational services and retail trade sectors. Seventy-five percent claim their jobs fit well with their education, training, skills, and experience, but 87 percent believe they are qualified for a better job and 35 percent have sought better jobs in the preceding three months. About 35 percent would leave current job for up to 15 percent more income, but 47 percent want more than 15 percent higher wages and 12 percent want more than a 50 percent raise. For the higher-paying job, 40 percent will commute up to 10 miles farther one-way, but 25 percent will go 20 or more miles. Twenty-eight percent will not consider driving more than 10 minutes for this new job while 37 percent are willing to increase the one-way commute by more than 20 minutes.
Most workers (76 percent) in Region 2 are satisfied or completely satisfied with their jobs but fewer underemployed workers (54 percent) feel the same way. Workers are more satisfied with their work shift and least satisfied with their earnings. The underemployed are most satisfied with their work shift and commute distance and much more dissatisfied with their earnings. Workers are generally willing to train for a new or better job, with the underemployed being much more willing. About 74 percent of the underemployed are willing or completely willing to train for a new or better job compared to 59 percent of all workers. The willingness to train is highest when the cost is fully borne by government and lowest when the trainee must pay the full costs. The underemployed are more willing to train except when they have to pay all the cost.
Of a total 1,357 respondents, 651 or 47 percent are employed. Lack of job opportunities, low wages at available jobs, owning a house in their area, and spousal or partner job and income are the main reasons given for being underemployed. Primary reasons for not working are retirement, disability or other health concerns, and social security limitations. Seventy-three percent of the employed, 55 percent of nonworkers, and 67 percent underemployed were married. Men were 47 percent of employed, 35 percent of nonworkers, and 40 percent of underemployed. The median age is 51 for employed, 50 underemployed, and 66 for nonworkers. Roughly 81 percent of the employed, 82 percent nonworkers, and 79 percent of underemployed are white; Hispanics are a tiny portion of respondents. African-Americans and other ethnicity groups constitute 14 percent of the employed, 11 percent of nonworkers, and 14 percent of underemployed.
Just three percent of the employed and one percent of the underemployed do not hold a high school diploma or equivalent, compared to 14 percent of nonworkers. Twenty-five percent of the employed, 27 percent of underemployed, and 14 percent of nonworkers hold a bachelor’s or higher degree. WIAA Region 2 has a very large and well-educated labor pool, about 111,200, that is willing to commute and is seeking higher wage jobs.

CBER, UA 2013 Underemployment in Alabama WIAAs 42
Table 2.2 Underemployment Survey Results, Region 2 (Percent) County/WIAA Cullman DeKalb Jackson Limestone
General Emp Und Emp Und Emp Und Emp Und
1. Percent of adults that are working full-time 72.7 38.5 79.3 73.3 82.8 91.7 82.8 75.0 2. Percent of part-timers who wish to work full-time 15.8 22.2 41.7 50.0 27.3 100.0 30.0 60.0 3. Percent of workers with more than one job 11.8 28.6 13.8 13.3 8.3 7.7 12.1 5.0 4. Average commute time (one-way) Up to 20 minutes 54.4 50.0 60.3 60.0 43.3 61.5 53.5 50.0
20 to 40 minutes 23.5 28.6 27.6 40.0 31.7 7.7 27.6 20.040 minutes to an hour 11.8 0.0 3.5 0.0 13.3 15.4 8.6 15.0
More than an hour 7.4 21.4 1.7 0.0 10.0 15.4 0.0 0.0 5. Commute distance Less than 10 miles 41.8 35.7 42.9 26.7 39.0 53.9 46.3 55.6
10 to 25 miles 28.4 21.4 44.6 66.7 20.3 7.7 38.9 16.725 to 45 miles 13.4 21.4 10.7 6.7 25.4 23.1 11.1 27.8
More than 45 miles 16.4 21.4 1.8 0.0 15.3 15.4 3.7 0.0 6. Occupation Management 10.3 7.1 12.1 6.7 11.7 0.0 12.1 15.0
Business/Financial Operations 8.8 21.4 3.5 6.7 5.0 0.0 5.2 5.0Computer/Mathematical 1.5 0.0 0.0 0.0 1.7 0.0 1.7 5.0
Architecture/Engineering 1.5 7.1 3.5 0.0 6.7 15.4 12.1 0.0Life/Physical/Social Science 1.5 0.0 1.7 0.0 0.0 0.0 0.0 0.0Community /Social Services 1.5 7.1 0.0 0.0 0.0 0.0 1.7 0.0
Legal 2.9 0.0 1.7 0.0 1.7 0.0 1.7 0.0Education/Training/Library 10.3 7.1 12.1 13.3 10.0 7.7 12.1 15.0
Arts/Design/Entertainment/Sports/Media 1.5 0.0 0.0 0.0 1.7 7.7 0.0 0.0Healthcare Practitioners/Technicians 5.9 7.1 8.6 0.0 3.3 7.7 5.2 10.0
Healthcare Support 2.9 0.0 3.5 0.0 5.0 0.0 8.6 20.0Protective Service 0.0 0.0 1.7 6.7 0.0 0.0 1.7 0.0
Food Preparation/Serving Related 0.0 0.0 5.2 6.7 5.0 7.7 0.0 0.0Building/Grounds Cleaning/Maintenance. 1.5 0.0 3.5 0.0 3.3 7.7 3.5 0.0
Personal Care/Service 5.9 7.1 5.2 6.7 1.7 0.0 1.7 0.0Sales and Related 8.8 0.0 6.9 6.7 6.7 0.0 5.2 5.0
Office/Administrative Support 2.9 0.0 1.7 0.0 6.7 0.0 3.5 0.0Farming/Fishing/Forestry 4.4 7.1 5.2 0.0 1.7 7.7 1.7 5.0
Construction/Extraction 2.9 7.1 6.9 13.3 6.7 7.7 0.0 0.0Installation/Maintenance/Repair 4.4 0.0 3.5 13.3 5.0 7.7 6.9 0.0
Production 2.9 0.0 5.2 13.3 3.3 7.7 3.5 5.0Transportation/Material Moving 2.9 0.0 1.7 0.0 3.3 7.7 1.7 5.0
other 14.7 21.4 6.9 6.7 10.0 7.7 10.3 10.0 7. Industry Agriculture/Forestry/Fishing/Hunting 7.4 7.1 6.9 0.0 3.3 7.7 3.5 5.0
Mining 0.0 0.0 0.0 0.0 0.0 0.0 0.0 0.0Utilities 0.0 0.0 3.5 0.0 3.3 0.0 6.9 0.0
Construction 5.9 0.0 3.5 6.7 5.0 7.7 5.2 5.0Manufacturing 5.9 0.0 15.5 26.7 15.0 7.7 10.3 5.0
Wholesale Trade 0.0 0.0 1.7 6.7 0.0 0.0 0.0 0.0Retail Trade 5.9 7.1 12.1 20.0 5.0 7.7 1.7 0.0
Transportation/Warehousing 2.9 7.1 1.7 0.0 5.0 0.0 3.5 0.0Information 0.0 0.0 0.0 0.0 1.7 0.0 1.7 0.0
Finance/Insurance 4.4 14.3 5.2 0.0 3.3 0.0 0.0 0.0Real Estate/Rental/Leasing 0.0 0.0 0.0 0.0 3.3 0.0 5.2 0.0
Professional/Scientific/Technical Services 4.4 7.1 1.7 6.7 5.0 15.4 5.2 0.0Management of Companies/Enterprises 1.5 0.0 3.5 0.0 0.0 0.0 0.0 0.0
Administrative/Support/Waste Management/Remediation 1.5 0.0 0.0 0.0 1.7 0.0 3.5 5.0Educational Services 13.2 14.3 13.8 13.3 3.3 7.7 12.1 15.0
Health Care/Social Assistance 13.2 14.3 12.1 0.0 3.3 15.4 15.5 35.0Arts/Entertainment/Recreation 2.9 0.0 1.7 0.0 1.7 7.7 1.7 0.0Accommodation/Food Services 4.4 0.0 5.2 6.7 3.3 0.0 0.0 0.0
Public Administration 5.9 0.0 3.5 13.3 5.0 7.7 6.9 10.0Other 7.4 21.4 3.5 0.0 3.3 0.0 10.3 20.0
Emp – Employed Und – Underemployed NnW – Nonworkers Note: Rounding errors may be present. Responses to the questions on occupation and industry should only be used for making comparisons between
the employed and the underemployed and not for indicating worker distribution by occupation or industry.

2013 Underemployment in Alabama WIAAs CBER, UA 43
Table 2.2 Underemployment Survey Results, Region 2 (Percent) County/WIAA Madison Marshall Morgan Region 2
General Emp Und Emp Und Emp Und Emp Und
1. Percent of adults that are working full-time 78.0 54.7 71.7 44.4 68.7 31.3 76.6 57.7 2. Percent of part-timers who wish to work full-time 28.3 44.8 5.9 20.0 26.9 45.5 25.2 42.2 3. Percent of workers with more than one job 8.3 9.4 10.0 11.1 10.8 6.3 10.0 10.6 4. Average commute time (one-way) Up to 20 minutes 55.7 60.9 63.3 44.4 55.4 56.3 55.3 57.0
20 to 40 minutes 34.9 28.1 20.0 44.4 31.3 37.5 30.3 28.540 minutes to an hour 3.8 3.1 11.7 11.1 9.6 6.3 7.4 6.0
More than an hour 0.4 0.0 3.3 0.0 2.4 0.0 2.6 3.3 5. Commute distance Less than 10 miles 39.8 42.6 55.9 33.3 46.3 56.3 43.1 43.8
10 to 25 miles 50.0 49.2 23.7 55.6 31.7 31.3 38.7 39.025 to 45 miles 7.5 3.3 15.3 11.1 18.3 12.5 12.5 11.6
More than 45 miles 0.8 1.6 5.1 0.0 3.7 0.0 4.9 4.1 6. Occupation Management 8.7 3.1 11.7 22.2 18.1 25.0 11.2 8.6
Business/Financial Operations 7.2 3.1 5.0 11.1 3.6 0.0 6.0 5.3Computer/Mathematical 4.6 3.1 0.0 0.0 2.4 6.3 2.6 2.7
Architecture/Engineering 8.3 3.1 5.0 0.0 8.4 0.0 7.1 3.3Life/Physical/Social Science 0.4 1.6 0.0 0.0 0.0 0.0 0.5 0.7Community /Social Services 0.4 0.0 5.0 0.0 2.4 0.0 1.2 0.7
Legal 2.3 0.0 1.7 0.0 2.4 6.3 2.2 0.7Education/Training/Library 6.4 10.9 5.0 0.0 7.2 6.3 8.1 9.9
Arts/Design/Entertainment/Sports/Media 4.2 0.0 3.3 0.0 2.4 6.3 2.6 4.6Healthcare Practitioners/Technicians 5.3 4.7 3.3 0.0 2.4 6.3 4.9 5.3
Healthcare Support 0.8 1.6 5.0 0.0 6.0 0.0 3.4 2.7Protective Service 0.8 1.6 1.7 0.0 2.4 6.3 1.1 2.0
Food Preparation/Serving Related 2.7 7.8 0.0 0.0 2.4 0.0 2.3 4.6Building/Grounds Cleaning/Maintenance. 3.4 4.7 0.0 0.0 1.2 6.3 2.6 3.3
Personal Care/Service 1.1 0.0 1.7 11.1 2.4 0.0 2.3 2.7Sales and Related 8.7 9.4 15.0 22.2 8.4 12.5 8.6 7.3
Office/Administrative Support 6.4 14.1 1.7 0.0 6.0 6.3 4.9 7.3Farming/Fishing/Forestry 0.0 0.0 0.0 0.0 0.0 0.0 1.2 1.3
Construction/Extraction 1.1 0.0 1.7 0.0 1.2 0.0 2.3 2.7Installation/Maintenance/Repair 1.9 0.0 6.7 11.1 6.0 6.3 4.0 4.0
Production 2.3 1.6 3.3 0.0 1.2 0.0 2.8 3.3Transportation/Material Moving 1.9 1.6 5.0 11.1 2.4 0.0 2.5 2.0
other 21.2 21.9 18.3 11.1 10.8 6.3 15.7 15.2 7. Industry Agriculture/Forestry/Fishing/Hunting 1.5 1.6 5.0 0.0 0.0 0.0 3.1 2.7
Mining 0.0 0.0 0.0 0.0 0.0 0.0 0.0 0.0Utilities 0.8 0.0 3.3 0.0 3.6 0.0 2.3 0.0
Construction 3.0 3.1 5.0 11.1 4.8 0.0 4.2 4.0Manufacturing 3.0 0.0 13.3 11.1 13.3 6.3 8.5 5.3
Wholesale Trade 0.8 0.0 0.0 0.0 0.0 0.0 0.5 0.7Retail Trade 9.1 12.5 11.7 22.2 6.0 12.5 7.8 10.6
Transportation/Warehousing 1.5 0.0 8.3 11.1 3.6 0.0 3.1 2.0Information 1.9 3.1 3.3 11.1 0.0 0.0 1.4 2.0
Finance/Insurance 1.5 0.0 1.7 11.1 1.2 0.0 2.2 2.0Real Estate/Rental/Leasing 1.5 0.0 3.3 0.0 1.2 0.0 1.8 0.0
Professional/Scientific/Technical Services 8.3 1.6 3.3 0.0 4.8 12.5 5.8 4.6Management of Companies/Enterprises 1.1 0.0 1.7 0.0 0.0 0.0 1.1 0.0
Administrative/Support/Waste Management/Remediation 1.9 3.1 1.7 0.0 3.6 0.0 2.0 2.0Educational Services 8.3 14.1 5.0 0.0 7.2 6.3 9.7 11.9
Health Care/Social Assistance 10.2 7.8 10.0 0.0 13.3 6.3 11.8 11.3Arts/Entertainment/Recreation 2.3 4.7 0.0 0.0 1.2 0.0 1.8 2.7Accommodation/Food Services 2.3 3.1 1.7 0.0 4.8 6.3 2.9 2.7
Public Administration 6.8 1.6 1.7 0.0 6.0 12.5 5.7 5.3Other 7.6 9.4 6.7 11.1 13.3 25.0 7.7 12.6
Emp – Employed Und – Underemployed NnW – Nonworkers Note: Rounding errors may be present. Responses to the questions on occupation and industry should only be used for making comparisons between
the employed and the underemployed and not for indicating worker distribution by occupation or industry.

CBER, UA 2013 Underemployment in Alabama WIAAs 44
Table 2.2 Underemployment Survey Results, Region 2 (Percent, continued)
County/WIAA Cullman DeKalb Jackson Limestone
Emp Und Emp Und Emp Und Emp Und
8. Years at current/primary job Less than a year 7.4 7.1 17.2 26.7 16.7 30.8 15.5 20.01 to 3 years 5.9 7.1 0.0 0.0 10.0 7.7 5.2 5.03 to 5 years 4.4 7.1 10.3 20.0 6.7 7.7 1.7 5.0
5 to 10 years 14.7 14.3 12.1 13.3 8.3 7.7 22.4 25.010 to 20 years 22.1 21.4 25.9 20.0 26.7 15.4 25.9 25.0
More than 20 years 41.2 35.7 34.5 20.0 31.7 30.8 27.6 20.0
9. Monthly wages Less than $500 10.3 21.4 5.2 0.0 6.7 7.7 5.2 10.0$500 up to $1,000 7.4 14.3 12.1 33.3 8.3 0.0 6.9 10.0
$1,000 up to $2,000 20.6 28.6 25.9 20.0 21.7 38.5 12.1 20.0$2,000 up to $3,000 17.7 7.1 24.1 33.3 10.0 7.7 20.7 30.0$3,000 up to $4,000 16.2 14.3 3.5 0.0 20.0 7.7 15.5 15.0$4,000 up to $6,000 8.8 7.1 12.1 6.7 8.3 15.4 22.4 15.0
More than $6,000 10.3 0.0 10.3 6.7 11.7 15.4 15.5 0.0Job Fitness 10. Percent of workers whose current job fits well with their education and training, skills, and experience 91.2 85.7 87.9 66.7 95.0 84.6 84.5 75.0 11. Percent of workers who believe they are qualified for a better job 52.9 85.7 55.2 66.7 55.0 84.6 62.1 100.0
Reasons: Education and training 88.9 91.7 96.9 100.0 81.8 81.8 86.1 95.0Skills 88.9 100.0 90.6 80.0 100.0 100.0 97.2 95.0
Experience 83.3 91.7 87.5 80.0 93.9 100.0 94.4 95.0 12. Additional income for which workers would leave current job
0 to 5% more 13.3 75.0 6.5 16.7 7.1 25.0 0.0 0.05 to 15% more 16.7 0.0 38.7 50.0 21.4 0.0 32.0 28.6
15 to 30% more 20.0 0.0 12.9 16.7 25.0 0.0 36.0 28.630 to 50% more 6.7 0.0 22.6 16.7 14.3 25.0 16.0 14.3
More than 50% more 20.0 25.0 9.7 0.0 10.7 25.0 0.0 0.0 *** Would not leave current job 20.0 0.0 9.7 0.0 21.4 25.0 12.0 14.3
13. Additional commute for new job 0 to 10 miles 49.1 50.0 24.5 23.1 37.3 33.3 37.7 33.3
10 to 20 miles 29.1 25.0 24.5 30.8 31.4 25.0 32.1 33.3more than 20 miles 16.4 8.3 51.0 46.2 27.5 41.7 26.4 33.3
14. Additional one-way commute time 0 to 10 minutes 29.1 8.3 18.4 23.1 29.4 16.7 22.6 22.2
10 to 20 minutes 41.8 58.3 34.7 30.8 45.1 41.7 37.7 22.2more than 20 minutes 25.5 25.0 46.9 46.2 21.6 41.7 37.7 55.6
15. Percent of workers who sought better job in past three months 12.7 33.3 8.2 15.4 8.3 8.3 26.4 55.6 Underemployment 16. Percent of workers who say they are currently underemployed
20.6 25.9 21.7
34.5
17. Reasons respondents give for being Und NnW Und NnW Und NnW Und NnW
A lack of job opportunities in their area 42.9 21.4 73.3 26.6 53.9 37.3 45.0 18.5The low wages at the available jobs 42.9 11.9 80.0 21.5 46.2 23.7 45.0 9.3
They live too far from jobs 35.7 11.9 20.0 22.8 53.9 27.1 15.0 11.1They are in school or undergoing training 0.0 2.4 6.7 3.8 0.0 6.8 0.0 3.7
Their spouse or partner has a really good job 7.1 11.9 40.0 8.9 0.0 8.5 20.0 13.0They are retired 28.6 71.4 6.7 68.4 15.4 52.5 15.0 83.3
Because of social security limitations 7.1 28.6 6.7 20.3 7.7 22.0 0.0 20.4Disability or other health concerns 7.1 46.4 0.0 51.9 7.7 52.5 10.0 31.5
Child care responsibilities 7.1 10.7 13.3 13.9 23.1 17.0 10.0 5.6They take care of someone other than a child 14.3 20.2 26.7 15.2 0.0 6.8 15.0 7.4
Other family or personal obligations 28.6 23.8 40.0 19.0 7.7 10.2 20.0 11.1Owning a house in your area 35.7 16.9 53.9 29.4 9.1 22.0 41.2 17.7
Something else 14.3 13.1 26.7 12.7 23.1 17.0 20.0 24.1
Emp – Employed Und – Underemployed NnW – Nonworkers Note: Rounding errors may be present.

2013 Underemployment in Alabama WIAAs CBER, UA 45
Table 2.2 Underemployment Survey Results, Region 2 (Percent, continued) County/WIAA Madison Marshall Morgan Region 2
Emp Und Emp Und Emp Und Emp Und
8. Years at current/primary job Less than a year 11.7 10.9 15.0 44.4 8.4 12.5 12.4 17.21 to 3 years 11.4 12.5 8.3 11.1 6.0 6.3 8.1 8.63 to 5 years 5.7 7.8 15.0 22.2 6.0 18.8 6.6 10.6
5 to 10 years 9.9 12.5 15.0 11.1 13.3 0.0 12.4 12.610 to 20 years 21.6 18.8 20.0 11.1 15.7 18.8 22.0 19.2
More than 20 years 39.0 37.5 25.0 0.0 47.0 37.5 36.9 30.5
9. Monthly wages Less than $500 6.1 17.2 6.7 33.3 9.6 12.5 6.9 14.6$500 up to $1,000 7.6 17.2 15.0 33.3 7.2 18.8 8.6 17.2
$1,000 up to $2,000 14.8 23.4 18.3 11.1 19.3 37.5 17.7 25.2$2,000 up to $3,000 12.9 10.9 15.0 0.0 15.7 18.8 15.4 15.2$3,000 up to $4,000 9.9 3.1 13.3 11.1 9.6 0.0 11.7 6.0 $4,000 up to $6,000 13.6 7.8 13.3 0.0 18.1 0.0 13.8 8.0
More than $6,000 25.8 15.6 13.3 0.0 10.8 0.0 17.5 8.6Job Fitness 10. Percent of workers whose current job fits well with their education and training, skills, and experience
86.4 71.9 81.7 55.6 92.8 87.5 88.0 74.8
11. Percent of workers who believe they are qualified for a better job
60.2 87.5 55.0 100.0 56.6 81.3 57.8 86.8
Reasons: Education and training 93.7 98.2 97.0 100.0 97.9 100.0 92.6 96.2Skills 96.2 96.4 93.9 88.9 97.9 100.0 95.5 95.4
Experience 91.8 92.9 84.9 66.7 97.9 100.0 91.2 91.6 12. Additional income for which workers would leave current job
0 to 5% more 7.8 7.4 7.7 0.0 2.6 0.0 6.8 12.35 to 15% more 20.9 25.9 15.4 0.0 15.8 14.3 22.2 22.8
15 to 30% more 30.2 22.2 26.9 0.0 26.3 28.6 26.7 21.130 to 50% more 8.5 7.4 11.5 50.0 21.1 28.6 12.7 14.0
More than 50% more 10.9 14.8 11.5 50.0 13.2 14.3 11.1 12.3 *** Would not leave current job 18.6 18.5 26.9 0.0 18.4 14.3 18.2 14.0
13. Additional commute for new job 0 to 10 miles 46.2 42.3 39.2 75.0 30.3 35.7 40.2 40.3
10 to 20 miles 35.2 36.5 33.3 25.0 31.8 42.9 32.3 33.3more than 20 miles 16.2 21.2 27.5 0.0 37.9 21.4 25.2 24.8
14. Additional one-way commute time 0 to 10 minutes 31.0 36.5 27.5 50.0 25.8 21.4 27.7 27.9
10 to 20 minutes 43.8 30.8 31.4 37.5 34.9 35.7 40.0 34.1more than 20 minutes 22.9 32.7 41.2 12.5 39.4 42.9 30.5 37.2
15. Percent of workers who sought better job in past three months
30.0 48.1 25.5 62.5 22.7 42.9 22.6 35.2
Underemployment 16. Percent of workers who say they are currently underemployed
24.2 15.0 19.3
23.2
17. Reasons respondents give for being Und NnW Und NnW Und NnW Und NnW
A lack of job opportunities in their area 43.8 20.3 77.8 21.9 50.0 13.2 48.3 21.4The low wages at the available jobs 40.6 11.4 66.7 17.8 50.0 9.9 48.3 13.9
They live too far from jobs 14.1 5.1 44.4 17.8 10.0 5.0 21.2 11.5They are in school or undergoing training 6.3 3.8 11.1 1.4 5.0 1.7 4.6 3.3
Their spouse or partner has a really good job 28.1 17.4 22.2 11.0 35.0 5.0 24.5 11.9They are retired 12.5 64.8 0.0 69.9 15.0 73.6 13.3 68.4
Because of social security limitations 3.1 14.0 22.2 21.9 10.0 23.1 7.3 20.0Disability or other health concerns 15.6 32.2 11.1 48.0 15.0 41.3 12.6 40.9
Child care responsibilities 29.7 14.8 22.2 11.0 20.0 7.4 21.9 12.0They take care of someone other than a child 23.4 9.8 11.1 11.0 5.0 10.7 14.1 11.5
Other family or personal obligations 34.4 13.1 33.3 11.0 20.0 10.7 17.9 14.0Owning a house in your area 22.0 15.4 66.7 17.5 25.0 17.0 31.3 18.3
Something else 28.1 23.7 11.1 20.6 20.0 22.3 23.8 20.1
Emp – Employed Und – Underemployed NnW – Nonworkers Note: Rounding errors may be present.

CBER, UA 2013 Underemployment in Alabama WIAAs 46
Table 2.2 Underemployment Survey Results, Region 2 (Percent, continued)
County/WIAA Cullman DeKalb Jackson Limestone
Selected Emp NnW Und Emp NnW Und Emp NnW Und Emp NnW UndCharacteristics 18. Married Respondents 73.5 53.6 85.7 75.9 54.4 60.0 76.7 54.2 61.5 81.0 53.7 75.0 19. Sex Female 67.7 61.9 64.3 50.0 60.8 46.7 51.7 69.5 38.5 48.3 68.5 60.0
Male 32.4 38.1 35.7 50.0 39.2 53.3 48.3 30.5 61.5 51.7 31.5 40.0 20. Median age (years) 53.5 68 58.5 51 64.5 50.0 52 60.5 51.0 49.0 68.5 55.0 21. Ethnicity Hispanic 0.0 1.2 0.0 1.7 0.0 0.0 0.0 1.7 0.0 0.0 1.9 0.0
21b. Race White 91.2 92.9 100.0 93.1 84.8 93.3 83.3 78.0 76.9 84.5 83.3 75.0African-American/Other 1.5 2.4 0.0 5.2 2.5 6.7 10.0 11.9 7.7 12.1 11.1 15.0
22. Last school grade
High Sch./less, no diploma 2.9 16.7 0.0 5.2 17.7 0.0 5.0 20.3 0.0 0.0 14.8 0.0High School or GED 26.5 39.3 7.1 34.5 45.6 26.7 26.7 42.4 30.8 24.1 37.0 15.0
Some college, no degree 14.7 10.7 7.1 22.4 13.9 33.3 16.7 13.6 15.4 15.5 14.8 15.0Jr. College/trade
school/associate degree 20.6 11.9 35.7 13.8 8.9 20.0 18.3 11.9 15.4 20.7 13.0 30.0
4-year college graduate/BA 22.1 14.3 28.6 6.9 6.3 6.7 25.0 3.4 38.5 25.9 7.4 30.0Postgraduate/Masters 13.2 7.1 21.4 17.2 5.1 13.3 8.3 6.8 0.0 13.8 13.0 10.0
County/WIAA Madison Marshall Morgan Region 2
Selected Emp NnW Und Emp NnW Und Emp NnW Und Emp NnW UndCharacteristics 18. Married Respondents 69.3 55.5 64.1 75.0 48.0 77.8 69.88 59.50 56.25 72.7 54.8 66.9 19. Sex Female 50.8 68.2 62.5 56.7 61.6 66.7 50.60 61.98 75.00 52.8 65.0 60.3
Male 49.2 31.8 37.5 43.3 38.4 33.3 49.40 38.02 25.00 47.2 35.0 39.7
20. Median age (years) 49.0 65.0 48.5 50.0 66.0 46.5 53.00 69.00 51.50 51 66 50
21. Ethnicity Hispanic 1.5 0.9 1.6 3.3 1.4 0.0 1.20 0.83 6.25 1.2 0.9 1.321b. Race White 68.9 74.2 68.8 96.7 89.0 100.0 87.95 84.30 87.50 81.1 81.9 79.5African-American/Other 24.3 19.9 23.4 0.0 2.7 0.0 7.22 8.26 6.25 13.8 10.8 13.9
22. Last school grade
High Sch./less, no diploma 2.3 8.9 3.1 6.7 16.4 0.0 0.00 12.40 0.00 2.8 13.6 1.3High School or GED 17.1 17.0 20.3 20.0 31.5 11.1 25.30 34.71 25.00 22.4 31.0 19.9
Some college, no degree 11.4 20.8 9.4 20.0 21.9 33.3 15.66 20.66 25.00 14.9 17.9 15.9Jr. College/trade
school/associate degree 9.9 13.1 12.5 10.0 12.3 0.0 20.48 8.26 18.75 14.4 11.5 17.9
4-year college graduate/BA 29.9 20.3 29.7 33.3 15.1 33.3 20.48 13.22 18.75 25.4 13.9 27.2Postgraduate/Masters 29.6 19.5 25.0 10.0 2.7 22.2 18.07 10.74 12.50 20.1 11.6 17.9
Emp – Employed Und – Underemployed NnW – Nonworkers Note: Rounding errors may be present.
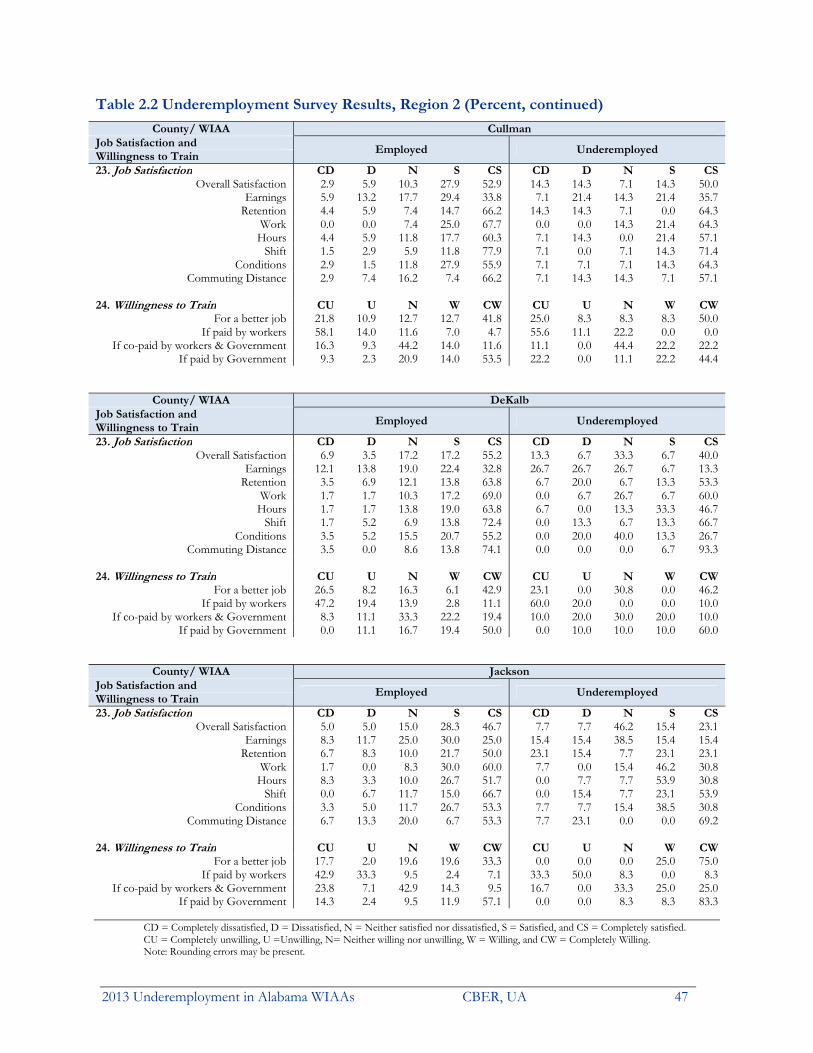
2013 Underemployment in Alabama WIAAs CBER, UA 47
Table 2.2 Underemployment Survey Results, Region 2 (Percent, continued)
County/ WIAA CullmanJob Satisfaction and
Employed Underemployed Willingness to Train 23. Job Satisfaction CD D N S CS CD D N S CS
Overall Satisfaction 2.9 5.9 10.3 27.9 52.9 14.3 14.3 7.1 14.3 50.0Earnings 5.9 13.2 17.7 29.4 33.8 7.1 21.4 14.3 21.4 35.7
Retention 4.4 5.9 7.4 14.7 66.2 14.3 14.3 7.1 0.0 64.3Work 0.0 0.0 7.4 25.0 67.7 0.0 0.0 14.3 21.4 64.3
Hours 4.4 5.9 11.8 17.7 60.3 7.1 14.3 0.0 21.4 57.1Shift 1.5 2.9 5.9 11.8 77.9 7.1 0.0 7.1 14.3 71.4
Conditions 2.9 1.5 11.8 27.9 55.9 7.1 7.1 7.1 14.3 64.3Commuting Distance 2.9 7.4 16.2 7.4 66.2 7.1 14.3 14.3 7.1 57.1
24. Willingness to Train CU U N W CW CU U N W CW
For a better job 21.8 10.9 12.7 12.7 41.8 25.0 8.3 8.3 8.3 50.0If paid by workers 58.1 14.0 11.6 7.0 4.7 55.6 11.1 22.2 0.0 0.0
If co-paid by workers & Government 16.3 9.3 44.2 14.0 11.6 11.1 0.0 44.4 22.2 22.2If paid by Government 9.3 2.3 20.9 14.0 53.5 22.2 0.0 11.1 22.2 44.4
County/ WIAA DeKalbJob Satisfaction and
Employed Underemployed Willingness to Train 23. Job Satisfaction CD D N S CS CD D N S CS
Overall Satisfaction 6.9 3.5 17.2 17.2 55.2 13.3 6.7 33.3 6.7 40.0Earnings 12.1 13.8 19.0 22.4 32.8 26.7 26.7 26.7 6.7 13.3
Retention 3.5 6.9 12.1 13.8 63.8 6.7 20.0 6.7 13.3 53.3Work 1.7 1.7 10.3 17.2 69.0 0.0 6.7 26.7 6.7 60.0
Hours 1.7 1.7 13.8 19.0 63.8 6.7 0.0 13.3 33.3 46.7Shift 1.7 5.2 6.9 13.8 72.4 0.0 13.3 6.7 13.3 66.7
Conditions 3.5 5.2 15.5 20.7 55.2 0.0 20.0 40.0 13.3 26.7Commuting Distance 3.5 0.0 8.6 13.8 74.1 0.0 0.0 0.0 6.7 93.3
24. Willingness to Train CU U N W CW CU U N W CW
For a better job 26.5 8.2 16.3 6.1 42.9 23.1 0.0 30.8 0.0 46.2If paid by workers 47.2 19.4 13.9 2.8 11.1 60.0 20.0 0.0 0.0 10.0
If co-paid by workers & Government 8.3 11.1 33.3 22.2 19.4 10.0 20.0 30.0 20.0 10.0If paid by Government 0.0 11.1 16.7 19.4 50.0 0.0 10.0 10.0 10.0 60.0
County/ WIAA JacksonJob Satisfaction and
Employed Underemployed Willingness to Train 23. Job Satisfaction CD D N S CS CD D N S CS
Overall Satisfaction 5.0 5.0 15.0 28.3 46.7 7.7 7.7 46.2 15.4 23.1Earnings 8.3 11.7 25.0 30.0 25.0 15.4 15.4 38.5 15.4 15.4
Retention 6.7 8.3 10.0 21.7 50.0 23.1 15.4 7.7 23.1 23.1Work 1.7 0.0 8.3 30.0 60.0 7.7 0.0 15.4 46.2 30.8
Hours 8.3 3.3 10.0 26.7 51.7 0.0 7.7 7.7 53.9 30.8Shift 0.0 6.7 11.7 15.0 66.7 0.0 15.4 7.7 23.1 53.9
Conditions 3.3 5.0 11.7 26.7 53.3 7.7 7.7 15.4 38.5 30.8Commuting Distance 6.7 13.3 20.0 6.7 53.3 7.7 23.1 0.0 0.0 69.2
24. Willingness to Train CU U N W CW CU U N W CW
For a better job 17.7 2.0 19.6 19.6 33.3 0.0 0.0 0.0 25.0 75.0If paid by workers 42.9 33.3 9.5 2.4 7.1 33.3 50.0 8.3 0.0 8.3
If co-paid by workers & Government 23.8 7.1 42.9 14.3 9.5 16.7 0.0 33.3 25.0 25.0If paid by Government 14.3 2.4 9.5 11.9 57.1 0.0 0.0 8.3 8.3 83.3
CD = Completely dissatisfied, D = Dissatisfied, N = Neither satisfied nor dissatisfied, S = Satisfied, and CS = Completely satisfied. CU = Completely unwilling, U =Unwilling, N= Neither willing nor unwilling, W = Willing, and CW = Completely Willing. Note: Rounding errors may be present.

CBER, UA 2013 Underemployment in Alabama WIAAs 48
Table 2.2 Underemployment Survey Results, Region 2 (Percent, continued)
County/ WIAA LimestoneJob Satisfaction and Employed UnderemployedWillingness to Train 23. Job Satisfaction CD D N S CS CD D N S CS
Overall Satisfaction 3.5 1.7 17.2 37.9 39.7 10.0 5.0 30.0 25.0 30.0Earnings 8.6 8.6 22.4 22.4 37.9 20.0 15.0 40.0 15.0 10.0
Retention 8.6 6.9 8.6 24.1 50.0 15.0 15.0 5.0 5.0 45.0Work 1.7 1.7 13.8 25.9 56.9 5.0 5.0 15.0 20.0 55.0
Hours 6.9 6.9 8.6 13.8 63.8 15.0 10.0 0.0 15.0 60.0Shift 0.0 1.7 6.9 19.0 72.4 0.0 5.0 20.0 5.0 70.0
Conditions 3.5 3.5 12.1 34.5 46.6 10.0 0.0 15.0 30.0 45.0Commuting Distance 1.7 8.6 12.1 12.1 65.5 0.0 20.0 5.0 10.0 65.0
24. Willingness to Train CU U N W CW CU U N W CW
For a better job 13.2 3.8 15.1 13.2 54.7 22.2 0.0 0.0 5.6 72.2If paid by workers 45.7 19.6 23.9 2.2 8.7 57.1 21.4 14.3 0.0 7.1
If co-paid by workers & Government 17.4 6.5 41.3 8.7 21.7 28.6 0.0 42.9 21.4 7.1If paid by Government 10.9 4.4 19.6 10.9 52.2 14.3 7.1 0.0 7.1 71.4
County/ WIAA MadisonJob Satisfaction and
Employed Underemployed Willingness to Train 23. Job Satisfaction CD D N S CS CD D N S CS
Overall Satisfaction 4.2 4.2 17.1 23.9 50.8 10.9 9.4 25.0 18.8 35.9Earnings 8.3 7.2 19.3 28.0 36.0 28.1 9.4 23.4 20.3 18.8
Retention 4.6 4.9 12.1 17.1 59.5 9.4 10.9 18.8 18.8 45.3Work 1.1 4.6 12.5 20.5 61.4 4.7 6.3 10.9 21.9 56.3
Hours 3.4 4.2 10.6 20.8 60.6 12.5 7.8 9.4 21.9 48.4Shift 2.7 2.3 5.7 16.7 72.4 7.8 3.1 9.4 21.9 56.3
Conditions 1.9 3.4 11.0 23.9 59.1 4.7 4.7 17.2 28.1 45.3Commuting Distance 2.7 1.5 10.6 17.8 67.1 3.1 1.6 14.1 14.1 67.2
24. Willingness to Train CU U N W CW CU U N W CW
For a better job 20.0 1.9 11.4 15.2 51.0 13.5 0.0 1.9 7.7 75.0If paid by workers 43.5 23.8 13.7 6.0 7.7 55.6 17.8 13.3 4.4 8.9
If co-paid by workers & Government 10.1 16.1 33.9 19.1 17.9 8.9 20.0 33.3 11.1 26.7If paid by Government 6.6 1.8 10.7 19.6 58.3 4.4 0.0 4.4 15.6 75.6
County/ WIAA MarshallJob Satisfaction and
Employed Underemployed Willingness to Train 23. Job Satisfaction CD D N S CS CD D N S CS
Overall Satisfaction 3.3 5.0 13.3 16.7 61.7 11.1 11.1 33.3 22.2 22.2Earnings 5.0 8.3 21.7 21.7 41.7 33.3 11.1 33.3 11.1 11.1
Retention 5.0 0.0 10.0 11.7 73.3 11.1 0.0 0.0 0.0 66.7Work 1.7 0.0 10.0 18.3 70.0 11.1 0.0 22.2 44.4 22.2
Hours 1.7 6.7 10.0 11.7 70.0 0.0 22.2 22.2 0.0 55.6Shift 3.3 5.0 5.0 16.7 70.0 11.1 0.0 22.2 22.2 44.4
Conditions 3.3 0.0 13.3 21.7 61.7 0.0 0.0 44.4 22.2 33.3Commuting Distance 8.3 0.0 10.0 13.3 68.3 11.1 0.0 11.1 33.3 44.4
24. Willingness to Train CU U N W CW CU U N W CW
For a better job 29.4 9.8 15.7 3.9 39.2 0.0 25.0 0.0 0.0 62.5If paid by workers 41.7 25.0 16.7 5.6 11.1 25.0 37.5 12.5 25.0 0.0
If co-paid by workers & Government 16.7 13.9 30.6 19.4 19.4 25.0 12.5 0.0 50.0 12.5If paid by Government 2.8 5.6 22.2 8.3 55.6 12.5 0.0 12.5 0.0 50.0
CD = Completely dissatisfied, D = Dissatisfied, N = Neither satisfied nor dissatisfied, S = Satisfied, and CS = Completely satisfied. CU = Completely unwilling, U =Unwilling, N= Neither willing nor unwilling, W = Willing, and CW = Completely Willing. Note: Rounding errors may be present.

2013 Underemployment in Alabama WIAAs CBER, UA 49
Table 2.2 Underemployment Survey Results, Region 2 (Percent, continued)
County/ WIAA MorganJob Satisfaction and
Employed Underemployed Willingness to Train 23. Job Satisfaction CD D N S CS CD D N S CS
Overall Satisfaction 3.6 10.8 7.2 24.1 54.2 6.3 12.5 12.5 25.0 43.8Earnings 10.8 13.3 21.7 19.3 34.9 31.3 18.8 18.8 12.5 18.8
Retention 7.2 7.2 9.6 13.3 61.5 12.5 6.3 6.3 6.3 56.3Work 3.6 2.4 6.0 19.3 68.7 6.3 6.3 6.3 18.8 62.5
Hours 4.8 2.4 13.3 19.3 60.2 18.8 12.5 6.3 25.0 37.5Shift 2.4 2.4 7.2 16.9 71.1 12.5 0.0 12.5 12.5 62.5
Conditions 3.6 7.2 7.2 25.3 56.6 12.5 6.3 6.3 25.0 50.0Commuting Distance 4.8 3.6 9.6 18.1 62.7 6.3 12.5 18.8 18.8 43.8
24. Willingness to Train CU U N W CW CU U N W CW
For a better job 21.2 6.1 16.7 12.1 42.4 7.1 7.1 28.6 7.1 50.0If paid by workers 42.3 28.9 11.5 0.0 7.7 46.2 23.1 7.7 0.0 15.4
If co-paid by workers & Government 19.2 15.4 30.8 17.3 17.3 7.7 23.1 30.8 15.4 23.1If paid by Government 7.7 1.9 13.5 13.5 63.5 7.7 0.0 0.0 15.4 76.9
County/ WIAA Region 2Job Satisfaction and
Employed Underemployed Willingness to Train 23. Job Satisfaction CD D N S CS CD D N S CS
Overall Satisfaction 4.2 5.1 14.6 24.7 51.5 10.6 9.3 25.8 18.5 35.8Earnings 8.5 9.8 20.4 25.7 35.0 24.5 14.6 26.5 16.6 17.9
Retention 5.4 5.5 10.6 16.6 60.4 11.9 11.9 12.6 12.6 48.3Work 1.5 2.5 10.5 21.7 63.9 4.6 4.6 13.9 23.2 53.6
Hours 4.2 4.3 11.1 19.2 61.1 10.6 9.3 8.0 23.8 48.3Shift 2.0 3.2 6.6 16.0 72.0 6.0 4.6 11.3 17.2 60.3
Conditions 2.8 3.7 11.4 25.2 56.7 6.0 6.0 18.5 25.8 43.7Commuting Distance 3.8 3.8 11.8 14.4 65.8 4.0 8.0 10.6 12.6 64.9
24. Willingness to Train CU U N W CW CU U N W CW
For a better job 20.9 4.9 14.2 12.9 45.8 14.0 3.1 7.8 7.8 65.9If paid by workers 45.2 23.6 14.2 4.3 8.0 50.5 23.4 11.7 3.6 8.1
If co-paid by workers & Government 14.4 12.8 35.9 17.0 17.0 13.5 13.5 32.4 18.9 20.7If paid by Government 7.3 3.3 14.4 15.6 56.7 7.2 1.8 5.4 12.6 70.3
CD = Completely dissatisfied, D = Dissatisfied, N = Neither satisfied nor dissatisfied, S = Satisfied, and CS = Completely satisfied. CU = Completely unwilling, U =Unwilling, N= Neither willing nor unwilling, W = Willing, and CW = Completely Willing. Note: Rounding errors may be present.

CBER, UA 2013 Underemployment in Alabama WIAAs 50
Underemployment in Workforce Investment Advisory Area, Region 3

2013 Underemployment in Alabama WIAAs CBER, UA 51
Underemployment in Workforce Investment Advisory Area, Region 3
WIAA Region 3 comprises of the seven counties shown in Table 3.1. The area’s underemployment rate of 24.0 percent—slightly higher than the state’s 23.8 percent—means that about 28,300 employed residents were underemployed in December 2012. Adding the unemployed gives a total available labor pool of about 36,800, which is 4.3 times the number of unemployed and is more realistic as a measure of the available labor in the area. Employers can offer the underemployed higher wages, better benefits or terms of employment, or some other incentives to induce them to change jobs. The region has 5.9 percent of the state’s underemployed and 5.8 percent of workers.
Table 3.1 Region 3 Underemployed Alabama Region 3 Bibb Fayette Greene Hale Lamar Pickens TuscaloosaLabor Force 2,154,744 126,196 9,005 6,426 3,049 5,700 5,416 7,584 89,016Employed 2,013,847 117,701 8,386 5,941 2,683 5,100 5,010 6,983 83,598Underemployment rate 23.8% 24.0% 19.2% 16.4% 27.5% 23.1% 28.0% 21.1% 31.3%Underemployed 479,296 28,295 1,613 974 736 1,177 1,403 1,470 26,124Unemployed 140,897 8,495 619 485 366 600 406 601 5,418Available labor pool 620,193 36,790 2,232 1,459 1,102 1,777 1,809 2,071 31,542
Note: Rounding errors may be present. Based on December 2012 labor force data. Source: Center for Business and Economic Research, The University of Alabama; Alabama Department of Labor; and U.S. Bureau of
Labor Statistics. Underemployment Survey Results
Underemployment rates ranged from 16.4 percent in Fayette County to 31.3 percent in Tuscaloosa (Table 3.1) and three counties had rates that exceeded the Alabama rate. Multiplying the rates by the number of employed yields the number of underemployed workers. Table 3.2 shows the detailed underemployment survey results that include characteristics of the employed, underemployed, and nonworkers. Except for rates and their implications for labor availability, detailed county-level results are not discussed because county sample sizes are sufficient for underemployment estimation but insufficient for making reliable inferences on characteristics.
About 75 percent of employed area residents work full-time, 12 percent hold more than one job and 38 percent of part-time workers wish to work full-time. Forty-nine percent commute less than 20 minutes one-way, but 20.9 percent take more than 40 minutes with 4.3 percent exceeding an hour. The one-way commute is less than 10 miles for 41 percent of workers; 32 percent travel more than 25 miles and 7.8 percent go beyond 45 miles. About 53 percent have 10 or more years job tenure and 27 percent have more than 20 years. The median monthly wage is about $2,000 and most of the employed work in the health care and social assistance, educational services, and manufacturing sectors. Eighty-five percent of workers say their jobs fit well with their education, training, skills, and experience, but 66 percent believe they are qualified for a better job. Twenty-two percent have sought better jobs in the preceding three months. About 29 percent would leave their current jobs if offered up to 15 percent higher income, 57 percent will leave for more than 15 percent higher wages, and 14 percent want more than a 50 percent wage increase. For the new higher-paying job, 35 percent are willing to increase the one-way commute by up to 10 miles but 32 percent will go extra 20 miles or more; 36 percent will increase the one-way commute by more than 20 minutes while 28 percent will not consider adding more than 10 minutes.

CBER, UA 2013 Underemployment in Alabama WIAAs 52
Among the underemployed, 59 percent are full-time, 16 percent hold more than one job, and 55 percent of part-time workers would like full-time work. Fifty percent have less than a 20-minute one-way commute, but 19 percent take more than 40 minutes. The one-way commute is less than 10 miles for 43 percent and 22 percent travel more than 25 miles, with four percent exceeding 45 miles. The underemployed have shorter job tenure; 44 percent have worked for 10 years or more compared to 53 percent of the employed. The median monthly wage is between $1,000 and $2,000, but 59 percent of the underemployed make $2,000 or less compared to 47 percent of employed. The distribution across occupations and industry is somewhat similar for both groups except that the underemployed are over-represented in the retail trade sector. Seventy-one percent report that their jobs fit well with their education, training, skills, and experience. However, 89 percent believe they are qualified for a better job. Thirty-eight percent have sought better jobs in the preceding three months. If offered up to 15 percent higher income, 28 percent would leave current job, 59 percent would leave for more than 15 percent higher wages—15.2 percent want more than 50 percent higher wages. Twenty-seven percent are willing to add up to 10 miles to the one-way commute for the higher-paying job, but 35 percent are prepared to add 20 miles or more. About 39 percent are willing to increase the one-way commute by more than 20 minutes for this new job while 22 percent will not consider driving more than 10 minutes.
Responses for overall job satisfaction and various aspects of the job show that most workers in Region 3 are satisfied or completely satisfied with their jobs, but the underemployed feel less so (41 percent versus 72 percent). Workers are most satisfied with the work they do and least satisfied with the earnings they receive; the same applies to the underemployed. Workers are generally willing to train for a new or better job, with the underemployed being much more willing. About 78 percent of the underemployed are willing or completely willing to train for a new or better job versus 59 percent of all workers. The willingness to train is strongly influenced by who pays for the cost of training. It is highest when the cost is fully borne by government and lowest when the trainee must pay the full costs. The underemployed are more willing to train even if they have to pay all the cost.
Of the 994 respondents, 416 or 42 percent are employed. Lack of job opportunities in their area, low wages at available jobs, living too far from jobs, other family or personal obligations, and owning a house in their area are the primary reasons given for being underemployed. The main reasons for not working are retirement, disability or other health concerns, and social security limitations. Sixty-five percent of employed, 50 percent nonworkers, and 63 percent underemployed are married. Men made up 41 percent employed, 32 percent nonworkers, and 44 percent of the underemployed. The median age of employed and the underemployed is 52 and for nonworkers is 65. Seventy-one percent of the employed are white, compared to 61 percent underemployed and 62 percent nonworkers. Hispanics were a very small portion of the employed and jobless respondents. African-Americans and other ethnic groups made up 27 percent of employed, 33 percent of nonworkers, and 36 percent of the underemployed.
Four percent of employed, five percent of underemployed and 18 percent of nonworkers do not hold a high school diploma or equivalent. Twenty-eight percent employed and 33 percent underemployed hold bachelor’s or higher degrees compared to 13 percent of nonworkers. WIAA Region 3 has a 36,800-person educated labor pool that is willing to commute and is seeking higher paying jobs.

2013 Underemployment in Alabama WIAAs CBER, UA 53
Table 3.2 Underemployment Survey Results, Region 3 (Percent) County/WIAA Bibb Fayette Greene Hale
General Emp Und Emp Und Emp Und Emp Und
1. Percent of adults that are working full-time 80.0 70.0 81.7 88.9 74.5 50.0 69.4 64.3 2. Percent of part-timers who wish to work full-time 54.6 33.3 36.4 100.0 53.9 71.4 30.0 16.7 3. Percent of workers with more than one job 11.5 20.0 3.3 10.0 13.7 14.3 12.3 6.7 4. Average commute time (one-way) Up to 20 minutes 25.0 20.0 52.5 70.0 49.0 35.7 50.8 40.0
20 to 40 minutes 40.4 30.0 16.4 10.0 33.3 28.6 29.2 60.040 minutes to an hour 19.2 30.0 23.0 20.0 15.7 35.7 15.4 0.0
More than an hour 7.7 0.0 4.9 0.0 2.0 0.0 1.5 0.0 5. Commute distance Less than 10 miles 20.4 22.2 54.1 70.0 39.2 21.4 39.1 33.3
10 to 25 miles 26.5 22.2 13.1 10.0 25.5 35.7 28.1 53.325 to 45 miles 36.7 44.4 23.0 20.0 29.4 35.7 23.4 13.3
More than 45 miles 12.2 0.0 8.2 0.0 5.9 7.1 7.8 0.0 6. Occupation Management 11.5 0.0 8.2 20.0 11.8 14.3 15.4 13.3
Business/Financial Operations 5.8 8.3 6.6 0.0 2.0 0.0 4.6 0.0Computer/Mathematical 1.9 0.0 1.6 0.0 2.0 7.1 0.0 0.0
Architecture/Engineering 3.9 0.0 0.0 0.0 0.0 0.0 0.0 0.0Life/Physical/Social Science 0.0 0.0 0.0 0.0 0.0 0.0 0.0 0.0Community /Social Services 1.9 10.0 3.3 0.0 0.0 0.0 4.6 0.0
Legal 1.9 10.0 3.3 0.0 0.0 0.0 1.5 6.7Education/Training/Library 7.7 0.0 8.2 0.0 7.8 14.3 18.5 33.3
Arts/Design/Entertainment/Sports/Media 1.9 10.0 0.0 0.0 0.0 0.0 0.0 0.0Healthcare Practitioners/Technicians 3.9 0.0 4.9 0.0 0.0 0.0 4.6 0.0
Healthcare Support 1.9 0.0 9.8 0.0 7.8 14.3 4.6 6.7Protective Service 0.0 8.3 0.0 0.0 2.0 0.0 0.0 0.0
Food Preparation/Serving Related 1.9 0.0 3.3 10.0 15.7 21.4 3.1 6.7Building/Grounds Cleaning/Maintenance. 5.8 0.0 4.9 10.0 5.9 7.1 0.0 0.0
Personal Care/Service 1.9 0.0 0.0 0.0 3.9 0.0 4.6 6.7Sales and Related 7.7 20.0 11.5 30.0 9.8 0.0 1.5 0.0
Office/Administrative Support 11.5 0.0 3.3 8.3 3.9 0.0 9.2 20.0Farming/Fishing/Forestry 1.9 0.0 3.3 0.0 5.9 0.0 6.2 0.0
Construction/Extraction 1.9 10.0 1.6 0.0 0.0 0.0 1.5 0.0Installation/Maintenance/Repair 5.8 20.0 6.6 10.0 2.0 0.0 1.5 0.0
Production 7.7 0.0 1.6 0.0 7.8 7.1 1.5 0.0Transportation/Material Moving 1.9 0.0 4.9 0.0 0.0 0.0 6.2 0.0
other 9.6 20.0 13.1 20.0 11.8 0.0 10.8 6.7 7. Industry Agriculture/Forestry/Fishing/Hunting 1.9 0.0 4.9 0.0 5.9 7.1 9.2 0.0
Mining 0.0 0.0 3.3 0.0 0.0 0.0 1.5 0.0Utilities 1.9 0.0 1.6 10.0 2.0 0.0 3.1 0.0
Construction 1.9 10.0 4.9 0.0 0.0 0.0 0.0 0.0Manufacturing 25.0 10.0 13.1 0.0 5.9 14.3 4.6 0.0
Wholesale Trade 0.0 0.0 0.0 0.0 0.0 0.0 0.0 0.0Retail Trade 11.5 20.0 14.8 40.0 3.9 7.1 1.5 0.0
Transportation/Warehousing 1.9 0.0 1.6 0.0 5.9 0.0 3.1 0.0Information 0.0 0.0 1.6 10.0 0.0 0.0 0.0 0.0
Finance/Insurance 9.6 0.0 0.0 0.0 7.8 7.1 6.2 0.0Real Estate/Rental/Leasing 0.0 0.0 1.6 0.0 0.0 0.0 1.5 0.0
Professional/Scientific/Technical Services 3.9 0.0 0.0 0.0 0.0 0.0 3.1 6.7Management of Companies/Enterprises 0.0 0.0 0.0 0.0 2.0 0.0 0.0 0.0
Administrative/Support/Waste Management/Remediation 5.8 10.0 3.3 0.0 2.0 0.0 0.0 0.0Educational Services 13.5 20.0 11.5 0.0 11.8 21.4 26.2 53.3
Health Care/Social Assistance 7.7 10.0 19.7 10.0 11.8 21.4 16.9 13.3Arts/Entertainment/Recreation 0.0 0.0 3.8 0.0 0.0 0.0 1.5 0.0Accommodation/Food Services 3.9 10.0 0.0 0.0 11.8 14.3 3.1 0.0
Public Administration 1.9 0.0 3.3 0.0 5.9 0.0 4.6 6.7Other 3.9 10.0 6.6 10.0 5.9 0.0 7.7 6.7
Emp – Employed Und – Underemployed NnW – Nonworkers Note: Rounding errors may be present. Responses to the questions on occupation and industry should only be used for making comparisons between
the employed and the underemployed and not for indicating worker distribution by occupation or industry.

CBER, UA 2013 Underemployment in Alabama WIAAs 54
Table 3.2 Underemployment Survey Results, Region 3 (Percent)
County/WIAA Lamar Pickens Tuscaloosa Region 3
General Emp Und Emp Und Emp Und Emp Und
1. Percent of adults that are working full-time 77.6 78.6 81.1 63.6 65.0 40.0 74.8 58.8 2. Percent of part-timers who wish to work full-time 25.0 66.7 41.7 60.0 35.7 53.3 38.3 54.8 3. Percent of workers with more than one job 22.0 21.4 14.0 16.7 11.3 20.0 12.3 16.0 4. Average commute time (one-way) Up to 20 minutes 50.0 50.0 42.1 41.7 63.8 72.0 48.8 50.0
20 to 40 minutes 22.0 21.4 36.8 33.3 21.3 20.0 27.9 29.040 minutes to an hour 18.0 21.4 17.5 25.0 10.0 8.0 16.6 18.0
More than an hour 8.0 7.1 3.5 0.0 3.8 0.0 4.3 1.0 5. Commute distance Less than 10 miles 51.0 35.7 22.8 41.7 53.2 64.0 41.0 43.4
10 to 25 miles 18.4 35.7 38.6 33.3 30.4 32.0 26.1 33.325 to 45 miles 20.4 21.4 31.6 16.7 11.4 0.0 24.2 18.2
More than 45 miles 10.2 7.1 7.0 8.3 5.1 4.0 7.8 4.0 6. Occupation Management 8.0 7.1 14.0 8.3 11.3 4.0 11.5 9.0
Business/Financial Operations 12.0 21.4 1.8 8.3 6.3 0.0 5.5 4.0Computer/Mathematical 0.0 0.0 0.0 0.0 0.0 0.0 0.7 1.0
Architecture/Engineering 2.0 0.0 1.8 0.0 1.3 0.0 1.2 0.0Life/Physical/Social Science 2.0 0.0 1.8 8.3 1.3 0.0 0.7 1.0Community /Social Services 4.0 0.0 5.3 0.0 1.3 4.0 2.9 2.0
Legal 2.0 0.0 1.8 8.3 2.5 4.0 1.9 3.0Education/Training/Library 4.0 0.0 5.3 0.0 12.5 12.0 9.6 11.0
Arts/Design/Entertainment/Sports/Media 0.0 0.0 0.0 0.0 1.3 0.0 0.5 0.0Healthcare Practitioners/Technicians 4.0 7.1 1.8 0.0 5.0 0.0 3.6 2.0
Healthcare Support 8.0 7.1 7.0 0.0 5.0 8.0 6.3 6.0Protective Service 2.0 0.0 1.8 0.0 2.5 4.0 1.2 1.0
Food Preparation/Serving Related 4.0 7.1 1.8 0.0 1.3 0.0 4.1 6.0Building/Grounds Cleaning/Maintenance. 4.0 0.0 7.0 8.3 2.5 4.0 4.1 4.0
Personal Care/Service 6.0 0.0 1.8 0.0 2.5 0.0 2.9 1.0Sales and Related 2.0 7.1 7.0 8.3 7.5 4.0 6.7 8.0
Office/Administrative Support 2.0 0.0 8.8 8.3 3.8 0.0 6.0 4.0Farming/Fishing/Forestry 2.0 0.0 1.8 0.0 1.3 4.0 3.1 2.0
Construction/Extraction 4.0 0.0 1.8 8.3 0.0 0.0 1.4 2.0Installation/Maintenance/Repair 8.0 21.4 3.5 8.3 5.0 0.0 4.6 7.0
Production 2.0 0.0 7.0 8.3 3.8 4.0 4.3 4.0Transportation/Material Moving 2.0 0.0 8.8 8.3 5.0 12.0 4.3 4.0
other 16.0 21.4 8.8 8.3 17.5 36.0 12.7 18.0 7. Industry Agriculture/Forestry/Fishing/Hunting 10.5 16.7 1.3 4.0 5.8 4.0
Mining 8.0 0.0 0.0 0.0 2.5 0.0 1.2 0.0Utilities 0.0 0.0 0.0 0.0 1.3 0.0 1.7 2.0
Construction 2.0 7.1 5.3 8.3 5.0 4.0 3.6 3.0Manufacturing 8.0 0.0 14.0 8.3 5.0 4.0 11.1 8.0
Wholesale Trade 14.0 21.4 1.8 0.0 1.3 0.0 0.5 0.0Retail Trade 0.0 0.0 3.5 0.0 8.8 12.0 7.2 11.0
Transportation/Warehousing 6.0 7.1 3.5 0.0 1.3 4.0 2.4 1.0Information 0.0 0.0 0.0 0.0 0.0 0.0 0.2 1.0
Finance/Insurance 0.0 0.0 5.3 8.3 2.5 0.0 4.3 2.0Real Estate/Rental/Leasing 2.0 0.0 0.0 0.0 1.3 0.0 0.7 0.0
Professional/Scientific/Technical Services 0.0 0.0 1.8 8.3 2.5 4.0 1.9 3.0Management of Companies/Enterprises 2.0 0.0 0.0 0.0 5.0 0.0 1.4 0.0
Administrative/Support/Waste Management/Remediation 2.0 0.0 0.0 0.0 0.0 0.0 1.4 1.0Educational Services 0.0 0.0 10.5 0.0 20.0 20.0 15.1 19.0
Health Care/Social Assistance 8.0 7.1 15.8 8.3 20.0 16.0 16.6 15.0Arts/Entertainment/Recreation 22.0 21.4 0.0 0.0 0.0 0.0 0.2 0.0Accommodation/Food Services 0.0 0.0 3.5 8.3 3.8 8.0 4.1 8.0
Public Administration 4.0 14.3 3.5 0.0 2.5 0.0 4.1 2.0Other 8.0 7.1 7.0 25.0 5.0 4.0 6.0 8.0
Emp – Employed Und – Underemployed NnW – Nonworkers Note: Rounding errors may be present. Responses to the questions on occupation and industry should only be used for making comparisons between
the employed and the underemployed and not for indicating worker distribution by occupation or industry.
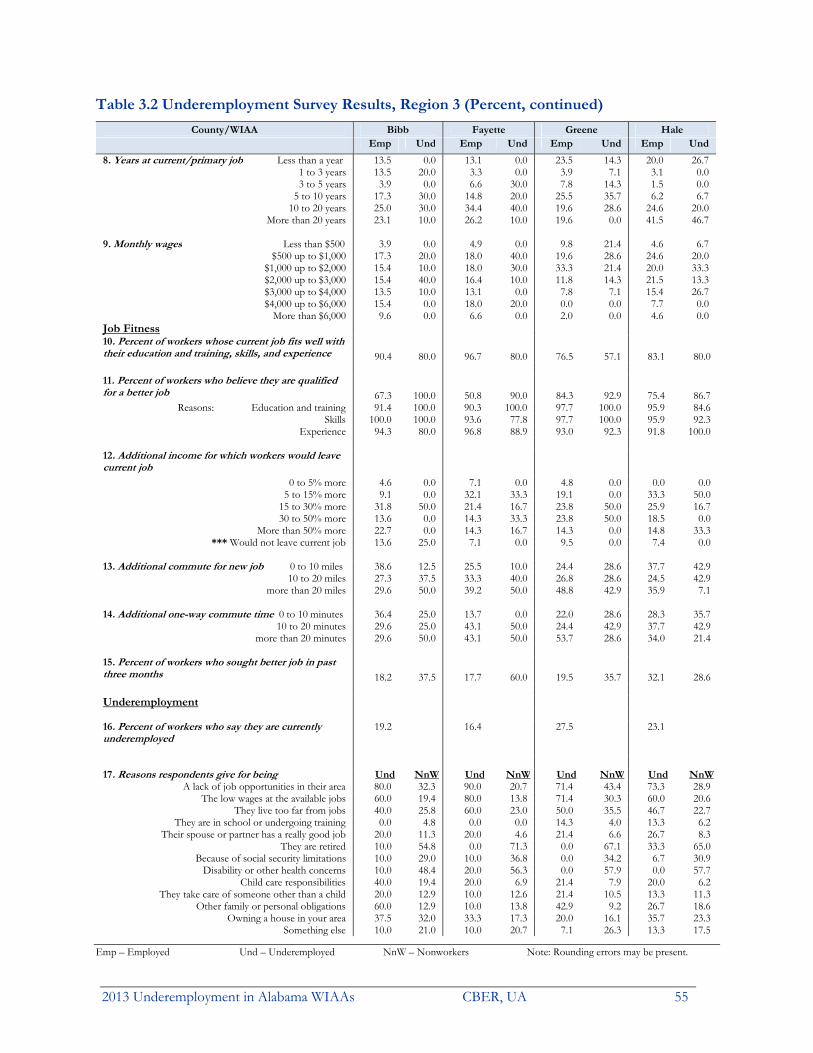
2013 Underemployment in Alabama WIAAs CBER, UA 55
Table 3.2 Underemployment Survey Results, Region 3 (Percent, continued) County/WIAA Bibb Fayette Greene Hale
Emp Und Emp Und Emp Und Emp Und
8. Years at current/primary job Less than a year 13.5 0.0 13.1 0.0 23.5 14.3 20.0 26.71 to 3 years 13.5 20.0 3.3 0.0 3.9 7.1 3.1 0.03 to 5 years 3.9 0.0 6.6 30.0 7.8 14.3 1.5 0.0
5 to 10 years 17.3 30.0 14.8 20.0 25.5 35.7 6.2 6.710 to 20 years 25.0 30.0 34.4 40.0 19.6 28.6 24.6 20.0
More than 20 years 23.1 10.0 26.2 10.0 19.6 0.0 41.5 46.7
9. Monthly wages Less than $500 3.9 0.0 4.9 0.0 9.8 21.4 4.6 6.7$500 up to $1,000 17.3 20.0 18.0 40.0 19.6 28.6 24.6 20.0
$1,000 up to $2,000 15.4 10.0 18.0 30.0 33.3 21.4 20.0 33.3$2,000 up to $3,000 15.4 40.0 16.4 10.0 11.8 14.3 21.5 13.3$3,000 up to $4,000 13.5 10.0 13.1 0.0 7.8 7.1 15.4 26.7$4,000 up to $6,000 15.4 0.0 18.0 20.0 0.0 0.0 7.7 0.0
More than $6,000 9.6 0.0 6.6 0.0 2.0 0.0 4.6 0.0Job Fitness 10. Percent of workers whose current job fits well with their education and training, skills, and experience 90.4 80.0 96.7 80.0 76.5 57.1 83.1 80.0 11. Percent of workers who believe they are qualified for a better job 67.3 100.0 50.8 90.0 84.3 92.9 75.4 86.7
Reasons: Education and training 91.4 100.0 90.3 100.0 97.7 100.0 95.9 84.6Skills 100.0 100.0 93.6 77.8 97.7 100.0 95.9 92.3
Experience 94.3 80.0 96.8 88.9 93.0 92.3 91.8 100.0 12. Additional income for which workers would leave current job
0 to 5% more 4.6 0.0 7.1 0.0 4.8 0.0 0.0 0.05 to 15% more 9.1 0.0 32.1 33.3 19.1 0.0 33.3 50.0
15 to 30% more 31.8 50.0 21.4 16.7 23.8 50.0 25.9 16.730 to 50% more 13.6 0.0 14.3 33.3 23.8 50.0 18.5 0.0
More than 50% more 22.7 0.0 14.3 16.7 14.3 0.0 14.8 33.3 *** Would not leave current job 13.6 25.0 7.1 0.0 9.5 0.0 7.4 0.0
13. Additional commute for new job 0 to 10 miles 38.6 12.5 25.5 10.0 24.4 28.6 37.7 42.9
10 to 20 miles 27.3 37.5 33.3 40.0 26.8 28.6 24.5 42.9more than 20 miles 29.6 50.0 39.2 50.0 48.8 42.9 35.9 7.1
14. Additional one-way commute time 0 to 10 minutes 36.4 25.0 13.7 0.0 22.0 28.6 28.3 35.7
10 to 20 minutes 29.6 25.0 43.1 50.0 24.4 42.9 37.7 42.9more than 20 minutes 29.6 50.0 43.1 50.0 53.7 28.6 34.0 21.4
15. Percent of workers who sought better job in past three months 18.2 37.5 17.7 60.0 19.5 35.7 32.1 28.6 Underemployment 16. Percent of workers who say they are currently underemployed
19.2
16.4 27.5
23.1
17. Reasons respondents give for being Und NnW Und NnW Und NnW Und NnW
A lack of job opportunities in their area 80.0 32.3 90.0 20.7 71.4 43.4 73.3 28.9The low wages at the available jobs 60.0 19.4 80.0 13.8 71.4 30.3 60.0 20.6
They live too far from jobs 40.0 25.8 60.0 23.0 50.0 35.5 46.7 22.7They are in school or undergoing training 0.0 4.8 0.0 0.0 14.3 4.0 13.3 6.2
Their spouse or partner has a really good job 20.0 11.3 20.0 4.6 21.4 6.6 26.7 8.3They are retired 10.0 54.8 0.0 71.3 0.0 67.1 33.3 65.0
Because of social security limitations 10.0 29.0 10.0 36.8 0.0 34.2 6.7 30.9Disability or other health concerns 10.0 48.4 20.0 56.3 0.0 57.9 0.0 57.7
Child care responsibilities 40.0 19.4 20.0 6.9 21.4 7.9 20.0 6.2They take care of someone other than a child 20.0 12.9 10.0 12.6 21.4 10.5 13.3 11.3
Other family or personal obligations 60.0 12.9 10.0 13.8 42.9 9.2 26.7 18.6Owning a house in your area 37.5 32.0 33.3 17.3 20.0 16.1 35.7 23.3
Something else 10.0 21.0 10.0 20.7 7.1 26.3 13.3 17.5
Emp – Employed Und – Underemployed NnW – Nonworkers Note: Rounding errors may be present.

CBER, UA 2013 Underemployment in Alabama WIAAs 56
Table 3.2 Underemployment Survey Results, Region 3 (Percent, continued) County/WIAA Lamar Pickens Tuscaloosa Region 3
Emp Und Emp Und Emp Und Emp Und
8. Years at current/primary job Less than a year 14.0 14.3 14.0 16.7 23.8 36.0 17.8 19.01 to 3 years 6.0 7.1 17.5 33.3 6.3 8.0 7.5 10.03 to 5 years 16.0 21.4 7.0 0.0 5.0 12.0 6.5 11.0
5 to 10 years 10.0 7.1 12.3 8.3 8.8 8.0 13.0 15.010 to 20 years 24.0 35.7 28.1 33.3 22.5 16.0 25.5 27.0
More than 20 years 26.0 14.3 17.5 8.3 31.3 20.0 27.2 17.0
9. Monthly wages Less than $500 8.0 7.1 10.5 16.7 6.3 8.0 6.7 9.0$500 up to $1,000 8.0 14.3 5.3 8.3 15.0 20.0 15.6 21.0
$1,000 up to $2,000 30.0 42.9 31.6 33.3 25.0 28.0 24.5 29.0$2,000 up to $3,000 14.0 21.4 14.0 16.7 16.3 24.0 15.9 20.0$3,000 up to $4,000 10.0 0.0 12.3 8.3 13.8 8.0 12.5 9.0$4,000 up to $6,000 12.0 7.1 7.0 8.3 8.8 4.0 9.9 5.0
More than $6,000 8.0 0.0 8.8 8.3 10.0 0.0 7.9 7.0Job Fitness 10. Percent of workers whose current job fits well with their education and training, skills, and experience
86.0 71.4 80.7 66.7 83.8 68.0 85.3 71.0
11. Percent of workers who believe they are qualified for a better job
62.0 92.9 57.9 91.7 67.5 80.0 66.4 89.0
Reasons: Education and training 90.3 92.3 90.9 81.8 90.7 95.0 92.4 93.3Skills 96.8 100.0 84.9 90.9 92.6 95.0 95.3 94.4
Experience 93.6 100.0 91.7 90.9 92.6 90.0 92.4 92.1 12. Additional income for which workers would leave current job
0 to 5% more 4.4 0.0 3.6 0.0 9.1 14.3 5.2 4.45 to 15% more 17.4 50.0 28.6 16.7 20.5 14.3 23.3 23.9
15 to 30% more 21.7 16.7 32.1 33.3 34.1 28.6 28.0 28.330 to 50% more 17.4 16.7 7.1 16.7 13.6 7.1 15.0 15.2
More than 50% more 21.7 16.7 7.1 0.0 9.1 21.4 14.0 15.2 *** Would not leave current job 13.0 0.0 17.9 33.3 11.4 14.3 11.4 10.9
. 13. Additional commute for new job 0 to 10 miles 38.1 35.7 42.9 20.0 35.7 27.3 34.9 27.2
10 to 20 miles 33.3 21.4 26.5 30.0 38.6 36.4 30.6 33.7more than 20 miles 28.6 42.9 26.5 40.0 22.9 27.3 32.3 34.8
14. Additional one-way commute time 0 to 10 minutes 33.3 21.4 28.6 10.0 31.4 22.7 27.7 21.7
10 to 20 minutes 23.8 28.6 42.9 40.0 40.0 36.4 35.4 38.0more than 20 minutes 42.9 50.0 26.5 40.0 28.6 40.9 36.0 39.1
15. Percent of workers who sought better job in past three months
23.8 50.0 16.3 30.0 24.3 31.8 22.0 38.0
Underemployment 16. Percent of workers who say they are currently underemployed
28.0 21.1
31.3
24.0
17. Reasons respondents give for being Und NnW Und NnW Und NnW Und NnW
A lack of job opportunities in their area 92.9 26.7 75.0 34.3 52.0 23.8 73.0 29.4The low wages at the available jobs 78.6 23.8 33.3 22.4 64.0 14.3 64.0 20.6
They live too far from jobs 71.4 34.3 50.0 32.8 24.0 10.7 46.0 26.3They are in school or undergoing training 7.1 2.9 16.7 1.5 12.0 1.2 10.0 2.9
Their spouse or partner has a really good job 0.0 10.5 8.3 4.5 28.0 13.1 19.0 8.5They are retired 0.0 65.7 8.3 59.7 24.0 71.4 13.0 65.6
Because of social security limitations 7.1 34.3 25.0 28.4 8.0 16.7 9.0 30.3Disability or other health concerns 7.1 56.2 25.0 46.3 4.0 41.7 8.0 52.6
Child care responsibilities 50.0 10.5 16.7 4.5 20.0 7.1 26.0 8.7They take care of someone other than a child 21.4 10.5 8.3 10.5 12.0 10.7 15.0 11.3
Other family or personal obligations 50.0 7.6 16.7 19.4 32.0 15.5 34.0 13.7Owning a house in your area 66.7 21.8 28.6 23.6 23.8 21.2 33.3 21.8
Something else 7.1 16.2 25.0 16.4 12.0 27.4 12.0 20.6
Emp – Employed Und – Underemployed NnW – Nonworkers Note: Rounding errors may be present.
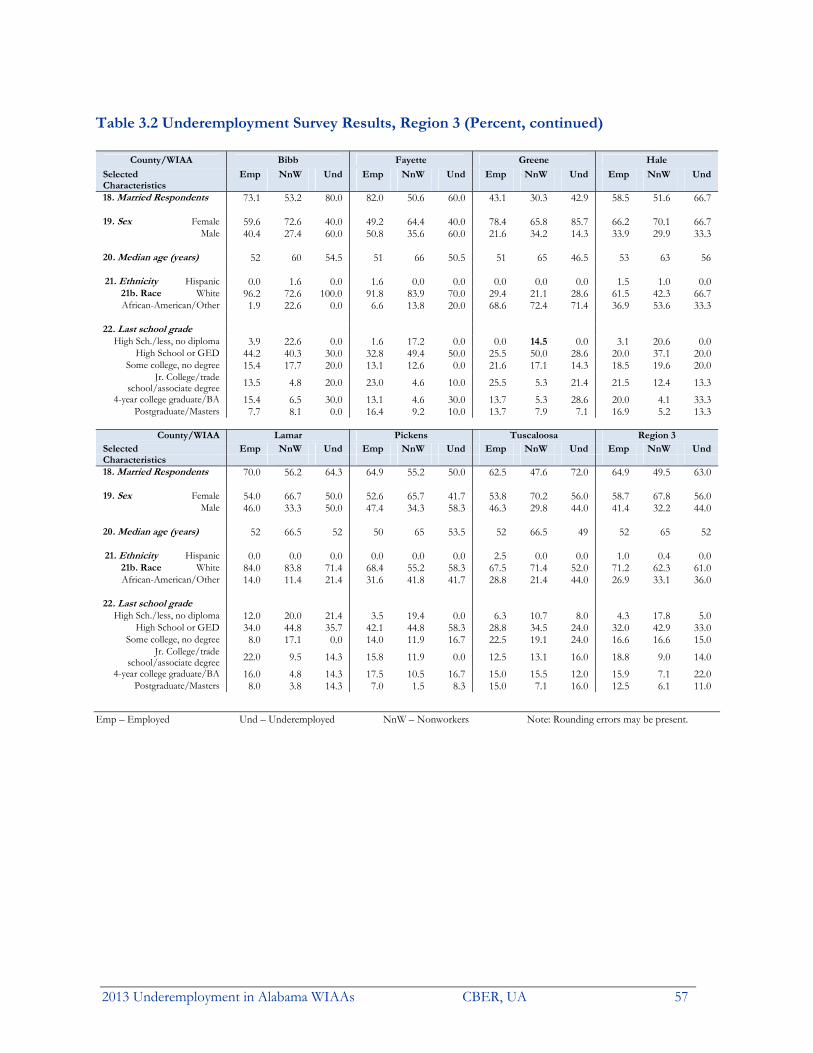
2013 Underemployment in Alabama WIAAs CBER, UA 57
Table 3.2 Underemployment Survey Results, Region 3 (Percent, continued)
County/WIAA Bibb Fayette Greene Hale
Selected Emp NnW Und Emp NnW Und Emp NnW Und Emp NnW UndCharacteristics 18. Married Respondents 73.1 53.2 80.0 82.0 50.6 60.0 43.1 30.3 42.9 58.5 51.6 66.7 19. Sex Female 59.6 72.6 40.0 49.2 64.4 40.0 78.4 65.8 85.7 66.2 70.1 66.7
Male 40.4 27.4 60.0 50.8 35.6 60.0 21.6 34.2 14.3 33.9 29.9 33.3 20. Median age (years) 52 60 54.5 51 66 50.5 51 65 46.5 53 63 56 21. Ethnicity Hispanic 0.0 1.6 0.0 1.6 0.0 0.0 0.0 0.0 0.0 1.5 1.0 0.0
21b. Race White 96.2 72.6 100.0 91.8 83.9 70.0 29.4 21.1 28.6 61.5 42.3 66.7African-American/Other 1.9 22.6 0.0 6.6 13.8 20.0 68.6 72.4 71.4 36.9 53.6 33.3
22. Last school grade
High Sch./less, no diploma 3.9 22.6 0.0 1.6 17.2 0.0 0.0 14.5 0.0 3.1 20.6 0.0High School or GED 44.2 40.3 30.0 32.8 49.4 50.0 25.5 50.0 28.6 20.0 37.1 20.0
Some college, no degree 15.4 17.7 20.0 13.1 12.6 0.0 21.6 17.1 14.3 18.5 19.6 20.0Jr. College/trade
school/associate degree 13.5 4.8 20.0 23.0 4.6 10.0 25.5 5.3 21.4 21.5 12.4 13.3 4-year college graduate/BA 15.4 6.5 30.0 13.1 4.6 30.0 13.7 5.3 28.6 20.0 4.1 33.3
Postgraduate/Masters 7.7 8.1 0.0 16.4 9.2 10.0 13.7 7.9 7.1 16.9 5.2 13.3
County/WIAA Lamar Pickens Tuscaloosa Region 3Selected Emp NnW Und Emp NnW Und Emp NnW Und Emp NnW UndCharacteristics 18. Married Respondents 70.0 56.2 64.3 64.9 55.2 50.0 62.5 47.6 72.0 64.9 49.5 63.0 19. Sex Female 54.0 66.7 50.0 52.6 65.7 41.7 53.8 70.2 56.0 58.7 67.8 56.0
Male 46.0 33.3 50.0 47.4 34.3 58.3 46.3 29.8 44.0 41.4 32.2 44.0 20. Median age (years) 52 66.5 52 50 65 53.5 52 66.5 49 52 65 52 21. Ethnicity Hispanic 0.0 0.0 0.0 0.0 0.0 0.0 2.5 0.0 0.0 1.0 0.4 0.0
21b. Race White 84.0 83.8 71.4 68.4 55.2 58.3 67.5 71.4 52.0 71.2 62.3 61.0African-American/Other 14.0 11.4 21.4 31.6 41.8 41.7 28.8 21.4 44.0 26.9 33.1 36.0
22. Last school grade
High Sch./less, no diploma 12.0 20.0 21.4 3.5 19.4 0.0 6.3 10.7 8.0 4.3 17.8 5.0High School or GED 34.0 44.8 35.7 42.1 44.8 58.3 28.8 34.5 24.0 32.0 42.9 33.0
Some college, no degree 8.0 17.1 0.0 14.0 11.9 16.7 22.5 19.1 24.0 16.6 16.6 15.0Jr. College/trade
school/associate degree 22.0 9.5 14.3 15.8 11.9 0.0 12.5 13.1 16.0 18.8 9.0 14.0 4-year college graduate/BA 16.0 4.8 14.3 17.5 10.5 16.7 15.0 15.5 12.0 15.9 7.1 22.0
Postgraduate/Masters 8.0 3.8 14.3 7.0 1.5 8.3 15.0 7.1 16.0 12.5 6.1 11.0
Emp – Employed Und – Underemployed NnW – Nonworkers Note: Rounding errors may be present.

CBER, UA 2013 Underemployment in Alabama WIAAs 58
Table 3.2 Underemployment Survey Results, Region 3 (Percent, continued)
County/ WIAA BibbJob Satisfaction and
Employed Underemployed Willingness to Train 23. Job Satisfaction CD D N S CS CD D N S CS
Overall Satisfaction 3.9 7.7 15.4 21.2 51.9 10.0 20.0 50.0 10.0 10.0Earnings 9.6 9.6 23.1 21.2 36.5 20.0 20.0 50.0 10.0 0.0
Retention 3.9 1.9 13.5 21.2 57.7 10.0 0.0 20.0 20.0 40.0Work 0.0 0.0 9.6 19.2 71.2 0.0 0.0 30.0 40.0 30.0
Hours 5.8 3.9 11.5 17.3 61.5 10.0 10.0 30.0 10.0 40.0Shift 1.9 7.7 3.9 19.2 67.3 10.0 20.0 0.0 50.0 20.0
Conditions 0.0 1.9 11.5 26.9 59.6 0.0 10.0 30.0 30.0 30.0Commuting Distance 5.8 7.7 19.2 21.2 46.2 30.0 10.0 20.0 20.0 20.0
24. Willingness to Train CU U N W CW CU U N W CW
For a better job 13.6 9.1 27.3 11.4 36.4 12.5 0.0 0.0 25.0 62.5If paid by workers 36.8 36.8 7.9 5.3 7.9 0.0 57.1 14.3 0.0 28.6
If co-paid by workers & Government 23.7 10.5 34.2 15.8 13.2 0.0 14.3 28.6 28.6 28.6
If paid by Government 5.3 0.0 15.8 23.7 52.6 0.0 0.0 0.0 0.0 100.0
County/ WIAA FayetteJob Satisfaction and
Employed Underemployed Willingness to Train 23. Job Satisfaction CD D N S CS CD D N S CS
Overall Satisfaction 3.3 8.2 13.1 24.6 50.8 20.0 20.0 30.0 0.0 30.0Earnings 13.1 4.9 29.5 26.2 26.2 50.0 20.0 20.0 10.0 0.0
Retention 3.3 4.9 13.1 13.1 62.3 0.0 10.0 40.0 0.0 50.0Work 3.3 1.6 4.9 24.6 65.6 20.0 10.0 10.0 20.0 40.0
Hours 4.9 3.3 6.6 27.9 57.4 20.0 10.0 20.0 40.0 10.0Shift 3.3 3.3 8.2 14.8 70.5 20.0 0.0 10.0 10.0 60.0
Conditions 4.9 8.2 11.5 21.3 54.1 20.0 30.0 10.0 10.0 30.0Commuting Distance 11.5 6.6 13.1 4.9 62.3 20.0 0.0 30.0 0.0 50.0
24. Willingness to Train CU U N W CW CU U N W CW
For a better job 19.6 3.9 13.7 7.8 52.9 0.0 10.0 10.0 10.0 70.0If paid by workers 43.9 22.0 19.5 7.3 4.9 40.0 30.0 20.0 0.0 10.0
If co-paid by workers & Government 9.8 19.5 22.0 17.1 29.3 10.0 10.0 20.0 20.0 40.0
If paid by Government 4.9 9.8 7.3 4.9 70.7 10.0 0.0 10.0 0.0 80.0
County/ WIAA GreeneJob Satisfaction and
Employed Underemployed Willingness to Train 23. Job Satisfaction CD D N S CS CD D N S CS
Overall Satisfaction 13.7 3.9 17.7 17.7 45.1 28.6 14.3 35.7 7.1 14.3Earnings 31.4 2.0 23.5 15.7 23.5 71.4 0.0 21.4 7.1 0.0
Retention 7.8 11.8 11.8 23.5 43.1 14.3 28.6 21.4 14.3 21.4Work 3.9 2.0 9.8 17.7 64.7 14.3 0.0 14.3 35.7 35.7
Hours 7.8 5.9 7.8 15.7 60.8 21.4 14.3 7.1 0.0 57.1Shift 2.0 0.0 13.7 9.8 72.6 7.1 0.0 14.3 7.1 71.4
Conditions 5.9 5.9 17.7 25.5 43.1 21.4 0.0 28.6 35.7 14.3Commuting Distance 7.8 2.0 17.7 9.8 60.8 14.3 0.0 35.7 7.1 42.9
24. Willingness to Train CU U N W CW CU U N W CW
For a better job 12.2 7.3 4.9 9.8 63.4 0.0 7.1 0.0 14.3 78.6If paid by workers 38.9 11.1 16.7 11.1 19.4 35.7 21.4 21.4 7.1 14.3
If co-paid by workers & Government 8.3 8.3 25.0 16.7 33.3 0.0 7.1 28.6 21.4 42.9
If paid by Government 8.3 0.0 5.6 5.6 77.8 0.0 0.0 0.0 7.1 92.9
CD = Completely dissatisfied, D = Dissatisfied, N = Neither satisfied nor dissatisfied, S = Satisfied, and CS = Completely satisfied. CU = Completely unwilling, U =Unwilling, N= Neither willing nor unwilling, W = Willing, and CW = Completely Willing. Note: Rounding errors may be present.

2013 Underemployment in Alabama WIAAs CBER, UA 59
Table 3.2 Underemployment Survey Results, Region 3 (Percent, continued)
County/ WIAA HaleJob Satisfaction and
Employed Underemployed Willingness to Train 23. Job Satisfaction CD D N S CS CD D N S CS
Overall Satisfaction 7.7 4.6 12.3 21.5 53.9 6.7 6.7 13.3 33.3 40.0Earnings 10.8 9.2 21.5 20.0 38.5 0.0 26.7 46.7 20.0 6.7
Retention 4.6 9.2 7.7 13.9 60.0 0.0 6.7 6.7 6.7 80.0Work 1.5 6.2 4.6 16.9 70.8 0.0 0.0 0.0 26.7 73.3
Hours 6.2 3.1 6.2 9.2 75.4 0.0 6.7 6.7 6.7 80.0Shift 1.5 4.6 0.0 10.8 83.1 0.0 6.7 0.0 0.0 93.3
Conditions 4.6 3.1 9.2 29.2 53.9 6.7 0.0 0.0 33.3 60.0Commuting Distance 4.6 3.1 13.9 15.4 63.1 0.0 6.7 13.3 20.0 60.0
24. Willingness to Train CU U N W CW CU U N W CW
For a better job 18.9 5.7 13.2 13.2 49.1 21.4 0.0 7.1 21.4 50.0If paid by workers 48.8 23.3 4.7 9.3 14.0 45.5 27.3 0.0 9.1 18.2
If co-paid by workers & Government 18.6 9.3 27.9 14.0 27.9 9.1 9.1 18.2 27.3 27.3
If paid by Government 9.3 0.0 4.7 14.0 69.8 9.1 0.0 0.0 0.0 81.8
County/ WIAA LamarJob Satisfaction and
Employed Underemployed Willingness to Train 23. Job Satisfaction CD D N S CS CD D N S CS
Overall Satisfaction 2.0 4.0 16.0 20.0 58.0 7.1 7.1 42.9 14.3 28.6Earnings 10.0 8.0 24.0 18.0 40.0 21.4 7.1 50.0 7.1 14.3
Retention 0.0 6.0 8.0 16.0 64.0 0.0 7.1 7.1 21.4 50.0Work 0.0 4.0 10.0 24.0 62.0 0.0 14.3 21.4 21.4 42.9
Hours 8.0 2.0 18.0 10.0 62.0 21.4 7.1 14.3 14.3 42.9Shift 10.0 2.0 14.0 2.0 72.0 28.6 7.1 21.4 0.0 42.9
Conditions 4.0 4.0 12.0 22.0 58.0 14.3 7.1 21.4 21.4 35.7Commuting Distance 6.0 8.0 14.0 8.0 64.0 7.1 14.3 14.3 7.1 57.1
24. Willingness to Train CU U N W CW CU U N W CW
For a better job 23.8 2.4 28.6 2.4 40.5 7.1 0.0 14.3 7.1 64.3If paid by workers 53.1 12.5 18.8 3.1 12.5 61.5 15.4 0.0 0.0 23.1
If co-paid by workers & Government 6.3 12.5 40.6 12.5 28.1 7.7 15.4 30.8 0.0 46.2
If paid by Government 0.0 0.0 18.8 12.5 68.8 0.0 0.0 7.7 15.4 76.9
County/ WIAA PickensJob Satisfaction and
Employed Underemployed Willingness to Train 23. Job Satisfaction CD D N S CS CD D N S CS
Overall Satisfaction 7.0 3.5 14.0 21.1 52.6 16.7 16.7 25.0 16.7 25.0Earnings 10.5 7.0 29.8 21.1 31.6 16.7 25.0 25.0 16.7 16.7
Retention 7.0 5.3 14.0 12.3 59.7 8.3 8.3 8.3 8.3 41.7Work 3.5 1.8 8.8 15.8 70.2 0.0 8.3 8.3 25.0 58.3
Hours 10.5 0.0 5.3 19.3 64.9 25.0 0.0 8.3 16.7 50.0Shift 10.5 0.0 12.3 14.0 63.2 25.0 0.0 8.3 8.3 58.3
Conditions 3.5 5.3 8.8 22.8 59.7 8.3 16.7 16.7 8.3 50.0Commuting Distance 7.0 7.0 8.8 22.8 54.4 16.7 8.3 8.3 0.0 66.7
24. Willingness to Train CU U N W CW CU U N W CW
For a better job 8.2 6.1 16.3 18.4 51.0 0.0 0.0 20.0 10.0 70.0If paid by workers 40.0 31.1 11.1 6.7 11.1 40.0 30.0 10.0 20.0 0.0
If co-paid by workers & Government 13.3 13.3 44.4 11.1 17.8 0.0 0.0 60.0 0.0 40.0
If paid by Government 2.2 0.0 17.8 20.0 60.0 0.0 0.0 10.0 20.0 70.0
CD = Completely dissatisfied, D = Dissatisfied, N = Neither satisfied nor dissatisfied, S = Satisfied, and CS = Completely satisfied. CU = Completely unwilling, U =Unwilling, N= Neither willing nor unwilling, W = Willing, and CW = Completely Willing. Note: Rounding errors may be present.

CBER, UA 2013 Underemployment in Alabama WIAAs 60
Table 3.2 Underemployment Survey Results, Region 3 (Percent, continued)
County/ WIAA TuscaloosaJob Satisfaction and
Employed Underemployed Willingness to Train 23. Job Satisfaction CD D N S CS CD D N S CS
Overall Satisfaction 5.0 5.0 18.8 22.5 46.3 8.0 16.0 28.0 16.0 28.0Earnings 10.0 17.5 18.8 25.0 28.8 28.0 24.0 28.0 12.0 8.0
Retention 2.5 6.3 7.5 28.8 53.8 8.0 12.0 24.0 24.0 40.0Work 2.5 2.5 11.3 25.0 58.8 8.0 4.0 24.0 20.0 44.0
Hours 8.8 2.5 8.8 22.5 57.5 20.0 4.0 12.0 32.0 32.0Shift 3.8 3.8 6.3 22.5 63.8 8.0 12.0 8.0 32.0 40.0
Conditions 2.5 5.0 16.3 27.5 48.8 4.0 8.0 24.0 40.0 24.0Commuting Distance 7.5 1.3 10.0 13.8 67.5 12.0 0.0 4.0 20.0 64.0
24. Willingness to Train CU U N W CW CU U N W CW
For a better job 21.4 5.7 14.3 17.1 40.0 18.2 4.6 4.6 18.2 54.6If paid by workers 47.3 21.8 9.1 1.8 16.4 27.8 27.8 5.6 33.3 5.6
If co-paid by workers & Government 12.7 12.7 36.4 14.6 18.2 11.1 16.7 22.2 16.7 22.2
If paid by Government 5.5 3.6 18.2 12.7 60.0 5.6 0.0 16.7 0.0 77.8
County/ WIAA Region 3Job Satisfaction and
Employed Underemployed Willingness to Train 23. Job Satisfaction CD D N S CS CD D N S CS
Overall Satisfaction 6.0 5.3 15.4 21.4 51.0 13.0 14.0 31.0 15.0 26.0Earnings 13.2 8.9 24.0 21.4 32.0 29.0 18.0 34.0 12.0 7.0
Retention 4.1 6.5 10.6 18.8 57.2 6.0 11.0 15.0 15.0 46.0Work 2.2 2.6 8.4 20.7 65.9 6.0 5.0 16.0 26.0 47.0
Hours 7.5 2.9 8.9 17.8 62.7 17.0 7.0 13.0 18.0 45.0Shift 4.6 3.1 7.9 13.9 70.2 13.0 7.0 9.0 16.0 55.0
Conditions 3.6 4.8 12.5 25.2 53.6 10.0 9.0 19.0 28.0 34.0Commuting Distance 7.2 4.8 13.5 13.7 60.3 13.0 5.0 16.0 12.0 54.0
24. Willingness to Train CU U N W CW CU U N W CW
For a better job 17.1 5.7 16.6 12.0 47.1 9.8 3.3 7.6 15.2 63.0If paid by workers 44.7 19.8 13.4 6.9 10.1 37.4 27.7 8.4 6.0 19.3
If co-paid by workers & Government 13.5 12.4 33.1 14.5 23.5 6.0 10.8 28.9 15.7 34.9
If paid by Government 5.2 2.1 12.8 13.5 65.2 3.6 0.0 7.2 6.0 81.9
CD = Completely dissatisfied, D = Dissatisfied, N = Neither satisfied nor dissatisfied, S = Satisfied, and CS = Completely satisfied. CU = Completely unwilling, U =Unwilling, N= Neither willing nor unwilling, W = Willing, and CW = Completely Willing. Note: Rounding errors may be present.

2013 Underemployment in Alabama WIAAs CBER, UA 61
Underemployment in Workforce Investment Advisory Area, Region 4

CBER, UA 2013 Underemployment in Alabama WIAAs 62
Underemployment in Workforce Investment Advisory Area, Region 4
WIAA Region 4 comprises of the six counties shown in Table 4.1. The area’s underemployment rate of 24.0 percent is just slightly above the state’s 23.8 percent and indicates that the region had 117,600 underemployed resident workers in December 2012. Adding the unemployed gives a total available labor pool of about 147,300 for the area, with Jefferson County contributing the majority. This pool is five times the number of unemployed and is a more realistic measure of the available labor in the area. Employers must offer higher wages, better benefits or terms of employment, or some other incentives to induce the underemployed to change jobs. The region had 24.6 percent of the state’s underemployed and 24.3 percent of the state’s workers.
Table 4.1 Region 4 Underemployed
Alabama Region 4 Blount Chilton Jefferson St. Clair Shelby Walker
Labor Force 2,154,744 520,430 26,256 19,907 304,802 37,715 104,474 27,276Employed 2,013,847 490,680 24,842 18,715 286,283 35,605 99,763 25,472Underemployment rate 23.8% 24.0% 16.4% 16.1% 25.8% 19.1% 25.9% 35.1%Underemployed workers 479,296 117,567 4,079 3,008 73,832 6,783 25,869 8,938Unemployed 140,897 29,750 1,414 1,192 18,519 2,110 4,711 1,804Available labor pool 620,193 147,317 5,493 4,200 92,351 8,893 30,580 10,742
Note: Rounding errors may be present. Based on December 2012 labor force data and 2012 underemployment rates. Source: Center for Business and Economic Research, The University of Alabama and Alabama Department of Labor. Underemployment Survey Results
Underemployment rates range from 16.1 percent in Chilton County to 35.1 percent in Walker (Table 4.1) with three counties having rates that were above the Alabama rate. The underemployment rates are multiplied by the number of employed to get the number of underemployed workers. Table 4.2 shows the detailed underemployment survey results that include characteristics of the employed, underemployed, and nonworkers. Except for rates and their implications for labor availability, detailed county-level results are not discussed because county sample sizes are sufficient for underemployment estimation but too small for making reliable inferences on characteristics.
Of the employed, 79 percent work full-time, 10 percent hold more than one job, and 28 percent of part-time workers would like to work full-time. The one-way commute takes up to 20 minutes for 44 percent, but 16 percent take more than 40 minutes with four percent taking more than an hour. Thirty-nine percent commute less than 10 miles, 25 percent travel more than 25 miles, and seven percent exceed 45 miles. Sixty percent have 10 or more years job tenure—35 percent have more than 20 years—and the median monthly wage is between $2,000 and $3,000. Healthcare and education sectors are major employers in the region. Most workers (84 percent) claim that their jobs fit well with their education, training, skills, and experience; 64 percent believe they are qualified for a better job, but just 21 percent have sought better jobs in the preceding three months. If offered up to 15 percent higher wages, 29 percent would leave their jobs, 51 percent will leave for more than that, and 14 percent want more than a 50 percent raise. About 38 percent will add up to 10 miles to the one-way commute for the higher-paying job, but 23 percent are prepared to go 20 or more extra miles. For this job, 32 percent are willing to increase the one-way commute by more than 20 minutes while 31 percent will not consider adding more than 10 minutes.
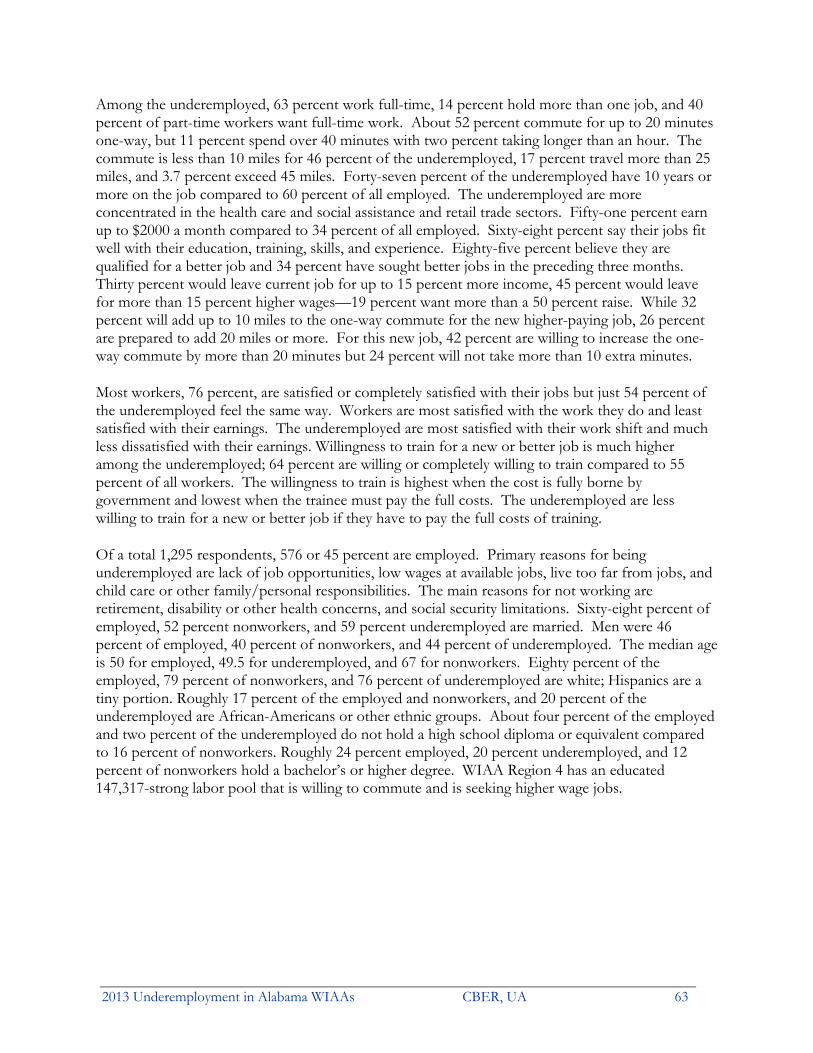
2013 Underemployment in Alabama WIAAs CBER, UA 63
Among the underemployed, 63 percent work full-time, 14 percent hold more than one job, and 40 percent of part-time workers want full-time work. About 52 percent commute for up to 20 minutes one-way, but 11 percent spend over 40 minutes with two percent taking longer than an hour. The commute is less than 10 miles for 46 percent of the underemployed, 17 percent travel more than 25 miles, and 3.7 percent exceed 45 miles. Forty-seven percent of the underemployed have 10 years or more on the job compared to 60 percent of all employed. The underemployed are more concentrated in the health care and social assistance and retail trade sectors. Fifty-one percent earn up to $2000 a month compared to 34 percent of all employed. Sixty-eight percent say their jobs fit well with their education, training, skills, and experience. Eighty-five percent believe they are qualified for a better job and 34 percent have sought better jobs in the preceding three months. Thirty percent would leave current job for up to 15 percent more income, 45 percent would leave for more than 15 percent higher wages—19 percent want more than a 50 percent raise. While 32 percent will add up to 10 miles to the one-way commute for the new higher-paying job, 26 percent are prepared to add 20 miles or more. For this new job, 42 percent are willing to increase the one-way commute by more than 20 minutes but 24 percent will not take more than 10 extra minutes.
Most workers, 76 percent, are satisfied or completely satisfied with their jobs but just 54 percent of the underemployed feel the same way. Workers are most satisfied with the work they do and least satisfied with their earnings. The underemployed are most satisfied with their work shift and much less dissatisfied with their earnings. Willingness to train for a new or better job is much higher among the underemployed; 64 percent are willing or completely willing to train compared to 55 percent of all workers. The willingness to train is highest when the cost is fully borne by government and lowest when the trainee must pay the full costs. The underemployed are less willing to train for a new or better job if they have to pay the full costs of training.
Of a total 1,295 respondents, 576 or 45 percent are employed. Primary reasons for being underemployed are lack of job opportunities, low wages at available jobs, live too far from jobs, and child care or other family/personal responsibilities. The main reasons for not working are retirement, disability or other health concerns, and social security limitations. Sixty-eight percent of employed, 52 percent nonworkers, and 59 percent underemployed are married. Men were 46 percent of employed, 40 percent of nonworkers, and 44 percent of underemployed. The median age is 50 for employed, 49.5 for underemployed, and 67 for nonworkers. Eighty percent of the employed, 79 percent of nonworkers, and 76 percent of underemployed are white; Hispanics are a tiny portion. Roughly 17 percent of the employed and nonworkers, and 20 percent of the underemployed are African-Americans or other ethnic groups. About four percent of the employed and two percent of the underemployed do not hold a high school diploma or equivalent compared to 16 percent of nonworkers. Roughly 24 percent employed, 20 percent underemployed, and 12 percent of nonworkers hold a bachelor’s or higher degree. WIAA Region 4 has an educated 147,317-strong labor pool that is willing to commute and is seeking higher wage jobs.

CBER, UA 2013 Underemployment in Alabama WIAAs 64
Table 4.2 Underemployment Survey Results, Region 4 (Percent) County /WIAA Blount Chilton Jefferson St. Clair
General Emp Und Emp Und Emp Und Emp Und
1. Percent of adults that are working full-time 72.3 36.4 72.2 66.7 79.9 66.7 87.1 66.7 2. Percent of part-timers who wish to work full-time 16.7 14.3 25.0 33.3 38.5 54.6 33.3 75.0 3. Percent of workers with more than one job 6.0 9.1 10.7 100.0 12.3 18.5 7.9 25.0 4. Average commute time (one-way) Up to 20 minutes 31.3 54.6 53.6 66.7 46.0 50.8 39.7 41.7
20 to 40 minutes 31.3 9.1 26.8 22.2 41.7 35.4 34.9 33.340 minutes to an hour 25.4 18.2 8.9 0.0 5.2 4.6 22.2 25.0
More than an hour 9.0 9.1 5.4 11.1 2.8 1.5 3.2 0.0 5. Commute distance Less than 10 miles 22.4 45.5 55.6 55.6 41.2 46.8 36.5 33.3
10 to 25 miles 26.9 18.2 16.7 11.1 41.2 40.3 25.4 33.325 to 45 miles 31.3 18.2 11.1 11.1 12.4 9.7 28.6 25.0
More than 45 miles 17.9 18.2 14.8 22.2 2.9 0.0 9.5 8.3 6. Occupation Management 13.4 0.0 21.4 11.1 13.1 10.8 15.9 16.7
Business/Financial Operations 6.0 0.0 1.8 0.0 9.1 3.1 4.8 8.3Computer/Mathematical 0.0 0.0 0.0 0.0 0.0 0.0 1.6 0.0
Architecture/Engineering 4.5 9.1 3.6 0.0 2.0 4.6 0.0 0.0Life/Physical/Social Science 0.0 0.0 1.8 0.0 0.8 3.1 0.0 0.0Community /Social Services 0.0 0.0 1.8 0.0 2.0 0.0 1.6 0.0
Legal 3.0 0.0 0.0 0.0 2.4 1.5 0.0 0.0Education/Training/Library 7.5 9.1 8.9 0.0 5.2 3.1 7.9 8.3
Arts/Design/Entertainment/Sports/Media 4.5 9.1 0.0 0.0 1.6 4.6 0.0 0.0Healthcare Practitioners/Technicians 11.9 9.1 5.4 11.1 8.3 12.3 6.4 8.3
Healthcare Support 7.5 0.0 3.6 11.1 8.7 7.7 6.4 0.0Protective Service 1.5 9.1 1.8 0.0 0.8 1.5 0.0 0.0
Food Preparation/Serving Related 3.0 0.0 5.4 11.1 3.6 6.2 3.2 16.7Building/Grounds Cleaning/Maintenance. 1.5 0.0 1.8 11.1 2.0 3.1 3.2 8.3
Personal Care/Service 4.5 9.1 0.0 0.0 2.4 3.1 3.2 0.0Sales and Related 6.0 9.1 3.6 11.1 6.8 6.2 11.1 8.3
Office/Administrative Support 4.5 0.0 12.5 11.1 6.0 4.6 6.4 0.0Farming/Fishing/Forestry 1.5 0.0 1.8 0.0 0.4 0.0 0.0 0.0
Construction/Extraction 3.0 0.0 5.4 0.0 1.6 0.0 4.8 0.0Installation/Maintenance/Repair 6.0 9.1 10.7 0.0 4.4 1.5 4.8 0.0
Production 0.0 0.0 5.4 11.1 2.0 3.1 0.0 0.0Transportation/Material Moving 6.0 18.2 0.0 0.0 2.4 4.6 7.9 8.3
other 4.5 9.1 3.6 11.1 14.7 15.4 11.1 16.7 7. Industry Agriculture/Forestry/Fishing/Hunting 3.0 0.0 5.4 0.0 0.8 0.0 0.0 0.0
Mining 1.5 0.0 0.0 0.0 0.0 0.0 0.0 0.0Utilities 1.5 0.0 3.6 0.0 3.6 1.5 1.6 0.0
Construction 6.0 0.0 12.5 0.0 5.6 7.7 7.9 0.0Manufacturing 9.0 18.2 8.9 0.0 4.8 4.6 6.4 0.0
Wholesale Trade 0.0 0.0 3.6 0.0 0.4 0.0 1.6 0.0Retail Trade 6.0 0.0 7.1 22.2 6.8 13.9 6.4 16.7
Transportation/Warehousing 7.5 18.2 8.9 33.3 3.6 3.1 9.5 8.3Information 0.0 0.0 0.0 0.0 1.6 1.5 1.6 0.0
Finance/Insurance 0.0 0.0 5.4 0.0 7.9 4.6 1.6 0.0Real Estate/Rental/Leasing 0.0 0.0 0.0 0.0 1.6 1.5 1.6 0.0
Professional/Scientific/Technical Services 4.5 9.1 1.8 0.0 3.2 1.5 0.0 0.0Management of Companies/Enterprises 0.0 0.0 0.0 0.0 1.6 1.5 3.2 0.0
Administrative/Support/Waste Management/Remediation 0.0 0.0 0.0 0.0 0.0 0.0 0.0 0.0Educational Services 10.5 0.0 10.7 11.1 7.1 3.1 12.7 25.0
Health Care/Social Assistance 20.9 9.1 12.5 22.2 23.4 27.7 22.2 25.0Arts/Entertainment/Recreation 3.0 0.0 0.0 0.0 0.4 1.5 0.0 0.0Accommodation/Food Services 6.0 0.0 5.4 0.0 4.4 6.2 3.2 8.3
Public Administration 3.0 0.0 0.0 0.0 4.8 4.6 3.2 0.0Other 6.0 18.2 7.1 11.1 4.4 3.1 6.4 8.3
Emp – Employed Und – Underemployed NnW – Nonworkers Note: Rounding errors may be present. Responses to the questions on occupation and industry should only be used for making comparisons between
the employed and the underemployed and not for indicating worker distribution by occupation or industry.

2013 Underemployment in Alabama WIAAs CBER, UA 65
Table 4.2 Underemployment Survey Results, Region 4 (Percent, continued) County /WIAA Shelby Walker Region 4
General Emp Und Emp Und Emp Und
1. Percent of adults that are working full-time 76.3 60.0 80.0 63.2 78.6 62.7 2. Percent of part-timers who wish to work full-time 10.5 12.5 30.8 37.5 28.4 40.4 3. Percent of workers with more than one job 6.2 4.8 8.8 10.0 9.7 13.8 4. Average commute time (one-way) Up to 20 minutes 39.5 47.6 49.1 60.0 43.8 52.2
20 to 40 minutes 40.7 38.1 29.8 35.0 37.0 32.6 40 minutes to an hour 14.8 14.3 15.8 5.0 12.2 8.7
More than an hour 1.2 0.0 3.5 0.0 3.7 2.2 5. Commute distance Less than 10 miles 37.2 47.6 36.8 45.0 38.8 45.9
10 to 25 miles 39.7 38.1 35.1 40.0 34.5 35.6 25 to 45 miles 20.5 14.3 17.5 15.0 18.0 13.3
More than 45 miles 2.6 0.0 8.8 0.0 7.1 3.7 6. Occupation Management 7.4 0.0 8.8 5.0 13.0 8.0
Business/Financial Operations 14.8 4.8 5.3 5.0 8.0 3.6 Computer/Mathematical 2.5 0.0 1.8 0.0 0.7 0.0
Architecture/Engineering 1.2 4.8 1.8 0.0 2.1 3.6 Life/Physical/Social Science 1.2 0.0 0.0 0.0 0.7 1.5 Community /Social Services 2.5 0.0 1.8 0.0 1.7 0.0
Legal 2.5 4.8 0.0 0.0 1.7 1.5 Education/Training/Library 13.6 9.5 17.5 20.0 8.5 7.3
Arts/Design/Entertainment/Sports/Media 0.0 0.0 0.0 0.0 1.2 2.9 Healthcare Practitioners/Technicians 6.2 4.8 5.3 0.0 7.6 8.7
Healthcare Support 4.9 4.8 1.8 5.0 6.6 5.8 Protective Service 1.2 4.8 1.8 5.0 1.0 2.9
Food Preparation/Serving Related 2.5 4.8 1.8 0.0 3.3 5.8 Building/Grounds Cleaning/Maintenance. 0.0 0.0 1.8 5.0 1.7 3.6
Personal Care/Service 1.2 0.0 0.0 0.0 2.1 2.2 Sales and Related 12.4 14.3 8.8 15.0 7.8 9.4
Office/Administrative Support 6.2 19.1 8.8 5.0 6.8 6.5 Farming/Fishing/Forestry 2.5 0.0 0.0 0.0 0.5 0.7
Construction/Extraction 3.7 4.8 3.5 0.0 2.8 0.0 Installation/Maintenance/Repair 0.0 4.8 5.3 5.0 5.2 2.9
Production 0.0 0.0 5.3 10.0 1.9 3.6 Transportation/Material Moving 2.5 8.3 1.8 0.0 3.1 4.4
other 11.1 14.3 17.5 20.0 11.8 15.2 7. Industry Agriculture/Forestry/Fishing/Hunting 0.0 0.0 0.0 0.0 1.2 0.0
Mining 0.0 0.0 7.0 0.0 0.9 0.0 Utilities 0.0 0.0 5.3 0.0 2.8 0.7
Construction 7.4 0.0 3.5 5.0 6.6 6.5 Manufacturing 2.5 14.3 1.8 5.0 5.2 4.4
Wholesale Trade 1.2 0.0 1.8 0.0 1.0 0.0 Retail Trade 7.4 14.3 5.3 5.0 6.6 12.3
Transportation/Warehousing 1.2 0.0 1.8 0.0 4.7 5.8 Information 1.2 0.0 0.0 0.0 1.0 0.7
Finance/Insurance 17.3 0.0 7.0 10.0 7.3 5.1 Real Estate/Rental/Leasing 2.5 0.0 1.8 5.0 1.4 1.5
Professional/Scientific/Technical Services 6.2 0.0 1.8 5.0 3.1 2.2 Management of Companies/Enterprises 0.0 0.0 1.8 5.0 1.2 1.5
Administrative/Support/Waste Management/Remediation 0.0 0.0 1.8 5.0 0.2 0.7 Educational Services 21.0 19.1 17.5 15.0 11.5 9.4
Health Care/Social Assistance 9.9 14.3 19.3 20.0 19.6 22.5 Arts/Entertainment/Recreation 2.5 4.8 1.8 5.0 1.0 2.2 Accommodation/Food Services 2.5 4.8 0.0 0.0 3.8 4.4
Public Administration 2.5 4.8 1.8 0.0 3.3 2.9 Other 4.9 9.5 3.5 5.0 5.0 6.5
Emp – Employed Und – Underemployed NnW – Nonworkers Note: Rounding errors may be present. Responses to the questions on occupation and industry should only be used for making comparisons between
the employed and the underemployed and not for indicating worker distribution by occupation or industry.

CBER, UA 2013 Underemployment in Alabama WIAAs 66
Table 4.2 Underemployment Survey Results, Region 4 (Percent, continued) County /WIAA Blount Chilton Jefferson St. Clair
Emp Und Emp Und Emp Und Emp Und
8. Years at current/primary job Less than a year 17.9 36.4 12.5 22.2 11.5 18.5 20.6 41.71 to 3 years 7.5 0.0 7.1 11.1 7.9 9.2 6.4 8.33 to 5 years 3.0 9.1 5.4 0.0 5.6 6.2 12.7 0.0
5 to 10 years 13.4 9.1 5.4 22.2 13.5 15.4 7.9 8.310 to 20 years 28.4 27.3 25.0 11.1 22.6 18.5 19.1 25.0
More than 20 years 26.9 9.1 44.6 33.3 37.7 30.8 33.3 16.7
9. Monthly wages Less than $500 1.5 9.1 10.7 22.2 4.4 9.2 6.4 25.0$500 up to $1,000 13.4 18.2 7.1 11.1 9.5 12.3 6.4 8.3
$1,000 up to $2,000 19.4 27.3 25.0 33.3 18.7 24.6 19.1 41.7$2,000 up to $3,000 19.4 18.2 8.9 11.1 16.7 16.9 17.5 16.7$3,000 up to $4,000 11.9 9.1 12.5 11.1 13.9 12.3 9.5 0.0$4,000 up to $6,000 16.4 9.1 17.9 0.0 15.1 10.8 17.5 0.0
More than $6,000 10.5 0.0 8.9 0.0 15.5 9.2 15.9 8.3Job Fitness 10. Percent of workers whose current job fits well with their education and training, skills, and experience
86.6 54.6 85.7 88.9 81.8 66.2 82.5 66.7
11. Percent of workers who believe they are qualified for a better job
61.2 81.8 60.7 88.9 67.9 83.1 61.9 75.0
Reasons: Education and training 90.2 100.0 88.2 87.5 92.4 94.4 89.7 88.9Skills 97.6 100.0 97.1 87.5 93.0 92.6 100.0 100.0
Experience 97.6 100.0 100.0 100.0 95.9 98.2 97.4 100.0 12. Additional income for which workers would leave current job
0 to 5% more 9.4 0.0 3.7 0.0 4.8 7.1 0.0 0.05 to 15% more 21.9 20.0 14.8 40.0 26.4 28.6 20.8 28.6
15 to 30% more 25.0 0.0 25.9 0.0 27.2 21.4 20.8 28.630 to 50% more 15.6 0.0 14.8 20.0 10.4 17.9 8.3 14.3
More than 50% more 15.6 40.0 7.4 0.0 13.6 14.3 20.8 28.6 *** Would not leave current job 12.5 40.0 29.6 20.0 14.4 10.7 12.5 0.0
13. Additional commute for new job 0 to 10 miles 39.7 33.3 40.9 14.3 37.0 37.5 38.5 25.0
10 to 20 miles 27.6 22.2 36.4 57.1 38.0 35.7 38.5 41.7more than 20 miles 29.3 33.3 20.5 28.6 21.6 23.2 21.2 33.3
14. Additional one-way commute time 0 to 10 minutes 34.5 11.1 34.1 14.3 31.3 28.6 26.9 16.7
10 to 20 minutes 34.5 44.4 31.8 42.9 32.7 30.4 44.2 41.7more than 20 minutes 31.0 44.4 31.8 42.9 34.1 39.3 26.9 41.7
15. Percent of workers who sought better job in past three months
17.2 22.2 13.6 14.3 24.5 37.5 11.5 25.0
Underemployment 16. Percent of workers who say they are currently underemployed
16.4 16.1 25.8 19.1
17. Reasons respondents give for being Und NnW Und NnW Und NnW Und NnW
A lack of job opportunities in their area 54.6 19.4 66.7 24.3 55.4 19.7 66.7 23.7The low wages at the available jobs 27.3 15.3 44.4 18.9 44.6 15.5 75.0 21.1
They live too far from jobs 36.4 26.4 33.3 18.9 13.9 8.3 41.7 18.4They are in school or undergoing training 0.0 4.2 0.0 8.1 9.2 4.1 0.0 2.6
Their spouse or partner has a really good job 36.4 18.1 0.0 16.2 10.8 7.6 25.0 7.9They are retired 18.2 65.3 11.1 68.9 9.2 69.0 0.0 75.0
Because of social security limitations 27.3 27.8 11.1 35.1 3.1 25.9 0.0 30.3Disability or other health concerns 9.1 50.0 22.2 46.0 6.2 45.5 0.0 36.8
Child care responsibilities 27.3 12.5 22.2 13.5 21.5 6.6 25.0 9.2They take care of someone other than a child 18.2 13.9 44.4 14.9 9.2 11.0 16.7 4.0
Other family or personal obligations 45.5 15.3 44.4 13.5 29.2 11.0 25.0 15.8Owning a house in your area 30.0 6.8 0.0 24.2 18.5 18.1 36.4 17.9
Something else 0.0 20.8 22.2 17.6 29.2 16.6 0.0 26.3
Emp – Employed Und – Underemployed NnW – Nonworkers Note: Rounding errors may be present.

2013 Underemployment in Alabama WIAAs CBER, UA 67
Table 4.2 Underemployment Survey Results, Region 4 (Percent, continued) County/WIAA Shelby Walker Region 4
Emp Und Emp Und Emp Und
8. Years at current/primary job Less than a year 11.1 9.5 14.0 25.0 13.5 21.7 1 to 3 years 4.9 9.5 5.3 10.0 6.9 8.7 3 to 5 years 7.4 4.8 3.5 5.0 6.1 5.1
5 to 10 years 16.1 28.6 10.5 5.0 12.2 15.2 10 to 20 years 29.6 28.6 29.8 20.0 24.8 21.0
More than 20 years 29.6 19.1 35.1 30.0 35.2 26.1
9. Monthly wages Less than $500 4.9 4.8 7.0 15.0 5.2 11.6 $500 up to $1,000 4.9 14.3 7.0 15.0 8.5 13.0
$1,000 up to $2,000 13.6 14.3 29.8 30.0 19.8 26.1 $2,000 up to $3,000 19.8 19.1 15.8 10.0 16.7 15.9 $3,000 up to $4,000 18.5 14.3 8.8 5.0 13.2 10.1 $4,000 up to $6,000 13.6 14.3 12.3 10.0 15.3 10.1
More than $6,000 14.8 9.5 12.3 0.0 13.9 5.8 Job Fitness 10. Percent of workers whose current job fits well with their education and training, skills, and experience
86.4 71.4 87.7 70.0 84.0 68.1
11. Percent of workers who believe they are qualified for a better job
69.1 95.2 49.1 90.0 64.1 85.5
Reasons: Education and training 92.9 85.0 92.9 88.9 91.6 91.5 Skills 94.6 90.0 96.4 94.4 95.1 93.2
Experience 92.9 90.0 96.4 94.4 96.2 96.6 12. Additional income for which workers would leave current job
0 to 5% more 7.5 18.2 3.5 0.0 5.1 6.4 5 to 15% more 25.0 18.2 24.1 0.0 23.8 23.8
15 to 30% more 25.0 27.3 6.9 14.3 23.8 19.1 30 to 50% more 20.0 18.2 10.3 14.3 12.6 15.9
More than 50% more 12.5 18.2 17.2 28.6 14.1 19.1 *** Would not leave current job 10.0 0.0 37.9 42.9 17.3 14.3
13. Additional commute for new job 0 to 10 miles 47.1 45.0 20.5 11.8 37.8 32.2
10 to 20 miles 37.1 40.0 40.9 52.9 36.8 39.7 more than 20 miles 15.7 15.0 31.8 35.3 22.5 25.6
14. Additional one-way commute time 0 to 10 minutes 38.6 35.0 18.2 11.8 31.3 24.0
10 to 20 minutes 35.7 35.0 29.6 23.5 34.2 33.1 more than 20 minutes 24.3 30.0 45.5 64.7 32.4 42.2
15. Percent of workers who sought better job in past three months
27.1 45.0 22.7 29.4 21.4 33.9
Underemployment 16. Percent of workers who say they are currently underemployed
25.9 35.1 24.0
17. Reasons respondents give for being Und NnW Und NnW Und NnW
A lack of job opportunities in their area 47.6 18.9 55.0 21.8 55.8 20.9 The low wages at the available jobs 38.1 12.2 40.0 19.6 44.2 16.8
They live too far from jobs 9.5 16.2 30.0 13.5 21.0 14.1 They are in school or undergoing training 4.8 4.1 0.0 2.3 5.1 4.0
Their spouse or partner has a really good job 23.8 16.2 30.0 9.0 18.1 10.7 They are retired 9.5 71.6 10.0 61.7 9.4 68.2
Because of social security limitations 19.1 12.2 5.0 29.3 8.0 26.7 Disability or other health concerns 9.5 36.5 10.0 50.4 8.0 45.1
Child care responsibilities 33.3 8.1 40.0 12.0 26.8 9.3 They take care of someone other than a child 23.8 8.1 10.0 16.5 15.2 11.7
Other family or personal obligations 52.4 14.9 40.0 14.3 36.2 13.2 Owning a house in your area 27.8 13.4 18.8 16.8 21.6 16.9
Something else 14.3 31.1 10.0 19.6 18.8 20.2
Emp – Employed Und – Underemployed NnW – Nonworkers Note: Rounding errors may be present.

CBER, UA 2013 Underemployment in Alabama WIAAs 68
Table 4.2 Underemployment Survey Results, Region 4 (Percent, continued) County/WIAA Blount Chilton Jefferson St. Clair
Selected Emp NnW Und Emp NnW Und Emp NnW Und Emp NnW UndCharacteristics 18. Married Respondents 73.1 63.9 90.9 71.4 56.8 55.6 61.1 45.2 50.8 68.3 55.3 41.7 19. Sex Female 58.2 62.5 63.6 50.0 68.9 66.7 50.4 67.6 52.3 58.7 64.5 66.7
Male 41.8 37.5 36.4 50.0 31.1 33.3 49.6 32.4 47.7 41.3 35.5 33.3 20. Median age (years) 48.5 65 56 53 66 56 50 67 49 47.5 69 52 21. Ethnicity Hispanic 3.0 0.0 0.0 0.0 2.7 0.0 0.8 0.3 1.5 0.0 0.0 0.0
21b. Race White 97.0 97.2 100.0 85.7 87.8 66.7 65.5 63.1 63.1 92.1 88.2 91.7African-American/Other 1.5 0.0 0.0 12.5 8.1 22.2 29.8 32.1 29.2 6.4 6.6 8.3
22. Last school grade
High Sch./less, no diploma 3.0 25.0 0.0 8.9 12.2 0.0 3.6 11.0 0.0 3.2 19.7 8.3High School or GED 20.9 26.4 36.4 32.1 43.2 33.3 20.6 33.1 15.4 30.2 39.5 33.3
Some college, no degree 13.4 23.6 9.1 21.4 21.6 33.3 18.3 17.9 20.0 19.1 11.8 16.7Jr. College/trade
school/associate degree 23.9 8.3 18.2 12.5 6.8 22.2 10.3 11.7 16.9 15.9 9.2 16.7
4-year college graduate/BA 20.9 6.9 9.1 12.5 9.5 0.0 25.8 15.5 24.6 20.6 14.5 16.7Postgraduate/Masters 17.9 9.7 27.3 12.5 5.4 11.1 21.0 10.0 23.1 11.1 4.0 8.3
County/WIAA Shelby Walker Region 4
Selected Emp NnW Und Emp NnW Und Emp NnW Und Characteristics 18. Married Respondents 75.3 56.8 66.7 79.0 51.9 70.0 68.1 51.7 58.7 19. Sex Female 60.5 64.9 66.7 52.6 64.7 45.0 53.8 66.1 56.5
Male 39.5 35.1 33.3 47.4 35.3 55.0 46.2 33.9 43.5 20. Median age (years) 49 68 49.5 50 64 47 50 67 49.5 21. Ethnicity Hispanic 1.2 1.4 0.0 0.0 0.0 0.0 0.9 0.6 0.7
21b. Race White 90.1 85.1 95.2 91.2 90.2 80.0 80.0 79.0 76.1 African-American/Other 6.2 9.5 4.8 7.0 6.8 20.0 16.7 16.7 19.6
22. Last school grade
High Sch./less, no diploma 2.5 8.1 4.8 3.5 25.6 0.0 3.8 15.9 1.5 High School or GED 18.5 29.7 9.5 38.6 39.1 50.0 24.3 34.9 23.9
Some college, no degree 14.8 13.5 19.1 19.3 14.3 20.0 17.7 17.1 19.6 Jr. College/trade
school/associate degree 9.9 9.5 19.1 14.0 9.0 10.0 13.0 9.9 16.7
4-year college graduate/BA 33.3 18.9 33.3 17.5 5.3 10.0 23.6 12.4 20.3 Postgraduate/Masters 19.8 20.3 14.3 7.0 5.3 10.0 17.2 9.0 18.1
Emp – Employed Und – Underemployed NnW – Nonworkers Note: Rounding errors may be present.
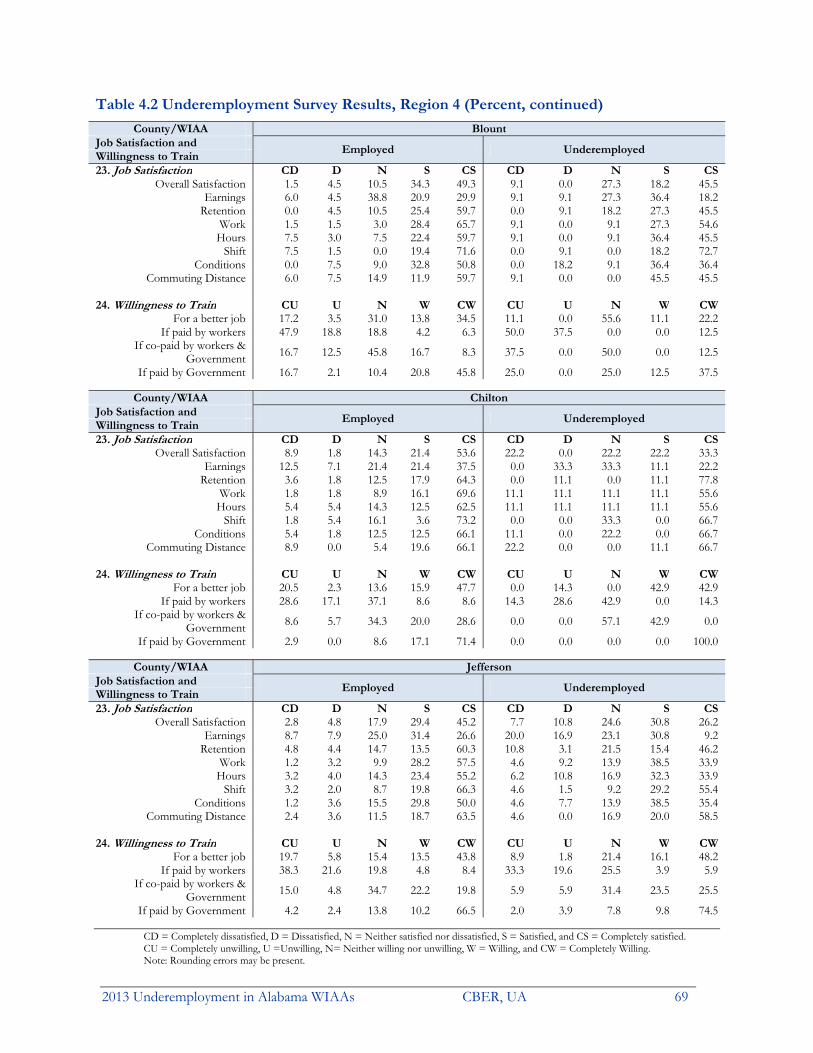
2013 Underemployment in Alabama WIAAs CBER, UA 69
Table 4.2 Underemployment Survey Results, Region 4 (Percent, continued) County/WIAA Blount
Job Satisfaction and Employed Underemployed
Willingness to Train 23. Job Satisfaction CD D N S CS CD D N S CS
Overall Satisfaction 1.5 4.5 10.5 34.3 49.3 9.1 0.0 27.3 18.2 45.5Earnings 6.0 4.5 38.8 20.9 29.9 9.1 9.1 27.3 36.4 18.2
Retention 0.0 4.5 10.5 25.4 59.7 0.0 9.1 18.2 27.3 45.5Work 1.5 1.5 3.0 28.4 65.7 9.1 0.0 9.1 27.3 54.6
Hours 7.5 3.0 7.5 22.4 59.7 9.1 0.0 9.1 36.4 45.5Shift 7.5 1.5 0.0 19.4 71.6 0.0 9.1 0.0 18.2 72.7
Conditions 0.0 7.5 9.0 32.8 50.8 0.0 18.2 9.1 36.4 36.4Commuting Distance 6.0 7.5 14.9 11.9 59.7 9.1 0.0 0.0 45.5 45.5
24. Willingness to Train CU U N W CW CU U N W CW
For a better job 17.2 3.5 31.0 13.8 34.5 11.1 0.0 55.6 11.1 22.2If paid by workers 47.9 18.8 18.8 4.2 6.3 50.0 37.5 0.0 0.0 12.5
If co-paid by workers & Government 16.7 12.5 45.8 16.7 8.3 37.5 0.0 50.0 0.0 12.5
If paid by Government 16.7 2.1 10.4 20.8 45.8 25.0 0.0 25.0 12.5 37.5
County/WIAA ChiltonJob Satisfaction and
Employed Underemployed Willingness to Train 23. Job Satisfaction CD D N S CS CD D N S CS
Overall Satisfaction 8.9 1.8 14.3 21.4 53.6 22.2 0.0 22.2 22.2 33.3Earnings 12.5 7.1 21.4 21.4 37.5 0.0 33.3 33.3 11.1 22.2
Retention 3.6 1.8 12.5 17.9 64.3 0.0 11.1 0.0 11.1 77.8Work 1.8 1.8 8.9 16.1 69.6 11.1 11.1 11.1 11.1 55.6
Hours 5.4 5.4 14.3 12.5 62.5 11.1 11.1 11.1 11.1 55.6Shift 1.8 5.4 16.1 3.6 73.2 0.0 0.0 33.3 0.0 66.7
Conditions 5.4 1.8 12.5 12.5 66.1 11.1 0.0 22.2 0.0 66.7Commuting Distance 8.9 0.0 5.4 19.6 66.1 22.2 0.0 0.0 11.1 66.7
24. Willingness to Train CU U N W CW CU U N W CW
For a better job 20.5 2.3 13.6 15.9 47.7 0.0 14.3 0.0 42.9 42.9If paid by workers 28.6 17.1 37.1 8.6 8.6 14.3 28.6 42.9 0.0 14.3
If co-paid by workers & Government 8.6 5.7 34.3 20.0 28.6 0.0 0.0 57.1 42.9 0.0
If paid by Government 2.9 0.0 8.6 17.1 71.4 0.0 0.0 0.0 0.0 100.0
County/WIAA JeffersonJob Satisfaction and
Employed Underemployed Willingness to Train 23. Job Satisfaction CD D N S CS CD D N S CS
Overall Satisfaction 2.8 4.8 17.9 29.4 45.2 7.7 10.8 24.6 30.8 26.2Earnings 8.7 7.9 25.0 31.4 26.6 20.0 16.9 23.1 30.8 9.2
Retention 4.8 4.4 14.7 13.5 60.3 10.8 3.1 21.5 15.4 46.2Work 1.2 3.2 9.9 28.2 57.5 4.6 9.2 13.9 38.5 33.9
Hours 3.2 4.0 14.3 23.4 55.2 6.2 10.8 16.9 32.3 33.9Shift 3.2 2.0 8.7 19.8 66.3 4.6 1.5 9.2 29.2 55.4
Conditions 1.2 3.6 15.5 29.8 50.0 4.6 7.7 13.9 38.5 35.4Commuting Distance 2.4 3.6 11.5 18.7 63.5 4.6 0.0 16.9 20.0 58.5
24. Willingness to Train CU U N W CW CU U N W CW
For a better job 19.7 5.8 15.4 13.5 43.8 8.9 1.8 21.4 16.1 48.2If paid by workers 38.3 21.6 19.8 4.8 8.4 33.3 19.6 25.5 3.9 5.9
If co-paid by workers & Government 15.0 4.8 34.7 22.2 19.8 5.9 5.9 31.4 23.5 25.5
If paid by Government 4.2 2.4 13.8 10.2 66.5 2.0 3.9 7.8 9.8 74.5
CD = Completely dissatisfied, D = Dissatisfied, N = Neither satisfied nor dissatisfied, S = Satisfied, and CS = Completely satisfied. CU = Completely unwilling, U =Unwilling, N= Neither willing nor unwilling, W = Willing, and CW = Completely Willing. Note: Rounding errors may be present.

CBER, UA 2013 Underemployment in Alabama WIAAs 70
Table 4.2 Underemployment Survey Results, Region 4 (Percent, continued) County/WIAA St. Clair
Job Satisfaction and Employed Underemployed
Willingness to Train 23. Job Satisfaction CD D N S CS CD D N S CS
Overall Satisfaction 3.2 6.4 11.1 30.2 49.2 16.7 16.7 16.7 8.3 41.7Earnings 7.9 14.3 20.6 27.0 30.2 25.0 33.3 25.0 16.7 0.0
Retention 3.2 6.4 7.9 15.9 65.1 16.7 16.7 8.3 0.0 58.3Work 0.0 1.6 7.9 25.4 65.1 0.0 0.0 16.7 25.0 58.3
Hours 6.4 3.2 17.5 20.6 52.4 25.0 8.3 8.3 16.7 41.7Shift 7.9 3.2 14.3 17.5 57.1 16.7 8.3 8.3 8.3 58.3
Conditions 1.6 6.4 12.7 15.9 63.5 8.3 25.0 16.7 16.7 33.3Commuting Distance 7.9 4.8 14.3 15.9 57.1 16.7 8.3 25.0 0.0 50.0
24. Willingness to Train CU U N W CW CU U N W CW
For a better job 17.3 7.7 19.2 17.3 38.5 0.0 8.3 8.3 8.3 75.0If paid by workers 39.5 20.9 16.3 11.6 11.6 50.0 8.3 16.7 16.7 8.3
If co-paid by workers & Government 20.9 11.6 32.6 14.0 18.6 16.7 33.3 25.0 8.3 16.7
If paid by Government 16.3 2.3 9.3 9.3 62.8 0.0 8.3 16.7 8.3 66.7
County/WIAA ShelbyJob Satisfaction and
Employed Underemployed Willingness to Train 23. Job Satisfaction CD D N S CS CD D N S CS
Overall Satisfaction 2.5 2.5 24.7 25.9 44.4 4.8 9.5 42.9 19.1 23.8Earnings 7.4 11.1 19.8 23.5 38.3 19.1 23.8 19.1 9.5 28.6
Retention 1.2 9.9 21.0 65.4 1.2 4.8 0.0 19.1 23.8 47.6Work 0.0 1.2 12.4 33.3 53.1 0.0 0.0 23.8 38.1 38.1
Hours 2.5 7.4 8.6 16.1 65.4 0.0 9.5 14.3 14.3 61.9Shift 2.5 3.7 9.9 16.1 67.9 0.0 4.8 28.6 19.1 47.6
Conditions 0.0 4.9 9.9 29.6 55.6 0.0 9.5 19.1 28.6 42.9Commuting Distance 7.4 7.4 22.2 14.8 48.2 0.0 14.3 19.1 19.1 47.6
24. Willingness to Train CU U N W CW CU U N W CW
For a better job 30.0 7.1 8.6 11.4 41.4 25.0 0.0 10.0 15.0 45.0If paid by workers 30.6 22.5 18.4 14.3 10.2 20.0 33.3 20.0 13.3 13.3
If co-paid by workers & Government 8.2 12.2 28.6 20.4 28.6 0.0 13.3 33.3 13.3 33.3
If paid by Government 14.3 4.1 10.2 14.3 57.1 0.0 6.7 13.3 26.7 53.3
County/WIAA WalkerJob Satisfaction and
Employed Underemployed Willingness to Train 23. Job Satisfaction CD D N S CS CD D N S CS
Overall Satisfaction 3.5 3.5 19.3 19.3 54.4 10.0 5.0 30.0 20.0 35.0Earnings 15.8 12.3 28.1 24.6 19.3 30.0 20.0 35.0 10.0 5.0
Retention 10.5 3.5 10.5 17.5 57.9 15.0 5.0 10.0 25.0 45.0Work 1.8 3.5 10.5 21.1 63.2 0.0 10.0 20.0 30.0 40.0
Hours 3.5 1.8 22.8 19.3 52.6 5.0 0.0 35.0 5.0 55.0Shift 3.5 0.0 12.3 17.5 66.7 5.0 0.0 15.0 15.0 65.0
Conditions 0.0 8.8 14.0 28.1 49.1 0.0 15.0 20.0 25.0 40.0Commuting Distance 3.5 10.5 14.0 10.5 61.4 0.0 0.0 20.0 5.0 75.0
24. Willingness to Train CU U N W CW CU U N W CW
For a better job 27.3 9.1 15.9 13.6 34.1 17.7 11.8 11.8 17.7 41.2If paid by workers 46.9 25.0 15.6 6.3 6.3 28.6 35.7 21.4 0.0 14.3
If co-paid by workers & Government 12.5 12.5 34.4 21.9 15.6 14.3 7.1 28.6 28.6 14.3
If paid by Government 3.1 9.4 9.4 15.6 62.5 0.0 14.3 7.1 14.3 64.3
CD = Completely dissatisfied, D = Dissatisfied, N = Neither satisfied nor dissatisfied, S = Satisfied, and CS = Completely satisfied. CU = Completely unwilling, U =Unwilling, N= Neither willing nor unwilling, W = Willing, and CW = Completely Willing. Note: Rounding errors may be present.
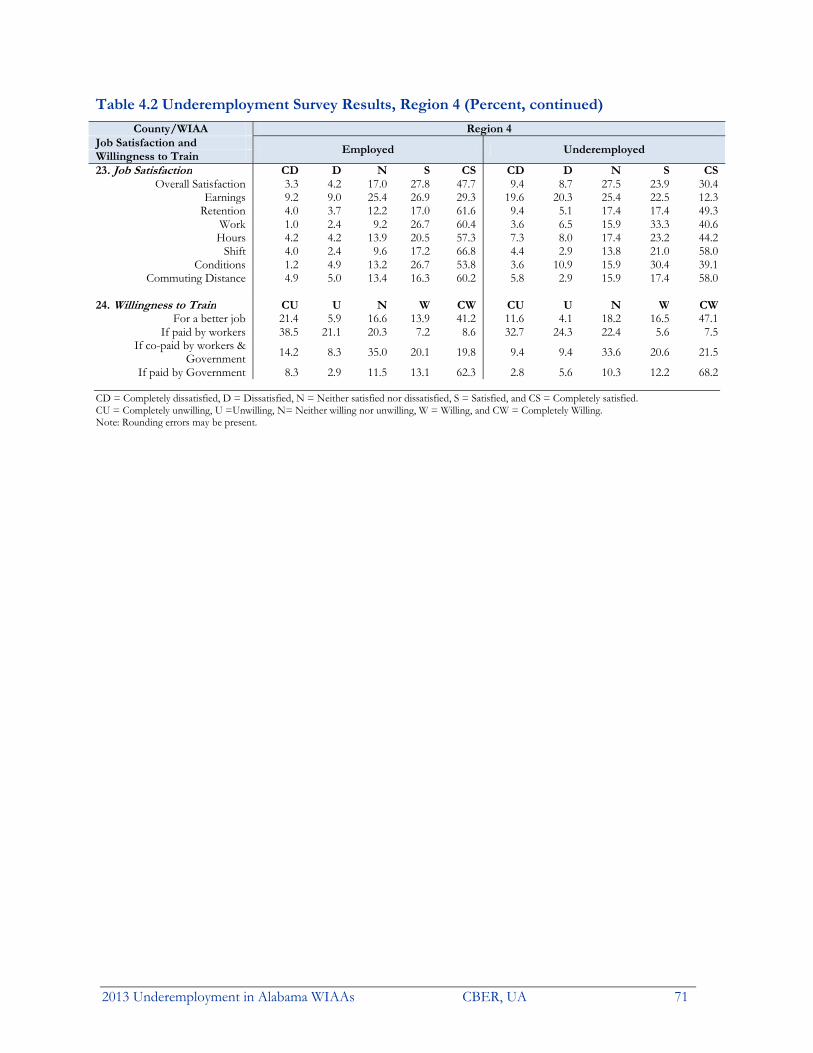
2013 Underemployment in Alabama WIAAs CBER, UA 71
Table 4.2 Underemployment Survey Results, Region 4 (Percent, continued) County/WIAA Region 4
Job Satisfaction and Employed Underemployed
Willingness to Train 23. Job Satisfaction CD D N S CS CD D N S CS
Overall Satisfaction 3.3 4.2 17.0 27.8 47.7 9.4 8.7 27.5 23.9 30.4Earnings 9.2 9.0 25.4 26.9 29.3 19.6 20.3 25.4 22.5 12.3
Retention 4.0 3.7 12.2 17.0 61.6 9.4 5.1 17.4 17.4 49.3Work 1.0 2.4 9.2 26.7 60.4 3.6 6.5 15.9 33.3 40.6
Hours 4.2 4.2 13.9 20.5 57.3 7.3 8.0 17.4 23.2 44.2Shift 4.0 2.4 9.6 17.2 66.8 4.4 2.9 13.8 21.0 58.0
Conditions 1.2 4.9 13.2 26.7 53.8 3.6 10.9 15.9 30.4 39.1Commuting Distance 4.9 5.0 13.4 16.3 60.2 5.8 2.9 15.9 17.4 58.0
24. Willingness to Train CU U N W CW CU U N W CW
For a better job 21.4 5.9 16.6 13.9 41.2 11.6 4.1 18.2 16.5 47.1If paid by workers 38.5 21.1 20.3 7.2 8.6 32.7 24.3 22.4 5.6 7.5
If co-paid by workers & Government 14.2 8.3 35.0 20.1 19.8 9.4 9.4 33.6 20.6 21.5
If paid by Government 8.3 2.9 11.5 13.1 62.3 2.8 5.6 10.3 12.2 68.2 CD = Completely dissatisfied, D = Dissatisfied, N = Neither satisfied nor dissatisfied, S = Satisfied, and CS = Completely satisfied. CU = Completely unwilling, U =Unwilling, N= Neither willing nor unwilling, W = Willing, and CW = Completely Willing. Note: Rounding errors may be present.

CBER, UA 2013 Underemployment in Alabama WIAAs 72
Underemployment in Workforce Investment Advisory Area, Region 5

2013 Underemployment in Alabama WIAAs CBER, UA 73
Underemployment in Workforce Investment Advisory Area, Region 5
WIAA Region 5 comprises of the nine counties shown in Table 5.1. The area’s underemployment rate of 23.9 percent, just a shade above the state’s 23.8 percent, means that the region had 42,200 underemployed resident workers in December 2012. Adding the unemployed gives a total available labor pool of about 55,100, which is 4.2 times the number of unemployed and a more realistic measure of the region’s available labor. To lure away the underemployed, employers must be able to offer higher wages, better benefits or terms of employment, or some other incentives. The region had 8.8 percent of the state’s underemployed and 8.7 percent of the state’s workers.
Table 5.1 Region 5 Underemployed Alabama Region 5 Calhoun Cherokee Clay CleburneLabor Force 2,154,744 189,368 53,496 11,500 5,031 6,405Employed 2,013,847 176,372 49,893 10,777 4,612 6,001Underemployment rate 23.8% 23.9% 23.9% 28.1% 27.5% 14.8%Underemployed workers 479,296 42,153 42,153 3,025 1,266 889Unemployed 140,897 12,996 12,996 723 419 404Available labor pool 620,193 55,149 55,149 3,748 1,685 1,293 Coosa Etowah Randolph Talladega TallapoosaLabor Force 4,526 45,279 8,530 37,411 17,190Employed 4,206 42,320 7,893 34,783 15,887Underemployment rate 23.6% 31.5% 19.2% 19.3% 24.6%Underemployed workers 994 13,335 1,518 6,713 3,902Unemployed 320 2,959 637 2,628 1,303Available labor pool 1,314 16,294 2,155 9,341 5,205
Note: Rounding errors may be present. Based on December 2012 labor force data and 2012 underemployment rates. Source: Center for Business and Economic Research, The University of Alabama and Alabama Department of Labor. Underemployment Survey Results
Underemployment rates range from 14.8 percent in Cleburne County to 31.5 percent in Etowah (Table 5.1) and five counties had rates that exceeded Alabama’s. The rates are multiplied by the number of employed to get the number of underemployed workers. Table 5.2 shows the detailed underemployment survey results that include characteristics of the employed, underemployed, and nonworkers. Except for rates and their implications for labor availability, detailed county-level results are not discussed because county sample sizes are sufficient for underemployment estimation but too small for making reliable inferences on characteristics.
About 78 percent of the employed are full-time workers, 12 percent hold more than one job, and 25 percent of part-time workers would like to work full-time. The one-way commute takes up to 20 minutes for 51 percent of the employed, but 14 percent take more than 40 minutes—3.8 percent spend more than an hour. Forty-one percent commute less than 10 miles, 25 percent travel more than 25 miles, and 6.5 percent exceed 45 miles. About 56 percent have 10 or more years on the job—34 percent have more than 20 years—and the median monthly wage is between $2,000 and $3,000. Health care and social assistance, manufacturing, and educational services sectors are major employers. Eighty-two percent claim their jobs fit well with their education, training, skills, and experience; 62 percent believe they are qualified for a better job and 19 percent have sought such jobs in the preceding three months. Offered up to 15 percent higher wages, 27 percent would leave their jobs, 56 percent will leave for more than that with 14 percent wanting more than a 50 percent

CBER, UA 2013 Underemployment in Alabama WIAAs 74
raise. For the higher-paying job, 33 percent will add up to 10 miles to the one-way commute but 30 percent are ready to go 20 or more extra miles; 38 percent will increase the one-way commute by more than 20 minutes while 25 percent will not consider adding more than 10 minutes.
Among the underemployed, 66 percent work full-time, 14 percent hold more than one job, and 49 percent of part-time workers want full-time work. The one-way commute takes up to 20 minutes for 49 percent and over 40 minutes for 16 percent—five percent take more than an hour. Thirty-nine percent commute less than 10 miles, 25 percent travel more than 25 miles, and seven percent exceed 45 miles. The underemployed have roughly similar job tenure as the employed, but earn less; 62 percent earn up to $2,000 monthly compared to 40 percent of all employed. There are more likely to work in health care and manufacturing sectors. Seventy-two percent say their jobs fit well with their education, training, skills, and experience; 83 percent believe they are qualified for a better job and 34 percent have sought better jobs in the preceding three months. About 34 percent would leave current job for up to 15 percent more income, 63 percent for more than 15 percent higher wages, and 16 percent want more than a 50 percent raise. For the new higher-paying job, 29 percent will add up to 10 miles to the one-way commute, but 35 percent are prepared to add 20 or more miles; 42 percent are willing to increase the one-way commute by more than 20 minutes while 22 percent will not consider more than 10 additional minutes.
Most workers in Region 5 are satisfied or completely satisfied with their jobs but the underemployed are less satisfied than all employees—76 percent versus 49 percent. Workers are more satisfied with the work they do and least satisfied with their earnings. The underemployed are most satisfied with their work shift and much less satisfied with their earnings. Workers are generally willing to train for a new or better job; 71 percent of the underemployed are willing or completely willing compared to 54 percent of all workers. The willingness to train is highest when the cost is fully borne by government and lowest when the trainee must pay the full costs. In every case of cost burden considered, the underemployed are more willing to train for the new or better job.
Of a total 1,286 respondents, 523 or 41 percent are employed. Primary reasons for being underemployed are lack of job opportunities, low wages at available jobs, live too far from jobs, and other family/personal responsibilities. Major reasons for not working are retirement, disability or other health concerns, social security limitations, and lack of job opportunities. Sixty-nine percent of the employed, 53 percent of nonworkers, and 60 percent underemployed are married. Men were 47 percent of employed, 34 percent of nonworkers, and 46 percent of underemployed. The median age is 51 for all employed, 50 underemployed, and 66 for nonworkers. Roughly 84 percent of employed, 77 percent of nonworkers, and 78 percent of underemployed are white; Hispanics are a tiny portion of respondents. About 13 percent of all employed, 18 percent of underemployed, and 19 percent of nonworkers are African-Americans or other non-white ethnic groups.
Seven percent of the employed and 10 percent of the underemployed do not hold a high school diploma or equivalent, compared to 20 percent of nonworkers. Thirty-three percent of employed, 32 percent of underemployed, and 16 percent of nonworkers hold a bachelor’s or higher degree. WIAA Region 5 has a large labor pool (about 55,100) that is willing to commute and is seeking higher wage jobs.

2013 Underemployment in Alabama WIAAs CBER, UA 75
Table 5.2 Underemployment Survey Results, Region 5 (Percent) County/WIAA Calhoun Cherokee Clay Cleburne
General Emp Und Emp Und Emp Und Emp Und
1. Percent of adults that are working full-time 75.8 70.0 75.4 50.0 76.0 71.4 76.0 62.5 2. Percent of part-timers who wish to work full-time 29.4 66.7 28.6 50.0 25.0 50.0 30.8 66.7 3. Percent of workers with more than one job 10.5 18.8 17.5 6.3 15.7 21.4 3.7 0.0 4. Average commute time (one-way) Up to 20 minutes 59.7 43.8 47.4 50.0 43.1 42.9 40.7 25.0
20 to 40 minutes 23.9 31.3 33.3 25.0 29.4 35.7 42.6 62.540 minutes to an hour 7.5 6.3 17.5 18.8 17.7 21.4 9.3 12.5
More than an hour 7.5 12.5 1.8 6.3 3.9 0.0 1.9 0.0 5. Commute distance Less than 10 miles 48.5 26.7 36.8 37.5 38.8 42.9 33.3 37.5
10 to 25 miles 31.8 40.0 28.1 25.0 32.7 28.6 41.2 25.025 to 45 miles 12.1 20.0 28.1 31.3 18.4 14.3 19.6 25.0
More than 45 miles 7.6 13.3 5.3 6.3 8.2 7.1 3.9 0.0 6. Occupation Management 10.5 6.3 8.8 12.5 17.7 28.6 7.4 0.0
Business/Financial Operations 6.0 0.0 7.0 0.0 3.9 7.1 3.7 0.0Computer/Mathematical 3.0 6.3 1.8 0.0 0.0 0.0 1.9 0.0
Architecture/Engineering 3.0 0.0 1.8 0.0 2.0 0.0 3.7 0.0Life/Physical/Social Science 0.0 0.0 1.8 6.3 0.0 0.0 0.0 0.0Community /Social Services 0.0 0.0 1.8 0.0 2.0 0.0 1.9 0.0
Legal 4.5 6.3 3.5 0.0 0.0 0.0 0.0 0.0Education/Training/Library 9.0 6.3 8.8 6.3 5.9 7.1 7.4 12.5
Arts/Design/Entertainment/Sports/Media 1.5 0.0 1.8 0.0 0.0 0.0 0.0 0.0Healthcare Practitioners/Technicians 1.5 0.0 8.8 6.3 3.9 0.0 3.7 0.0
Healthcare Support 4.5 6.3 1.8 6.3 5.9 0.0 5.6 12.5Protective Service 1.5 0.0 3.5 6.3 2.0 0.0 0.0 0.0
Food Preparation/Serving Related 4.5 12.5 0.0 0.0 2.0 0.0 0.0 0.0Building/Grounds Cleaning/Maintenance. 1.5 0.0 3.5 0.0 2.0 0.0 1.9 0.0
Personal Care/Service 1.5 0.0 0.0 0.0 0.0 0.0 3.7 0.0Sales and Related 6.0 6.3 3.5 12.5 2.0 0.0 5.6 0.0
Office/Administrative Support 7.5 6.3 5.3 0.0 3.9 0.0 9.3 12.5Farming/Fishing/Forestry 0.0 0.0 1.8 0.0 3.9 0.0 1.9 12.5
Construction/Extraction 4.5 12.5 8.8 0.0 3.9 7.1 5.6 0.0Installation/Maintenance/Repair 10.5 6.3 1.8 0.0 9.8 0.0 13.0 12.5
Production 7.5 6.3 7.0 6.3 2.0 0.0 9.3 12.5Transportation/Material Moving 4.5 6.3 7.0 12.5 5.9 0.0 1.9 12.5
other 7.5 12.5 10.5 25.0 21.6 0.0 13.0 12.5 7. Industry Agriculture/Forestry/Fishing/Hunting 1.5 0.0 1.8 0.0 7.8 7.1 3.7 12.5
Mining 0.0 0.0 0.0 0.0 0.0 0.0 0.0 0.0Utilities 3.0 0.0 5.3 0.0 3.9 7.1 1.9 0.0
Construction 6.0 18.8 5.3 0.0 7.8 14.3 5.6 0.0Manufacturing 9.0 6.3 15.8 12.5 17.7 21.4 16.7 12.5
Wholesale Trade 0.0 0.0 0.0 0.0 0.0 0.0 0.0 0.0Retail Trade 6.0 6.3 3.5 6.3 2.0 7.1 5.6 0.0
Transportation/Warehousing 3.0 6.3 3.5 12.5 5.9 7.1 5.6 12.5Information 0.0 0.0 0.0 0.0 0.0 0.0 1.9 0.0
Finance/Insurance 7.5 6.3 3.5 0.0 2.0 0.0 1.9 0.0Real Estate/Rental/Leasing 0.0 0.0 1.8 6.3 0.0 0.0 0.0 0.0
Professional/Scientific/Technical Services 1.5 0.0 0.0 0.0 0.0 0.0 1.9 0.0Management of Companies/Enterprises 0.0 0.0 0.0 0.0 0.0 0.0 0.0 0.0
Administrative/Support/Waste Management/Remediation 1.5 6.3 0.0 0.0 3.9 7.1 0.0 0.0Educational Services 11.9 6.3 10.5 12.5 7.8 7.1 13.0 12.5
Health Care/Social Assistance 13.4 18.8 15.8 18.8 7.7 14.3 14.8 12.5Arts/Entertainment/Recreation 0.0 0.0 1.8 0.0 2.0 0.0 0.0 0.0Accommodation/Food Services 6.0 12.5 3.5 6.3 2.0 0.0 3.7 0.0
Public Administration 3.0 0.0 5.3 6.3 0.0 0.0 1.9 0.0Other 10.5 6.3 8.8 0.0 7.8 7.1 5.6 0.0
Emp – Employed Und – Underemployed NnW – Nonworkers Note: Rounding errors may be present. Responses to the questions on occupation and industry should only be used for making comparisons between
the employed and the underemployed and not for indicating worker distribution by occupation or industry.

CBER, UA 2013 Underemployment in Alabama WIAAs 76
Table 5.2 Underemployment Survey Results, Region 5 (Percent) County/WIAA Coosa Etowah Randolph Talladega
General Emp Und Emp Und Emp Und Emp Und
1. Percent of adults that are working full-time 80.0 76.9 73.2 60.9 80.8 80.0 82.1 63.6 2. Percent of part-timers who wish to work full-time 18.2 33.3 28.6 44.4 20.0 50.0 45.5 75.0 3. Percent of workers with more than one job 14.6 15.4 12.3 8.7 15.4 10.0 7.0 18.2 4. Average commute time (one-way) Up to 20 minutes 36.4 38.5 56.2 52.2 53.9 60.0 59.7 54.6
20 to 40 minutes 43.6 30.8 31.5 30.4 26.9 30.0 28.1 36.440 minutes to an hour 12.7 15.4 5.5 13.0 11.5 0.0 8.8 9.1
More than an hour 1.8 7.7 2.7 4.4 5.8 0.0 3.5 0.0 5. Commute distance Less than 10 miles 24.5 23.1 40.0 43.5 47.1 55.6 52.6 27.3
10 to 25 miles 35.9 38.5 44.3 34.8 23.5 33.3 28.1 45.525 to 45 miles 30.2 15.4 11.4 13.0 15.7 11.1 15.8 18.2
More than 45 miles 5.7 15.4 4.3 8.7 13.7 0.0 1.8 0.0 6. Occupation Management 3.6 0.0 9.6 4.4 13.5 10.0 7.0 9.1
Business/Financial Operations 9.1 7.7 9.6 17.4 0.0 0.0 7.0 9.1Computer/Mathematical 1.8 7.7 4.1 4.4 3.9 0.0 0.0 0.0
Architecture/Engineering 1.8 0.0 0.0 0.0 1.9 0.0 1.8 0.0Life/Physical/Social Science 1.8 0.0 1.4 4.4 1.9 0.0 1.8 0.0Community /Social Services 3.6 0.0 1.4 4.4 0.0 0.0 7.0 9.1
Legal 1.8 0.0 2.7 0.0 1.9 0.0 1.8 0.0Education/Training/Library 9.1 15.4 12.3 4.4 15.4 0.0 7.0 9.1
Arts/Design/Entertainment/Sports/Media 1.8 0.0 2.7 4.4 0.0 0.0 3.5 0.0Healthcare Practitioners/Technicians 7.3 7.7 4.1 0.0 5.8 0.0 7.0 9.1
Healthcare Support 1.8 0.0 5.5 8.7 0.0 0.0 0.0 0.0Protective Service 1.8 0.0 2.7 4.4 1.9 10.0 0.0 0.0
Food Preparation/Serving Related 3.6 0.0 4.1 4.4 3.9 10.0 3.5 9.1Building/Grounds Cleaning/Maintenance. 1.8 7.7 1.4 0.0 0.0 0.0 3.5 9.1
Personal Care/Service 1.8 7.7 4.1 0.0 5.8 10.0 0.0 0.0Sales and Related 1.8 0.0 8.2 8.7 3.9 20.0 7.0 0.0
Office/Administrative Support 3.6 7.7 4.1 0.0 7.7 20.0 0.0 0.0Farming/Fishing/Forestry 1.8 0.0 0.0 0.0 1.9 0.0 1.8 0.0
Construction/Extraction 1.8 0.0 1.4 4.4 1.9 0.0 5.3 0.0Installation/Maintenance/Repair 7.3 15.4 8.2 13.0 5.8 0.0 3.5 0.0
Production 7.3 7.7 0.0 0.0 5.8 10.0 8.8 9.1Transportation/Material Moving 5.5 7.7 5.5 4.4 3.9 0.0 5.3 9.1
other 18.2 7.7 6.9 8.7 13.5 10.0 17.5 9.1 7. Industry Agriculture/Forestry/Fishing/Hunting 3.6 0.0 1.4 0.0 0.0 0.0 1.8 0.0
Mining 0.0 0.0 0.0 0.0 0.0 0.0 1.8 9.1Utilities 5.5 7.7 1.4 0.0 7.7 0.0 3.5 0.0
Construction 1.8 7.7 1.4 0.0 3.9 10.0 5.3 9.1Manufacturing 14.6 15.4 6.9 17.4 17.3 30.0 17.5 18.2
Wholesale Trade 3.6 0.0 1.4 0.0 0.0 0.0 0.0 0.0Retail Trade 3.6 0.0 9.6 17.4 7.7 10.0 7.0 0.0
Transportation/Warehousing 3.6 7.7 8.2 0.0 3.9 0.0 5.3 18.2Information 1.8 7.7 1.4 0.0 0.0 0.0 0.0 0.0
Finance/Insurance 1.8 0.0 4.1 4.4 0.0 0.0 1.8 0.0Real Estate/Rental/Leasing 0.0 0.0 1.4 0.0 0.0 0.0 1.8 0.0
Professional/Scientific/Technical Services 0.0 0.0 4.1 0.0 3.9 0.0 0.0 0.0Management of Companies/Enterprises 1.8 0.0 1.4 0.0 1.9 0.0 0.0 0.0
Administrative/Support/Waste Management/Remediation 1.8 0.0 0.0 0.0 0.0 0.0 0.0 0.0Educational Services 10.9 23.1 6.9 4.4 19.2 10.0 15.8 9.1
Health Care/Social Assistance 9.1 7.7 23.3 26.1 11.5 30.0 14.0 18.2Arts/Entertainment/Recreation 1.8 0.0 0.0 0.0 1.9 0.0 1.8 0.0Accommodation/Food Services 1.8 0.0 5.5 4.4 1.9 0.0 3.5 9.1
Public Administration 7.3 7.7 2.7 0.0 5.8 10.0 0.0 0.0Other 9.1 15.4 9.6 8.7 7.7 0.0 8.8 0.0
Emp – Employed Und – Underemployed NnW – Nonworkers Note: Rounding errors may be present. Responses to the questions on occupation and industry should only be used for making comparisons between
the employed and the underemployed and not for indicating worker distribution by occupation or industry.

2013 Underemployment in Alabama WIAAs CBER, UA 77
Table 5.2 Underemployment Survey Results, Region 5 (Percent) County/WIAA Tallapoosa Region 5
General Emp Und Emp Und
1. Percent of adults that are working full-time 76.8 71.4 77.6 65.6 2. Percent of part-timers who wish to work full-time 0.0 75.0 25.4 48.8 3. Percent of workers with more than one job 12.3 28.6 12.1 14.4 4. Average commute time (one-way) Up to 20 minutes 59.7 64.3 51.2 48.8
20 to 40 minutes 28.1 28.6 31.7 32.840 minutes to an hour 7.0 0.0 10.5 11.2
More than an hour 5.3 7.1 3.8 4.8 5. Commute distance Less than 10 miles 47.4 57.1 41.3 39.0
10 to 25 miles 26.3 21.4 32.7 32.525 to 45 miles 15.8 14.3 18.2 17.9
More than 45 miles 8.8 7.1 6.5 7.3 6. Occupation Management 17.5 28.6 10.5 11.2
Business/Financial Operations 7.0 0.0 6.1 5.6Computer/Mathematical 0.0 0.0 1.9 2.4
Architecture/Engineering 7.0 0.0 2.5 0.0Life/Physical/Social Science 0.0 0.0 1.0 1.6Community /Social Services 1.8 0.0 2.1 1.6
Legal 0.0 0.0 1.9 0.8Education/Training/Library 10.5 7.1 9.6 7.2
Arts/Design/Entertainment/Sports/Media 0.0 0.0 1.3 0.8Healthcare Practitioners/Technicians 7.0 14.3 5.4 4.0
Healthcare Support 7.0 14.3 3.6 5.6Protective Service 1.8 0.0 1.7 2.4
Food Preparation/Serving Related 3.5 0.0 2.9 4.0Building/Grounds Cleaning/Maintenance. 5.3 7.1 2.3 2.4
Personal Care/Service 3.5 0.0 2.3 1.6Sales and Related 3.5 0.0 4.8 5.6
Office/Administrative Support 8.8 7.1 5.5 4.8Farming/Fishing/Forestry 0.0 0.0 1.3 1.6
Construction/Extraction 5.3 0.0 4.2 2.4Installation/Maintenance/Repair 3.5 7.1 7.1 9.6
Production 1.8 7.1 5.4 6.4Transportation/Material Moving 1.8 7.1 4.6 7.2
other 3.5 0.0 12.1 11.2 7. Industry Agriculture/Forestry/Fishing/Hunting 1.8 0.0 2.5 1.6
Mining 0.0 0.0 0.2 0.8Utilities 3.5 0.0 3.8 1.6
Construction 5.3 0.0 4.6 6.4Manufacturing 17.5 14.3 14.3 16.0
Wholesale Trade 1.8 0.0 0.8 0.0Retail Trade 5.3 0.0 5.7 6.4
Transportation/Warehousing 7.0 14.3 5.2 8.0Information 0.0 0.0 0.6 0.8
Finance/Insurance 3.5 0.0 3.1 1.6Real Estate/Rental/Leasing 3.5 7.1 1.0 1.6
Professional/Scientific/Technical Services 1.8 0.0 1.5 0.0Management of Companies/Enterprises 0.0 0.0 0.6 0.0
Administrative/Support/Waste Management/Remediation 0.0 0.0 0.8 1.6Educational Services 10.5 14.3 11.7 11.2
Health Care/Social Assistance 17.5 28.6 15.5 20.0Arts/Entertainment/Recreation 1.8 0.0 1.2 0.0Accommodation/Food Services 3.5 7.1 3.6 4.8
Public Administration 3.5 0.0 3.3 2.4Other 8.8 14.3 8.6 6.4
Emp – Employed Und – Underemployed NnW – Nonworkers Note: Rounding errors may be present. Responses to the questions on occupation and industry should only be used for making comparisons between
the employed and the underemployed and not for indicating worker distribution by occupation or industry.

CBER, UA 2013 Underemployment in Alabama WIAAs 78
Table 5.2 Underemployment Survey Results, Region 5 (Percent, continued) County/WIAA Calhoun Cherokee Clay Cleburne
Emp Und Emp Und Emp Und Emp Und
8. Years at current/primary job Less than a year 10.5 6.3 12.3 12.5 15.7 7.1 11.1 12.5 1 to 3 years 13.4 18.8 8.8 6.3 7.8 7.1 11.1 25.03 to 5 years 6.0 12.5 5.3 0.0 3.9 0.0 3.7 0.0
5 to 10 years 19.4 12.5 19.3 12.5 19.6 28.6 13.0 37.510 to 20 years 20.9 18.8 24.6 43.8 17.7 28.6 22.2 25.0
More than 20 years 28.4 31.3 29.8 25.0 35.3 28.6 38.9 0.0
9. Monthly wages Less than $500 7.5 12.5 7.0 12.5 7.8 7.1 5.6 12.5$500 up to $1,000 10.5 18.8 7.0 18.8 13.7 28.6 11.1 12.5
$1,000 up to $2,000 22.4 18.8 26.3 31.3 11.8 21.4 31.5 50.0$2,000 up to $3,000 19.4 25.0 14.0 6.3 23.5 14.3 11.1 12.5$3,000 up to $4,000 7.5 6.3 14.0 12.5 19.6 21.4 9.3 0.0$4,000 up to $6,000 16.4 12.5 8.8 0.0 5.9 0.0 18.5 12.5
More than $6,000 7.5 6.3 15.8 6.3 9.8 7.1 5.6 0.0Job Fitness 10. Percent of workers whose current job fits well with their education and training, skills, and experience
79.1 50.0 80.7 62.5 88.2 92.9 87.0 75.0
11. Percent of workers who believe they are qualified for a better job
68.7 93.8 57.9 81.3 74.5 78.6 53.7 75.0
Reasons: Education and training 100.0 100.0 97.0 92.3 86.8 100.0 96.6 100.0Skills 100.0 100.0 97.0 100.0 92.1 100.0 96.6 100.0
Experience 95.7 93.3 100.0 100.0 92.1 90.9 96.6 83.3 12. Additional income for which workers would leave current job
0 to 5% more 13.6 9.1 4.0 0.0 4.0 0.0 3.6 0.05 to 15% more 25.0 27.3 12.0 25.0 36.0 75.0 17.9 0.0
15 to 30% more 20.5 36.4 40.0 50.0 20.0 0.0 32.1 66.730 to 50% more 13.6 18.2 12.0 12.5 8.0 0.0 17.9 0.0
More than 50% more 13.6 9.1 12.0 12.5 28.0 25.0 14.3 33.3 *** Would not leave current job 9.1 0.0 12.0 0.0 4.0 0.0 10.7 0.0
13. Additional commute for new job 0 to 10 miles 39.0 26.7 28.9 23.1 34.1 25.0 33.3 50.0
10 to 20 miles 32.2 33.3 44.4 38.5 34.1 25.0 26.7 12.5more than 20 miles 25.4 33.3 24.4 38.5 27.3 50.0 33.3 37.5
14. Additional one-way commute time 0 to 10 minutes 28.8 20.0 31.1 23.1 29.6 33.3 17.8 12.5
10 to 20 minutes 37.3 26.7 37.8 30.8 25.0 25.0 31.1 37.5more than 20 minutes 32.2 46.7 31.1 46.2 38.6 41.7 46.7 50.0
15. Percent of workers who sought better job in past three months
25.4 46.7 20.0 38.5 13.6 16.7 15.6 50.0
Underemployment 16. Percent of workers who say they are currently underemployed
23.9 28.1 27.5
14.8
17. Reasons respondents give for being Und NnW Und NnW Und NnW Und NnW
A lack of job opportunities in their area 81.3 24.8 75.0 22.9 71.4 33.3 87.5 28.4The low wages at the available jobs 62.5 21.9 62.5 15.7 57.1 19.7 75.0 23.9
They live too far from jobs 43.8 15.2 37.5 18.1 42.9 16.7 62.5 32.8They are in school or undergoing training 0.0 1.9 6.3 1.2 7.1 6.1 50.0 3.0
Their spouse or partner has a really good job 12.5 4.8 0.0 4.8 14.3 6.1 25.0 4.5They are retired 6.3 69.5 31.3 73.5 21.4 69.7 0.0 61.2
Because of social security limitations 12.5 29.5 12.5 34.9 0.0 27.3 0.0 26.9Disability or other health concerns 6.3 46.7 18.8 48.2 14.3 60.6 12.5 41.8
Child care responsibilities 25.0 10.5 18.8 2.4 21.4 7.6 37.5 14.9They take care of someone other than a child 25.0 11.4 25.0 12.1 14.3 9.1 0.0 9.0
Other family or personal obligations 43.8 15.2 31.3 10.8 50.0 9.1 12.5 11.9Owning a house in your area 45.5 26.5 25.0 16.4 30.8 19.7 20.0 24.1
Something else 18.8 15.2 18.8 19.3 0.0 18.2 12.5 16.4
Emp – Employed Und – Underemployed NnW – Nonworkers Note: Rounding errors may be present.

2013 Underemployment in Alabama WIAAs CBER, UA 79
Table 5.2 Underemployment Survey Results, Region 5 (Percent, continued) County/WIAA Coosa Etowah Randolph Talladega
Emp Und Emp Und Emp Und Emp Und
8. Years at current/primary job Less than a year 9.1 23.1 12.3 8.7 13.5 20.0 19.3 27.3 1 to 3 years 5.5 7.7 1.4 4.4 1.9 10.0 7.0 0.03 to 5 years 7.3 0.0 2.7 4.4 5.8 0.0 8.8 9.1
5 to 10 years 14.6 23.1 13.7 8.7 23.1 20.0 19.3 36.410 to 20 years 23.6 23.1 24.7 17.4 25.0 30.0 12.3 9.1
More than 20 years 40.0 23.1 42.5 56.5 28.9 10.0 29.8 9.1
9. Monthly wages Less than $500 3.6 0.0 8.2 17.4 5.8 10.0 5.3 27.3$500 up to $1,000 14.6 23.1 11.0 17.4 9.6 30.0 5.3 9.1
$1,000 up to $2,000 21.8 46.2 21.9 17.4 26.9 30.0 24.6 36.4$2,000 up to $3,000 18.2 23.1 15.1 21.7 13.5 10.0 15.8 9.1$3,000 up to $4,000 12.7 0.0 12.3 13.0 13.5 10.0 17.5 9.1$4,000 up to $6,000 12.7 7.7 9.6 4.4 15.4 10.0 14.0 9.1
More than $6,000 7.3 0.0 16.4 0.0 13.5 0.0 10.5 0.0Job Fitness 10. Percent of workers whose current job fits well with their education and training, skills, and experience 78.2 69.2 80.8 65.2 80.8 80.0 82.5 90.9 11. Percent of workers who believe they are qualified for a better job
56.4 100.0 63.0 87.0 63.5 80.0 66.7 81.8
Reasons: Education and training 93.6 84.6 95.7 95.0 97.0 100.0 94.7 100.0Skills 87.1 92.3 93.5 95.0 90.9 100.0 100.0 100.0
Experience 100.0 100.0 91.3 95.0 90.9 100.0 89.5 77.8 12. Additional income for which workers would leave current job
0 to 5% more 0.0 0.0 10.9 16.7 6.9 20.0 8.3 0.05 to 15% more 20.8 12.5 21.7 33.3 10.3 0.0 16.7 50.0
15 to 30% more 20.8 50.0 28.3 25.0 37.9 60.0 29.2 0.030 to 50% more 16.7 25.0 15.2 8.3 10.3 0.0 25.0 0.0
More than 50% more 8.3 0.0 13.0 16.7 10.3 20.0 12.5 50.0 *** Would not leave current job 20.8 0.0 10.9 0.0 17.2 0.0 8.3 0.0
13. Additional commute for new job 0 to 10 miles 35.0 25.0 27.0 34.8 41.9 50.0 30.8 9.1
10 to 20 miles 35.0 33.3 39.7 34.8 30.2 50.0 34.6 63.6more than 20 miles 30.0 41.7 31.8 30.4 27.9 0.0 34.6 27.3
14. Additional one-way commute time 0 to 10 minutes 22.5 16.7 23.8 34.8 25.6 12.5 21.2 0.0
10 to 20 minutes 42.5 41.7 42.9 39.1 30.2 62.5 28.9 54.6more than 20 minutes 35.0 41.7 31.8 26.1 44.2 25.0 48.1 45.5
15. Percent of workers who sought better job in past three months
20.0 41.7 20.6 26.1 11.6 25.0 23.1 45.5
Underemployment 16. Percent of workers who say they are currently underemployed
23.6
31.5 19.2
19.3
17. Reasons respondents give for being Und NnW Und NnW Und NnW Und NnW
A lack of job opportunities in their area 76.9 31.1 69.6 18.3 50.0 31.8 90.9 25.0The low wages at the available jobs 69.2 21.1 65.2 7.5 70.0 17.1 72.7 25.0
They live too far from jobs 61.5 24.4 43.5 4.3 50.0 22.7 54.6 17.7They are in school or undergoing training 7.7 3.3 13.0 3.2 0.0 2.3 0.0 6.3
Their spouse or partner has a really good job 15.4 7.8 30.4 11.8 20.0 8.0 90.9 13.5They are retired 7.7 61.1 8.7 65.6 0.0 71.6 9.1 65.6
Because of social security limitations 15.4 20.0 13.0 28.0 0.0 29.6 9.1 26.0Disability or other health concerns 23.1 46.7 13.0 46.2 0.0 43.2 0.0 59.4
Child care responsibilities 46.2 5.6 34.8 11.8 20.0 8.0 9.1 9.4They take care of someone other than a child 23.1 13.3 34.8 14.0 30.0 9.1 27.3 16.7
Other family or personal obligations 30.8 16.7 43.5 14.0 30.0 6.8 27.3 13.5Owning a house in your area 36.4 15.5 30.0 14.8 42.9 14.1 25.0 18.2
Something else 23.1 16.7 21.7 22.6 30.0 22.7 9.1 20.8
Emp – Employed Und – Underemployed NnW – Nonworkers Note: Rounding errors may be present.

CBER, UA 2013 Underemployment in Alabama WIAAs 80
Table 5.2 Underemployment Survey Results, Region 5 (Percent, continued) County/WIAA Tallapoosa Region 5
Emp Und Emp Und
8. Years at current/primary job Less than a year 17.5 14.3 13.4 13.6 1 to 3 years 5.3 7.1 6.9 8.83 to 5 years 10.5 14.3 5.9 4.8
5 to 10 years 8.8 7.1 16.6 16.010 to 20 years 22.8 35.7 21.6 26.4
More than 20 years 33.3 21.4 34.2 28.8
9. Monthly wages Less than $500 1.8 0.0 5.9 11.2$500 up to $1,000 12.3 21.4 10.5 20.0
$1,000 up to $2,000 26.3 42.9 23.7 30.4$2,000 up to $3,000 14.0 0.0 16.1 14.4$3,000 up to $4,000 14.0 14.3 13.2 10.4$4,000 up to $6,000 19.3 14.3 13.4 5.6
More than $6,000 8.8 7.1 8.2 4.2Job Fitness 10. Percent of workers whose current job fits well with their education and training, skills, and experience
86.0 78.6 82.4 72.0
11. Percent of workers who believe they are qualified for a better job
54.4 64.3 62.1 83.2
Reasons: Education and training 93.6 100.0 95.1 96.2Skills 96.8 100.0 95.1 98.1
Experience 96.8 100.0 94.5 94.2 12. Additional income for which workers would leave current job
0 to 5% more 4.0 0.0 7.0 7.15 to 15% more 20.0 33.3 20.4 26.8
15 to 30% more 12.0 0.0 26.7 35.730 to 50% more 24.0 0.0 15.6 10.7
More than 50% more 16.0 66.7 14.1 16.1 *** Would not leave current job 20.0 0.0 12.2 1.8
13. Additional commute for new job 0 to 10 miles 31.8 25.0 33.3 29.0
10 to 20 miles 34.1 16.7 34.7 34.2more than 20 miles 31.8 50.0 29.7 35.1
14. Additional one-way commute time 0 to 10 minutes 25.0 25.0 25.1 21.9
10 to 20 minutes 38.6 8.3 35.2 35.1more than 20 minutes 36.4 66.7 37.9 42.1
15. Percent of workers who sought better job in past three months
18.2 25.0 19.1 34.2
Underemployment 16. Percent of workers who say they are currently underemployed
24.6 23.9
17. Reasons respondents give for being Und NnW Und NnW
A lack of job opportunities in their area 57.1 21.3 72.8 26.1The low wages at the available jobs 50.0 10.7 64.0 18.1
They live too far from jobs 21.4 10.7 44.8 17.7They are in school or undergoing training 0.0 4.0 8.0 3.4
Their spouse or partner has a really good job 21.4 5.3 16.0 7.6They are retired 21.4 69.3 12.8 67.5
Because of social security limitations 14.3 26.7 9.6 27.7Disability or other health concerns 7.1 49.3 11.2 49.0
Child care responsibilities 50.0 5.3 29.6 8.4They take care of someone other than a child 7.1 10.7 21.6 11.9
Other family or personal obligations 21.4 8.0 34.4 12.1Owning a house in your area 20.0 26.5 30.7 19.4
Something else 28.6 21.3 18.4 19.3
Emp – Employed Und – Underemployed NnW – Nonworkers Note: Rounding errors may be present.

2013 Underemployment in Alabama WIAAs CBER, UA 81
Table 5.2 Underemployment Survey Results, Region 5 (Percent, continued)
County/WIAA Calhoun Cherokee Clay Cleburne
Selected Emp NnW Und Emp NnW Und Emp NnW Und Emp NnW UndCharacteristics 18. Married Respondents 64.2 45.7 56.3 79.0 50.6 81.3 74.5 56.1 78.6 68.5 61.2 62.5 19. Sex Female 50.8 75.2 40.0 45.6 62.7 56.3 47.1 59.1 42.9 53.7 76.1 50.0
Male 49.3 24.8 56.3 54.4 37.4 43.8 52.9 40.9 57.1 46.3 23.9 50.0 20. Median age (years) 46 69 45 54 67 53 53 69 50 50 64 38.5 21. Ethnicity Hispanic 1.5 1.0 0.0 0.0 0.0 0.0 0.0 3.0 0.0 0.0 1.5 0.0
21b. Race White 76.1 76.2 62.5 96.5 94.0 100.0 88.2 84.9 78.6 94.4 88.1 87.5African-American/Other 16.4 20.0 25.0 0.0 2.4 0.0 11.8 13.6 21.4 1.9 9.0 12.5
22. Last school grade
High Sch./less, no diploma 7.5 15.2 18.8 5.3 20.5 0.0 7.8 25.8 0.0 9.3 19.4 12.5High School or GED 16.4 31.4 12.5 28.1 34.9 43.8 41.2 51.5 43.8 31.5 55.2 12.5
Some college, no degree 29.9 21.9 25.0 10.5 12.1 12.5 9.8 9.1 12.5 20.4 9.0 50.0Jr. College/trade
school/associate degree 10.5 12.4 6.3 15.8 9.6 12.5 13.7 7.6 12.5 13.0 4.5 12.5
4-year college graduate/BA 20.9 9.5 18.8 22.8 16.9 18.8 17.7 0.0 18.8 11.1 7.5 0.0Postgraduate/Masters 14.9 7.6 18.8 17.5 4.8 12.5 9.8 6.1 12.5 14.8 4.5 12.5
County/WIAA Coosa Etowah Randolph Talladega Selected Emp NnW Und Emp NnW Und Emp NnW Und Emp NnW UndCharacteristics 18. Married Respondents 67.3 57.8 61.5 67.1 48.4 52.2 65.4 56.8 40.0 66.7 54.2 54.6 19. Sex Female 56.4 62.2 53.9 63.0 65.6 65.2 63.5 65.9 70.0 49.1 66.7 45.5
Male 43.6 37.8 46.2 37.0 34.4 34.8 36.5 34.1 30.0 50.9 33.3 54.6 20. Median age (years) 51.5 62 51 51 67 51 51.5 66 50.5 50 64 47 21. Ethnicity Hispanic 0.0 1.1 0.0 0.0 2.2 0.0 1.9 1.1 10.0 0.0 2.1 0.0
21b. Race White 69.1 60.0 53.9 84.9 82.8 78.3 84.6 81.8 80.0 70.2 57.3 72.7African-American/Other 30.9 32.2 46.2 12.3 11.8 13.0 13.5 15.9 10.0 19.3 38.6 27.3
22. Last school grade
High Sch./less, no diploma 16.4 20.0 15.4 5.5 20.4 8.7 3.9 22.7 0.0 8.8 21.9 27.3High School or GED 25.5 34.4 38.5 17.8 31.2 17.4 34.6 38.6 40.0 31.6 39.6 36.4
Some college, no degree 16.4 17.8 23.1 17.8 20.4 17.4 11.5 12.5 20.0 7.0 13.5 0.0Jr. College/trade
school/associate degree 12.7 7.8 0.0 23.3 7.5 17.4 17.3 12.5 0.0 15.8 11.5 18.2
4-year college graduate/BA 20.0 11.1 15.4 26.0 9.7 30.4 25.0 4.6 40.0 22.8 8.3 9.1Postgraduate/Masters 9.1 7.8 7.7 9.6 8.6 8.7 7.7 9.1 0.0 14.0 5.2 9.1
County/WIAA Tallapoosa Region 5 Selected Emp NnW Und Emp NnW UndCharacteristics 18. Married Respondents 64.9 45.3 50.0 68.5 52.6 60.0 19. Sex Female 47.4 60.0 35.7 53.2 66.2 53.6
Male 52.6 40.0 64.3 46.9 33.8 46.4 20. Median age (years) 49.5 65 50 51 66 50 21. Ethnicity Hispanic 0.0 0.0 0.0 0.4 1.3 0.8
21b. Race White 91.2 74.7 92.9 83.8 76.9 78.4African-American/Other 7.0 24.0 7.1 12.8 19.3 17.6
22. Last school grade
High Sch./less, no diploma 1.8 18.7 0.0 7.3 20.3 9.6High School or GED 24.6 29.3 14.3 27.2 37.6 26.4
Some college, no degree 15.8 14.7 21.4 15.9 15.1 20.0Jr. College/trade
school/associate degree 28.1 13.3 28.6 16.8 9.8 12.0
4-year college graduate/BA 24.6 14.7 28.6 21.4 9.3 21.6Postgraduate/Masters 5.3 8.0 7.1 11.5 7.0 10.4
Emp – Employed Und – Underemployed NnW – Nonworkers Note: Rounding errors may be present.

CBER, UA 2013 Underemployment in Alabama WIAAs 82
Table 5.2. Underemployment Survey Results, Region 5 (Percent, continued)
County/ WIAA CalhounJob Satisfaction and
Employed Underemployed Willingness to Train 23. Job Satisfaction CD D N S CS CD D N S CS
Overall Satisfaction 0.0 7.5 11.9 29.9 50.8 10.0 25.0 25.0 43.8 6.3Earnings 11.9 10.5 23.9 19.4 34.3 37.5 31.3 31.3 0.0 0.0
Retention 7.5 6.0 9.0 17.9 58.2 25.0 6.3 12.5 25.0 31.3Work 0.0 1.5 10.5 16.4 71.6 0.0 0.0 37.5 18.8 43.8
Hours 6.0 4.5 14.9 17.9 56.7 18.8 6.3 6.3 43.8 25.0Shift 3.0 7.5 3.0 14.9 71.6 0.0 18.8 0.0 18.8 62.5
Conditions 0.0 4.5 14.9 17.9 62.7 0.0 12.5 18.8 25.0 43.8Commuting Distance 6.0 4.5 10.5 16.4 62.7 18.8 6.3 18.8 12.5 43.8
24. Willingness to Train CU U N W CW CU U N W CW
For a better job 18.6 8.5 8.5 6.8 54.2 6.7 6.7 0.0 0.0 80.0If paid by workers 56.3 14.6 20.8 4.2 2.1 42.9 28.6 21.4 7.1 0.0
If co-paid by workers & Government 14.6 10.4 31.3 20.8 18.8 0.0 7.1 42.9 28.6 14.3
If paid by Government 8.3 2.1 8.3 14.6 66.7 7.1 0.0 7.1 14.3 71.4
County/ WIAA CherokeeJob Satisfaction and
Employed Underemployed Willingness to Train 23. Job Satisfaction CD D N S CS CD D N S CS
Overall Satisfaction 3.5 10.5 10.5 22.8 50.9 12.5 25.0 25.0 12.5 25.0Earnings 12.3 8.8 21.1 31.6 26.3 25.0 18.8 25.0 18.8 12.5
Retention 8.8 5.3 3.5 17.5 64.9 18.8 18.8 0.0 12.5 50.0Work 0.0 8.8 7.0 21.1 63.2 0.0 25.0 6.3 18.8 50.0
Hours 10.5 5.3 5.3 15.8 63.2 18.8 18.8 6.3 6.3 50.0Shift 5.3 5.3 10.5 17.5 61.4 6.3 12.5 12.5 37.5 31.3
Conditions 1.8 1.8 17.5 21.1 57.9 0.0 0.0 25.0 37.5 37.5Commuting Distance 8.8 8.8 12.3 8.8 59.7 12.5 6.3 18.8 0.0 62.5
24. Willingness to Train CU U N W CW CU U N W CW
For a better job 31.1 6.7 13.3 4.4 44.4 15.4 7.7 15.4 7.7 53.9If paid by workers 48.4 29.0 9.7 3.2 9.7 36.4 36.4 9.1 9.1 9.1
If co-paid by workers & Government 12.9 19.4 35.5 6.5 22.6 9.1 9.1 45.5 9.1 27.3
If paid by Government 3.2 12.9 0.0 19.4 61.3 0.0 9.1 0.0 18.2 72.7
County/ WIAA ClayJob Satisfaction and
Employed Underemployed Willingness to Train 23. Job Satisfaction CD D N S CS CD D N S CS
Overall Satisfaction 3.9 5.9 15.7 19.6 54.9 7.1 7.1 21.4 35.7 28.6Earnings 7.8 13.7 23.5 19.6 35.3 14.3 21.4 42.9 7.1 14.3
Retention 0.0 3.9 15.7 19.6 60.8 0.0 7.1 21.4 35.7 35.7Work 0.0 0.0 11.8 15.7 72.6 0.0 0.0 14.3 35.7 50.0
Hours 9.8 3.9 13.7 13.7 58.8 14.3 7.1 7.1 7.1 64.3Shift 5.9 5.9 9.8 13.7 64.7 0.0 0.0 7.1 28.6 64.3
Conditions 3.9 3.9 15.7 25.5 51.0 0.0 7.1 21.4 42.9 28.6Commuting Distance 3.9 7.8 11.8 9.8 66.7 7.1 14.3 14.3 0.0 64.3
24. Willingness to Train CU U N W CW CU U N W CW
For a better job 15.9 4.6 22.7 13.6 36.4 0.0 0.0 25.0 33.3 41.7If paid by workers 67.6 18.9 8.1 2.7 0.0 58.3 25.0 8.3 8.3 0.0
If co-paid by workers & Government 27.0 13.5 21.6 27.0 8.1 16.7 8.3 8.3 50.0 16.7
If paid by Government 18.9 0.0 13.5 13.5 51.4 8.3 0.0 8.3 16.7 66.7
CD = Completely dissatisfied, D = Dissatisfied, N = Neither satisfied nor dissatisfied, S = Satisfied, and CS = Completely satisfied. CU = Completely unwilling, U =Unwilling, N= Neither willing nor unwilling, W = Willing, and CW = Completely Willing. Note: Rounding errors may be present.

2013 Underemployment in Alabama WIAAs CBER, UA 83
Table 5.2. Underemployment Survey Results, Region 5 (Percent, continued)
County/ WIAA CleburneJob Satisfaction and
Employed Underemployed
Willingness to Train 23. Job Satisfaction CD D N S CS CD D N S CS
Overall Satisfaction 3.7 1.9 5.6 18.5 70.4 25.0 12.5 12.5 12.5 37.5Earnings 13.0 7.4 14.8 25.9 38.9 37.5 12.5 37.5 12.5 0.0
Retention 5.6 3.7 5.6 22.2 59.3 25.0 12.5 0.0 37.5 25.0Work 0.0 1.9 5.6 22.2 70.4 0.0 12.5 12.5 12.5 62.5
Hours 7.4 0.0 11.1 16.7 64.8 25.0 0.0 0.0 12.5 62.5Shift 5.6 3.7 3.7 11.1 75.9 12.5 12.5 0.0 0.0 75.0
Conditions 3.7 1.9 9.3 16.7 68.5 12.5 0.0 25.0 25.0 37.5Commuting Distance 1.9 7.4 14.8 11.1 64.8 12.5 25.0 12.5 0.0 50.0
24. Willingness to Train CU U N W CW CU U N W CW
For a better job 28.9 6.7 13.3 6.7 42.2 0.0 0.0 0.0 12.5 87.5If paid by workers 46.9 18.8 12.5 6.3 12.5 37.5 25.0 12.5 0.0 25.0
If co-paid by workers & Government 12.5 18.8 25.0 15.6 25.0 12.5 0.0 25.0 25.0 37.5
If paid by Government 0.0 0.0 9.4 28.1 62.5 0.0 0.0 0.0 0.0 100.0
County/ WIAA CoosaJob Satisfaction and
Employed Underemployed Willingness to Train 23. Job Satisfaction CD D N S CS CD D N S CS
Overall Satisfaction 3.6 9.1 12.7 29.1 45.5 7.7 15.4 23.1 46.2 7.7Earnings 9.1 16.4 32.7 12.7 29.1 23.1 30.8 46.2 0.0 0.0
Retention 0.0 3.6 20.0 21.8 54.6 0.0 0.0 38.5 38.5 23.1Work 3.6 0.0 10.9 16.4 69.1 7.7 0.0 15.4 23.1 53.9
Hours 3.6 1.8 18.2 18.2 56.4 7.7 0.0 38.5 23.1 30.8Shift 1.8 0.0 16.4 14.6 67.3 0.0 0.0 23.1 30.8 46.2
Conditions 7.3 5.5 14.6 20.0 52.7 15.4 15.4 15.4 30.8 23.1Commuting Distance 9.1 5.5 14.6 10.9 60.0 15.4 0.0 15.4 23.1 46.2
24. Willingness to Train CU U N W CW CU U N W CW
For a better job 22.5 5.0 7.5 25.0 40.0 0.0 8.3 8.3 33.3 50.0If paid by workers 38.7 29.0 12.9 9.7 9.7 25.0 33.3 16.7 16.7 8.3
If co-paid by workers & Government 16.1 12.9 29.0 16.1 22.6 8.3 8.3 33.3 25.0 16.7
If paid by Government 6.5 3.2 6.5 16.1 67.7 0.0 0.0 8.3 8.3 83.3
County/ WIAA EtowahJob Satisfaction and
Employed Underemployed Willingness to Train 23. Job Satisfaction CD D N S CS CD D N S CS
Overall Satisfaction 4.1 0.0 27.4 24.7 42.5 13.0 0.0 43.5 26.1 17.4Earnings 11.0 5.5 28.8 23.3 31.5 21.7 8.7 52.2 13.0 4.4
Retention 8.2 5.5 8.2 19.2 57.5 21.7 8.7 13.0 26.1 30.4Work 1.4 2.7 13.7 17.8 64.4 4.4 4.4 17.4 26.1 47.8
Hours 6.9 8.2 12.3 24.7 48.0 17.4 13.0 21.7 21.7 26.1Shift 4.1 6.9 11.0 13.7 64.4 8.7 13.0 8.7 30.4 39.1
Conditions 4.1 6.9 17.8 13.7 57.5 13.0 4.4 26.1 8.7 47.8Commuting Distance 1.4 2.7 11.0 11.0 74.0 4.4 4.4 21.7 17.4 52.2
24. Willingness to Train CU U N W CW CU U N W CW
For a better job 23.8 6.4 9.5 9.5 49.2 8.7 4.4 4.4 13.0 69.6If paid by workers 37.5 31.3 16.7 6.3 6.3 38.1 19.1 23.8 9.5 4.8
If co-paid by workers & Government 6.3 10.4 43.8 18.8 20.8 9.5 4.8 33.3 23.8 28.6
If paid by Government 2.1 2.1 14.6 16.7 64.6 0.0 4.8 9.5 4.8 81.0
CD = Completely dissatisfied, D = Dissatisfied, N = Neither satisfied nor dissatisfied, S = Satisfied, and CS = Completely satisfied. CU = Completely unwilling, U =Unwilling, N= Neither willing nor unwilling, W = Willing, and CW = Completely Willing. Note: Rounding errors may be present.

CBER, UA 2013 Underemployment in Alabama WIAAs 84
Table 5.2. Underemployment Survey Results, Region 5 (Percent, continued)
County/ WIAA RandolphJob Satisfaction and
Employed Underemployed Willingness to Train 23. Job Satisfaction CD D N S CS CD D N S CS
Overall Satisfaction 0.0 3.9 15.4 23.1 57.7 0.0 0.0 50.0 30.0 20.0Earnings 5.8 9.6 28.9 17.3 38.5 10.0 30.0 50.0 0.0 10.0
Retention 3.9 5.8 21.2 21.2 48.1 0.0 10.0 50.0 10.0 30.0Work 0.0 3.9 9.6 19.2 67.3 0.0 0.0 20.0 30.0 50.0
Hours 3.9 1.9 9.6 15.4 69.2 10.0 0.0 10.0 20.0 60.0Shift 1.9 3.9 11.5 15.4 67.3 0.0 10.0 20.0 20.0 50.0
Conditions 0.0 7.7 19.2 15.4 57.7 0.0 20.0 20.0 10.0 50.0Commuting Distance 5.8 5.8 13.5 9.6 65.4 0.0 0.0 20.0 20.0 60.0
24. Willingness to Train CU U N W CW CU U N W CW
For a better job 23.3 2.3 27.9 11.6 34.9 0.0 12.5 25.0 25.0 37.5If paid by workers 42.4 18.2 18.2 3.0 9.1 25.0 25.0 25.0 12.5 12.5
If co-paid by workers & Government 12.1 9.1 39.4 21.2 12.1 12.5 12.5 50.0 12.5 12.5
If paid by Government 3.0 0.0 24.2 18.2 51.5 12.5 0.0 12.5 25.0 50.0
County/ WIAA TalladegaJob Satisfaction and
Employed Underemployed Willingness to Train 23. Job Satisfaction CD D N S CS CD D N S CS
Overall Satisfaction 3.5 3.5 22.8 15.8 54.4 18.2 9.1 54.6 18.2 0.0Earnings 12.3 8.8 21.1 15.8 42.1 27.3 9.1 36.4 9.1 18.2
Retention 8.8 7.0 8.8 15.8 56.1 18.2 9.1 18.2 18.2 36.4Work 3.5 1.8 10.5 22.8 61.4 18.2 9.1 27.3 18.2 27.3
Hours 5.3 1.8 7.0 17.5 68.4 27.3 0.0 18.2 9.1 45.5Shift 7.0 0.0 7.0 15.8 70.2 18.2 0.0 0.0 27.3 54.6
Conditions 1.8 1.8 21.1 15.8 59.7 9.1 0.0 18.2 18.2 54.6Commuting Distance 1.8 5.3 12.3 14.0 66.7 9.1 9.1 18.2 18.2 45.5
24. Willingness to Train CU U N W CW CU U N W CW
For a better job 30.8 0.0 13.5 5.8 48.1 18.2 0.0 18.2 0.0 54.6If paid by workers 30.6 8.3 25.0 11.1 25.0 44.4 11.1 22.2 0.0 22.2
If co-paid by workers & Government 5.6 8.3 36.1 16.7 30.6 0.0 11.1 55.6 11.1 22.2
If paid by Government 2.8 5.6 5.6 19.4 66.7 0.0 0.0 0.0 11.1 88.9
County/ WIAA TallapoosaJob Satisfaction and
Employed Underemployed Willingness to Train 23. Job Satisfaction CD D N S CS CD D N S CS
Overall Satisfaction 3.5 3.5 22.8 15.8 54.4 18.2 9.1 54.6 18.2 0.0Earnings 12.3 8.8 21.1 15.8 42.1 27.3 9.1 36.4 9.1 18.2
Retention 8.8 7.0 8.8 15.8 56.1 18.2 9.1 18.2 18.2 36.4Work 3.5 1.8 10.5 22.8 61.4 18.2 9.1 27.3 18.2 27.3
Hours 5.3 1.8 7.0 17.5 68.4 27.3 0.0 18.2 9.1 45.5Shift 7.0 0.0 7.0 15.8 70.2 18.2 0.0 0.0 27.3 54.6
Conditions 1.8 1.8 21.1 15.8 59.7 9.1 0.0 18.2 18.2 54.6Commuting Distance 1.8 5.3 12.3 14.0 66.7 9.1 9.1 18.2 18.2 45.5
24. Willingness to Train CU U N W CW CU U N W CW
For a better job 30.8 0.0 13.5 5.8 48.1 18.2 0.0 18.2 0.0 54.6If paid by workers 30.6 8.3 25.0 11.1 25.0 44.4 11.1 22.2 0.0 22.2
If co-paid by workers & Government 5.6 8.3 36.1 16.7 30.6 0.0 11.1 55.6 11.1 22.2
If paid by Government 2.8 5.6 5.6 19.4 66.7 0.0 0.0 0.0 11.1 88.9
CD = Completely dissatisfied, D = Dissatisfied, N = Neither satisfied nor dissatisfied, S = Satisfied, and CS = Completely satisfied. CU = Completely unwilling, U =Unwilling, N= Neither willing nor unwilling, W = Willing, and CW = Completely Willing. Note: Rounding errors may be present.

2013 Underemployment in Alabama WIAAs CBER, UA 85
Table 5.2. Underemployment Survey Results, Region 5 (Percent, continued)
County/ WIAA Region 5Job Satisfaction and
Employed Underemployed Willingness to Train 23. Job Satisfaction CD D N S CS CD D N S CS
Overall Satisfaction 3.1 5.5 15.1 23.5 52.4 10.4 11.2 29.6 28.0 20.8Earnings 10.9 9.9 24.1 21.0 34.0 24.8 20.8 38.4 7.2 8.8
Retention 5.0 4.8 11.7 20.1 57.2 12.8 8.0 25.6 25.6 34.4Work 1.0 2.9 10.1 19.9 66.2 3.2 8.0 16.8 24.0 48.0
Hours 5.9 4.0 11.9 18.4 59.7 15.2 6.4 16.8 18.4 43.2Shift 4.4 3.8 9.0 15.1 67.7 4.8 8.0 8.8 27.2 51.2
Conditions 2.5 4.4 16.8 19.5 56.8 5.6 7.2 22.4 25.6 39.2Commuting Distance 4.6 5.5 12.6 12.6 64.4 8.8 6.4 18.4 12.8 53.6
24. Willingness to Train CU U N W CW CU U N W CW
For a better job 23.5 5.3 15.6 10.3 43.5 9.7 4.4 13.2 14.0 57.0If paid by workers 46.0 20.4 16.8 6.0 8.7 39.8 23.3 18.5 8.7 8.7
If co-paid by workers & Government 13.5 12.3 33.3 18.6 19.2 9.7 6.8 35.9 24.3 21.4
If paid by Government 6.0 3.0 10.5 18.0 61.6 2.9 1.9 6.8 11.7 76.7
CD = Completely dissatisfied, D = Dissatisfied, N = Neither satisfied nor dissatisfied, S = Satisfied, and CS = Completely satisfied. CU = Completely unwilling, U =Unwilling, N= Neither willing nor unwilling, W = Willing, and CW = Completely Willing. Note: Rounding errors may be present.

CBER, UA 2013 Underemployment in Alabama WIAAs 86
Underemployment in Workforce Investment Advisory Area, Region 6

2013 Underemployment in Alabama WIAAs CBER, UA 87
Underemployment in Workforce Investment Advisory Area, Region 6
WIAA Region 6 comprises of the five counties shown in Table 6.1. The area’s underemployment rate of 26.2 percent—much higher than the state’s 23.8 percent and highest of all WIAAs—means that about 7,800 resident workers were underemployed in December 2012. Adding the unemployed yields a total available labor pool of about 11,500 for the area, which is 3.1 times the number of unemployed and more realistic. Employers must be able to offer the underemployed higher wages, better benefits or terms of employment, or some other incentives to induce them to change jobs. The region has 1.5 percent of the state’s workers and 1.6 percent of the state’s underemployed.
Table 6.1 Region 6 Underemployed
Alabama Region 6 Dallas Marengo Perry Sumter WilcoxLabor Force 2,154,744 33,350 14,473 7,691 3,446 4,504 3,236Employed 2,013,847 29,610 12,741 7,026 3,031 4,065 2,747Underemployment rate 23.8% 26.2% 29.8% 26.8% 24.1% 22.2% 28.0%Underemployed workers 479,296 7,758 3,799 1,882 730 903 769Unemployed 140,897 3,740 1,732 665 415 439 489Available labor pool 620,193 11,498 5,531 2,547 1,145 1,342 1,258
Note: Rounding errors may be present. Based on December 2012 labor force data. Source: Center for Business and Economic Research, The University of Alabama; Alabama Department of Labor; and U.S. Bureau of
Labor Statistics. Underemployment Survey Results
Underemployment rates range from 22.2 percent in Sumter County to 29.8 percent in Dallas (Table 6.1) with only Sumter having a lower rate than the state. Rates are multiplied by the number of employed to get the number of underemployed workers. Table 6.2 shows the detailed underemployment survey results that include characteristics of the employed, underemployed, and nonworkers. Except for rates and their implications for labor availability, detailed county-level results are not discussed because county sample sizes are sufficient for underemployment estimation but insufficient for making reliable inferences on characteristics.
Of the employed, 75 percent work full-time, 10 percent hold more than one job, and 38 percent of part-time workers would like full-time work. The one-way commute takes up to 20 minutes for 50 percent of workers; 16 percent take more than 40 minutes and four percent take longer than an hour. Commute distance is less than 10 miles 41 percent and more than 25 miles for 25 percent—nine percent exceed 45 miles. Fifty-two percent have 10 or more years job tenure and 30 percent have more than 20 years. Many of the workers are in health care and social assistance, educational services, and manufacturing industries and the median monthly wage is just above $2,000. Eighty-nine percent of workers claim that their jobs fit well with their education, training, skills, and experience, but 67 percent believe they are qualified for a better job and 15 percent have sought better jobs in the preceding three months. Offered up to 15 percent higher wages, 29 percent would leave their jobs, 53 percent will leave for more than that, and 21 percent want more than a 50 percent raise. For the higher-paying job, 32 percent will commute up to 10 miles farther one-way but 40 percent are prepared to go 20 or more extra miles; 43 percent will increase the one-way commute by more than 20 minutes while 24 percent will not consider adding more than 10 minutes.

CBER, UA 2013 Underemployment in Alabama WIAAs 88
Among the underemployed, 66 percent work full-time, 10 percent hold more than one job, and 71 percent of part-time workers want full-time work. Forty-five percent commute for up to 20 minutes one-way, but 25 percent go over 40 minutes—4.2 percent take more than an hour. The commute is less than 10 miles for 36 percent and more than 25 miles for 30 percent have to travel with 12 percent exceeding 45 miles. The underemployed have been in their current jobs for longer than the employed; 56 percent have more than 10 years job tenure compared to 52 percent of employed. Fifty-six percent earn up to $2,000 monthly versus 46 percent of all workers. Compared to the general workforce, a higher percentage of underemployed is in the manufacturing sector. About 75 percent say their jobs fit well with their education, training, skills, and experience; 82 percent believe they are qualified for a better job and 22 percent have sought better jobs in the preceding three months. Thirty-nine percent would leave current job for up to 15 percent more income, 53 percent would leave for more than 15 percent higher wages, and 25 percent want more than a 50 percent raise. Thirty-six percent will add up to 10 miles to the one-way commute for the new higher-paying job and 39 percent are prepared to add 20 miles or more. Forty-one percent are willing to increase the one-way commute by more than 20 minutes for this new job while 25 percent will not consider more than 10 additional minutes.
Responses for overall job satisfaction and various types of the job show that most workers in Region 6 are satisfied or completely satisfied with their jobs but the underemployed are less satisfied than all employees—75 percent versus 54 percent. Workers are most satisfied with the work they do and least satisfied with the earnings they receive. The underemployed are most satisfied with the commuting distance and much more dissatisfied with earnings. Workers are generally willing or completely willing to train for a new or better job with the underemployed being much more willing, 79 percent compared to 62 percent. The willingness to train is strongly influenced by who pays for the cost of training as it is highest when the cost is fully borne by government and lowest when the trainee pays full costs.
Of a total 638 respondents, 271 or 42.5 percent are employed. Primary reasons for underemployment are lack of job opportunities, low wages at available jobs, and live too far from jobs. Major reasons for not working are retirement, disability or other health concerns, lack of job opportunities, and living too far from jobs. Sixty-four percent employed, 42 percent nonworkers, and 63 percent underemployed are married. Men were 38 percent of employed, 30 percent nonworkers, and 37 percent underemployed. The median age is 53 for employed, 52.5 underemployed, and 62 for nonworkers. Roughly 43 percent employed, 32 percent nonworkers, and 37 percent of underemployed are white. While Hispanics are a tiny portion of respondents, African-Americans and other ethnicities are 54 percent of the employed, 62 percent of underemployed, and 64 percent of nonworkers.
Four percent of the employed and nine percent of the underemployed do not hold a high school diploma or equivalent, compared to 18 percent of nonworkers. Thirty-eight percent employed, 34 percent underemployed, and 11 percent nonworkers hold a bachelor’s or higher degree. WIAA Region 6 has an 11,500-strong labor pool that is willing to commute and is seeking higher wage jobs.
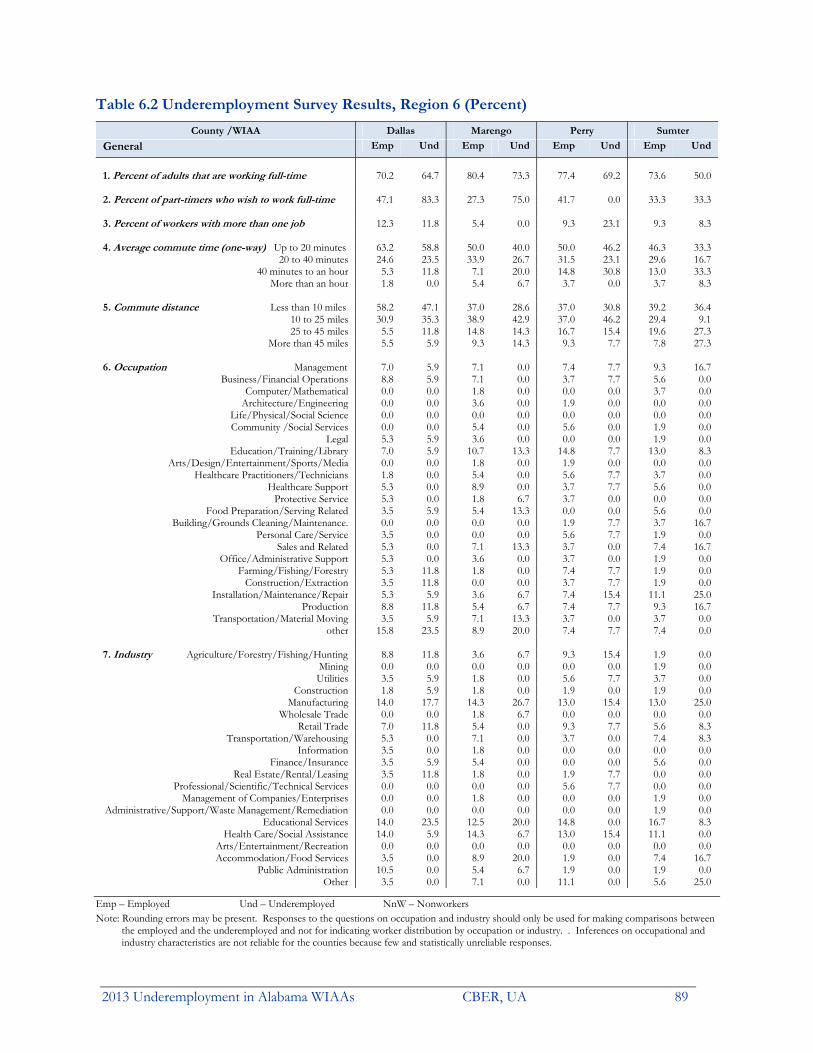
2013 Underemployment in Alabama WIAAs CBER, UA 89
Table 6.2 Underemployment Survey Results, Region 6 (Percent) County /WIAA Dallas Marengo Perry Sumter
General Emp Und Emp Und Emp Und Emp Und
1. Percent of adults that are working full-time 70.2 64.7 80.4 73.3 77.4 69.2 73.6 50.0 2. Percent of part-timers who wish to work full-time 47.1 83.3 27.3 75.0 41.7 0.0 33.3 33.3 3. Percent of workers with more than one job 12.3 11.8 5.4 0.0 9.3 23.1 9.3 8.3 4. Average commute time (one-way) Up to 20 minutes 63.2 58.8 50.0 40.0 50.0 46.2 46.3 33.3
20 to 40 minutes 24.6 23.5 33.9 26.7 31.5 23.1 29.6 16.740 minutes to an hour 5.3 11.8 7.1 20.0 14.8 30.8 13.0 33.3
More than an hour 1.8 0.0 5.4 6.7 3.7 0.0 3.7 8.3 5. Commute distance Less than 10 miles 58.2 47.1 37.0 28.6 37.0 30.8 39.2 36.4
10 to 25 miles 30.9 35.3 38.9 42.9 37.0 46.2 29.4 9.125 to 45 miles 5.5 11.8 14.8 14.3 16.7 15.4 19.6 27.3
More than 45 miles 5.5 5.9 9.3 14.3 9.3 7.7 7.8 27.3 6. Occupation Management 7.0 5.9 7.1 0.0 7.4 7.7 9.3 16.7
Business/Financial Operations 8.8 5.9 7.1 0.0 3.7 7.7 5.6 0.0Computer/Mathematical 0.0 0.0 1.8 0.0 0.0 0.0 3.7 0.0
Architecture/Engineering 0.0 0.0 3.6 0.0 1.9 0.0 0.0 0.0Life/Physical/Social Science 0.0 0.0 0.0 0.0 0.0 0.0 0.0 0.0Community /Social Services 0.0 0.0 5.4 0.0 5.6 0.0 1.9 0.0
Legal 5.3 5.9 3.6 0.0 0.0 0.0 1.9 0.0Education/Training/Library 7.0 5.9 10.7 13.3 14.8 7.7 13.0 8.3
Arts/Design/Entertainment/Sports/Media 0.0 0.0 1.8 0.0 1.9 0.0 0.0 0.0Healthcare Practitioners/Technicians 1.8 0.0 5.4 0.0 5.6 7.7 3.7 0.0
Healthcare Support 5.3 0.0 8.9 0.0 3.7 7.7 5.6 0.0Protective Service 5.3 0.0 1.8 6.7 3.7 0.0 0.0 0.0
Food Preparation/Serving Related 3.5 5.9 5.4 13.3 0.0 0.0 5.6 0.0Building/Grounds Cleaning/Maintenance. 0.0 0.0 0.0 0.0 1.9 7.7 3.7 16.7
Personal Care/Service 3.5 0.0 0.0 0.0 5.6 7.7 1.9 0.0Sales and Related 5.3 0.0 7.1 13.3 3.7 0.0 7.4 16.7
Office/Administrative Support 5.3 0.0 3.6 0.0 3.7 0.0 1.9 0.0Farming/Fishing/Forestry 5.3 11.8 1.8 0.0 7.4 7.7 1.9 0.0
Construction/Extraction 3.5 11.8 0.0 0.0 3.7 7.7 1.9 0.0Installation/Maintenance/Repair 5.3 5.9 3.6 6.7 7.4 15.4 11.1 25.0
Production 8.8 11.8 5.4 6.7 7.4 7.7 9.3 16.7Transportation/Material Moving 3.5 5.9 7.1 13.3 3.7 0.0 3.7 0.0
other 15.8 23.5 8.9 20.0 7.4 7.7 7.4 0.0 7. Industry Agriculture/Forestry/Fishing/Hunting 8.8 11.8 3.6 6.7 9.3 15.4 1.9 0.0
Mining 0.0 0.0 0.0 0.0 0.0 0.0 1.9 0.0Utilities 3.5 5.9 1.8 0.0 5.6 7.7 3.7 0.0
Construction 1.8 5.9 1.8 0.0 1.9 0.0 1.9 0.0Manufacturing 14.0 17.7 14.3 26.7 13.0 15.4 13.0 25.0
Wholesale Trade 0.0 0.0 1.8 6.7 0.0 0.0 0.0 0.0Retail Trade 7.0 11.8 5.4 0.0 9.3 7.7 5.6 8.3
Transportation/Warehousing 5.3 0.0 7.1 0.0 3.7 0.0 7.4 8.3Information 3.5 0.0 1.8 0.0 0.0 0.0 0.0 0.0
Finance/Insurance 3.5 5.9 5.4 0.0 0.0 0.0 5.6 0.0Real Estate/Rental/Leasing 3.5 11.8 1.8 0.0 1.9 7.7 0.0 0.0
Professional/Scientific/Technical Services 0.0 0.0 0.0 0.0 5.6 7.7 0.0 0.0Management of Companies/Enterprises 0.0 0.0 1.8 0.0 0.0 0.0 1.9 0.0
Administrative/Support/Waste Management/Remediation 0.0 0.0 0.0 0.0 0.0 0.0 1.9 0.0Educational Services 14.0 23.5 12.5 20.0 14.8 0.0 16.7 8.3
Health Care/Social Assistance 14.0 5.9 14.3 6.7 13.0 15.4 11.1 0.0Arts/Entertainment/Recreation 0.0 0.0 0.0 0.0 0.0 0.0 0.0 0.0Accommodation/Food Services 3.5 0.0 8.9 20.0 1.9 0.0 7.4 16.7
Public Administration 10.5 0.0 5.4 6.7 1.9 0.0 1.9 0.0Other 3.5 0.0 7.1 0.0 11.1 0.0 5.6 25.0
Emp – Employed Und – Underemployed NnW – Nonworkers Note: Rounding errors may be present. Responses to the questions on occupation and industry should only be used for making comparisons between
the employed and the underemployed and not for indicating worker distribution by occupation or industry. . Inferences on occupational and industry characteristics are not reliable for the counties because few and statistically unreliable responses.

CBER, UA 2013 Underemployment in Alabama WIAAs 90
Table 6.2 Underemployment Survey Results, Region 6 (Percent, continued) County /WIAA Wilcox Region 6
General Emp Und Emp Und
1. Percent of adults that are working full-time 74.0 71.4 75.1 66.2 2. Percent of part-timers who wish to work full-time 38.5 75.0 38.2 70.8 3. Percent of workers with more than one job 12.0 7.1 9.6 9.9 4. Average commute time (one-way) Up to 20 minutes 40.0 42.9 50.2 45.1
20 to 40 minutes 28.0 35.7 29.5 25.440 minutes to an hour 20.0 14.3 11.8 21.1
More than an hour 8.0 7.1 4.4 4.2 5. Commute distance Less than 10 miles 32.0 35.7 40.9 36.2
10 to 25 miles 26.0 28.6 32.6 33.325 to 45 miles 24.0 28.6 15.9 18.8
More than 45 miles 14.0 7.1 9.1 11.6 6. Occupation Management 8.0 21.4 7.8 9.9
Business/Financial Operations 4.0 0.0 5.9 2.8Computer/Mathematical 0.0 0.0 1.1 0.0
Architecture/Engineering 0.0 0.0 1.1 0.0Life/Physical/Social Science 2.0 0.0 0.4 0.0Community /Social Services 4.0 7.1 3.3 1.4
Legal 2.0 0.0 2.6 1.4Education/Training/Library 14.0 7.1 11.8 8.5
Arts/Design/Entertainment/Sports/Media 0.0 0.0 0.7 0.0Healthcare Practitioners/Technicians 12.0 7.1 5.5 2.8
Healthcare Support 8.0 14.3 6.3 4.2Protective Service 0.0 0.0 2.2 1.4
Food Preparation/Serving Related 2.0 7.1 3.3 5.6Building/Grounds Cleaning/Maintenance. 2.0 0.0 1.5 4.2
Personal Care/Service 0.0 0.0 2.2 1.4Sales and Related 8.0 0.0 6.3 5.6
Office/Administrative Support 6.0 7.1 4.1 1.4Farming/Fishing/Forestry 0.0 0.0 3.3 5.6
Construction/Extraction 4.0 7.1 2.6 5.6Installation/Maintenance/Repair 2.0 0.0 5.9 9.9
Production 6.0 7.1 7.4 9.9Transportation/Material Moving 10.0 7.1 5.5 5.6
other 6.0 7.1 9.2 12.7 7. Industry Agriculture/Forestry/Fishing/Hunting 2.0 0.0 5.2 7.0
Mining 0.0 0.0 0.4 0.0Utilities 0.0 0.0 3.0 2.8
Construction 4.0 7.1 2.2 2.8Manufacturing 10.0 7.1 12.9 18.3
Wholesale Trade 0.0 0.0 0.4 1.4Retail Trade 2.0 0.0 5.9 5.6
Transportation/Warehousing 6.0 7.1 5.9 2.8Information 0.0 0.0 1.1 0.0
Finance/Insurance 10.0 14.3 4.8 4.2Real Estate/Rental/Leasing 0.0 0.0 1.5 4.2
Professional/Scientific/Technical Services 0.0 0.0 1.1 1.4Management of Companies/Enterprises 2.0 7.1 1.1 1.4
Administrative/Support/Waste Management/Remediation 0.0 0.0 0.4 0.0Educational Services 14.0 7.1 14.4 12.7
Health Care/Social Assistance 20.0 21.4 14.4 9.9Arts/Entertainment/Recreation 0.0 0.0 0.0 0.0Accommodation/Food Services 4.0 14.3 5.2 9.9
Public Administration 4.0 7.1 4.8 2.8Other 10.0 0.0 7.4 4.2
Emp – Employed Und – Underemployed NnW – Nonworkers Note: Rounding errors may be present. Responses to the questions on occupation and industry should only be used for making comparisons between
the employed and the underemployed and not for indicating worker distribution by occupation or industry. Inferences on occupational and industry characteristics are not reliable for the counties because few and statistically unreliable responses.

2013 Underemployment in Alabama WIAAs CBER, UA 91
Table 6.2 Underemployment Survey Results, Region 6 (Percent, continued) County /WIAA Dallas Marengo Perry Sumter
Emp Und Emp Und Emp Und Emp Und
8. Years at current/primary job Less than a year 12.3 11.8 21.4 13.3 18.5 23.1 3.7 0.0 1 to 3 years 5.3 11.8 7.1 6.7 11.1 0.0 11.1 8.33 to 5 years 7.0 5.9 8.9 13.3 7.4 7.7 11.1 8.3
5 to 10 years 21.1 11.8 5.4 0.0 7.4 15.4 13.0 8.310 to 20 years 22.8 17.7 25.0 26.7 24.1 30.8 27.8 25.0
More than 20 years 29.8 35.3 26.8 33.3 29.6 23.1 29.6 41.7
9. Monthly wages Less than $500 5.3 5.9 7.1 13.3 7.4 15.4 13.0 16.7$500 up to $1,000 19.3 23.5 7.1 0.0 14.8 23.1 16.7 33.3
$1,000 up to $2,000 19.3 29.4 21.4 26.7 20.4 30.8 22.2 16.7$2,000 up to $3,000 17.5 11.8 16.1 13.3 14.8 7.7 16.7 25.0$3,000 up to $4,000 3.5 5.9 12.5 13.3 14.8 7.7 11.1 8.3$4,000 up to $6,000 10.5 11.8 14.3 13.3 14.8 0.0 3.7 0.0
More than $6,000 15.8 5.9 8.9 6.7 5.6 7.7 11.1 0.0Job Fitness 10. Percent of workers whose current job fits well with their education and training, skills, and experience
87.7 76.5 89.3 60.0 88.9 69.2 85.2 75.0
11. Percent of workers who believe they are qualified for a better job
61.4 88.2 66.1 86.7 68.5 92.3 72.2 83.3
Reasons: Education and training 94.3 93.3 94.6 100.0 94.6 100.0 87.2 80.0Skills 97.1 93.3 94.6 92.3 91.9 91.7 94.9 100.0
Experience 100.0 100.0 97.3 92.3 94.6 83.3 87.2 90.0 12. Additional income for which workers would leave current job
0 to 5% more 5.6 9.1 3.5 0.0 13.0 28.6 3.7 0.05 to 15% more 16.7 9.1 31.0 50.0 13.0 14.3 18.5 33.3
15 to 30% more 11.1 18.2 17.2 25.0 17.4 0.0 29.6 16.730 to 50% more 19.4 27.3 10.3 0.0 13.0 0.0 14.8 16.7
More than 50% more 25.0 27.3 20.7 0.0 21.7 57.1 22.2 16.7 *** Would not leave current job 16.7 0.0 10.3 0.0 8.7 0.0 7.4 16.7
13. Additional commute for new job 0 to 10 miles 22.5 25.0 32.7 28.6 32.6 46.2 26.0 36.4
10 to 20 miles 20.4 6.3 32.7 35.7 28.3 30.8 26.0 18.2more than 20 miles 55.1 68.8 30.6 28.6 37.0 23.1 44.0 36.4
14. Additional one-way commute time 0 to 10 minutes 18.4 18.8 28.6 14.3 28.3 30.8 24.0 36.4
10 to 20 minutes 20.4 18.8 30.6 28.6 26.1 30.8 38.0 45.5more than 20 minutes 59.2 62.5 38.8 50.0 43.5 38.5 38.0 18.2
15. Percent of workers who sought better job in past three months
20.4 37.5 14.3 21.4 15.2 30.8 12.0 18.2
Underemployment 16. Percent of workers who say they are currently underemployed
29.8 26.8 24.1
22.2
17. Reasons respondents give for being Und NnW Und NnW Und NnW Und NnW
A lack of job opportunities in their area 82.4 41.5 80.0 31.3 92.3 42.6 83.3 47.5The low wages at the available jobs 76.5 25.5 73.3 21.9 76.9 26.2 66.7 28.8
They live too far from jobs 58.8 21.3 60.0 25.0 84.6 42.6 83.3 38.8They are in school or undergoing training 17.7 6.4 6.7 7.8 15.4 11.5 0.0 7.5
Their spouse or partner has a really good job 23.5 6.4 20.0 17.2 15.4 13.1 8.3 5.0They are retired 11.8 60.6 20.0 65.6 0.0 50.8 8.3 52.5
Because of social security limitations 11.8 28.7 13.3 21.9 7.7 41.0 8.3 35.0Disability or other health concerns 0.0 46.8 13.3 50.0 7.7 49.2 8.3 53.8
Child care responsibilities 11.8 10.6 20.0 10.9 15.4 6.6 16.7 11.3They take care of someone other than a child 5.9 9.6 13.3 17.2 23.1 16.4 16.7 11.3
Other family or personal obligations 17.7 9.6 20.0 28.1 23.1 13.1 50.0 13.8Owning a house in your area 20.0 17.4 38.5 13.2 40.0 19.6 30.0 18.3
Something else 29.4 16.0 0.0 18.8 7.7 13.1 0.0 25.0
Emp – Employed Und – Underemployed NnW – Nonworkers Note: Rounding errors may be present.

CBER, UA 2013 Underemployment in Alabama WIAAs 92
Table 6.2 Underemployment Survey Results, Region 6 (Percent, continued) County/WIAA Wilcox Region 6
Emp Und Emp Und8. Years at current/primary job Less than a year 22.0 21.4 15.5 14.1
1 to 3 years 8.0 7.1 8.5 7.03 to 5 years 8.0 7.1 8.5 8.5
5 to 10 years 12.0 14.3 11.8 9.910 to 20 years 12.0 21.4 22.5 23.9
More than 20 years 34.0 28.6 29.9 32.4
9. Monthly wages Less than $500 8.0 14.3 8.1 12.7$500 up to $1,000 26.0 14.3 16.6 18.3
$1,000 up to $2,000 24.0 21.4 21.4 25.4$2,000 up to $3,000 16.0 42.9 16.2 19.7$3,000 up to $4,000 8.0 0.0 10.0 7.0$4,000 up to $6,000 6.0 0.0 10.0 5.6
More than $6,000 10.0 7.1 10.3 5.6Job Fitness 10. Percent of workers whose current job fits well with their education and training, skills, and experience
92.0 92.9 88.6 74.7
11. Percent of workers who believe they are qualified for a better job
68.0 57.1 67.2 81.7
Reasons: Education and training 79.4 100.0 90.1 94.8Skills 97.1 100.0 95.1 94.8
Experience 94.1 100.0 94.5 93.1 12. Additional income for which workers would leave current job
0 to 5% more 4.0 0.0 5.7 8.35 to 15% more 40.0 62.5 23.6 30.6
15 to 30% more 16.0 12.5 17.9 13.930 to 50% more 12.0 12.5 14.3 13.9
More than 50% more 12.0 12.5 20.7 25.0 *** Would not leave current job 8.0 0.0 10.7 2.8
13. Additional commute for new job 0 to 10 miles 47.7 46.2 31.9 35.8
10 to 20 miles 20.5 23.1 25.6 22.4more than 20 miles 29.6 30.8 39.5 38.8
14. Additional one-way commute time 0 to 10 minutes 22.7 30.8 24.4 25.4
10 to 20 minutes 38.6 38.5 30.7 31.3more than 20 minutes 36.4 30.8 43.3 41.8
15. Percent of workers who sought better job in past three months
13.6 0.0 15.1 22.4
Underemployment 16. Percent of workers who say they are currently underemployed
28.0 26.2
17. Reasons respondents give for being Und NnW Und NnW
A lack of job opportunities in their area 100.0 42.7 87.3 41.4The low wages at the available jobs 64.3 33.8 71.8 27.3
They live too far from jobs 57.1 39.7 67.6 32.7They are in school or undergoing training 0.0 5.9 8.5 7.6
Their spouse or partner has a really good job 7.1 20.6 15.5 11.7They are retired 0.0 55.9 8.5 57.2
Because of social security limitations 7.1 26.5 9.9 30.5Disability or other health concerns 0.0 42.7 5.6 48.5
Child care responsibilities 14.3 20.6 15.5 12.0They take care of someone other than a child 21.4 14.7 15.5 13.4
Other family or personal obligations 35.7 10.3 28.2 14.4Owning a house in your area 30.0 22.0 32.1 18.0
Something else 7.1 11.8 9.9 17.2
Emp – Employed Und – Underemployed NnW – Nonworkers Note: Rounding errors may be present.

2013 Underemployment in Alabama WIAAs CBER, UA 93
Table 6.2 Underemployment Survey Results, Region 6 (Percent, continued) County/WIAA Dallas Marengo Perry Sumter
Selected Emp NnW Und Emp NnW Und Emp NnW Und Emp NnW UndCharacteristics 18. Married Respondents 66.7 35.1 58.8 67.9 50.0 66.7 66.7 41.0 61.5 59.3 37.5 83.3 19. Sex Female 56.1 62.8 58.8 60.7 81.3 46.7 55.6 70.5 61.5 64.8 68.8 66.7
Male 43.9 37.2 41.2 39.3 18.8 53.3 44.4 29.5 38.5 35.2 31.3 33.3 20. Median age (years) 47.5 62 47 53 60.5 50 51.5 62 55 54 60.5 54 21. Ethnicity Hispanic 3.5 1.1 11.8 0.0 1.1 0.0 1.9 3.3 7.7 5.6 0.0 0.0
21b. Race White 47.4 34.0 47.1 58.9 43.8 33.3 29.6 24.6 15.4 38.9 22.5 50.0African-American/Other 50.9 60.6 52.9 39.3 51.6 66.7 63.0 73.8 84.6 55.6 71.3 50.0
22. Last school grade
High Sch./less, no diploma 3.5 13.8 5.9 0.0 7.8 0.0 5.6 23.0 23.1 11.1 25.0 16.7High School or GED 28.1 29.8 29.4 26.8 40.6 20.0 35.2 52.5 23.1 31.5 48.8 41.7
Some college, no degree 8.8 21.3 17.7 19.6 15.6 20.0 11.1 4.9 23.1 9.3 8.8 8.3Jr. College/trade
school/associate degree 17.5 8.5 23.5 12.5 10.9 13.3 11.1 6.6 0.0 7.4 7.5 8.3
4-year college graduate/BA 21.1 16.0 11.8 26.8 10.9 40.0 16.7 8.2 23.1 16.7 6.3 8.3Postgraduate/Masters 21.1 9.6 11.8 14.3 9.4 6.7 18.5 4.9 7.7 24.1 3.8 16.7
WIAA Wilcox Region 6
Selected Emp NnW Und Emp NnW Und Characteristics 18. Married Respondents 58.0 50.0 50.0 63.8 42.0 63.4 19. Sex Female 72.0 70.6 85.7 61.6 70.0 63.4
Male 28.0 29.4 14.3 38.4 30.0 36.6 20. Median age (years) 54 62.5 51.5 53 62 52.5 21. Ethnicity Hispanic 2.0 0.0 0.0 2.6 0.8 4.2
21b. Race White 38.0 35.3 35.7 42.8 31.9 36.6 African-American/Other 60.0 63.2 57.1 53.5 64.0 62.0
22. Last school grade
High Sch./less, no diploma 2.0 19.1 0.0 4.4 17.7 8.5 High School or GED 42.0 44.1 35.7 32.5 42.2 29.6
Some college, no degree 12.0 13.2 14.3 12.2 13.4 16.9 Jr. College/trade
school/associate degree 12.0 4.4 7.1 12.2 7.6 11.3
4-year college graduate/BA 16.0 13.2 14.3 19.6 11.2 19.7 Postgraduate/Masters 16.0 5.9 28.6 18.8 6.8 14.1
Emp – Employed Und – Underemployed NnW – Nonworkers Note: Rounding errors may be present.

CBER, UA 2013 Underemployment in Alabama WIAAs 94
Table 6.2 Underemployment Survey Results, Region 6 (Percent, continued) County/WIAA Dallas
Job Satisfaction and Employed Underemployed
Willingness to Train 23. Job Satisfaction CD D N S CS CD D N S CS
Overall Satisfaction 5.3 3.5 14.0 17.5 57.9 0.0 11.8 23.5 23.5 35.3Earnings 10.5 7.0 26.3 15.8 38.6 17.7 17.7 35.3 5.9 17.7
Retention 3.5 1.8 12.3 17.5 61.4 5.9 5.9 23.5 17.7 41.2Work 0.0 1.8 3.5 19.3 75.4 0.0 5.9 11.8 17.7 64.7
Hours 5.3 1.8 8.8 21.1 61.4 11.8 5.9 11.8 23.5 41.2Shift 5.3 1.8 15.8 7.0 70.2 11.8 0.0 29.4 5.9 52.9
Conditions 1.8 7.0 10.5 19.3 59.7 0.0 11.8 23.5 17.7 41.2Commuting Distance 1.8 1.8 8.8 10.5 75.4 0.0 5.9 11.8 23.5 52.9
24. Willingness to Train CU U N W CW CU U N W CW
For a better job 12.2 2.0 14.3 12.2 57.1 6.3 0.0 0.0 18.8 75.0If paid by workers 20.9 18.6 18.6 7.0 27.9 13.3 6.7 20.0 6.7 33.3
If co-paid by workers & Government 9.3 0.0 27.9 16.3 44.2 6.7 6.7 33.3 46.7 6.7
If paid by Government 4.7 0.0 0.0 7.0 83.7 0.0 0.0 0.0 86.7 13.3
County/WIAA MarengoJob Satisfaction and
Employed Underemployed Willingness to Train 23. Job Satisfaction CD D N S CS CD D N S CS
Overall Satisfaction 7.1 0.0 17.9 17.9 57.1 20.0 0.0 20.0 13.3 40.0Earnings 8.9 14.3 25.0 16.1 35.7 20.0 20.0 40.0 6.7 13.3
Retention 5.4 7.1 3.6 21.4 62.5 20.0 20.0 0.0 20.0 40.0Work 3.6 0.0 10.7 14.3 69.6 13.3 0.0 20.0 6.7 53.3
Hours 5.4 1.8 10.7 16.1 66.1 13.3 6.7 13.3 13.3 53.3Shift 3.6 3.6 16.1 12.5 64.3 13.3 0.0 26.7 13.3 46.7
Conditions 3.6 5.4 17.9 23.2 50.0 13.3 6.7 20.0 46.7 13.3Commuting Distance 5.4 5.4 5.4 21.4 62.5 6.7 6.7 0.0 33.3 53.3
24. Willingness to Train CU U N W CW CU U N W CW
For a better job 20.4 10.2 10.2 12.2 44.9 7.1 7.1 7.1 28.6 50.0If paid by workers 64.1 10.3 7.7 5.1 12.8 61.5 7.7 7.7 15.4 7.7
If co-paid by workers & Government 10.3 28.2 15.4 18.0 25.6 0.0 38.5 7.7 23.1 30.8
If paid by Government 10.3 0.0 5.1 7.7 76.9 0.0 0.0 7.7 7.7 84.6
County/WIAA PerryJob Satisfaction and
Employed Underemployed Willingness to Train 23. Job Satisfaction CD D N S CS CD D N S CS
Overall Satisfaction 5.6 5.6 14.8 27.8 44.4 15.4 15.4 30.8 7.7 30.8Earnings 18.5 5.6 18.5 16.7 38.9 38.5 15.4 7.7 0.0 38.5
Retention 3.7 14.8 11.1 18.5 51.9 15.4 23.1 15.4 15.4 30.8Work 5.6 3.7 1.9 20.4 66.7 15.4 15.4 7.7 23.1 38.5
Hours 3.7 7.4 7.4 20.4 59.3 7.7 15.4 0.0 7.7 69.2Shift 0.0 1.9 14.8 16.7 66.7 0.0 7.7 15.4 0.0 76.9
Conditions 3.7 7.4 11.1 24.1 53.7 7.7 23.1 7.7 23.1 38.5Commuting Distance 9.3 5.6 20.4 7.4 57.4 15.4 15.4 30.8 7.7 30.8
24. Willingness to Train CU U N W CW CU U N W CW
For a better job 26.1 8.7 8.7 8.7 45.7 7.7 0.0 7.7 15.4 69.2If paid by workers 55.9 5.9 14.7 11.8 11.8 58.3 0.0 8.3 16.7 16.7
If co-paid by workers & Government 35.3 5.9 11.8 11.8 35.3 16.7 8.3 8.3 16.7 50.0
If paid by Government 17.7 2.9 8.8 0.0 67.7 16.7 0.0 0.0 0.0 83.3
CD = Completely dissatisfied, D = Dissatisfied, N = Neither satisfied nor dissatisfied, S = Satisfied, and CS = Completely satisfied. CU = Completely unwilling, U =Unwilling, N= Neither willing nor unwilling, W = Willing, and CW = Completely Willing. Note: Rounding errors may be present.

2013 Underemployment in Alabama WIAAs CBER, UA 95
Table 6.2 Underemployment Survey Results, Region 6 (Percent, continued) County/WIAA Sumter
Job Satisfaction and Employed Underemployed
Willingness to Train 23. Job Satisfaction CD D N S CS CD D N S CS
Overall Satisfaction 9.3 7.4 1.9 24.1 55.6 16.7 16.7 8.3 33.3 25.0Earnings 11.1 13.0 22.2 29.6 24.1 25.0 33.3 8.3 16.7 16.7
Retention 7.4 3.7 13.0 22.2 53.7 25.0 8.3 25.0 16.7 25.0Work 3.7 3.7 9.3 20.4 63.0 8.3 16.7 16.7 8.3 50.0
Hours 9.3 5.6 9.3 11.1 64.8 16.7 16.7 0.0 16.7 50.0Shift 7.4 5.6 7.4 11.1 66.7 25.0 8.3 8.3 16.7 33.3
Conditions 7.4 1.9 11.1 27.8 51.9 16.7 8.3 33.3 16.7 25.0Commuting Distance 9.3 3.7 3.7 13.0 70.4 25.0 8.3 16.7 0.0 50.0
24. Willingness to Train CU U N W CW CU U N W CW
For a better job 12.0 2.0 20.0 12.0 50.0 9.1 0.0 18.2 18.2 45.5If paid by workers 43.2 13.6 15.9 9.1 15.9 40.0 0.0 20.0 20.0 20.0
If co-paid by workers & Government 13.6 6.8 38.6 15.9 22.7 30.0 10.0 10.0 20.0 30.0
If paid by Government 0.0 2.3 18.2 18.2 61.4 0.0 0.0 30.0 10.0 60.0
County/WIAA WilcoxJob Satisfaction and
Employed Underemployed Willingness to Train 23. Job Satisfaction CD D N S CS CD D N S CS
Overall Satisfaction 4.0 8.0 14.0 28.0 46.0 7.1 14.3 21.4 21.4 35.7Earnings 14.0 12.0 18.0 24.0 32.0 28.6 21.4 7.1 14.3 28.6
Retention 2.0 4.0 10.0 20.0 64.0 7.1 0.0 21.4 7.1 64.3Work 0.0 0.0 8.0 20.0 72.0 0.0 0.0 21.4 14.3 64.3
Hours 4.0 6.0 8.0 16.0 66.0 14.3 7.1 7.1 14.3 57.1Shift 4.0 0.0 12.0 22.0 62.0 7.1 0.0 14.3 21.4 57.1
Conditions 0.0 4.0 20.0 22.0 54.0 0.0 7.1 21.4 0.0 71.4Commuting Distance 6.0 8.0 18.0 20.0 48.0 7.1 7.1 21.4 0.0 64.3
24. Willingness to Train CU U N W CW CU U N W CW
For a better job 4.6 9.1 15.9 15.9 52.3 0.0 15.4 15.4 7.7 61.5If paid by workers 42.9 11.9 19.1 11.9 11.9 61.5 15.4 7.7 7.7 7.7
If co-paid by workers & Government 19.1 9.5 16.7 21.4 31.0 30.8 0.0 30.8 23.1 15.4
If paid by Government 4.8 4.8 7.1 11.9 71.4 0.0 0.0 15.4 15.4 69.2
County/WIAA Region 6Job Satisfaction and
Employed Underemployed Willingness to Train 23. Job Satisfaction CD D N S CS CD D N S CS
Overall Satisfaction 6.3 4.8 12.6 22.9 52.4 12.7 11.3 21.1 19.7 33.8Earnings 12.6 10.3 22.1 20.3 34.0 25.4 21.1 21.1 8.5 22.5
Retention 4.4 6.3 10.0 19.9 58.7 14.1 11.3 15.5 15.5 40.9Work 2.6 1.9 6.6 18.8 69.4 7.0 7.0 15.5 14.1 54.9
Hours 5.5 4.4 8.9 17.0 63.5 12.7 9.9 7.0 15.5 53.5Shift 4.1 2.6 13.3 13.7 66.1 11.3 2.8 19.7 11.3 53.5
Conditions 3.3 5.2 14.0 23.3 53.9 7.0 11.3 21.1 21.1 38.0Commuting Distance 6.3 4.8 11.1 14.4 63.1 9.9 5.6 12.7 12.7 57.8
24. Willingness to Train CU U N W CW CU U N W CW
For a better job 15.1 6.3 13.9 12.2 50.0 6.0 4.5 9.0 17.9 61.2If paid by workers 44.6 12.4 15.4 8.9 16.3 46.0 6.4 12.7 12.7 17.5
If co-paid by workers & Government 16.8 9.9 22.8 16.8 31.7 15.9 11.1 12.7 23.8 34.9
If paid by Government 6.9 2.0 7.9 9.4 72.3 3.2 0.0 9.5 6.4 77.8
CD = Completely dissatisfied, D = Dissatisfied, N = Neither satisfied nor dissatisfied, S = Satisfied, and CS = Completely satisfied. CU = Completely unwilling, U =Unwilling, N= Neither willing nor unwilling, W = Willing, and CW = Completely Willing. Note: Rounding errors may be present

CBER, UA 2013 Underemployment in Alabama WIAAs 96
Underemployment in Workforce Investment Advisory Area, Region 7

2013 Underemployment in Alabama WIAAs CBER, UA 97
Underemployment in Workforce Investment Advisory Area, Region 7
WIAA Region 7 comprises of the six counties shown in Table 7.1. The area’s underemployment rate of 25.5 percent is higher than the state’s 23.8 percent and means that 43,800 employed residents were underemployed in December 2012. Adding the unemployed gives a total available labor pool of about 56,200, which is 4.5 times the number of unemployed and more realistic. Employers must offer the underemployed higher wages, better benefits or terms of employment, or other incentives to induce them to change jobs. The region has 9.2 percent of the state’s underemployed and 8.5 percent of the state’s workforce.
Table 7.1 Region 7 Underemployed
Alabama Region 7 Autauga Butler Crenshaw Elmore Lowndes Montgomery
Labor Force 2,154,744 184,035 25,535 9,005 6,535 35,282 4,131 103,547Employed 2,013,847 171,675 24,062 8,127 6,116 33,089 3,662 96,619Underemployment rate 23.8% 25.5% 20.3% 33.3% 20.4% 22.8% 25.5% 26.8%Underemployed workers 479,296 43,811 4,894 2,709 1,246 7,548 932 25,865Unemployed 140,897 12,360 1473 878 419 2,193 469 6,928Available labor pool 620,193 56,171 6,367 3,587 1,665 9,741 1,401 32,793
Note: Rounding errors may be present. Based on December 2012 labor force data and 2012 underemployment rates. Source: Center for Business and Economic Research, The University of Alabama and Alabama Department of Labor.
Underemployment Survey Results
Underemployment rates range from 20.3 percent in Autauga County to 33.3 percent in Butler (Table 7.1). Butler, Lowndes, and Montgomery counties had higher rates than the state. Rates are multiplied by the number of employed to get the number of underemployed workers. Table 7.2 shows the detailed underemployment survey results that include characteristics of the employed, underemployed, and nonworkers. Except for rates and their implications for labor availability, detailed county-level results are not discussed because county sample sizes are sufficient for underemployment estimation but insufficient for making reliable inferences on characteristics.
Seventy-eight percent of the employed work full-time, 11 percent holds more than one job, and 38 percent of part-time workers would like to work full-time. Commuting one-way takes up to 20 minutes for 53 percent of the employed, 11 percent take more than 40 minutes, and 3 percent spend more than an hour. Distance commuted one-way is less than 10 miles for 45 percent, more than 25 miles for 20 percent, and exceeds 45 miles for five percent. About 54 percent have 10 or more years job tenure and 30 percent have more than 20 years. The median monthly wage is between $2,000 and $3,000. More of the region’s workers are in educational services and health care sectors. Eighty-seven percent of workers say that their jobs fit well with their education, training, skills, and experience; 62 percent believe they are qualified for a better job and 20 percent have sought better jobs in the preceding three months. Offered up to 15 percent higher wages, 26 percent would leave their current jobs, but 58 percent want more than that, with 12 percent wanting more than a 50 percent raise. About 36 percent will extend the one-way commute by up to 10 miles for the higher-paying job, but 28 percent are prepared to go 20 or more extra miles; 37 percent will increase the commute by more than 20 minutes while 27 percent will not consider more than 10 minutes.

CBER, UA 2013 Underemployment in Alabama WIAAs 98
Among the underemployed, 70 percent work full-time, 15 percent hold more than one job, and 59 percent of part-time workers want full-time work. About 49 percent commute for up to 20 minutes one-way, but 15 percent take more than 40 minutes. The commute is less than 10 miles for 42 percent, more than 25 miles for 25 percent, and exceeds 45 miles for 6.1 percent. The underemployed have shorter job tenure; 47 percent have more than 10 years compared to 54 percent of employed. Both groups have similar occupation and industry distributions. The median monthly wage is between $1,000 and $2,000 but more underemployed workers earn less; 52 percent of underemployed workers earn up to $2,000 a month compared to 37 percent of the employed. About 71 percent claim that their jobs fit well with their education, training, skills, and experience; 85 percent believe they are qualified for a better job and 38 percent have sought better jobs in the preceding three months. Thirty-three percent would leave current job for up to 15 percent higher income, 52 percent want more than 15 percent higher wages, and 10 percent desires more than a 50 percent raise. For the new higher-paying job, 33 percent will add up to 10 miles to the one-way commute but 31 percent are prepared to go 20 miles or more extra; 43 percent are willing to extend commuting by more than 20 minutes one-way while 28 percent will not consider more than 10 minutes extra.
Most workers in the region are satisfied or completely satisfied with their jobs but the underemployed are less satisfied than all workers (63 percent compared to 79 percent). Workers are most satisfied with the work they do and least satisfied with their earnings. The underemployed are also most satisfied with the work they do and much less satisfied with their earnings. Workers are generally willing or completely willing to train for a new or better job, with the underemployed being much more willing—66 percent versus 54 percent. The willingness to train is highest when the cost is fully borne by government and lowest when the trainee must pay the full costs. In every case of cost burden considered, the underemployed are more willing to train for the new or better job.
A total of 1,094 complete responses were obtained in Region 7 of which 533 (48.7 percent) were employed. Primary reasons for underemployment are low wages at available jobs, a lack of job opportunities, living too far from jobs, owning a house in their area, and childcare responsibilities. The main reasons for not working are retirement, disability or other health concerns, lack of job opportunities, and social security limitations. About 60 percent employed, 44 percent nonworkers, and 48 percent underemployed are married. Men were 38 percent of employed, 31 percent nonworkers, and 39 percent underemployed. The median age is 47.5 years for employed respondents, 46 for underemployed, and 64 for nonworkers. About 48 percent of employed respondents, 55 percent nonworkers, and 54 percent of underemployed are white; Hispanics are a tiny portion of respondents. About 48 percent of the employed, 40 percent of nonworkers, and 45 percent of underemployed are African-Americans or other nonwhite ethnic groups.
Four percent of the employed and two percent of the underemployed do not hold a high school diploma or equivalent, compared to 14 percent of nonworkers. Forty-three percent of the employed and 45 percent of the underemployed hold a bachelor’s or higher degree; 14 percent of nonworkers do. WIAA Region 7 has a large educated labor pool of 56,200 that is willing to commute and is seeking higher wage jobs.

2013 Underemployment in Alabama WIAAs CBER, UA 99
Table 7.2 Underemployment Survey Results, Region 7 (Percent)
County /WIAA Autauga Butler Crenshaw Elmore
General Emp Und Emp Und Emp Und Emp Und
1. Percent of adults that are working full-time 86.2 63.6 69.8 70.6 77.8 81.8 71.9 69.2 2. Percent of part-timers who wish to work full-time 44.4 40.0 31.3 60.0 25.0 50.0 56.3 75.0 3. Percent of workers with more than one job 5.1 8.3 5.6 5.6 5.6 18.2 21.1 53.9 4. Average commute time (one-way) Up to 20 minutes 49.2 66.7 50.0 44.4 44.4 36.4 35.1 46.2
20 to 40 minutes 42.4 33.3 25.9 27.8 20.4 27.3 49.1 38.540 minutes to an hour 1.7 0.0 13.0 5.6 18.5 27.3 12.3 15.4
More than an hour 1.7 0.0 7.4 16.7 11.1 9.1 1.8 0.0 5. Commute distance Less than 10 miles 33.3 33.3 44.2 47.1 34.0 18.2 30.4 46.2
10 to 25 miles 52.6 58.3 26.9 17.7 24.5 27.3 39.3 23.125 to 45 miles 8.8 0.0 17.3 17.7 22.6 36.4 23.2 23.1
More than 45 miles 3.5 8.3 11.5 17.7 18.9 18.2 3.6 7.7 6. Occupation Management 10.2 0.0 5.6 5.6 7.4 9.1 12.3 0.0
Business/Financial Operations 5.1 8.3 7.4 5.6 3.7 0.0 8.8 7.7Computer/Mathematical 3.4 8.3 0.0 0.0 0.0 0.0 0.0 0.0
Architecture/Engineering 5.1 8.3 1.9 0.0 3.7 0.0 1.8 0.0Life/Physical/Social Science 1.7 0.0 1.9 0.0 0.0 0.0 0.0 0.0Community /Social Services 0.0 0.0 11.1 5.6 0.0 0.0 5.3 0.0
Legal 3.4 0.0 1.9 0.0 1.9 9.1 0.0 0.0Education/Training/Library 18.6 8.3 11.1 5.6 11.1 9.1 15.8 7.7
Arts/Design/Entertainment/Sports/Media 0.0 0.0 0.0 5.6 1.9 0.0 0.0 0.0Healthcare Practitioners/Technicians 1.7 0.0 11.1 16.7 7.4 0.0 1.8 7.7
Healthcare Support 0.0 0.0 0.0 0.0 5.6 0.0 10.5 7.7Protective Service 3.4 0.0 0.0 0.0 0.0 0.0 0.0 0.0
Food Preparation/Serving Related 1.7 8.3 5.6 0.0 3.7 0.0 3.5 7.7Building/Grounds Cleaning/Maintenance. 0.0 0.0 3.7 11.1 5.6 9.1 0.0 0.0
Personal Care/Service 0.0 0.0 0.0 0.0 1.9 9.1 0.0 0.0Sales and Related 8.5 16.7 13.0 11.1 5.6 9.1 10.5 23.1
Office/Administrative Support 3.4 0.0 7.4 11.1 9.3 9.1 8.8 15.4Farming/Fishing/Forestry 3.4 8.3 3.7 5.6 3.7 0.0 0.0 0.0
Construction/Extraction 5.1 8.3 1.9 5.6 1.9 9.1 1.8 7.7Installation/Maintenance/Repair 3.4 0.0 9.3 0.0 5.6 0.0 1.8 0.0
Production 3.4 0.0 1.9 0.0 11.1 18.2 3.5 0.0Transportation/Material Moving 5.1 8.3 5.6 5.6 5.6 9.1 1.8 0.0
other 13.6 16.7 5.6 5.6 3.7 0.0 12.3 15.4 7. Industry Agriculture/Forestry/Fishing/Hunting 5.1 8.3 7.4 5.6 9.3 9.1 1.8 7.7
Mining 0.0 0.0 0.0 0.0 0.0 0.0 0.0 0.0Utilities 5.1 0.0 1.9 0.0 1.9 0.0 1.8 0.0
Construction 3.4 8.3 3.7 5.6 3.7 9.1 1.8 0.0Manufacturing 8.5 0.0 5.6 0.0 9.3 18.2 5.3 0.0
Wholesale Trade 3.4 0.0 1.9 0.0 1.9 0.0 0.0 0.0Retail Trade 8.5 25.0 5.6 11.1 5.6 0.0 10.5 23.1
Transportation/Warehousing 3.4 16.7 7.4 0.0 3.7 0.0 7.0 0.0Information 0.0 0.0 0.0 0.0 1.9 0.0 1.8 0.0
Finance/Insurance 6.8 0.0 3.7 5.6 3.7 0.0 8.8 15.4Real Estate/Rental/Leasing 0.0 0.0 0.0 0.0 0.0 0.0 1.8 0.0
Professional/Scientific/Technical Services 3.4 0.0 0.0 0.0 1.9 0.0 3.5 0.0Management of Companies/Enterprises 0.0 0.0 0.0 0.0 1.9 9.1 0.0 0.0
Administrative/Support/Waste Management/Remediation 0.0 0.0 0.0 0.0 0.0 0.0 1.8 7.7Educational Services 20.3 16.7 20.4 22.2 11.1 9.1 21.1 15.4
Health Care/Social Assistance 3.4 0.0 18.5 33.3 16.7 0.0 17.5 15.4Arts/Entertainment/Recreation 1.7 0.0 0.0 0.0 1.9 0.0 0.0 0.0Accommodation/Food Services 1.7 16.7 7.4 5.6 1.9 0.0 1.8 0.0
Public Administration 5.1 0.0 1.9 0.0 5.6 0.0 0.0 0.0Other 8.5 16.7 7.4 5.6 3.7 9.1 8.8 0.0
Emp – Employed Und – Underemployed NnW – Nonworkers Note: Rounding errors may be present. Responses to questions on occupation and industry should only be used for making comparisons between the
employed and the underemployed and not for indicating worker distribution by occupation or industry.

CBER, UA 2013 Underemployment in Alabama WIAAs 100
Table 7.2 Underemployment Survey Results, Region 7 (Percent, continued) County /WIAA Lowndes Montgomery Region 7
General Emp Und Emp Und Emp Und
1. Percent of adults that are working full-time 75.5 78.6 79.9 67.7 78.1 70.2 2. Percent of part-timers who wish to work full-time 46.2 66.7 34.6 63.6 38.1 58.5 3. Percent of workers with more than one job 12.7 7.1 11.4 11.8 10.7 14.7 4. Average commute time (one-way) Up to 20 minutes 40.0 28.6 62.6 54.4 52.7 49.3
20 to 40 minutes 41.8 42.9 26.4 29.4 31.5 31.6 40 minutes to an hour 12.7 21.4 4.7 10.3 8.3 11.8
More than an hour 1.8 0.0 1.2 0.0 3.0 2.9 5. Commute distance Less than 10 miles 24.5 15.4 57.1 50.0 44.6 41.7
10 to 25 miles 43.4 46.2 31.4 33.3 34.7 33.3 25 to 45 miles 24.5 38.5 9.0 15.2 14.3 18.9
More than 45 miles 7.6 0.0 1.6 1.5 5.4 6.1 6. Occupation Management 7.3 14.3 14.6 10.3 11.4 8.1
Business/Financial Operations 1.8 0.0 3.9 2.9 4.7 3.7 Computer/Mathematical 1.8 0.0 2.4 0.0 1.7 0.7
Architecture/Engineering 0.0 0.0 2.0 2.9 2.3 2.2 Life/Physical/Social Science 0.0 8.3 1.6 0.0 0.9 0.0 Community /Social Services 3.6 0.0 2.4 5.9 2.3 3.7
Legal 3.6 0.0 2.8 0.0 2.4 0.7 Education/Training/Library 18.2 0.0 10.6 11.8 13.0 8.8
Arts/Design/Entertainment/Sports/Media 0.0 0.0 1.6 0.0 1.1 0.7 Healthcare Practitioners/Technicians 0.0 0.0 7.5 5.9 5.8 5.9
Healthcare Support 1.8 0.0 3.9 2.9 3.8 2.2 Protective Service 0.0 0.0 3.5 4.4 2.1 2.2
Food Preparation/Serving Related 3.6 7.1 1.6 1.5 2.6 2.9 Building/Grounds Cleaning/Maintenance. 1.8 0.0 2.0 2.9 2.1 3.7
Personal Care/Service 5.5 0.0 2.0 2.9 1.7 2.2 Sales and Related 3.6 7.1 5.5 5.9 6.9 9.6
Office/Administrative Support 10.9 14.3 7.9 7.4 7.9 8.8 Farming/Fishing/Forestry 3.6 0.0 0.0 0.0 1.5 1.5
Construction/Extraction 3.6 7.1 2.4 1.5 2.6 4.4 Installation/Maintenance/Repair 1.8 0.0 2.0 4.4 3.2 2.2
Production 9.1 14.3 3.9 2.9 4.9 4.4 Transportation/Material Moving 7.3 14.3 1.6 2.9 3.4 5.2
other 10.9 21.4 14.6 20.6 11.8 16.2 7. Industry Agriculture/Forestry/Fishing/Hunting 5.5 0.0 0.8 0.0 3.4 2.9
Mining 0.0 0.0 0.0 0.0 0.0 0.0 Utilities 0.0 0.0 1.6 1.5 1.9 0.7
Construction 3.6 7.1 4.3 2.9 3.8 4.4 Manufacturing 12.7 14.3 5.9 8.8 7.1 7.4
Wholesale Trade 0.0 0.0 0.0 8.8 0.8 0.0 Retail Trade 5.5 7.1 8.3 1.5 7.7 12.5
Transportation/Warehousing 5.5 7.1 1.6 0.0 3.6 2.9 Information 1.8 7.1 1.6 5.9 1.3 0.7
Finance/Insurance 0.0 0.0 5.9 1.5 5.3 5.2 Real Estate/Rental/Leasing 0.0 0.0 1.2 1.5 0.8 0.7
Professional/Scientific/Technical Services 3.6 0.0 3.2 0.0 2.8 0.7 Management of Companies/Enterprises 0.0 0.0 0.8 0.0 0.6 0.7
Administrative/Support/Waste Management/Remediation 0.0 0.0 0.8 0.0 0.6 0.7 Educational Services 23.6 21.4 13.4 19.1 16.5 18.4
Health Care/Social Assistance 7.3 7.1 13.4 13.2 13.0 13.2 Arts/Entertainment/Recreation 0.0 0.0 1.6 0.0 1.1 0.0 Accommodation/Food Services 1.8 0.0 3.2 4.4 3.0 3.7
Public Administration 3.6 0.0 9.5 13.2 6.2 6.6 Other 10.9 7.1 6.7 1.5 7.3 3.7
Emp – Employed Und – Underemployed NnW – Nonworkers Note: Rounding errors may be present. Responses to questions on occupation and industry should only be used for making comparisons between the
employed and the underemployed and not for indicating worker distribution by occupation or industry.

2013 Underemployment in Alabama WIAAs CBER, UA 101
Table 7.2 Underemployment Survey Results, Region 7 (Percent, continued) County /WIAA Autauga Butler Crenshaw Elmore
Emp Und Emp Und Emp Und Emp Und
8. Years at current/primary job Less than a year 15.3 16.7 14.8 11.1 14.8 18.2 29.8 30.8 1 to 3 years 5.1 0.0 13.0 11.1 3.7 18.2 7.0 15.43 to 5 years 1.7 0.0 3.7 5.6 1.9 0.0 8.8 7.7
5 to 10 years 13.6 0.0 14.8 16.7 20.4 27.3 14.0 15.410 to 20 years 25.4 16.7 20.4 27.8 24.1 9.1 19.3 7.7
More than 20 years 37.3 25.0 31.5 27.8 31.5 18.2 17.5 15.4
9. Monthly wages Less than $500 5.1 8.3 11.1 16.7 11.1 18.2 5.3 7.7$500 up to $1,000 8.5 25.0 9.3 16.7 9.3 0.0 17.5 15.4
$1,000 up to $2,000 10.2 16.7 22.2 16.7 16.7 27.3 24.6 38.5$2,000 up to $3,000 13.6 8.3 13.0 16.7 20.4 18.2 12.3 7.7$3,000 up to $4,000 23.7 16.7 11.1 27.8 22.2 27.3 14.0 7.7$4,000 up to $6,000 17.0 8.3 14.8 0.0 5.6 0.0 12.3 15.4
More than $6,000 15.3 16.7 13.0 5.6 5.6 9.1 8.8 0.0Job Fitness 10. Percent of workers whose current job fits well with their education and training, skills, and experience
84.8 58.3 90.7 83.3 88.9 72.7 82.5 46.2
11. Percent of workers who believe they are qualified for a better job
61.0 83.3 64.8 83.3 59.3 90.9 59.7 84.6
Reasons: Education and training 94.4 90.0 94.3 93.3 87.5 100.0 97.1 100.0Skills 100.0 100.0 88.6 86.7 93.8 100.0 91.2 81.8
Experience 97.2 100.0 100.0 100.0 93.8 90.0 97.1 100.0 12. Additional income for which workers would leave current job
0 to 5% more 3.6 0.0 10.0 7.7 0.0 0.0 16.7 66.75 to 15% more 7.1 0.0 36.7 46.2 20.7 60.0 20.8 33.3
15 to 30% more 39.3 50.0 13.3 23.1 31.0 0.0 25.0 0.030 to 50% more 7.1 0.0 20.0 15.4 27.6 0.0 12.5 0.0
More than 50% more 25.0 33.3 3.3 0.0 3.5 0.0 12.5 0.0 *** Would not leave current job 10.7 16.7 13.3 0.0 13.8 20.0 12.5 0.0
13. Additional commute for new job 0 to 10 miles 39.1 20.0 27.3 33.3 39.5 66.7 36.7 45.5
10 to 20 miles 39.1 60.0 36.4 40.0 30.2 16.7 34.7 36.4more than 20 miles 19.6 20.0 34.1 26.7 27.9 16.7 26.5 18.2
14. Additional one-way commute time 0 to 10 minutes 32.6 30.0 15.9 26.7 27.9 33.3 32.7 45.5
10 to 20 minutes 30.4 10.0 43.2 40.0 30.2 33.3 30.6 18.2more than 20 minutes 37.0 60.0 38.6 33.3 39.5 33.3 34.7 36.4
15. Percent of workers who sought better job in past three months
17.2 22.2 18.2 26.7 9.3 33.3 24.5 54.6
Underemployment 16. Percent of workers who say they are currently underemployed
20.3
33.3
20.4
22.8
17. Reasons respondents give for being Und NnW Und NnW Und NnW Und NnW
A lack of job opportunities in their area 25.0 18.2 66.7 37.0 81.8 35.5 38.5 26.2The low wages at the available jobs 41.7 18.2 66.7 32.9 72.7 21.0 69.2 24.6
They live too far from jobs 8.3 10.9 44.4 20.6 63.6 33.9 15.4 12.3They are in school or undergoing training 8.3 3.6 5.6 4.1 0.0 3.2 7.7 4.6
Their spouse or partner has a really good job 33.3 12.7 11.1 12.3 18.2 11.3 0.0 15.4They are retired 16.7 69.1 11.1 56.2 9.1 71.0 7.7 75.4
Because of social security limitations 8.3 20.0 5.6 35.6 9.1 24.2 7.7 27.7Disability or other health concerns 16.7 29.1 16.7 56.2 0.0 48.4 7.7 36.9
Child care responsibilities 25.0 16.4 27.8 4.1 27.3 11.3 15.4 9.2They take care of someone other than a child 16.7 12.7 16.7 11.0 9.1 8.1 92.3 7.7
Other family or personal obligations 50.0 21.8 33.3 8.2 18.2 22.6 23.1 13.9Owning a house in your area 12.5 9.8 40.0 19.1 55.6 30.5 36.4 10.7
Something else 16.7 25.5 27.8 20.6 9.1 25.8 23.1 24.6
Emp – Employed Und – Underemployed NnW – Nonworkers Note: Rounding errors may be present.

CBER, UA 2013 Underemployment in Alabama WIAAs 102
Table 7.2 Underemployment Survey Results, Region 7 (Percent, continued) County/WIAA Lowndes Montgomery Region 7
Emp Und Emp Und Emp Und
8. Years at current/primary job Less than a year 12.7 7.1 12.2 13.2 15.0 14.7 1 to 3 years 9.1 7.1 6.7 2.9 7.1 6.6 3 to 5 years 7.3 0.0 9.1 16.2 6.8 9.6
5 to 10 years 14.6 21.4 16.1 20.6 15.8 19.9 10 to 20 years 21.8 14.3 24.0 23.5 23.1 20.6
More than 20 years 30.9 42.9 31.1 23.5 30.4 26.5
9. Monthly wages Less than $500 7.3 21.4 5.1 7.4 6.6 11.0 $500 up to $1,000 20.0 21.4 8.7 16.2 10.9 16.2
$1,000 up to $2,000 25.5 28.6 19.3 23.5 19.5 24.3 $2,000 up to $3,000 12.7 14.3 15.4 19.1 14.8 16.2 $3,000 up to $4,000 12.7 14.3 14.2 16.2 15.6 17.7 $4,000 up to $6,000 5.5 0.0 10.2 5.9 10.7 5.2
More than $6,000 9.1 0.0 20.5 11.8 15.2 8.8 Job Fitness 10. Percent of workers whose current job fits well with their education and training, skills, and experience
90.9 78.6 86.2 73.5 86.9 71.3
11. Percent of workers who believe they are qualified for a better job
58.2 85.7 64.2 83.8 62.3 84.6
Reasons: Education and training 93.8 91.7 94.5 94.7 94.0 94.8 Skills 96.9 100.0 96.3 96.5 95.2 94.8
Experience 100.0 100.0 96.3 100.0 97.0 99.1 12. Additional income for which workers would leave current job
0 to 5% more 0.0 0.0 3.3 6.5 4.7 7.9 5 to 15% more 28.0 20.0 18.9 16.1 20.9 25.4
15 to 30% more 28.0 20.0 33.6 35.5 30.2 28.6 30 to 50% more 12.0 0.0 15.6 22.6 15.9 14.3
More than 50% more 20.0 40.0 10.7 6.5 11.6 9.5 *** Would not leave current job 4.0 0.0 14.8 6.5 12.8 6.4
13. Additional commute for new job 0 to 10 miles 38.8 30.8 34.7 29.5 35.6 32.8
10 to 20 miles 26.5 30.8 35.2 32.8 34.2 35.3 more than 20 miles 30.6 38.5 28.2 36.1 27.9 31.0
14. Additional one-way commute time 0 to 10 minutes 30.6 23.1 24.9 24.6 26.6 27.6
10 to 20 minutes 30.6 23.1 35.2 32.8 34.0 29.3 more than 20 minutes 34.7 53.9 38.0 42.6 37.4 43.1
15. Percent of workers who sought better job in past three months
22.5 38.5 21.6 39.3 19.8 37.9
Underemployment 16. Percent of workers who say they are currently underemployed
25.5
26.8
25.5
17. Reasons respondents give for being Und NnW Und NnW Und NnW
A lack of job opportunities in their area 85.7 35.0 51.5 17.9 55.9 25.1 The low wages at the available jobs 64.3 16.7 50.0 14.2 56.6 19.3
They live too far from jobs 78.6 21.7 19.1 8.1 30.9 14.8 They are in school or undergoing training 0.0 6.7 16.2 4.1 10.3 4.3
Their spouse or partner has a really good job 14.3 8.3 25.0 5.3 19.9 9.1 They are retired 0.0 55.0 14.7 67.5 11.8 66.1
Because of social security limitations 0.0 30.0 7.4 19.1 6.6 24.1 Disability or other health concerns 0.0 43.3 4.4 39.4 6.6 41.7
Child care responsibilities 7.1 6.7 35.3 12.2 27.9 10.5 They take care of someone other than a child 14.3 8.3 11.8 8.9 11.8 9.3
Other family or personal obligations 21.4 10.0 25.0 10.2 27.2 12.8 Owning a house in your area 36.4 7.0 21.7 13.0 29.0 14.8
Something else 21.4 16.7 25.0 19.5 22.8 21.2
Emp – Employed Und – Underemployed NnW – Nonworkers Note: Rounding errors may be present.

2013 Underemployment in Alabama WIAAs CBER, UA 103
Table 7.2 Underemployment Survey Results, Region 7 (Percent, continued) County/WIAA Autauga Butler Crenshaw Elmore
Selected Emp NnW Und Emp NnW Und Emp NnW Und Emp NnW Und Characteristics 18. Married Respondents 78.0 65.5 66.7 61.1 39.7 61.1 70.4 43.6 45.5 64.9 58.5 53.9 19. Sex Female 47.5 61.8 75.0 63.0 80.8 61.1 66.7 77.4 63.6 70.2 64.6 76.9
Male 52.5 38.2 25.0 37.0 19.2 38.9 33.3 22.6 36.4 29.8 35.4 23.1 20. Median age (years) 50 65 49.5 52 62 50.5 55 64.5 44 49 64.5 50 21. Ethnicity Hispanic 0.0 3.6 0.0 0.0 1.4 0.0 0.0 1.6 0.0 5.3 1.5 7.7
21b. Race White 81.4 76.4 91.7 68.5 58.9 50.0 74.1 72.6 63.6 77.2 75.4 69.2African-American/Other 11.9 16.4 0.0 29.6 35.6 50.0 24.1 27.4 27.3 14.0 18.5 23.1
22. Last school grade
High Sch./less, no diploma 6.8 9.1 0.0 1.9 20.6 5.6 3.7 24.2 9.1 5.3 4.6 0.0High School or GED 17.0 25.5 8.3 27.8 42.5 22.2 31.5 29.0 27.3 28.1 27.7 23.1
Some college, no degree 11.9 18.2 25.0 13.0 9.6 5.6 18.5 22.6 27.3 17.5 21.5 23.1Jr. College/trade
school/associate degree 18.6 16.4 41.7 18.5 13.7 16.7 24.1 11.3 18.2 8.8 13.9 15.4 4-year college graduate/BA 17.0 14.6 16.7 20.4 4.1 33.3 13.0 9.7 0.0 22.8 18.5 30.8
Postgraduate/Masters 28.8 14.6 8.3 18.5 9.6 16.7 9.3 3.2 18.2 17.5 12.3 7.7
County/WIAA Lowndes Montgomery Region 7
Selected Emp NnW Und Emp NnW Und Emp NnW Und
Characteristics 18. Married Respondents 63.6 40.0 50.0 59.8 36.6 63.2 59.6 43.5 47.6 19. Sex Female 65.5 68.3 57.1 54.3 65.9 60.3 63.2 68.8 61.1
Male 34.6 31.6 42.9 45.7 34.1 39.7 36.8 31.2 38.9 20. Median age (years) 51 64.5 50 50 65 41.5 47.5 64 46 21. Ethnicity Hispanic 0.0 1.7 0.0 1.2 0.8 1.5 1.5 1.4 2.4
21b. Race White 40.0 28.3 35.7 53.2 51.1 35.3 47.8 55.3 54.0 African-American/Other 56.4 66.7 64.3 43.7 48.1 60.3 47.8 40.3 45.2
22. Last school grade
High Sch./less, no diploma 0.0 28.3 0.0 2.0 46.3 5.9 4.4 14.1 2.4 High School or GED 36.4 40.0 42.9 20.1 48.0 17.7 21.3 30.8 20.6
Some college, no degree 9.1 6.7 7.1 15.8 0.8 13.2 14.7 16.2 18.3 Jr. College/trade
school/associate degree 14.6 6.7 21.4 8.7 0.8 10.3 16.2 10.9 13.5
4-year college graduate/BA 23.6 10.0 14.3 26.4 0.8 38.2 29.4 14.4 25.4 Postgraduate/Masters 16.4 5.0 14.3 26.4 1.2 14.7 14.0 12.7 19.8
Emp – Employed Und – Underemployed NnW – Nonworkers Note: Rounding errors may be present.
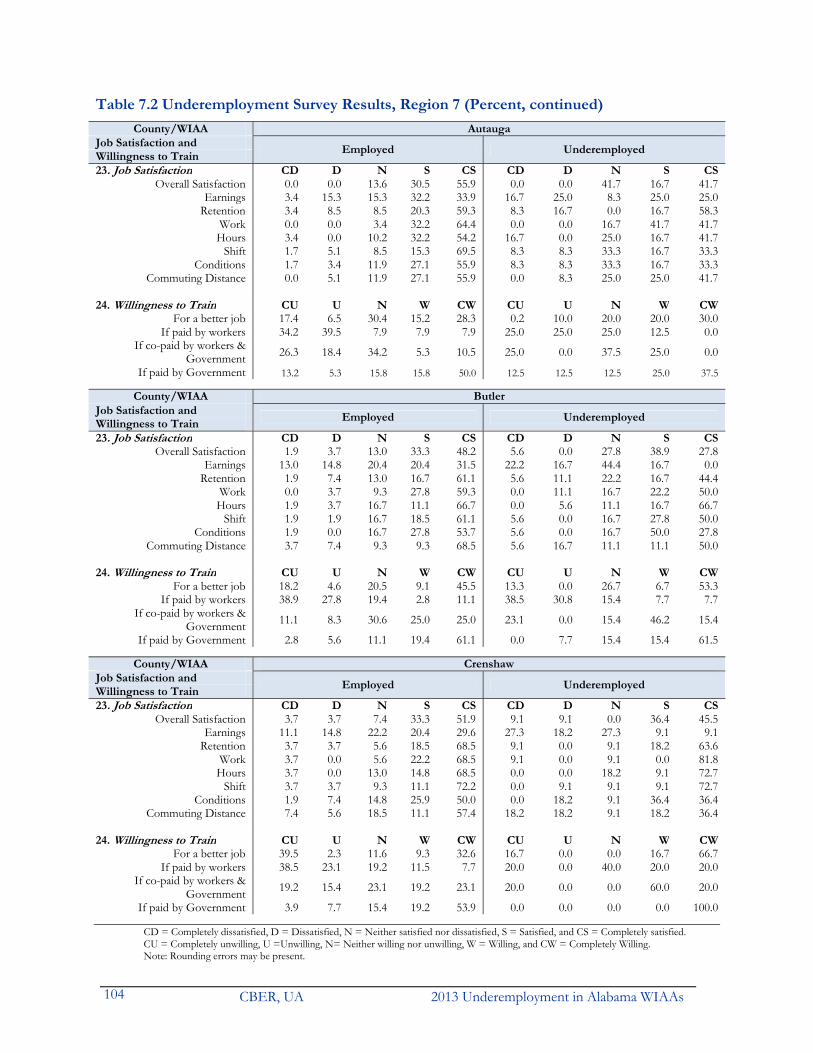
CBER, UA 2013 Underemployment in Alabama WIAAs 104
Table 7.2 Underemployment Survey Results, Region 7 (Percent, continued) County/WIAA Autauga
Job Satisfaction and Employed Underemployed
Willingness to Train 23. Job Satisfaction CD D N S CS CD D N S CS
Overall Satisfaction 0.0 0.0 13.6 30.5 55.9 0.0 0.0 41.7 16.7 41.7Earnings 3.4 15.3 15.3 32.2 33.9 16.7 25.0 8.3 25.0 25.0
Retention 3.4 8.5 8.5 20.3 59.3 8.3 16.7 0.0 16.7 58.3Work 0.0 0.0 3.4 32.2 64.4 0.0 0.0 16.7 41.7 41.7
Hours 3.4 0.0 10.2 32.2 54.2 16.7 0.0 25.0 16.7 41.7Shift 1.7 5.1 8.5 15.3 69.5 8.3 8.3 33.3 16.7 33.3
Conditions 1.7 3.4 11.9 27.1 55.9 8.3 8.3 33.3 16.7 33.3Commuting Distance 0.0 5.1 11.9 27.1 55.9 0.0 8.3 25.0 25.0 41.7
24. Willingness to Train CU U N W CW CU U N W CW
For a better job 17.4 6.5 30.4 15.2 28.3 0.2 10.0 20.0 20.0 30.0If paid by workers 34.2 39.5 7.9 7.9 7.9 25.0 25.0 25.0 12.5 0.0
If co-paid by workers & Government 26.3 18.4 34.2 5.3 10.5 25.0 0.0 37.5 25.0 0.0
If paid by Government 13.2 5.3 15.8 15.8 50.0 12.5 12.5 12.5 25.0 37.5
County/WIAA ButlerJob Satisfaction and
Employed Underemployed Willingness to Train 23. Job Satisfaction CD D N S CS CD D N S CS
Overall Satisfaction 1.9 3.7 13.0 33.3 48.2 5.6 0.0 27.8 38.9 27.8Earnings 13.0 14.8 20.4 20.4 31.5 22.2 16.7 44.4 16.7 0.0
Retention 1.9 7.4 13.0 16.7 61.1 5.6 11.1 22.2 16.7 44.4Work 0.0 3.7 9.3 27.8 59.3 0.0 11.1 16.7 22.2 50.0
Hours 1.9 3.7 16.7 11.1 66.7 0.0 5.6 11.1 16.7 66.7Shift 1.9 1.9 16.7 18.5 61.1 5.6 0.0 16.7 27.8 50.0
Conditions 1.9 0.0 16.7 27.8 53.7 5.6 0.0 16.7 50.0 27.8Commuting Distance 3.7 7.4 9.3 9.3 68.5 5.6 16.7 11.1 11.1 50.0
24. Willingness to Train CU U N W CW CU U N W CW
For a better job 18.2 4.6 20.5 9.1 45.5 13.3 0.0 26.7 6.7 53.3If paid by workers 38.9 27.8 19.4 2.8 11.1 38.5 30.8 15.4 7.7 7.7
If co-paid by workers & Government 11.1 8.3 30.6 25.0 25.0 23.1 0.0 15.4 46.2 15.4
If paid by Government 2.8 5.6 11.1 19.4 61.1 0.0 7.7 15.4 15.4 61.5
County/WIAA CrenshawJob Satisfaction and
Employed Underemployed Willingness to Train 23. Job Satisfaction CD D N S CS CD D N S CS
Overall Satisfaction 3.7 3.7 7.4 33.3 51.9 9.1 9.1 0.0 36.4 45.5Earnings 11.1 14.8 22.2 20.4 29.6 27.3 18.2 27.3 9.1 9.1
Retention 3.7 3.7 5.6 18.5 68.5 9.1 0.0 9.1 18.2 63.6Work 3.7 0.0 5.6 22.2 68.5 9.1 0.0 9.1 0.0 81.8
Hours 3.7 0.0 13.0 14.8 68.5 0.0 0.0 18.2 9.1 72.7Shift 3.7 3.7 9.3 11.1 72.2 0.0 9.1 9.1 9.1 72.7
Conditions 1.9 7.4 14.8 25.9 50.0 0.0 18.2 9.1 36.4 36.4Commuting Distance 7.4 5.6 18.5 11.1 57.4 18.2 18.2 9.1 18.2 36.4
24. Willingness to Train CU U N W CW CU U N W CW
For a better job 39.5 2.3 11.6 9.3 32.6 16.7 0.0 0.0 16.7 66.7If paid by workers 38.5 23.1 19.2 11.5 7.7 20.0 0.0 40.0 20.0 20.0
If co-paid by workers & Government 19.2 15.4 23.1 19.2 23.1 20.0 0.0 0.0 60.0 20.0
If paid by Government 3.9 7.7 15.4 19.2 53.9 0.0 0.0 0.0 0.0 100.0
CD = Completely dissatisfied, D = Dissatisfied, N = Neither satisfied nor dissatisfied, S = Satisfied, and CS = Completely satisfied. CU = Completely unwilling, U =Unwilling, N= Neither willing nor unwilling, W = Willing, and CW = Completely Willing. Note: Rounding errors may be present.

2013 Underemployment in Alabama WIAAs CBER, UA 105
Table 7.2 Underemployment Survey Results, Region 7 (Percent, continued) County/WIAA Elmore
Job Satisfaction and Employed Underemployed
Willingness to Train 23. Job Satisfaction CD D N S CS CD D N S CS
Overall Satisfaction 5.3 1.8 22.8 29.8 40.4 15.4 7.7 46.2 23.1 7.7Earnings 10.5 12.3 28.1 31.6 17.5 30.8 15.4 15.4 30.8 7.7
Retention 3.5 10.5 7.0 22.8 56.1 7.7 7.7 7.7 38.5 38.5Work 0.0 1.8 8.8 26.3 63.2 0.0 0.0 15.4 30.8 53.9
Hours 3.5 3.5 15.8 15.8 61.4 15.4 0.0 15.4 15.4 53.9Shift 3.5 3.5 8.8 24.6 59.7 15.4 7.7 7.7 30.8 38.5
Conditions 1.8 5.3 7.0 31.6 54.4 7.7 15.4 7.7 38.5 30.8Commuting Distance 3.5 1.8 21.1 21.1 52.6 7.7 0.0 23.1 30.8 38.5
24. Willingness to Train CU U N W CW CU U N W CW
For a better job 18.4 4.1 24.5 14.3 36.7 18.2 0.0 18.2 18.2 45.5If paid by workers 42.5 20.0 22.5 7.5 5.0 44.4 22.2 11.1 11.1 0.0
If co-paid by workers & Government 22.5 12.5 30.0 22.5 10.0 22.2 11.1 11.1 11.1 33.3
If paid by Government 7.5 2.5 17.5 15.0 57.5 0.0 0.0 22.2 11.1 66.7
County/WIAA LowndesJob Satisfaction and
Employed Underemployed Willingness to Train 23. Job Satisfaction CD D N S CS CD D N S CS
Overall Satisfaction 3.6 7.3 16.4 34.6 38.2 7.1 21.4 14.3 28.6 28.6Earnings 18.2 16.4 27.3 21.8 16.4 35.7 28.6 28.6 7.1 0.0
Retention 5.5 5.5 9.1 25.5 54.6 21.4 7.1 28.6 28.6 42.9Work 1.8 1.8 10.9 30.9 54.6 7.1 0.0 7.1 28.6 57.1
Hours 3.6 7.3 12.7 20.0 56.4 7.1 7.1 14.3 21.4 50.0Shift 1.8 3.6 9.1 16.4 69.1 0.0 0.0 14.3 7.1 78.6
Conditions 3.6 1.8 14.6 23.6 56.4 14.3 0.0 28.6 21.4 35.7Commuting Distance 9.1 1.8 10.9 21.8 54.6 28.6 0.0 21.4 7.1 42.9
24. Willingness to Train CU U N W CW CU U N W CW
For a better job 22.5 6.1 12.2 18.4 40.8 15.4 7.7 23.1 7.7 46.2If paid by workers 42.1 18.4 18.4 5.3 10.5 27.3 36.4 18.2 0.0 18.2
If co-paid by workers & Government 7.9 13.2 39.5 15.8 21.1 0.0 9.1 54.6 9.1 27.3
If paid by Government 2.6 0.0 5.3 26.3 60.5 0.0 0.0 0.0 18.2 81.8
County/WIAA MontgomeryJob Satisfaction and
Employed Underemployed Willingness to Train 23. Job Satisfaction CD D N S CS CD D N S CS
Overall Satisfaction 2.0 5.1 14.6 25.2 53.2 7.4 7.4 19.1 25.0 41.2Earnings 10.6 8.3 20.5 28.0 31.9 25.0 13.2 25.0 26.5 8.8
Retention 3.5 3.2 13.4 20.1 59.5 11.8 4.4 27.9 27.9 42.7Work 0.4 4.3 7.5 23.2 64.6 1.5 5.9 8.8 32.4 51.5
Hours 4.3 2.8 8.3 20.1 64.6 8.8 4.4 14.7 14.7 57.4Shift 3.5 2.4 6.3 19.3 68.5 4.4 5.9 2.9 19.1 67.7
Conditions 3.2 5.9 9.5 23.2 58.3 5.9 7.4 14.7 30.9 41.2Commuting Distance 4.3 2.0 9.1 16.1 67.7 5.9 1.5 10.3 20.6 61.8
24. Willingness to Train CU U N W CW CU U N W CW
For a better job 20.7 6.1 12.2 10.3 48.8 16.4 1.6 11.5 9.8 60.7If paid by workers 40.8 23.7 19.5 3.0 10.7 33.3 31.4 19.6 3.9 9.8
If co-paid by workers & Government 13.6 10.1 37.9 18.3 16.6 11.8 7.8 33.3 23.5 21.6
If paid by Government 7.1 1.8 10.1 13.6 66.3 2.0 0.0 7.8 9.8 80.4
CD = Completely dissatisfied, D = Dissatisfied, N = Neither satisfied nor dissatisfied, S = Satisfied, and CS = Completely satisfied. CU = Completely unwilling, U =Unwilling, N= Neither willing nor unwilling, W = Willing, and CW = Completely Willing. Note: Rounding errors may be present.

CBER, UA 2013 Underemployment in Alabama WIAAs 106
Table 7.2 Underemployment Survey Results, Region 7 (Percent, continued) County/WIAA Region 7
Job Satisfaction and Employed Underemployed
Willingness to Train 23. Job Satisfaction CD D N S CS CD D N S CS
Overall Satisfaction 2.4 4.1 14.6 28.9 49.9 7.4 7.4 22.8 27.2 35.3Earnings 10.9 11.6 21.6 26.6 28.7 25.7 16.9 25.7 22.1 8.1
Retention 3.6 5.3 10.9 20.5 59.7 11.0 6.6 25.7 25.7 45.6Work 0.8 2.8 7.5 25.7 63.2 2.2 4.4 11.0 28.7 53.7
Hours 3.8 2.8 11.1 19.5 62.9 8.1 3.7 15.4 15.4 57.4Shift 3.0 3.0 8.4 18.2 67.4 5.2 5.2 9.6 19.1 61.0
Conditions 2.6 4.7 11.3 25.3 56.1 6.6 7.4 16.9 32.4 36.8Commuting Distance 4.5 3.2 11.8 17.3 62.5 8.8 5.2 14.0 19.1 52.2
24. Willingness to Train CU U N W CW CU U N W CW
For a better job 21.9 5.4 16.2 11.9 42.6 16.4 2.6 15.5 11.2 54.3If paid by workers 40.1 24.8 18.4 4.9 9.5 33.0 28.9 19.6 6.2 9.3
If co-paid by workers & Government 15.6 11.8 34.9 17.9 17.0 14.4 6.2 29.9 25.8 20.6
If paid by Government 6.6 2.9 11.5 16.4 61.4 2.1 2.1 9.3 12.4 74.2 CD = Completely dissatisfied, D = Dissatisfied, N = Neither satisfied nor dissatisfied, S = Satisfied, and CS = Completely satisfied. CU = Completely unwilling, U =Unwilling, N= Neither willing nor unwilling, W = Willing, and CW = Completely Willing. Note: Rounding errors may be present.

2013 Underemployment in Alabama WIAAs CBER, UA 107
Underemployment in Workforce Investment Advisory Area, Region 8
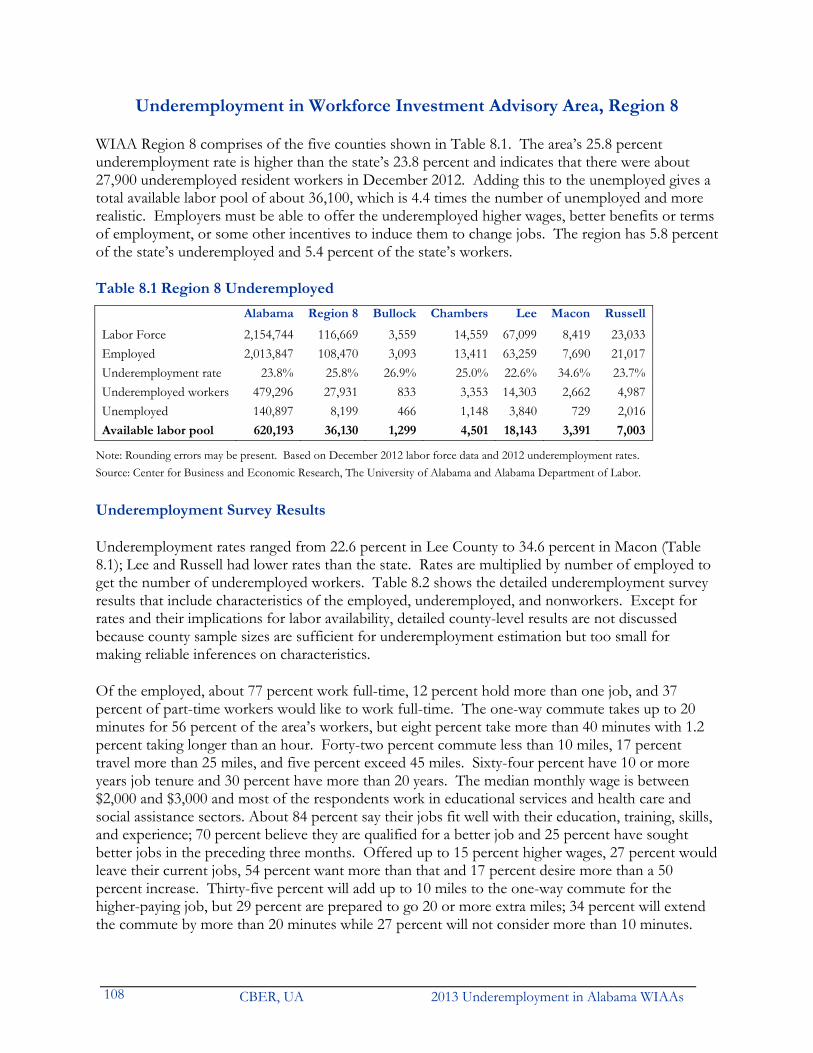
CBER, UA 2013 Underemployment in Alabama WIAAs 108
Underemployment in Workforce Investment Advisory Area, Region 8
WIAA Region 8 comprises of the five counties shown in Table 8.1. The area’s 25.8 percent underemployment rate is higher than the state’s 23.8 percent and indicates that there were about 27,900 underemployed resident workers in December 2012. Adding this to the unemployed gives a total available labor pool of about 36,100, which is 4.4 times the number of unemployed and more realistic. Employers must be able to offer the underemployed higher wages, better benefits or terms of employment, or some other incentives to induce them to change jobs. The region has 5.8 percent of the state’s underemployed and 5.4 percent of the state’s workers.
Table 8.1 Region 8 Underemployed
Alabama Region 8 Bullock Chambers Lee Macon Russell
Labor Force 2,154,744 116,669 3,559 14,559 67,099 8,419 23,033 Employed 2,013,847 108,470 3,093 13,411 63,259 7,690 21,017 Underemployment rate 23.8% 25.8% 26.9% 25.0% 22.6% 34.6% 23.7% Underemployed workers 479,296 27,931 833 3,353 14,303 2,662 4,987 Unemployed 140,897 8,199 466 1,148 3,840 729 2,016 Available labor pool 620,193 36,130 1,299 4,501 18,143 3,391 7,003
Note: Rounding errors may be present. Based on December 2012 labor force data and 2012 underemployment rates. Source: Center for Business and Economic Research, The University of Alabama and Alabama Department of Labor.
Underemployment Survey Results
Underemployment rates ranged from 22.6 percent in Lee County to 34.6 percent in Macon (Table 8.1); Lee and Russell had lower rates than the state. Rates are multiplied by number of employed to get the number of underemployed workers. Table 8.2 shows the detailed underemployment survey results that include characteristics of the employed, underemployed, and nonworkers. Except for rates and their implications for labor availability, detailed county-level results are not discussed because county sample sizes are sufficient for underemployment estimation but too small for making reliable inferences on characteristics.
Of the employed, about 77 percent work full-time, 12 percent hold more than one job, and 37 percent of part-time workers would like to work full-time. The one-way commute takes up to 20 minutes for 56 percent of the area’s workers, but eight percent take more than 40 minutes with 1.2 percent taking longer than an hour. Forty-two percent commute less than 10 miles, 17 percent travel more than 25 miles, and five percent exceed 45 miles. Sixty-four percent have 10 or more years job tenure and 30 percent have more than 20 years. The median monthly wage is between $2,000 and $3,000 and most of the respondents work in educational services and health care and social assistance sectors. About 84 percent say their jobs fit well with their education, training, skills, and experience; 70 percent believe they are qualified for a better job and 25 percent have sought better jobs in the preceding three months. Offered up to 15 percent higher wages, 27 percent would leave their current jobs, 54 percent want more than that and 17 percent desire more than a 50 percent increase. Thirty-five percent will add up to 10 miles to the one-way commute for the higher-paying job, but 29 percent are prepared to go 20 or more extra miles; 34 percent will extend the commute by more than 20 minutes while 27 percent will not consider more than 10 minutes.
2013 Underemployment in Alabama WIAAs CBER, UA 109
Among the underemployed, 57 percent work full-time, 16 percent hold more than one job, and 51 percent of part-time workers want full-time work. Commuting one-way is up to 20 minutes for 57 percent, over 40 minutes for seven percent, and exceeds an hour for two percent. The commute is less than 10 miles for 43 percent; 12 percent travel more than 25 miles and six percent exceed 45 miles. Job tenure is more than 10 years for 51 percent, less than the 64 percent of all employed. The median monthly wage is between $1,000 and $2,000 range with 62 percent earning up to $2,000 compared to 43 percent of all workers. More of the underemployed are in educational services, healthcare and social assistance, and retail trade industries with the majority in education and sales related occupations. About 70 percent claim their jobs fit well with their education, training, skills, and experience—86 percent believe they are qualified for a better job and 40 percent have sought better jobs in the preceding three months. Forty-three percent would leave current job for up to 15 percent higher income and 14 percent will do so for just up to 5 percent. Forty-three percent would leave for more than 15 percent higher wages, with 14 percent wanting more than a 50 percent raise. Thirty-three percent will add up to 10 miles to the one-way commute for the new higher-paying job, but 29 percent are prepared to add 20 miles or more; 37 percent are willing to increase the commute by more than 20 minutes while 19 percent will not consider more than 10 additional minutes.
Most workers in the region are satisfied with their jobs but the underemployed are less satisfied than all workers. Fifty-nine percent of the underemployed are satisfied or completely satisfied with their jobs compared to 75 percent of all workers. Workers are most satisfied with their work shift and least satisfied with their earnings. The underemployed are also most satisfied with their work shift and much less satisfied with their earnings. Workers are generally willing to train for a new or better job, with the underemployed being much more willing. About 66 percent of the underemployed are willing or completely willing to train for a new or better job compared to 60 percent of all workers. The willingness to train is highest when the cost is fully borne by government and lowest when the trainee must pay the full costs. In every case of cost burden considered, the underemployed are more willing to train for the new or better job.
A total of 849 respondents were interviewed in Region 8. About 39 percent or 334 respondents were employed, of whom 86 were underemployed. The main reasons given for being underemployed are a lack of job opportunities in their areas, low wages at available jobs, owning a house in their area, living too far from jobs, and other family or personal obligations. Primary reasons for not working are retirement and disability or other health concerns. Sixty-two percent employed, 42 percent nonworkers, and 58 percent underemployed are married. Men were 36 percent of employed, 29 percent nonworkers, and 36 percent underemployed. The median age is 51 for employed and underemployed workers and 66 for nonworkers. Roughly 52 percent employed, 50 percent nonworkers, and 44 percent of underemployed are white; Hispanics were a tiny portion of respondents. African-American and other ethnicities are 42 percent of the employed, 46 percent of nonworkers, and 47 percent of the underemployed.
Three percent of the employed and one percent of the underemployed do not hold a high school diploma or equivalent, compared to 20 percent of nonworkers. About 38 percent of employed and 35 percent underemployed hold a bachelor’s or higher degree; 21 percent of nonworkers do. WIAA Region 8 has a 36,130-person labor pool that is willing to commute and is seeking higher wage jobs.

CBER, UA 2013 Underemployment in Alabama WIAAs 110
Table 8.2 Underemployment Survey Results, Region 8 (Percent)
County /WIAA Bullock Chambers Lee Macon
General Emp Und Emp Und Emp Und Emp Und
1. Percent of adults that are working full-time 88.5 78.6 78.6 78.6 74.1 48.0 67.3 44.4 2. Percent of part-timers who wish to work full-time 50.0 66.7 33.3 66.7 36.7 46.2 35.3 40.0 3. Percent of workers with more than one job 15.4 14.3 3.6 0.0 18.3 19.2 11.5 33.3 4. Average commute time (one-way) Up to 20 minutes 53.9 64.3 60.7 50.0 57.4 61.5 59.6 55.6
20 to 40 minutes 23.1 7.1 23.2 35.7 34.8 38.5 34.6 38.940 minutes to an hour 15.4 14.3 10.7 7.1 4.4 0.0 3.9 5.6
More than an hour 1.9 0.0 1.8 7.1 0.0 0.0 1.9 0.0 5. Commute distance Less than 10 miles 38.0 58.3 45.5 35.7 47.3 53.9 46.2 33.3
10 to 25 miles 34.0 25.0 34.6 42.9 39.3 38.5 36.5 55.625 to 45 miles 16.0 0.0 10.9 14.3 8.9 7.7 13.5 5.6
More than 45 miles 10.0 16.7 9.1 7.1 3.6 0.0 3.9 5.6 6. Occupation Management 15.4 14.3 10.7 7.1 12.2 3.9 9.6 5.6
Business/Financial Operations 3.9 0.0 8.9 0.0 7.0 7.7 0.0 0.0Computer/Mathematical 0.0 0.0 1.8 0.0 2.6 0.0 1.9 0.0
Architecture/Engineering 0.0 0.0 5.4 0.0 1.7 0.0 0.0 0.0Life/Physical/Social Science 0.0 0.0 0.0 0.0 0.0 0.0 1.9 0.0Community /Social Services 0.0 0.0 5.4 0.0 4.4 3.9 3.9 5.6
Legal 1.9 0.0 0.0 0.0 0.9 0.0 3.9 0.0Education/Training/Library 5.8 0.0 5.4 7.1 19.1 19.2 13.5 5.6
Arts/Design/Entertainment/Sports/Media 1.9 7.1 1.8 0.0 0.0 0.0 1.9 5.6Healthcare Practitioners/Technicians 3.9 14.3 3.6 7.1 6.1 3.9 3.9 0.0
Healthcare Support 7.7 7.1 1.8 0.0 3.5 0.0 5.8 11.1Protective Service 0.0 0.0 1.8 7.1 3.5 3.9 1.9 5.6
Food Preparation/Serving Related 5.8 7.1 1.8 0.0 3.5 0.0 5.8 11.1Building/Grounds Cleaning/Maintenance. 3.9 7.1 1.8 7.1 1.7 3.9 3.9 5.6
Personal Care/Service 1.9 7.1 3.6 7.1 2.6 3.9 1.9 5.6Sales and Related 9.6 7.1 7.1 7.1 7.8 26.9 9.6 16.7
Office/Administrative Support 5.8 7.1 12.5 21.4 4.4 3.9 9.6 5.6Farming/Fishing/Forestry 5.8 7.1 0.0 0.0 0.0 0.0 0.0 0.0
Construction/Extraction 1.9 0.0 1.8 0.0 0.9 0.0 1.9 5.6Installation/Maintenance/Repair 5.8 0.0 0.0 0.0 6.1 3.9 3.9 0.0
Production 5.8 0.0 3.6 0.0 1.7 3.9 1.9 5.6Transportation/Material Moving 3.9 0.0 5.4 7.1 0.9 0.0 5.8 5.6
other 9.6 14.3 16.1 21.4 9.6 11.5 7.7 0.0 7. Industry Agriculture/Forestry/Fishing/Hunting 13.5 14.3 0.0 0.0 0.9 0.0 0.0 0.0
Mining 0.0 0.0 0.0 0.0 0.0 0.0 0.0 0.0Utilities 5.8 7.1 1.8 7.1 0.9 0.0 0.0 0.0
Construction 0.0 0.0 5.4 7.1 3.5 3.9 5.8 11.1Manufacturing 1.9 0.0 5.4 7.1 3.5 3.9 5.8 5.6
Wholesale Trade 1.9 0.0 0.0 0.0 0.0 0.0 5.8 0.0Retail Trade 7.7 7.1 5.4 0.1 9.6 26.9 3.9 11.1
Transportation/Warehousing 3.9 0.0 8.9 7.1 1.7 0.0 0.0 0.0Information 0.0 0.0 0.0 0.0 1.7 0.0 0.0 0.0
Finance/Insurance 3.9 0.0 8.9 14.3 8.7 3.9 3.9 5.6Real Estate/Rental/Leasing 0.0 0.0 0.0 0.0 0.9 0.0 0.0 0.0
Professional/Scientific/Technical Services 1.9 7.1 0.0 0.0 3.5 3.9 3.9 0.0Management of Companies/Enterprises 1.9 0.0 1.8 0.0 1.7 0.0 1.9 0.0
Administrative/Support/Waste Management/Remediation 1.9 7.1 0.0 0.0 0.9 3.9 0.0 0.0Educational Services 9.6 7.1 10.7 14.3 21.7 23.1 25.0 16.7
Health Care/Social Assistance 13.5 21.4 16.1 14.3 16.5 7.7 15.4 22.2Arts/Entertainment/Recreation 3.9 14.3 1.8 0.0 0.0 0.0 0.0 0.0Accommodation/Food Services 1.9 0.0 7.1 0.0 2.6 3.9 1.9 5.6
Public Administration 3.9 0.0 5.4 7.1 5.2 3.9 1.9 0.0Other 9.6 0.0 5.4 7.1 7.8 0.0 5.8 5.6
Emp – Employed Und – Underemployed NnW – Nonworkers Note: Rounding errors may be present. Responses to the questions on occupation and industry should only be used for making comparisons between
the employed and the underemployed and not for indicating worker distribution by occupation or industry. Except for Lee county, inferences on occupational and industry characteristics are not reliable at the county level because few and statistically unreliable responses.

2013 Underemployment in Alabama WIAAs CBER, UA 111
Table 8.2 Underemployment Survey Results, Region 8 (Percent, continued) County /WIAA Russell Region 8
General Emp Und Emp Und
1. Percent of adults that are working full-time 77.6 46.2 76.7 57.1 2. Percent of part-timers who wish to work full-time 35.7 62.5 36.7 51.4 3. Percent of workers with more than one job 3.4 7.1 11.8 16.3 4. Average commute time (one-way) Up to 20 minutes 47.5 50.0 56.0 57.0
20 to 40 minutes 44.1 35.7 32.6 32.640 minutes to an hour 3.4 0.0 6.9 4.7
More than an hour 1.7 7.1 1.2 2.3 5. Commute distance Less than 10 miles 29.8 30.8 42.3 43.4
10 to 25 miles 56.1 61.5 40.2 44.625 to 45 miles 10.5 0.0 11.4 6.0
More than 45 miles 1.8 7.7 5.2 6.0 6. Occupation Management 6.8 14.3 11.1 7.0
Business/Financial Operations 3.4 0.0 5.1 2.3Computer/Mathematical 1.7 0.0 1.8 0.0
Architecture/Engineering 0.0 0.0 1.5 0.0Life/Physical/Social Science 0.0 0.0 0.3 0.0Community /Social Services 3.4 7.1 3.6 4.7
Legal 0.0 0.0 1.2 0.0Education/Training/Library 15.3 21.4 13.2 11.6
Arts/Design/Entertainment/Sports/Media 1.7 0.0 1.2 2.3Healthcare Practitioners/Technicians 8.5 7.1 5.4 5.8
Healthcare Support 3.4 0.0 4.2 3.5Protective Service 3.4 7.1 2.4 4.7
Food Preparation/Serving Related 0.0 0.0 3.3 3.5Building/Grounds Cleaning/Maintenance. 5.1 0.0 3.0 4.7
Personal Care/Service 0.0 0.0 2.1 4.7Sales and Related 6.8 7.1 8.1 15.1
Office/Administrative Support 5.1 7.1 6.9 8.1Farming/Fishing/Forestry 0.0 0.0 0.9 1.2
Construction/Extraction 0.0 0.0 1.2 1.2Installation/Maintenance/Repair 6.8 0.0 4.8 1.2
Production 3.4 0.0 3.0 2.3Transportation/Material Moving 1.7 0.0 3.0 2.3
other 23.7 28.6 12.9 14.0 7. Industry Agriculture/Forestry/Fishing/Hunting 5.1 7.1 3.3 3.5
Mining 0.0 0.0 0.0 0.0Utilities 0.0 0.0 1.5 2.3
Construction 1.7 7.1 3.3 5.8Manufacturing 8.5 7.1 4.8 4.7
Wholesale Trade 0.0 0.0 0.3 0.0Retail Trade 6.8 7.1 7.5 12.8
Transportation/Warehousing 0.0 0.0 3.3 1.2Information 0.0 0.0 0.6 0.0
Finance/Insurance 6.8 0.0 6.9 4.7Real Estate/Rental/Leasing 0.0 0.0 0.3 0.0
Professional/Scientific/Technical Services 1.7 0.0 2.4 2.3Management of Companies/Enterprises 0.0 0.0 1.5 0.0
Administrative/Support/Waste Management/Remediation 0.0 0.0 0.6 2.3Educational Services 17.0 35.7 17.7 19.8
Health Care/Social Assistance 18.6 7.1 16.2 14.0Arts/Entertainment/Recreation 0.0 0.0 0.9 2.3Accommodation/Food Services 5.1 0.0 3.6 3.5
Public Administration 3.4 0.0 4.2 2.3Other 8.5 14.3 7.5 4.7
Emp – Employed Und – Underemployed NnW – Nonworkers Note: Rounding errors may be present. Responses to the questions on occupation and industry should only be used for making comparisons between
the employed and the underemployed and not for indicating worker distribution by occupation or industry. Except for Lee county, inferences on occupational and industry characteristics are not reliable at the county level because few and statistically unreliable responses.

CBER, UA 2013 Underemployment in Alabama WIAAs 112
Table 8.2 Underemployment Survey Results, Region 8 (Percent, continued) County /WIAA Bullock Chambers Lee Macon
Emp Und Emp Und Emp Und Emp Und
8. Years at current/primary job Less than a year 9.6 0.0 21.4 21.4 15.7 30.8 13.5 11.11 to 3 years 17.3 28.6 3.6 7.1 4.4 7.7 3.9 11.13 to 5 years 9.6 7.1 5.4 7.1 7.8 3.9 13.5 16.7
5 to 10 years 9.6 7.1 14.3 14.3 13.0 3.9 13.5 11.110 to 20 years 25.0 28.6 25.0 28.6 24.4 23.1 30.8 27.8
More than 20 years 28.9 28.6 30.4 21.4 31.3 26.9 25.0 22.2
9. Monthly wages Less than $500 0.0 0.0 7.1 7.1 8.7 15.4 5.8 11.1$500 up to $1,000 21.2 35.7 8.9 7.1 11.3 26.9 17.3 22.2
$1,000 up to $2,000 26.9 35.7 32.1 35.7 16.5 19.2 19.2 22.2$2,000 up to $3,000 25.0 21.4 19.6 7.1 16.5 15.4 17.3 16.7$3,000 up to $4,000 11.5 0.0 8.9 14.3 12.2 7.7 1.9 5.6$4,000 up to $6,000 7.7 0.0 7.1 14.3 15.7 7.7 21.2 5.6
More than $6,000 5.8 0.0 5.4 7.1 11.3 0.0 7.7 11.1Job Fitness 10. Percent of workers whose current job fits well with their education and training, skills, and experience
90.4 78.6 83.9 78.6 79.1 50.0 84.6 83.3
11. Percent of workers who believe they are qualified for a better job
69.2 92.9 64.3 85.7 66.1 88.5 69.2 66.7
Reasons: Education and training 91.7 84.6 91.7 100.0 93.4 100.0 100.0 100.0Skills 100.0 100.0 97.2 100.0 98.7 100.0 100.0 100.0
Experience 94.4 92.3 97.2 100.0 98.7 100.0 94.4 100.0 12. Additional income for which workers would leave current job
0 to 5% more 0.0 0.0 24.0 28.6 4.8 0.0 12.1 27.35 to 15% more 19.4 28.6 12.0 28.6 21.0 36.4 15.2 27.3
15 to 30% more 38.7 57.1 16.0 28.6 24.2 18.2 27.3 0.030 to 50% more 16.1 14.3 12.0 14.3 8.1 9.1 9.1 9.1
More than 50% more 16.1 0.0 4.0 0.0 19.4 27.3 24.2 27.3 *** Would not leave current job 9.7 0.0 28.0 0.0 17.7 9.1 12.1 9.1
13. Additional commute for new job 0 to 10 miles 20.8 21.4 51.2 28.6 36.1 32.0 37.8 47.1
10 to 20 miles 29.2 21.4 32.6 35.7 33.0 32.0 22.2 17.7more than 20 miles 45.8 42.9 11.6 28.6 26.8 32.0 37.8 35.3
14. Additional one-way commute time 0 to 10 minutes 16.7 7.1 32.6 14.3 27.8 20.0 31.1 29.4
10 to 20 minutes 29.2 21.4 46.5 57.1 37.1 40.0 28.9 23.5more than 20 minutes 52.1 64.3 16.3 21.4 33.0 36.0 40.0 47.1
15. Percent of workers who sought better job in past three months
16.7 14.3 20.9 35.7 27.8 52.0 22.2 35.3
Underemployment 16. Percent of workers who say they are currently underemployed
26.9 25.0 22.6
34.6
17. Reasons respondents give for being Und NnW Und NnW Und NnW Und NnW
A lack of job opportunities in their area 85.7 32.4 71.4 28.2 53.9 22.1 77.8 29.5The low wages at the available jobs 78.6 15.5 92.9 16.8 50.0 14.8 61.1 17.9
They live too far from jobs 35.7 25.4 57.1 16.8 23.1 11.5 27.8 22.1They are in school or undergoing training 0.0 4.2 0.0 2.3 0.0 4.9 11.1 0.0
Their spouse or partner has a really good job 7.1 9.9 28.6 10.7 7.7 5.7 16.7 4.2They are retired 14.3 56.3 0.0 67.9 15.4 65.6 16.7 71.6
Because of social security limitations 7.1 23.9 7.1 22.1 3.9 31.2 5.6 24.2Disability or other health concerns 7.1 43.7 7.1 48.9 15.4 46.7 11.1 49.5
Child care responsibilities 50.0 7.0 14.3 6.9 23.1 7.4 27.8 5.3They take care of someone other than a child 28.6 11.3 14.3 13.7 15.4 6.6 22.2 7.4
Other family or personal obligations 21.4 14.1 50.0 11.5 26.9 7.4 27.8 9.5Owning a house in your area 45.5 26.8 50.0 19.8 20.0 20.8 25.0 16.1
Something else 14.3 16.9 14.3 22.1 15.4 18.0 11.1 22.1
Emp – Employed Und – Underemployed NnW – Nonworkers Note: Rounding errors may be present.

2013 Underemployment in Alabama WIAAs CBER, UA 113
Table 8.2 Underemployment Survey Results, Region 8 (Percent, continued) County/WIAA Russell Region 8
Emp Und Emp Und
8. Years at current/primary job Less than a year 18.6 14.3 8.9 17.41 to 3 years 11.9 14.3 7.6 12.83 to 5 years 10.2 14.3 7.6 9.3
5 to 10 years 1.7 7.1 11.6 8.110 to 20 years 22.0 28.6 25.1 26.7
More than 20 years 35.6 21.4 38.9 24.4
9. Monthly wages Less than $500 11.9 21.4 7.2 11.6$500 up to $1,000 10.2 14.3 13.2 22.1
$1,000 up to $2,000 23.7 35.7 22.5 27.9$2,000 up to $3,000 17.0 7.1 18.6 14.0$3,000 up to $4,000 6.8 7.1 9.0 7.0$4,000 up to $6,000 13.6 0.0 13.5 5.8
More than $6,000 8.5 0.0 8.4 3.5Job Fitness 10. Percent of workers whose current job fits well with their education and training, skills, and experience
84.8 71.4 83.5 69.8
11. Percent of workers who believe they are qualified for a better job
81.4 100.0 69.5 86.1
Reasons: Education and training 87.5 85.7 92.7 94.6Skills 89.6 92.9 97.0 98.7
Experience 89.6 85.7 95.3 96.0 12. Additional income for which workers would leave current job
0 to 5% more 8.3 16.7 8.6 14.35 to 15% more 20.8 16.7 18.3 28.6
15 to 30% more 20.8 33.3 25.7 23.830 to 50% more 12.5 16.7 10.9 11.9
More than 50% more 16.7 0.0 17.1 14.3 *** Would not leave current job 20.8 16.7 17.1 7.1
13. Additional commute for new job 0 to 10 miles 31.1 30.8 35.3 32.5
10 to 20 miles 40.0 61.5 31.7 32.5more than 20 miles 22.2 0.0 28.8 28.9
14. Additional one-way commute time 0 to 10 minutes 28.9 23.1 27.3 19.3
10 to 20 minutes 42.2 61.5 36.7 39.8more than 20 minutes 24.4 15.4 33.5 37.4
15. Percent of workers who sought better job in past three months
31.1 53.9 24.5 39.8
Underemployment 16. Percent of workers who say they are currently underemployed
23.7 25.8
17. Reasons respondents give for being Und NnW Und NnW
A lack of job opportunities in their area 64.3 21.9 68.6 26.4The low wages at the available jobs 50.0 10.4 64.0 15.2
They live too far from jobs 21.4 16.7 31.4 17.7They are in school or undergoing training 0.0 3.1 2.3 2.9
Their spouse or partner has a really good job 21.4 10.4 15.1 8.2They are retired 14.3 70.8 12.8 67.0
Because of social security limitations 7.1 30.2 5.8 26.4Disability or other health concerns 7.1 54.2 10.5 48.7
Child care responsibilities 28.6 13.5 27.9 8.0They take care of someone other than a child 14.3 16.7 18.6 11.1
Other family or personal obligations 28.6 14.6 30.2 11.1Owning a house in your area 30.8 20.8 31.9 20.4
Something else 14.3 24.0 14.0 20.8
Emp – Employed Und – Underemployed NnW – Nonworkers Note: Rounding errors may be present.

CBER, UA 2013 Underemployment in Alabama WIAAs 114
Table 8.2 Underemployment Survey Results, Region 8 (Percent, continued) County/WIAA Bullock Chambers Lee Macon
Selected Emp NnW Und Emp NnW Und Emp NnW Und Emp NnW UndCharacteristics 18. Married Respondents 51.9 33.8 50.0 64.3 43.5 71.4 68.7 49.2 61.5 50.0 31.6 50.0 19. Sex Female 51.9 74.7 64.3 69.6 64.1 71.4 67.8 63.9 84.6 65.4 56.8 50.0
Male 48.1 25.4 35.7 30.4 35.9 28.6 32.2 36.1 15.4 34.6 43.2 50.0 20. Median age (years) 54 65 56 49 65 51 50 65 51 51 67 50.5 21. Ethnicity Hispanic 1.9 0.0 7.1 0.0 0.8 0.0 0.9 0.0 0.0 0.0 2.1 0.0
21b. Race White 40.4 26.8 42.9 58.9 61.8 71.4 68.7 68.9 53.9 21.2 15.8 16.7African-American/Other 53.8 67.6 57.1 33.9 49.6 21.4 25.2 29.5 30.8 73.1 77.9 72.2
22. Last school grade
High Sch./less, no diploma 5.8 15.5 0.0 10.7 24.4 7.1 1.7 14.8 0.0 0.0 13.7 0.0High School or GED 38.5 46.5 50.0 32.1 38.2 21.4 23.5 31.2 23.1 26.9 34.7 22.2
Some college, no degree 21.2 8.5 21.4 12.5 9.9 7.1 17.4 20.5 30.8 19.2 13.7 16.7Jr. College/trade
school/associate degree 13.5 9.9 14.3 10.7 8.4 28.6 11.3 10.7 11.5 11.5 5.3 11.1
4-year college graduate/BA 11.5 12.7 14.3 21.4 9.9 21.4 21.7 12.3 7.7 13.5 17.9 22.2Postgraduate/Masters 9.6 7.0 0.0 10.7 8.4 14.3 24.4 9.0 26.9 28.9 13.7 27.8
WIAA Russell Region 8
Selected Emp NnW Und Emp NnW Und Characteristics 18. Married Respondents 64.4 46.9 57.1 61.7 41.9 58.1 19. Sex Female 61.0 62.5 78.6 64.1 63.9 70.9
Male 39.0 37.5 21.4 35.9 36.1 29.1 20. Median age (years) 52 68.5 47.5 51 66 51 21. Ethnicity Hispanic 3.4 2.1 0.0 1.2 1.0 1.2
21b. Race White 49.2 59.4 35.7 51.8 49.7 44.2 African-American/Other 44.1 37.5 57.1 41.9 46.0 46.5
22. Last school grade
High Sch./less, no diploma 0.0 29.2 0.0 3.3 19.8 1.2 High School or GED 28.8 38.5 21.4 28.7 37.1 26.7
Some college, no degree 18.6 10.4 21.4 17.7 13.0 20.9 Jr. College/trade
school/associate degree 11.9 5.2 21.4 11.7 8.0 16.3
4-year college graduate/BA 22.0 11.5 28.6 18.9 12.6 17.4 Postgraduate/Masters 18.6 2.1 7.1 19.5 8.2 17.4
Emp – Employed Und – Underemployed NnW – Nonworkers Note: Rounding errors may be present.

2013 Underemployment in Alabama WIAAs CBER, UA 115
Table 8.2 Underemployment Survey Results, Region 8 (Percent, continued) County/WIAA Bullock
Job Satisfaction and Employed Underemployed
Willingness to Train 23. Job Satisfaction CD D N S CS CD D N S CS
Overall Satisfaction 3.9 3.9 17.3 32.7 42.3 0.0 7.1 21.4 14.3 57.1Earnings 15.4 9.6 25.0 36.5 13.5 21.4 14.3 35.7 14.3 14.3
Retention 3.9 1.9 11.5 32.7 50.0 7.1 0.0 14.3 35.7 42.9Work 5.8 3.9 7.7 46.2 36.5 0.0 7.1 21.4 7.1 64.3
Hours 1.9 7.7 7.7 28.9 53.9 7.1 14.3 7.1 14.3 57.1Shift 3.9 3.9 7.7 30.8 53.9 7.1 14.3 0.0 28.6 50.0
Conditions 2.0 9.6 5.8 21.2 28.9 7.1 0.0 7.1 42.9 42.9Commuting Distance 7.7 13.5 7.7 5.8 65.4 7.1 14.3 7.1 0.0 71.4
24. Willingness to Train CU U N W CW CU U N W CW
For a better job 12.5 4.2 22.9 12.5 45.8 14.3 0.0 28.6 14.3 35.7If paid by workers 50.0 21.4 16.7 4.8 4.8 41.7 25.0 25.0 0.0 0.0
If co-paid by workers & Government 19.1 11.9 26.2 21.4 19.1 8.3 8.3 16.7 33.3 25.0
If paid by Government 7.1 2.4 11.9 11.9 66.7 0.0 0.0 16.7 16.7 66.7
County/WIAA ChambersJob Satisfaction and
Employed Underemployed Willingness to Train 23. Job Satisfaction CD D N S CS CD D N S CS
Overall Satisfaction 5.4 7.1 17.9 19.6 50.0 14.3 7.1 21.4 28.6 28.6Earnings 10.7 16.1 14.3 25.0 33.9 28.6 21.4 7.1 35.7 7.1
Retention 3.6 0.0 21.4 14.3 58.9 7.1 0.0 35.7 14.3 42.9Work 3.6 3.6 16.1 17.9 58.9 7.1 7.1 14.3 28.6 42.9
Hours 1.8 3.6 14.3 26.8 53.6 0.0 14.3 28.6 21.4 35.7Shift 0.0 7.1 8.9 16.1 67.9 0.0 7.1 7.1 35.7 50.0
Conditions 7.1 1.8 12.5 26.8 51.8 14.3 0.0 7.1 42.9 35.7Commuting Distance 5.4 7.1 8.9 12.5 66.1 14.3 14.3 7.1 14.3 50.0
24. Willingness to Train CU U N W CW CU U N W CW
For a better job 20.4 10.2 10.2 12.2 44.9 20.9 0.0 14.0 14.0 51.2If paid by workers 64.1 10.3 7.7 5.1 12.8 29.4 20.6 32.4 5.9 8.8
If co-paid by workers & Government 10.3 28.2 15.4 18.0 25.6 8.8 8.8 44.1 14.7 23.5
If paid by Government 10.3 0.0 5.1 7.7 76.9 5.9 0.0 8.8 17.7 67.7
County/WIAA LeeJob Satisfaction and
Employed Underemployed Willingness to Train 23. Job Satisfaction CD D N S CS CD D N S CS
Overall Satisfaction 4.4 8.7 12.2 28.7 46.1 7.7 15.4 23.1 30.8 23.1Earnings 14.8 7.8 20.0 24.4 32.2 34.6 11.5 19.2 19.2 15.4
Retention 8.7 7.8 11.3 19.1 52.2 19.2 15.4 11.5 11.5 30.8Work 0.0 2.6 13.9 18.3 65.2 0.0 0.0 34.6 11.5 53.9
Hours 6.1 2.6 14.8 22.6 53.9 11.5 7.7 26.9 19.2 34.6Shift 5.2 0.0 8.7 14.8 71.3 11.5 0.0 11.5 11.5 65.4
Conditions 3.5 2.6 15.7 22.6 55.7 3.9 7.7 19.2 23.1 46.2Commuting Distance 1.7 6.1 5.2 13.9 73.0 0.0 3.9 7.7 7.7 80.8
24. Willingness to Train CU U N W CW CU U N W CW
For a better job 24.7 4.1 5.2 18.6 42.3 20.0 0.0 4.0 24.0 52.0If paid by workers 38.4 13.7 26.0 9.6 6.9 25.0 15.0 25.0 15.0 15.0
If co-paid by workers & Government 19.2 8.2 30.1 19.2 20.6 15.0 5.0 30.0 20.0 30.0
If paid by Government 4.1 1.4 11.0 17.8 64.4 0.0 0.0 5.0 15.0 80.0
CD = Completely dissatisfied, D = Dissatisfied, N = Neither satisfied nor dissatisfied, S = Satisfied, and CS = Completely satisfied. CU = Completely unwilling, U =Unwilling, N= Neither willing nor unwilling, W = Willing, and CW = Completely Willing. Note: Rounding errors may be present.

CBER, UA 2013 Underemployment in Alabama WIAAs 116
Table 8.2 Underemployment Survey Results, Region 8 (Percent, continued) County/WIAA Macon
Job Satisfaction and Employed Underemployed
Willingness to Train 23. Job Satisfaction CD D N S CS CD D N S CS
Overall Satisfaction 7.7 1.9 15.4 21.2 53.9 11.1 5.6 22.2 27.8 33.3Earnings 19.2 13.5 23.1 21.2 23.1 33.3 16.7 22.2 16.7 11.1
Retention 5.8 1.9 11.5 11.5 67.3 16.7 0.0 16.7 16.7 55.6Work 3.9 7.7 5.8 15.4 67.3 11.1 0.0 0.0 27.8 61.1
Hours 9.6 5.8 15.4 11.5 57.7 16.7 11.1 11.1 22.2 38.9Shift 5.8 0.0 7.7 5.8 80.8 11.1 0.0 5.6 5.6 77.8
Conditions 5.8 3.9 11.5 21.2 57.7 11.1 0.0 11.1 27.8 50.0Commuting Distance 5.8 3.9 9.6 15.4 65.4 5.6 0.0 16.7 22.2 55.6
24. Willingness to Train CU U N W CW CU U N W CW
For a better job 26.7 8.9 8.9 11.1 44.4 17.7 11.8 5.9 11.8 52.9If paid by workers 57.6 9.1 18.2 0.0 15.2 28.6 21.4 28.6 0.0 21.4
If co-paid by workers & Government 27.3 9.1 24.2 12.1 24.2 21.4 7.1 21.4 14.3 35.7
If paid by Government 6.1 6.1 0.0 3.0 81.8 7.1 7.1 0.0 7.1 71.4
County/WIAA RussellJob Satisfaction and
Employed Underemployed Willingness to Train 23. Job Satisfaction CD D N S CS CD D N S CS
Overall Satisfaction 3.4 5.1 11.9 20.3 59.3 7.1 21.4 14.3 21.4 35.7Earnings 11.8 10.1 27.1 15.2 35.5 28.6 21.4 28.6 0.0 21.4
Retention 3.4 10.2 13.6 15.3 55.9 7.1 14.3 21.4 21.4 28.6Work 3.4 1.7 6.8 22.0 66.1 7.1 0.0 21.4 0.0 71.4
Hours 10.2 1.7 8.5 22.0 57.6 21.4 0.0 7.1 21.4 50.0Shift 5.1 1.7 8.5 13.6 71.2 7.1 0.0 7.1 7.1 78.6
Conditions 3.4 5.1 17.0 18.6 55.9 7.1 14.3 21.4 21.4 35.7Commuting Distance 3.4 3.4 13.6 28.8 50.9 7.1 7.1 7.1 28.6 50.0
24. Willingness to Train CU U N W CW CU U N W CW
For a better job 24.4 4.4 6.7 2.2 55.6 15.4 0.0 0.0 0.0 76.9If paid by workers 47.1 17.7 26.5 0.0 8.8 45.5 36.4 18.2 0.0 0.0
If co-paid by workers & Government 14.7 8.8 32.4 20.6 17.7 18.2 9.1 9.1 27.3 27.3
If paid by Government 2.9 2.9 5.9 14.7 73.5 0.0 0.0 0.0 0.0 100.0
County/WIAA Region 8Job Satisfaction and
Employed Underemployed Willingness to Train 23. Job Satisfaction CD D N S CS CD D N S CS
Overall Satisfaction 4.8 6.0 14.4 25.2 49.7 8.1 11.6 20.9 25.6 33.7Earnings 14.4 10.8 21.6 24.3 28.7 30.2 16.3 22.1 17.4 14.0
Retention 5.7 5.1 13.5 18.6 56.0 12.8 7.0 18.6 18.6 39.5Work 2.7 3.6 10.8 22.8 60.2 4.7 2.3 19.8 15.1 58.1
Hours 6.0 3.9 12.6 22.5 55.1 11.6 9.3 17.4 19.8 41.9Shift 4.2 2.1 8.4 15.9 69.5 8.1 3.5 7.0 16.3 65.1
Conditions 5.4 3.6 15.6 23.4 52.1 8.1 4.7 14.0 30.2 43.0Commuting Distance 4.2 6.6 8.4 15.3 65.6 5.8 7.0 9.3 14.0 64.0
24. Willingness to Train CU U N W CW CU U N W CW
For a better job 22.3 4.3 10.4 13.0 46.8 18.1 2.4 10.8 15.7 50.6If paid by workers 43.5 16.2 24.1 5.1 8.3 33.8 22.1 25.0 5.9 10.3
If co-paid by workers & Government 18.1 9.3 31.0 18.1 20.8 14.7 10.3 22.1 23.5 26.5
If paid by Government 5.1 2.3 8.3 13.9 69.4 1.5 1.5 4.4 11.8 79.4
CD = Completely dissatisfied, D = Dissatisfied, N = Neither satisfied nor dissatisfied, S = Satisfied, and CS = Completely satisfied. CU = Completely unwilling, U =Unwilling, N= Neither willing nor unwilling, W = Willing, and CW = Completely Willing. Note: Rounding errors may be present.

2013 Underemployment in Alabama WIAAs CBER, UA 117
Underemployment in Workforce Investment Advisory Area, Region 9

CBER, UA 2013 Underemployment in Alabama WIAAs 118
Underemployment in Workforce Investment Advisory Area, Region 9
WIAA Region 9 comprises of the eight counties shown in Table 9.1. The area’s underemployment rate of 22.6 percent is less than the state’s 23.8 percent and means that about 67,500 resident workers were underemployed in December 2012. Adding the unemployed gives a total available labor pool of about 91,100 for the area, which is 3.9 times the number of unemployed. Employers must be able to offer the underemployed higher wages, better benefits or terms of employment, or some other incentives to induce them to change jobs. The region has 14.1 percent of the state’s underemployed and 14.8 percent of the state’s workers.
Table 9.1 Region 9 Underemployed
Alabama Region 9 Baldwin Choctaw ClarkeLabor Force 2,154,744 322,588 84,418 5,029 9,610Employed 2,013,847 299,015 79,214 4,634 8,563Underemployment rate 23.8% 22.6% 18.0% 25.5% 17.5%Underemployed workers 479,296 67,488 14,243 1,181 1,502Unemployed 140,897 23,573 5,204 395 1,047Available labor pool 620,193 91,061 19,447 1,576 2,549
Conecuh Escambia Mobile Monroe WashingtonLabor Force 4,369 14,509 190,597 7,437 6,619Employed 3,916 13,340 176,807 6,606 5,935Underemployment rate 22.6% 23.2% 23.9% 25.5% 22.6%Underemployed workers 884 3,096 42,292 1,681 1,344Unemployed 453 1,169 13,790 831 684Available labor pool 1,337 4,265 56,082 2,512 2,028
Note: Rounding errors may be present. Based on December 2012 labor force data and 2012 underemployment rates. Source: Center for Business and Economic Research, The University of Alabama and Alabama Department of Labor. Underemployment Survey Results
Underemployment rates ranged from 18.0 percent in Baldwin County to 25.5 percent in Choctaw and Monroe with two counties having higher rates than Alabama (Table 9.1). Applying rates to number of employed yields number of underemployed workers. Table 9.2 shows detailed survey results that include characteristics of the employed, underemployed, and nonworkers. Except for rates and their implications for labor availability, detailed county-level results are not discussed because county sample sizes are sufficient for estimating underemployment but too small for making reliable inferences on characteristics.
Of employed area residents, 78 percent work full-time, 10 percent hold multiple jobs, and 32 percent of part-time workers would like full-time jobs. The one-way commute is 20 minutes or less for 50 percent and more than 40 minutes fort 14 percent with four needing more than an hour. It is less than 10 miles for 42 percent, more than 25 miles for 21 percent, and over 45 miles for 7.7 percent. Thirty-two percent have 10 or more years job tenure—a fifth have more than 20 years—and the median monthly wage is between $2,000 and $3,000. Many work in health care and social assistance, manufacturing, and educational services industries. About 86 percent say their jobs fit well with their education, training, skills, and experience; 63 percent believe they are qualified for a better job

2013 Underemployment in Alabama WIAAs CBER, UA 119
and 22 percent have sought better jobs in the preceding three months. If offered up to 15 percent higher income, 27 percent would leave their current jobs; 54 percent want more than 15 percent with 12 percent desiring more than 50 percent. Twenty-five percent will add up to 10 miles to their one-way commute for the new higher-paying job, but 30 percent are willing to drive additional 20 miles or more—39 percent will extend the commute by more than 20 minutes while 26 percent will not consider adding more than 10 minutes.
Among the underemployed, 64 percent work full-time, 12 percent hold multiple jobs, and 55 percent of part-timers want to go full-time. Commuting one-way is up to 20 minutes for 46 percent and more than 40 minutes for 16 percent with 3.9 percent taking over an hour; 44 percent have less than 10 miles, 23 percent go more than 25 miles, and 7.4 percent exceed 45 miles. The underemployed have slightly lower job tenure than all employed, but similar distribution across industry. Fifty-four percent earn less than $2,000 compared to 35 percent of all employed. About 75 percent say their jobs fit well with their education, training, skills, and experience; 84 percent believe they are qualified for a better job and 38 percent have sought such jobs in the preceding three months. For up to 15 percent higher income, 34 percent would leave their current jobs—54 percent want more with 16 percent desiring more than a 50 percent increase. For the higher-paying job, 34 percent are willing to add up to 10 miles to the one-way commute, but 31 percent will add 20 miles or more; 38 percent will extend the commute by more than 20 minutes while 23 percent will not consider more than 10 additional minutes.
In general most workers in the Region 9 are satisfied or completely satisfied with their jobs but the underemployed feel less so (75 percent versus 57 percent). Workers are most satisfied with the work they do and least satisfied with their earnings; the underemployed are most satisfied with their work shift. Workers are generally willing or completely willing to train for a new or better job, with the underemployed being much more willing—68 percent versus 60 percent. Willingness to train is highest when the cost is fully borne by government and lowest when the trainee must pay the full costs; the underemployed are more willing even if they have to bear the full cost of the training.
Of the 1,729 respondents, 678 or 39 percent are employed and 153 said they were underemployed. Major reasons for being underemployed are a lack of job opportunities in their area, low wages at available jobs, living too far from jobs, owning a house in their area, and other family or personal obligations. Nonworkers’ main reasons for their status are retirement, disability or other health concerns, and a lack of job opportunities. Sixty-seven percent of employed respondents, 49 percent of nonworkers, and 65 percent of the underemployed are married. Men made up about 44 percent of the employed, 34 percent of nonworkers, and 39 percent of the underemployed. The median age is 53 for the employed, 67 for the underemployed, and 52 for nonworkers. About 69 percent of the employed, 64 percent of nonworkers, and 63 percent of underemployed are white. Hispanics are a very small portion of respondents; 0.7 percent of employed, 1.9 percent of nonworkers, and 2.6 percent of underemployed. African-Americans and other nonwhite ethnicities made up 27 percent of employed, 32 percent of nonworkers, and 31 percent of underemployed.
Three percent of the employed and two percent of the underemployed do not hold a high school diploma or equivalent, compared to 17 percent of nonworkers. Thirty-six percent employed and 35 percent underemployed hold a bachelor’s or higher degree; 18 percent of nonworkers do. WIAA Region 9 has 91,100 people who are seeking higher wage jobs and are willing to commute.

CBER, UA 2013 Underemployment in Alabama WIAAs 120
Table 9.2 Underemployment Survey Results, Region 9 (Percent)
County/WIAA Baldwin Choctaw Clarke Conecuh General Emp Und Emp Und Emp Und Emp Und
1. Percent of adults that are working full-time 70.8 43.8 81.6 61.5 76.8 66.7 83.3 71.4 2. Percent of part-timers who wish to work full-time 26.9 66.7 55.6 60.0 28.6 50.0 25.0 50.0 3. Percent of workers with more than one job 9.0 12.5 11.8 15.4 7.0 0.0 6.5 0.0 4. Average commute time (one-way) Up to 20 minutes 48.3 50.0 47.1 46.2 54.4 40.0 46.8 28.6
20 to 40 minutes 33.7 31.3 27.5 30.8 35.1 40.0 27.4 35.740 minutes to an hour 14.6 12.5 15.7 7.7 5.3 0.0 12.9 21.4
More than an hour 2.3 0.0 7.8 15.4 0.0 0.0 11.3 14.3 5. Commute distance Less than 10 miles 38.6 46.7 36.0 38.5 43.6 37.5 31.2 14.3
10 to 25 miles 35.2 33.3 28.0 23.1 38.2 62.5 32.8 42.925 to 45 miles 18.2 20.0 18.0 30.8 14.6 0.0 18.0 21.4
More than 45 miles 4.6 0.0 18.0 7.7 1.8 0.0 14.8 21.4 6. Occupation Management 13.5 12.5 9.8 0.0 8.8 10.0 12.9 7.1
Business/Financial Operations 4.5 0.0 2.0 0.0 5.3 0.0 6.5 14.3Computer/Mathematical 0.0 0.0 0.0 0.0 0.0 0.0 0.0 0.0
Architecture/Engineering 0.0 0.0 0.0 0.0 3.5 10.0 1.6 7.1Life/Physical/Social Science 0.0 0.0 2.0 0.0 0.0 0.0 0.0 0.0Community /Social Services 3.4 6.3 5.9 7.7 1.8 0.0 1.6 0.0
Legal 1.1 0.0 0.0 0.0 0.0 0.0 1.6 7.1Education/Training/Library 9.0 12.5 5.9 7.7 8.8 10.0 12.9 7.1
Arts/Design/Entertainment/Sports/Media 0.0 0.0 2.0 15.4 0.0 0.0 4.8 0.0Healthcare Practitioners/Technicians 9.0 6.3 5.9 15.4 1.8 0.0 3.2 7.1
Healthcare Support 12.4 18.8 9.8 0.0 7.0 20.0 6.5 7.1Protective Service 0.0 0.0 0.0 0.0 0.0 0.0 0.0 0.0
Food Preparation/Serving Related 5.6 12.5 2.0 7.7 3.5 0.0 0.0 0.0Building/Grounds Cleaning/Maintenance. 3.4 6.3 2.0 0.0 3.5 0.0 0.0 0.0
Personal Care/Service 0.0 0.0 2.0 15.4 1.8 10.0 3.2 7.1Sales and Related 9.0 6.3 7.8 15.4 7.0 0.0 4.8 0.0
Office/Administrative Support 6.7 6.3 5.9 0.0 8.8 10.0 3.2 7.1Farming/Fishing/Forestry 2.3 0.0 3.9 7.7 1.8 0.0 1.6 0.0
Construction/Extraction 3.4 0.0 3.9 0.0 0.0 0.0 6.5 0.0Installation/Maintenance/Repair 1.1 0.0 5.9 0.0 8.8 0.0 3.2 0.0
Production 2.3 0.0 9.8 0.0 1.8 0.0 8.1 21.4Transportation/Material Moving 1.1 0.0 7.8 0.0 12.3 0.0 3.2 0.0
other 12.4 12.5 5.9 7.7 14.0 20.0 14.5 7.1 7. Industry Agriculture/Forestry/Fishing/Hunting 2.3 0.0 9.8 7.7 5.3 0.0 4.8 0.0
Mining 0.0 0.0 2.0 7.7 0.0 0.0 0.0 0.0Utilities 2.3 0.0 0.0 0.0 0.0 0.0 6.5 7.1
Construction 7.9 0.0 7.8 7.7 19.3 0.0 3.2 0.0Manufacturing 2.3 0.0 13.7 0.0 0.0 10.0 21.0 35.7
Wholesale Trade 0.0 0.0 2.0 0.0 0.0 0.0 0.0 0.0Retail Trade 7.9 12.5 7.8 15.4 7.0 10.0 1.6 0.0
Transportation/Warehousing 2.3 0.0 5.9 0.0 12.3 10.0 6.5 14.3Information 1.1 6.3 0.0 0.0 0.0 0.0 0.0 0.0
Finance/Insurance 4.5 0.0 0.0 0.0 0.0 0.0 1.6 7.1Real Estate/Rental/Leasing 3.4 6.3 0.0 0.0 3.5 0.0 3.2 0.0
Professional/Scientific/Technical Services 3.4 6.3 2.0 0.0 3.5 10.0 0.0 0.0Management of Companies/Enterprises 1.1 0.0 2.0 0.0 0.0 0.0 0.0 0.0
Administrative/Support/Waste Management/Remediation 2.3 0.0 0.0 0.0 0.0 0.0 1.6 7.1Educational Services 12.4 18.8 7.8 0.0 10.5 10.0 11.3 7.1
Health Care/Social Assistance 30.3 37.5 21.6 38.5 15.8 30.0 14.5 14.3Arts/Entertainment/Recreation 1.1 0.0 3.9 7.7 0.0 0.0 1.6 0.0Accommodation/Food Services 3.4 0.0 3.9 7.7 5.3 0.0 0.0 0.0
Public Administration 1.1 0.0 2.0 7.7 3.5 0.0 0.0 0.0Other 4.5 0.0 2.0 0.0 0.0 0.0 8.1 0.0
Emp – Employed Und – Underemployed NnW – Nonworkers Note: Rounding errors may be present. Responses to the questions on occupation and industry should only be used for making comparisons between
the employed and the underemployed and not for indicating worker distribution by occupation or industry.

2013 Underemployment in Alabama WIAAs CBER, UA 121
Table 9.2 Underemployment Survey Results, Region 9 (Percent)
County/WIAA Escambia Mobile Monroe Washington General Emp Und Emp Und Emp Und Emp Und
1. Percent of adults that are working full-time 74.6 84.6 78.6 65.6 75.9 69.2 81.1 83.3 2. Percent of part-timers who wish to work full-time 40.0 85.7 24.1 33.3 61.5 100.0 30.0 50.0 3. Percent of workers with more than one job 16.1 23.1 9.8 14.8 9.1 0.0 11.3 16.7 4. Average commute time (one-way) Up to 20 minutes 69.6 61.5 47.8 47.5 45.5 42.9 47.2 50.0
20 to 40 minutes 10.7 7.7 38.8 37.7 34.6 21.4 30.2 50.040 minutes to an hour 10.7 23.1 6.7 9.8 10.9 28.6 13.2 0.0
More than an hour 1.8 0.0 2.8 1.6 7.3 7.1 5.7 0.0 5. Commute distance Less than 10 miles 61.5 58.3 44.4 50.0 34.6 42.9 41.2 41.7
10 to 25 miles 21.2 16.7 39.5 33.3 36.4 14.3 29.4 33.325 to 45 miles 7.7 8.3 10.5 11.7 12.7 14.3 17.7 25.0
More than 45 miles 9.6 16.7 4.0 1.7 12.7 28.6 11.8 0.0 6. Occupation Management 12.5 0.0 11.8 6.6 7.3 0.0 9.4 0.0
Business/Financial Operations 3.6 0.0 5.5 6.6 3.6 7.1 3.8 0.0Computer/Mathematical 0.0 0.0 2.4 3.3 0.0 0.0 0.0 0.0
Architecture/Engineering 3.6 7.7 2.8 0.0 1.8 0.0 1.9 0.0Life/Physical/Social Science 3.6 7.7 0.8 3.3 1.8 0.0 0.0 0.0Community /Social Services 3.6 15.4 1.2 1.6 3.6 0.0 5.7 8.3
Legal 3.6 0.0 1.2 0.0 1.8 7.1 0.0 0.0Education/Training/Library 7.1 7.7 10.2 11.5 7.3 14.3 9.4 0.0
Arts/Design/Entertainment/Sports/Media 0.0 0.0 1.2 0.0 0.0 0.0 0.0 0.0Healthcare Practitioners/Technicians 8.9 0.0 5.9 3.3 5.5 0.0 7.6 6.3
Healthcare Support 3.6 0.0 5.5 4.9 3.6 0.0 7.6 6.3Protective Service 1.8 0.0 1.2 1.6 1.8 0.0 0.0 0.0
Food Preparation/Serving Related 1.8 0.0 1.6 3.3 3.6 7.1 1.9 0.0Building/Grounds Cleaning/Maintenance. 1.8 0.0 1.2 3.3 5.5 14.3 1.9 0.0
Personal Care/Service 3.6 7.7 2.0 4.9 3.6 0.0 0.0 0.0Sales and Related 14.3 23.1 11.0 8.2 3.6 0.0 7.6 0.0
Office/Administrative Support 5.4 7.7 8.2 9.8 3.6 0.0 7.6 16.7Farming/Fishing/Forestry 0.0 0.0 0.4 0.0 0.0 0.0 3.8 8.3
Construction/Extraction 5.4 0.0 2.0 0.0 5.5 0.0 1.9 8.3Installation/Maintenance/Repair 5.4 0.0 3.9 4.9 5.5 7.1 5.7 16.7
Production 1.8 0.0 3.5 4.9 5.5 7.1 11.3 8.3Transportation/Material Moving 0.0 0.0 3.1 1.6 5.5 7.1 1.9 0.0
other 8.9 23.1 13.7 16.4 20.0 28.6 11.3 8.3 7. Industry Agriculture/Forestry/Fishing/Hunting 5.4 7.7 1.2 1.6 0.0 0.0 13.2 25.0
Mining 0.0 0.0 0.4 0.0 0.0 0.0 0.0 0.0Utilities 7.1 7.7 2.4 0.0 3.6 0.0 7.6 0.0
Construction 3.6 7.7 4.7 3.3 7.3 7.1 9.4 8.3Manufacturing 10.7 7.7 9.0 6.6 20.0 35.7 13.2 25.0
Wholesale Trade 0.0 0.0 2.0 0.0 0.0 0.0 0.0 0.0Retail Trade 3.6 15.4 7.5 11.5 5.5 0.0 3.8 0.0
Transportation/Warehousing 3.6 7.7 4.3 1.6 7.3 7.1 5.7 0.0Information 0.0 0.0 0.4 0.0 0.0 0.0 0.0 0.0
Finance/Insurance 0.0 0.0 3.1 3.3 0.0 0.0 1.9 0.0Real Estate/Rental/Leasing 3.6 0.0 2.0 1.6 0.0 0.0 0.0 0.0
Professional/Scientific/Technical Services 3.6 0.0 3.9 1.6 0.0 0.0 1.9 0.0Management of Companies/Enterprises 1.8 0.0 1.2 1.6 3.6 0.0 0.0 0.0
Administrative/Support/Waste Management/Remediation 5.4 0.0 0.4 0.0 0.0 0.0 1.9 0.0Educational Services 7.1 7.7 12.9 21.3 14.6 14.3 11.3 8.3
Health Care/Social Assistance 16.1 23.1 18.4 21.3 16.4 7.1 13.2 16.7Arts/Entertainment/Recreation 1.8 0.0 1.2 0.0 0.0 0.0 0.0 0.0Accommodation/Food Services 0.0 0.0 1.6 1.6 1.8 7.1 1.9 0.0
Public Administration 3.6 0.0 2.8 0.0 1.8 0.0 7.6 8.3Other 5.4 0.0 7.5 4.9 12.7 14.3 3.8 0.0
Emp – Employed Und – Underemployed NnW – Nonworkers Note: Rounding errors may be present. Responses to the questions on occupation and industry should only be used for making comparisons between
the employed and the underemployed and not for indicating worker distribution by occupation or industry.

CBER, UA 2013 Underemployment in Alabama WIAAs 122
Table 9.2 Underemployment Survey Results, Region 9 (Percent)
County/WIAA Region 9 General Emp Und
1. Percent of adults that are working full-time 77.7 64.2 2. Percent of part-timers who wish to work full-time 32.0 55.4 3. Percent of workers with more than one job 9.9 11.8 4. Average commute time (one-way) Up to 20 minutes 49.9 46.4
20 to 40 minutes 32.6 33.340 minutes to an hour 10.0 12.4
More than an hour 4.1 3.9 5. Commute distance Less than 10 miles 42.0 43.9
10 to 25 miles 34.9 31.825 to 45 miles 13.6 15.5
More than 45 miles 7.7 7.4 6. Occupation Management 11.2 5.2
Business/Financial Operations 4.7 4.6Computer/Mathematical 0.9 1.3
Architecture/Engineering 2.1 2.0Life/Physical/Social Science 0.9 2.0Community /Social Services 2.7 3.9
Legal 1.2 1.3Education/Training/Library 9.3 9.2
Arts/Design/Entertainment/Sports/Media 1.0 0.7Healthcare Practitioners/Technicians 6.1 5.2
Healthcare Support 6.8 7.8Protective Service 0.7 0.7
Food Preparation/Serving Related 2.4 3.3Building/Grounds Cleaning/Maintenance. 2.1 3.9
Personal Care/Service 1.9 3.9Sales and Related 9.0 7.2
Office/Administrative Support 6.8 9.2Farming/Fishing/Forestry 1.3 0.7
Construction/Extraction 3.1 1.3Installation/Maintenance/Repair 4.4 5.2
Production 4.7 5.2Transportation/Material Moving 3.8 2.0
other 13.0 14.4 7. Industry Agriculture/Forestry/Fishing/Hunting 3.8 3.9
Mining 0.3 0.7Utilities 3.2 1.3
Construction 5.3 3.9Manufacturing 11.8 12.4
Wholesale Trade 0.9 0.0Retail Trade 6.2 9.2
Transportation/Warehousing 5.3 3.9Information 0.3 0.7
Finance/Insurance 2.1 2.0Real Estate/Rental/Leasing 2.1 1.3
Professional/Scientific/Technical Services 2.8 2.0Management of Companies/Enterprises 1.2 0.7
Administrative/Support/Waste Management/Remediation 1.2 0.7Educational Services 11.7 14.4
Health Care/Social Assistance 18.9 22.9Arts/Entertainment/Recreation 1.2 0.7Accommodation/Food Services 2.1 2.0
Public Administration 2.7 1.3Other 6.1 3.3
Emp – Employed Und – Underemployed NnW – Nonworkers Note: Rounding errors may be present. Responses to the questions on occupation and industry should only be used for making comparisons between
the employed and the underemployed and not for indicating worker distribution by occupation or industry.

2013 Underemployment in Alabama WIAAs CBER, UA 123
Table 9.2 Underemployment Survey Results, Region 9 (Percent, continued) County/WIAA Baldwin Choctaw Clarke Conecuh
Emp Und Emp Und Emp Und Emp Und
8. Years at current/primary job Less than a year 21.4 25.0 9.8 0.0 12.3 0.0 14.5 21.4 1 to 3 years 6.7 6.3 5.9 15.4 10.5 20.0 9.7 14.33 to 5 years 10.1 18.8 9.8 15.4 5.3 10.0 4.8 0.0
5 to 10 years 9.0 6.3 23.5 15.4 12.3 20.0 11.3 7.110 to 20 years 22.5 37.5 23.5 23.1 21.1 10.0 16.1 28.6
More than 20 years 28.1 6.3 23.5 23.1 38.6 40.0 43.6 28.6
9. Monthly wages Less than $500 2.3 6.3 7.8 15.4 8.8 10.0 6.5 7.1$500 up to $1,000 10.1 18.8 17.7 38.5 14.0 10.0 9.7 14.3
$1,000 up to $2,000 22.5 31.3 13.7 15.4 19.3 20.0 27.4 28.6$2,000 up to $3,000 18.0 12.5 19.6 30.8 26.3 30.0 12.9 14.3$3,000 up to $4,000 11.2 0.0 15.7 0.0 12.3 0.0 9.7 14.3$4,000 up to $6,000 12.4 12.5 9.8 0.0 3.5 0.0 14.5 14.3
More than $6,000 13.5 6.3 9.8 0.0 12.3 20.0 8.1 7.1Job Fitness 10. Percent of workers whose current job fits well with their education and training, skills, and experience
84.3 68.8 86.3 61.5 89.5 0.0 90.3 92.9
11. Percent of workers who believe they are qualified for a better job
52.8 100.0 70.6 84.6 61.4 50.0 67.7 71.4
Reasons: Education and training 97.9 100.0 94.4 100.0 94.3 100.0 97.6 100.0Skills 91.5 93.8 100.0 100.0 94.3 100.0 95.2 100.0
Experience 93.6 93.8 100.0 100.0 97.1 100.0 97.6 100.0 12. Additional income for which workers would leave current job
0 to 5% more 5.0 14.3 9.1 0.0 4.0 20.0 3.6 16.75 to 15% more 15.0 14.3 31.8 50.0 8.0 0.0 14.3 0.0
15 to 30% more 35.0 28.6 18.2 16.7 40.0 60.0 17.9 16.730 to 50% more 12.5 42.9 18.2 16.7 20.0 0.0 35.7 33.3
More than 50% more 10.0 0.0 13.6 16.7 8.0 0.0 17.9 33.3 *** Would not leave current job 20.0 0.0 9.1 0.0 12.0 60.0 10.7 0.0
13. Additional commute for new job 0 to 10 miles 42.5 25.0 40.0 46.2 18.4 11.1 41.5 53.9
10 to 20 miles 28.8 18.8 24.4 15.4 42.9 33.3 20.8 23.1more than 20 miles 27.4 50.0 33.3 38.5 36.7 44.4 37.7 23.1
14. Additional one-way commute time 0 to 10 minutes 39.7 18.8 28.9 30.8 12.2 0.0 26.4 38.5
10 to 20 minutes 24.7 31.3 31.1 30.8 38.8 44.4 24.5 38.5more than 20 minutes 34.3 50.0 40.0 38.5 46.9 44.4 49.1 23.1
15. Percent of workers who sought better job in past three months
19.2 43.8 28.9 53.9 20.4 55.6 9.4 7.7
Underemployment 16. Percent of workers who say they are currently underemployed
18.0
25.5
17.5
22.6
17. Reasons respondents give for being Und NnW Und NnW Und NnW Und NnW
A lack of job opportunities in their area 68.8 13.5 92.3 31.7 60.0 33.7 71.4 31.1The low wages at the available jobs 50.0 11.5 92.3 28.3 60.0 19.0 71.4 23.6
They live too far from jobs 31.3 11.5 69.2 31.7 30.0 22.1 57.1 19.8They are in school or undergoing training 6.3 2.1 7.7 6.7 0.0 4.2 7.1 2.8
Their spouse or partner has a really good job 18.8 13.5 0.0 5.0 20.0 14.7 14.3 3.8They are retired 18.8 77.1 15.4 56.7 0.0 57.9 21.4 71.7
Because of social security limitations 12.5 16.7 7.7 31.7 0.0 23.2 14.3 29.3Disability or other health concerns 6.3 34.4 7.7 60.0 20.0 43.2 0.0 57.6
Child care responsibilities 25.0 8.3 23.1 5.0 10.0 14.7 28.6 8.5They take care of someone other than a child 6.3 5.2 15.4 8.3 20.0 9.5 7.1 12.3
Other family or personal obligations 37.5 8.3 15.4 13.3 30.0 10.5 35.7 12.3Owning a house in your area 61.5 17.9 40.0 30.0 60.0 12.1 14.3 14.0
Something else 6.3 26.0 7.7 11.7 10.0 23.2 7.1 15.1
Emp – Employed Und – Underemployed NnW – Nonworkers Note: Rounding errors may be present.
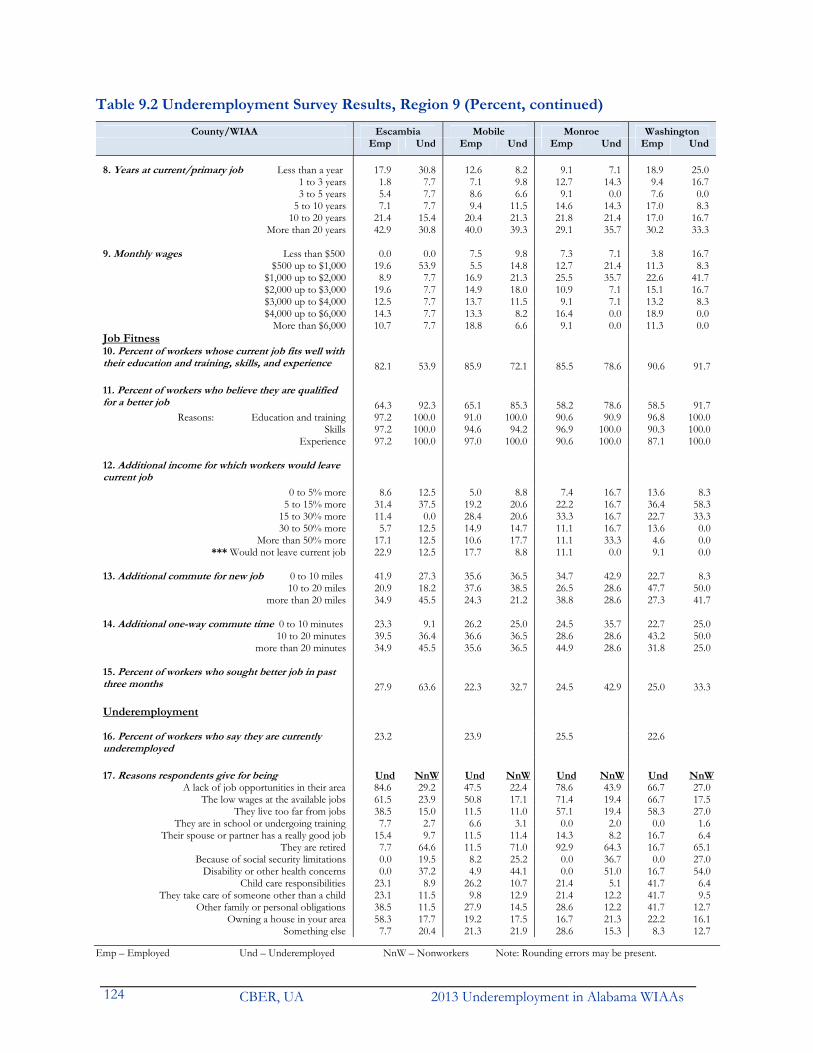
CBER, UA 2013 Underemployment in Alabama WIAAs 124
Table 9.2 Underemployment Survey Results, Region 9 (Percent, continued) County/WIAA Escambia Mobile Monroe Washington
Emp Und Emp Und Emp Und Emp Und
8. Years at current/primary job Less than a year 17.9 30.8 12.6 8.2 9.1 7.1 18.9 25.0 1 to 3 years 1.8 7.7 7.1 9.8 12.7 14.3 9.4 16.73 to 5 years 5.4 7.7 8.6 6.6 9.1 0.0 7.6 0.0
5 to 10 years 7.1 7.7 9.4 11.5 14.6 14.3 17.0 8.310 to 20 years 21.4 15.4 20.4 21.3 21.8 21.4 17.0 16.7
More than 20 years 42.9 30.8 40.0 39.3 29.1 35.7 30.2 33.3
9. Monthly wages Less than $500 0.0 0.0 7.5 9.8 7.3 7.1 3.8 16.7$500 up to $1,000 19.6 53.9 5.5 14.8 12.7 21.4 11.3 8.3
$1,000 up to $2,000 8.9 7.7 16.9 21.3 25.5 35.7 22.6 41.7$2,000 up to $3,000 19.6 7.7 14.9 18.0 10.9 7.1 15.1 16.7$3,000 up to $4,000 12.5 7.7 13.7 11.5 9.1 7.1 13.2 8.3$4,000 up to $6,000 14.3 7.7 13.3 8.2 16.4 0.0 18.9 0.0
More than $6,000 10.7 7.7 18.8 6.6 9.1 0.0 11.3 0.0Job Fitness 10. Percent of workers whose current job fits well with their education and training, skills, and experience 82.1 53.9 85.9 72.1 85.5 78.6 90.6 91.7 11. Percent of workers who believe they are qualified for a better job 64.3 92.3 65.1 85.3 58.2 78.6 58.5 91.7
Reasons: Education and training 97.2 100.0 91.0 100.0 90.6 90.9 96.8 100.0Skills 97.2 100.0 94.6 94.2 96.9 100.0 90.3 100.0
Experience 97.2 100.0 97.0 100.0 90.6 100.0 87.1 100.0 12. Additional income for which workers would leave current job
0 to 5% more 8.6 12.5 5.0 8.8 7.4 16.7 13.6 8.35 to 15% more 31.4 37.5 19.2 20.6 22.2 16.7 36.4 58.3
15 to 30% more 11.4 0.0 28.4 20.6 33.3 16.7 22.7 33.330 to 50% more 5.7 12.5 14.9 14.7 11.1 16.7 13.6 0.0
More than 50% more 17.1 12.5 10.6 17.7 11.1 33.3 4.6 0.0 *** Would not leave current job 22.9 12.5 17.7 8.8 11.1 0.0 9.1 0.0
13. Additional commute for new job 0 to 10 miles 41.9 27.3 35.6 36.5 34.7 42.9 22.7 8.3
10 to 20 miles 20.9 18.2 37.6 38.5 26.5 28.6 47.7 50.0more than 20 miles 34.9 45.5 24.3 21.2 38.8 28.6 27.3 41.7
14. Additional one-way commute time 0 to 10 minutes 23.3 9.1 26.2 25.0 24.5 35.7 22.7 25.0
10 to 20 minutes 39.5 36.4 36.6 36.5 28.6 28.6 43.2 50.0more than 20 minutes 34.9 45.5 35.6 36.5 44.9 28.6 31.8 25.0
15. Percent of workers who sought better job in past three months 27.9 63.6 22.3 32.7 24.5 42.9 25.0 33.3 Underemployment 16. Percent of workers who say they are currently underemployed
23.2
23.9
25.5
22.6
17. Reasons respondents give for being Und NnW Und NnW Und NnW Und NnW
A lack of job opportunities in their area 84.6 29.2 47.5 22.4 78.6 43.9 66.7 27.0The low wages at the available jobs 61.5 23.9 50.8 17.1 71.4 19.4 66.7 17.5
They live too far from jobs 38.5 15.0 11.5 11.0 57.1 19.4 58.3 27.0They are in school or undergoing training 7.7 2.7 6.6 3.1 0.0 2.0 0.0 1.6
Their spouse or partner has a really good job 15.4 9.7 11.5 11.4 14.3 8.2 16.7 6.4They are retired 7.7 64.6 11.5 71.0 92.9 64.3 16.7 65.1
Because of social security limitations 0.0 19.5 8.2 25.2 0.0 36.7 0.0 27.0Disability or other health concerns 0.0 37.2 4.9 44.1 0.0 51.0 16.7 54.0
Child care responsibilities 23.1 8.9 26.2 10.7 21.4 5.1 41.7 6.4They take care of someone other than a child 23.1 11.5 9.8 12.9 21.4 12.2 41.7 9.5
Other family or personal obligations 38.5 11.5 27.9 14.5 28.6 12.2 41.7 12.7Owning a house in your area 58.3 17.7 19.2 17.5 16.7 21.3 22.2 16.1
Something else 7.7 20.4 21.3 21.9 28.6 15.3 8.3 12.7
Emp – Employed Und – Underemployed NnW – Nonworkers Note: Rounding errors may be present.

2013 Underemployment in Alabama WIAAs CBER, UA 125
Table 9.2 Underemployment Survey Results, Region 9 (Percent, continued) County/WIAA Region 9
Emp Und
8. Years at current/primary job Less than a year 14.3 13.1 1 to 3 years 7.7 11.83 to 5 years 8.0 7.2
5 to 10 years 11.7 11.110 to 20 years 20.5 22.2
More than 20 years 36.0 32.0
9. Monthly wages Less than $500 5.9 9.2$500 up to $1,000 10.3 20.3
$1,000 up to $2,000 19.0 24.2$2,000 up to $3,000 16.5 17.0$3,000 up to $4,000 12.5 7.8$4,000 up to $6,000 13.0 6.5
More than $6,000 13.9 5.9Job Fitness 10. Percent of workers whose current job fits well with their education and training, skills, and experience
86.4 75.2
11. Percent of workers who believe they are qualified for a better job
62.7 84.3
Reasons: Education and training 93.9 98.5Skills 94.8 96.9
Experience 95.8 99.2 12. Additional income for which workers would leave current job
0 to 5% more 6.2 10.85 to 15% more 20.9 23.0
15 to 30% more 26.8 20.330 to 50% more 15.6 17.6
More than 50% more 11.5 16.2 *** Would not leave current job 15.9 5.4
13. Additional commute for new job 0 to 10 miles 35.3 33.6
10 to 20 miles 32.8 31.4more than 20 miles 30.1 31.4
14. Additional one-way commute time 0 to 10 minutes 26.3 22.9
10 to 20 minutes 33.7 36.4more than 20 minutes 38.5 37.9
15. Percent of workers who sought better job in past three months
21.9 38.6
Underemployment 16. Percent of workers who say they are currently underemployed
22.6
17. Reasons respondents give for being Und NnW
A lack of job opportunities in their area 64.1 27.0The low wages at the available jobs 60.8 19.0
They live too far from jobs 34.0 16.3They are in school or undergoing training 5.2 3.0
Their spouse or partner has a really good job 13.1 10.0They are retired 14.4 67.9
Because of social security limitations 6.5 25.6Disability or other health concerns 5.9 45.9
Child care responsibilities 25.5 9.3They take care of someone other than a child 15.0 11.1
Other family or personal obligations 30.7 12.6Owning a house in your area 31.1 17.6
Something else 15.0 19.7
Emp – Employed Und – Underemployed NnW – Nonworkers Note: Rounding errors may be present.

CBER, UA 2013 Underemployment in Alabama WIAAs 126
Table 9.2 Underemployment Survey Results, Region 9 (Percent, continued)
County/WIAA Baldwin Choctaw Clarke ConecuhSelected Emp NnW Und Emp NnW Und Emp NnW Und Emp NnW UndCharacteristics 18. Married Respondents 70.8 64.6 68.8 68.6 50.0 46.2 66.7 50.5 80.0 64.5 38.7 71.4 19. Sex Female 39.3 59.4 62.5 58.8 65.0 84.6 57.9 66.3 50.0 61.3 66.0 64.3
Male 60.7 40.6 37.5 41.2 35.0 15.4 42.1 33.7 50.0 38.7 34.0 35.7 20. Median age (years) 53 68.5 49.5 49 61 45 47 64 54.5 57 70 54.5 21. Ethnicity Hispanic 1.1 1.0 6.3 2.0 3.3 7.7 1.8 1.1 0.0 0.0 1.9 0.0
21b. Race White 87.6 89.6 93.8 58.8 43.3 38.5 63.2 61.1 70.0 56.5 50.0 57.1African-American/Other 9.0 5.2 6.3 37.3 50.0 46.2 29.8 37.9 10.0 40.3 44.3 42.9
22. Last school grade
High Sch./less, no diploma 0.0 9.4 0.0 3.9 26.7 0.0 1.8 8.4 0.0 9.7 22.6 0.0High School or GED 23.6 25.0 6.3 33.3 48.3 38.5 42.1 53.7 50.0 32.3 45.3 28.6
Some college, no degree 15.7 22.9 12.5 17.7 13.3 7.7 14.0 13.7 10.0 11.3 12.3 21.4Jr. College/trade
school/associate degree 14.6 9.4 31.3 19.6 3.3 30.8 22.8 10.5 30.0 16.1 7.6 21.4
4-year college graduate/BA 31.5 19.8 25.0 21.6 5.0 23.1 14.0 8.4 10.0 12.9 9.4 14.3Postgraduate/Masters 14.6 13.5 25.0 3.9 3.3 0.0 5.3 4.2 0.0 17.7 1.9 14.3
County/WIAA Escambia Mobile Monroe Washington
Selected Emp NnW Und Emp NnW Und Emp NnW Und Emp NnW UndCharacteristics 18. Married Respondents 73.2 43.4 61.5 66.3 48.1 62.3 64.3 49.0 64.7 66.0 58.7 75.0 19. Sex Female 58.9 68.1 53.9 53.7 67.4 59.0 64.3 71.4 70.6 47.2 60.3 50.0
Male 41.1 31.9 46.2 46.3 32.6 41.0 35.7 28.6 29.4 52.8 39.7 50.0 20. Median age (years) 51.5 68 51 54 67 53.5 50 64 49 47 66 48.5 21. Ethnicity Hispanic 0.0 1.8 0.0 1.2 2.1 3.3 0.0 4.1 0.0 0.0 0.0 0.0
21b. Race White 60.7 71.7 23.1 69.4 62.6 63.9 64.3 56.1 47.1 90.6 71.4 91.7African-American/Other 28.6 25.7 61.5 27.8 30.7 32.8 35.7 40.8 52.9 9.4 25.4 8.3
22. Last school grade
High Sch./less, no diploma 1.8 22.1 7.7 2.0 15.7 1.6 14.3 14.3 0.0 3.8 17.5 0.0High School or GED 32.1 38.1 38.5 23.5 36.2 19.7 28.6 56.1 41.2 28.3 41.3 41.7
Some college, no degree 10.7 13.3 7.7 18.0 15.7 21.3 14.3 10.2 17.7 15.1 15.9 0.0Jr. College/trade
school/associate degree 26.8 9.7 30.8 12.9 10.7 9.8 21.4 7.1 17.7 18.9 12.7 16.7
4-year college graduate/BA 16.1 9.7 7.7 25.9 11.9 24.6 14.3 7.1 17.7 24.5 6.4 33.3Postgraduate/Masters 12.5 6.2 7.7 10.9 8.5 7.7 7.1 5.1 5.9 9.4 6.4 8.3
County/WIAA Region 9 Selected Emp NnW UndCharacteristics 18. Married Respondents 67.0 49.2 64.7 19. Sex Female 56.3 66.3 60.8
Male 43.7 33.7 39.2 20. Median age (years) 53 67 52 21. Ethnicity Hispanic 0.7 1.9 2.6
21b. Race White 69.2 63.5 63.4African-American/Other 26.7 31.6 31.4
22. Last school grade
High Sch./less, no diploma 3.2 16.5 2.6High School or GED 28.6 40.7 26.8
Some college, no degree 15.3 14.9 15.0Jr. College/trade
school/associate degree 17.0 9.5 19.6 4-year college graduate/BA 22.4 10.7 20.9
Postgraduate/Masters 13.3 7.0 14.4
Emp – Employed Und – Underemployed NnW – Nonworkers Note: Rounding errors may be present.

2013 Underemployment in Alabama WIAAs CBER, UA 127
Table 9.2. Underemployment Survey Results, Region 9 (Percent, continued)
County/ WIAA BaldwinJob Satisfaction and
Employed Underemployed Willingness to Train 23. Job Satisfaction CD D N S CS CD D N S CS
Overall Satisfaction 2.3 4.5 15.7 25.8 51.7 6.3 0.0 31.3 31.3 31.3Earnings 5.6 10.1 21.4 34.8 28.1 25.0 0.0 31.3 31.3 12.5
Retention 3.4 4.5 11.2 20.2 59.6 18.8 6.3 18.8 25.0 31.3Work 0.0 0.0 3.4 38.2 58.4 0.0 0.0 6.3 56.3 37.5
Hours 6.7 3.4 11.2 25.8 51.7 31.3 6.3 12.5 31.3 18.8Shift 1.1 1.1 11.2 18.0 68.5 6.3 0.0 18.8 25.0 50.0
Conditions 0.0 1.1 12.4 30.3 56.2 0.0 0.0 18.8 31.3 50.0Commuting Distance 5.6 6.7 14.6 18.0 52.8 6.3 0.0 18.8 12.5 56.3
24. Willingness to Train CU U N W CW CU U N W CW
For a better job 21.9 5.5 19.2 6.9 42.5 0.0 0.0 25.0 12.5 50.0If paid by workers 36.8 19.3 21.1 7.0 12.3 31.3 18.8 25.0 6.3 18.8
If co-paid by workers & Government 12.3 8.8 33.3 24.6 15.8 6.3 6.3 31.3 37.5 12.5
If paid by Government 10.5 1.8 8.8 14.0 59.7 12.5 0.0 12.5 0.0 68.8
County/ WIAA ChoctawJob Satisfaction and
Employed Underemployed Willingness to Train 23. Job Satisfaction CD D N S CS CD D N S CS
Overall Satisfaction 2.0 5.9 17.7 25.5 49.0 7.7 15.4 30.8 23.1 23.1Earnings 17.7 13.7 25.5 23.5 19.6 61.5 30.8 7.7 0.0 0.0
Retention 2.0 2.0 15.7 23.5 56.9 0.0 7.7 30.8 23.1 38.5Work 0.0 9.8 7.8 9.8 72.6 0.0 15.4 15.4 0.0 69.2
Hours 5.9 2.0 11.8 17.7 62.8 15.4 0.0 23.1 7.7 53.9Shift 3.9 5.9 13.7 9.8 66.7 7.7 0.0 23.1 0.0 69.2
Conditions 3.9 2.0 13.7 23.5 56.9 7.7 7.7 7.7 15.4 61.5Commuting Distance 7.8 11.8 17.7 7.8 54.9 23.1 15.4 7.7 0.0 53.9
24. Willingness to Train CU U N W CW CU U N W CW
For a better job 13.3 2.2 11.1 11.1 62.2 7.7 0.0 7.7 7.7 76.9If paid by workers 43.6 20.5 18.0 2.6 12.8 58.3 8.3 25.0 0.0 8.3
If co-paid by workers & Government 10.3 7.7 46.2 20.5 15.4 16.7 8.3 41.7 8.3 25.0
If paid by Government 0.0 0.0 7.7 18.0 74.4 0.0 0.0 8.3 16.7 75.0
County/ WIAA ClarkeJob Satisfaction and
Employed Underemployed Willingness to Train 23. Job Satisfaction CD D N S CS CD D N S CS
Overall Satisfaction 3.5 3.5 17.5 24.6 50.9 0.0 10.0 30.0 40.0 20.0Earnings 14.0 10.5 19.3 33.3 22.8 30.0 20.0 10.0 20.0 20.0
Retention 5.3 5.3 17.5 12.3 59.7 10.0 10.0 30.0 10.0 40.0Work 3.5 7.0 10.5 15.8 63.2 0.0 20.0 10.0 30.0 40.0
Hours 5.3 1.8 12.3 14.0 66.7 10.0 0.0 30.0 0.0 60.0Shift 5.3 3.5 15.8 10.5 64.9 10.0 0.0 30.0 10.0 50.0
Conditions 5.3 5.3 8.8 29.8 50.9 10.0 20.0 10.0 20.0 40.0Commuting Distance 1.8 3.5 7.0 15.8 70.2 0.0 0.0 20.0 10.0 60.0
24. Willingness to Train CU U N W CW CU U N W CW
For a better job 18.4 6.1 18.4 10.2 46.9 22.2 0.0 11.1 22.2 44.4If paid by workers 50.0 25.0 17.5 2.5 2.5 28.6 14.3 28.6 14.3 14.3
If co-paid by workers & Government 20.0 12.5 25.0 15.0 25.0 14.3 14.3 14.3 14.3 42.9
If paid by Government 7.5 0.0 10.0 15.0 65.0 0.0 0.0 14.3 14.3 57.1
CD = Completely dissatisfied, D = Dissatisfied, N = Neither satisfied nor dissatisfied, S = Satisfied, and CS = Completely satisfied. CU = Completely unwilling, U =Unwilling, N= Neither willing nor unwilling, W = Willing, and CW = Completely Willing. Note: Rounding errors may be present.

CBER, UA 2013 Underemployment in Alabama WIAAs 128
Table 9.2. Underemployment Survey Results, Region 9 (Percent, continued)
County/ WIAA ConecuhJob Satisfaction and
Employed Underemployed Willingness to Train 23. Job Satisfaction CD D N S CS CD D N S CS
Overall Satisfaction 8.1 1.6 9.7 17.7 62.9 14.3 0.0 7.1 14.3 64.3Earnings 9.7 9.7 16.1 32.3 30.7 7.1 14.3 7.1 42.9 28.6
Retention 3.2 1.6 14.5 22.6 56.5 14.3 0.0 21.4 7.1 57.1Work 1.6 0.0 8.1 14.5 75.8 0.0 0.0 14.3 21.4 64.3
Hours 1.6 6.5 8.1 17.7 66.1 0.0 7.1 14.3 14.3 64.3Shift 3.2 3.2 6.5 14.5 72.6 7.1 7.1 7.1 7.1 71.4
Conditions 6.5 4.8 4.8 25.8 58.1 14.3 0.0 0.0 28.6 57.1Commuting Distance 4.8 6.5 11.3 12.9 64.5 7.1 21.4 7.1 21.4 42.9
24. Willingness to Train CU U N W CW CU U N W CW
For a better job 20.8 3.8 18.9 15.1 39.6 15.4 15.4 15.4 7.7 46.2If paid by workers 42.9 19.1 21.4 4.8 7.1 9.1 36.4 0.0 45.5 9.1
If co-paid by workers & Government 14.3 11.9 31.0 19.1 21.4 9.1 9.1 27.3 18.2 36.4
If paid by Government 7.1 2.4 2.4 21.4 64.3 9.1 0.0 0.0 27.3 63.6
County/ WIAA EscambiaJob Satisfaction and
Employed Underemployed Willingness to Train 23. Job Satisfaction CD D N S CS CD D N S CS
Overall Satisfaction 7.1 3.6 14.3 23.2 51.8 30.8 7.7 23.1 15.4 23.1Earnings 21.4 3.6 23.2 23.2 28.6 76.9 0.0 15.4 0.0 7.7
Retention 8.9 1.8 10.7 12.5 64.3 30.8 0.0 30.8 7.7 30.8Work 3.6 5.4 7.1 25.0 58.9 15.4 15.4 15.4 7.7 46.2
Hours 14.3 1.8 7.1 8.9 67.9 53.9 0.0 0.0 0.0 46.2Shift 5.4 1.8 7.1 8.9 76.8 15.4 0.0 7.7 7.7 69.2
Conditions 1.8 5.4 7.1 21.4 64.3 0.0 15.4 15.4 15.4 53.9Commuting Distance 3.6 3.6 10.7 7.1 75.0 0.0 7.7 7.7 7.7 76.9
24. Willingness to Train CU U N W CW CU U N W CW
For a better job 30.2 2.3 16.3 14.0 34.9 9.1 0.0 18.2 0.0 63.6If paid by workers 43.3 20.0 26.7 0.0 6.7 50.0 0.0 30.0 0.0 10.0
If co-paid by workers & Government 10.0 10.0 43.3 20.0 16.7 20.0 0.0 10.0 40.0 30.0
If paid by Government 6.7 3.3 16.7 13.3 60.0 0.0 0.0 0.0 10.0 90.0
County/ WIAA MobileJob Satisfaction and
Employed Underemployed Willingness to Train 23. Job Satisfaction CD D N S CS CD D N S CS
Overall Satisfaction 2.8 7.5 14.9 22.8 52.2 3.3 16.4 24.6 16.4 39.3Earnings 11.8 12.9 18.4 23.1 32.6 26.2 19.7 23.0 14.8 14.8
Retention 3.5 3.1 11.0 19.6 61.6 9.8 6.6 26.2 26.2 44.3Work 2.4 3.1 11.0 19.2 63.9 6.6 8.2 13.1 26.2 45.9
Hours 4.7 4.7 6.7 21.6 62.0 8.2 8.2 9.8 23.0 50.8Shift 2.8 4.3 8.6 14.5 68.6 1.6 9.8 14.8 14.8 57.4
Conditions 1.6 3.5 15.7 23.9 54.9 3.3 6.6 27.9 23.0 39.3Commuting Distance 3.9 4.7 12.9 13.7 63.9 3.3 6.6 13.1 16.4 60.7
24. Willingness to Train CU U N W CW CU U N W CW
For a better job 22.3 3.5 11.4 14.4 47.0 21.2 3.9 9.6 13.5 50.0If paid by workers 41.4 17.2 17.8 8.3 10.2 36.6 19.5 17.1 7.3 12.2
If co-paid by workers & Government 15.9 10.2 31.2 17.2 22.9 9.8 9.8 22.0 26.8 26.8
If paid by Government 5.1 3.8 11.5 10.8 66.9 4.9 0.0 4.9 9.8 78.1
CD = Completely dissatisfied, D = Dissatisfied, N = Neither satisfied nor dissatisfied, S = Satisfied, and CS = Completely satisfied. CU = Completely unwilling, U =Unwilling, N= Neither willing nor unwilling, W = Willing, and CW = Completely Willing. Note: Rounding errors may be present.

2013 Underemployment in Alabama WIAAs CBER, UA 129
Table 9.2. Underemployment Survey Results, Region 9 (Percent, continued)
County/ WIAA MonroeJob Satisfaction and
Employed Underemployed Willingness to Train 23. Job Satisfaction CD D N S CS CD D N S CS
Overall Satisfaction 5.5 5.5 25.5 27.3 36.4 14.3 14.3 28.6 28.6 14.3Earnings 10.9 14.6 21.8 18.2 34.6 21.4 28.6 21.4 21.4 7.1
Retention 5.5 10.9 14.6 14.6 52.7 14.3 28.6 14.3 14.3 28.6Work 1.8 3.6 9.1 25.5 60.0 7.1 7.1 14.3 35.7 35.7
Hours 7.3 7.3 10.9 21.8 52.7 14.3 14.3 14.3 35.7 21.4Shift 7.3 1.8 7.3 10.9 72.7 14.3 0.0 0.0 7.1 78.6
Conditions 7.3 7.3 12.7 21.8 50.9 21.4 7.1 7.1 28.6 35.7Commuting Distance 7.3 7.3 10.9 20.0 54.6 21.4 7.1 14.3 14.3 42.9
24. Willingness to Train CU U N W CW CU U N W CW
For a better job 16.3 6.1 12.2 24.5 40.8 7.1 0.0 14.3 14.3 64.3If paid by workers 53.7 14.6 14.6 4.9 4.9 69.2 15.4 7.7 0.0 7.7
If co-paid by workers & Government 17.1 19.5 36.6 12.2 14.6 15.4 23.1 30.8 15.4 15.4
If paid by Government 4.9 0.0 12.2 14.6 65.9 0.0 0.0 15.4 23.1 53.9
County/ WIAA WashingtonJob Satisfaction and
Employed Underemployed Willingness to Train 23. Job Satisfaction CD D N S CS CD D N S CS
Overall Satisfaction 1.9 0.0 18.9 35.9 43.4 8.3 33.3 41.7 0.0 16.7Earnings 5.7 11.3 24.5 28.3 30.2 0.0 8.3 8.3 16.7 66.7
Retention 0.0 3.8 11.3 18.9 62.3 0.0 0.0 16.7 16.7 75.0Work 0.0 0.0 3.8 30.2 66.0 0.0 0.0 12.5 18.8 68.8
Hours 1.9 3.8 13.2 26.4 54.7 0.0 16.7 8.3 8.3 66.7Shift 1.9 0.0 5.7 24.5 67.9 8.3 0.0 0.0 16.7 75.0
Conditions 1.9 1.9 7.6 32.1 56.6 8.3 0.0 8.3 25.0 58.3Commuting Distance 3.8 5.7 15.1 13.2 62.3 0.0 0.0 8.3 0.0 91.7
24. Willingness to Train CU U N W CW CU U N W CW
For a better job 9.1 6.8 15.9 18.2 47.7 16.7 0.0 0.0 25.0 58.3If paid by workers 37.5 17.5 27.5 5.0 10.0 30.0 20.0 40.0 0.0 10.0
If co-paid by workers & Government 7.5 15.0 35.0 22.5 20.0 0.0 20.0 20.0 40.0 20.0
If paid by Government 10.0 0.0 12.5 20.0 57.5 0.0 9.1 10.0 10.0 80.0
County/ WIAA Region 9Job Satisfaction and
Employed Underemployed Willingness to Train 23. Job Satisfaction CD D N S CS CD D N S CS
Overall Satisfaction 3.7 5.0 16.1 24.5 50.7 7.8 10.5 24.8 23.5 33.3Earnings 11.7 11.4 20.4 26.4 29.7 30.1 18.3 19.6 17.7 13.7
Retention 3.8 3.8 12.5 18.6 59.9 11.8 7.8 19.6 19.6 42.5Work 1.8 3.2 8.4 22.1 64.3 4.6 7.8 12.4 25.5 49.7
Hours 5.6 4.1 9.1 20.2 60.6 14.4 7.2 12.4 18.3 47.7Shift 3.4 3.1 9.3 14.3 69.5 6.5 4.6 13.1 12.4 62.8
Conditions 2.8 3.7 12.0 25.7 55.8 6.5 6.5 17.0 23.5 46.4Commuting Distance 4.6 5.8 12.7 13.9 62.4 6.5 7.2 12.4 12.4 60.1
24. Willingness to Train CU U N W CW CU U N W CW
For a better job 20.1 4.3 14.5 14.0 45.5 14.3 2.9 12.1 12.9 55.0If paid by workers 42.8 18.6 19.7 5.6 9.0 39.2 17.5 24.2 4.2 11.7
If co-paid by workers & Government 14.1 11.4 33.9 18.6 20.0 10.8 10.8 25.0 25.8 25.0
If paid by Government 6.3 2.0 10.3 14.6 64.8 4.2 0.0 7.5 12.5 72.5
CD = Completely dissatisfied, D = Dissatisfied, N = Neither satisfied nor dissatisfied, S = Satisfied, and CS = Completely satisfied. CU = Completely unwilling, U =Unwilling, N= Neither willing nor unwilling, W = Willing, and CW = Completely Willing. Note: Rounding errors may be present.

CBER, UA 2013 Underemployment in Alabama WIAAs 130
Underemployment in Workforce Investment Advisory Area, Region 10

2013 Underemployment in Alabama WIAAs CBER, UA 131
Underemployment in Workforce Investment Advisory Area, Region 10
WIAA Region 10 comprises of the eight counties shown in Table 10.1. Its underemployment rate of 22.0 percent is lower than the state’s 23.8 percent and means that about 30,500 resident workers were underemployed in December 2012. Adding the unemployed gives a total available labor pool of about 40,300, which is 4.1 times the unemployed. Employers must offer higher wages, better benefits or terms of employment, or other incentives to induce the underemployed to change jobs. The region has 6.4 percent of the state’s underemployed and 6.9 percent of the state’s workers.
Table 10.1 Region 10 Underemployed
Alabama Region 10 Barbour Coffee CovingtonLabor Force 2,154,744 148,745 9,042 21,622 16,639Employed 2,013,847 138,898 8,147 20,398 15,481Underemployment rate 23.8% 22.0% 21.4% 16.1% 17.0%Underemployed workers 479,296 30,502 1,746 3,278 2,624Unemployed 140,897 9,847 895 1,224 1,158Available labor pool 620,193 40,349 2,641 4,502 3,782
Dale Geneva Henry Houston PikeLabor Force 20,515 11,300 7,272 46,571 15,784Employed 19,132 10,612 6,791 43,582 14,755Underemployment rate 22.0% 17.3% 23.6% 26.9% 29.2%Underemployed workers 4,215 1,837 1,605 11,710 4,313Unemployed 1,383 688 481 2,989 1,029Available labor pool 5,598 2,525 2,086 14,699 5,342Note: Rounding errors may be present. Based on December 2012 labor force data and 2012 underemployment rates. Source: Center for Business and Economic Research, The University of Alabama and Alabama Department of Labor.
Underemployment Survey Results
Underemployment rates ranged from 16.1 percent in Coffee County to 29.2 percent in Pike (Table 10.1); two counties had higher rates than Alabama. Multiplying rates by number employed gives the number of underemployed. Table 10.2 shows detailed survey results including characteristics of the employed, underemployed, and nonworkers. Except for rates and their implications for labor availability, detailed county-level results are not discussed because county sample sizes are sufficient for estimating underemployment but too small for making reliable inferences on characteristics.
Seventy-nine percent of the employed work full-time, 11 percent hold multiple jobs, and 44 percent of part-timers want full-time jobs. The one-way commute is less than 20 minutes for 58 percent, over 40 minutes for 12 percent, and over an hour for 3.6 percent. It is also less than 10 miles for 50 percent, more than 25 miles for 16 percent travel, and exceeds 45 miles for 5.9 percent. Job tenure is 10 years or more for 57 percent of workers with 36 percent having more than 20 years job tenure. The median monthly wage is between $2,000 and $3,000. Many employed respondents work in health care and social assistance, educational services, retail trade, and manufacturing industries. Eighty-six percent say their jobs fit well with their education, training, skills, and experience; 63 percent believe they are qualified for a better job and 18 percent have sought better jobs in the preceding three months. Twenty-seven percent would leave their current jobs for up to 15 percent

CBER, UA 2013 Underemployment in Alabama WIAAs 132
higher income; 58 percent want more than that with 17 percent needing more than a 50 percent raise. For the higher-paying job, 34 percent is willing to increase the one-way commute by up to 10 miles, but 30 percent are ready for 20 or more additional miles; 41 percent will increase commute time by more than 20 minutes while 28 percent will not consider more than 10 extra minutes.
Among the underemployed, 61 percent are full-time, 13 percent hold more than one job, and 60 percent of part-time workers want full-time work. About 54 percent commute less than 20 minutes one-way, 13 percent take more than 40 minutes, and 2.9 percent take more than an hour; 52 percent have less than 10 miles and 19 percent travel more than 25 miles with 5.0 percent exceeding 45 miles. Job tenure is about the same as for all workers; 55 percent underemployed have 10 or more years compared to 57 percent employed. Sixty percent of the underemployed earn less than $2,000 a month compared to 40 percent of employed. There are many underemployed workers in health care and social assistance, educational services, retail trade, and agriculture. About 63 percent say their jobs fit well with their education, training, skills, and experience—88 percent believe they are qualified for a better job and 38 percent have sought better jobs in the preceding three months. About a fifth would leave current job for up to 15 percent higher income, 76 percent want more than a 15 percent increase with 26 percent wanting more than a 50 percent raise. For the higher-paying job, a quarter is willing to increase the one-way commute by up to 10 miles but 38 percent are prepared to add 20 miles or more; 51 percent are willing to extend the commute by more than 20 minutes while 23 percent will not consider adding more than 10 minutes.
Most workers (79 percent) in just Region 10 are satisfied or completely satisfied with their jobs but just 52 percent of the underemployed feel that way. Workers are most satisfied with the work they do and least satisfied with their earnings; the underemployed are most satisfied with their work shift and much less satisfied with their earnings. Workers are generally willing or completely willing to train for a better job, with the underemployed being much more willing (64 percent versus 52 percent). The willingness to train is highest when the cost is fully borne by government and lowest when the trainee must pay the full costs. Underemployed workers are more willing to train for the new or better job even if they have to bear the full cost the training.
Of the 1,153 respondents, 469 or 41 percent were employed. Primary reasons given for being underemployed are a lack of job opportunities, low wages at available jobs, owning a house in the area, other family or personal obligations, and living too far from jobs. For nonworkers status the main reasons are retirement, disability or other health concerns, a lack of job opportunities, and social security limitations. Sixty-five percent of employed respondents, 50 percent of nonworkers, and 59 percent of underemployed are married. Men made up 45 percent of the employed, a third of nonworkers, and 48 percent of the underemployed. The median age is 53 for the employed, 52.5 for the underemployed, and 67 for nonworkers. Three-quarters of the employed are white compared to 63 percent of underemployed and 71 percent of nonworkers. Three percent of employed, one percent nonworkers, and two percent underemployed are Hispanic. A fifth of employed, a third of underemployed, and 24 percent of nonworkers are African-American and other nonwhite ethnicities.
Seven percent of the employed and 11 percent of the underemployed do not hold a high school diploma or equivalent, compared to 18 percent of nonworkers. Thirty-five percent employed and 36 percent underemployed hold bachelor’s or higher degrees; 19 percent of nonworkers do. WIAA Region 10 has a 40,300-strong labor pool that is seeking high paying jobs and willing to commute.

2013 Underemployment in Alabama WIAAs CBER, UA 133
Table 10.2 Underemployment Survey Results, Region 10 (Percent)
County/WIAA Barbour Coffee Covington Dale
General Emp Und Emp Und Emp Und Emp Und
1. Percent of adults that are working full-time 82.1 91.7 76.4 44.4 79.7 50.0 79.3 61.5 2. Percent of part-timers who wish to work full-time 30.0 100.0 42.9 60.0 50.0 80.0 30.8 40.0 3. Percent of workers with more than one job 10.7 8.3 10.7 11.1 11.9 10.0 11.9 53.9 4. Average commute time (one-way) Up to 20 minutes 58.9 58.3 57.1 44.4 62.7 70.0 64.4 66.7
20 to 40 minutes 16.1 8.3 30.4 33.3 20.3 10.0 30.5 33.340 minutes to an hour 10.7 8.3 12.5 22.2 8.5 10.0 0.0 0.0
More than an hour 12.5 16.7 0.0 0.0 6.8 10.0 0.0 0.0 5. Commute distance Less than 10 miles 47.3 45.5 51.8 44.4 49.2 60.0 67.9 66.7
10 to 25 miles 25.5 27.3 32.1 22.2 27.1 20.0 28.6 25.025 to 45 miles 9.1 0.0 16.1 33.3 8.5 10.0 3.6 8.3
More than 45 miles 18.2 27.3 0.0 0.0 11.9 10.0 0.0 0.0 6. Occupation Management 10.7 8.3 5.4 0.0 13.6 20.0 3.4 0.0
Business/Financial Operations 3.6 0.0 5.4 0.0 5.1 0.0 6.8 0.0Computer/Mathematical 1.8 0.0 8.9 0.0 0.0 0.0 0.0 0.0
Architecture/Engineering 1.8 0.0 7.1 11.1 1.7 0.0 0.0 0.0Life/Physical/Social Science 0.0 0.0 0.0 0.0 0.0 0.0 0.0 0.0Community /Social Services 0.0 0.0 3.6 11.1 3.4 0.0 5.1 15.4
Legal 0.0 0.0 1.8 0.0 3.4 0.0 3.4 0.0Education/Training/Library 17.9 25.0 10.7 11.1 10.2 0.0 13.6 15.4
Arts/Design/Entertainment/Sports/Media 0.0 0.0 0.0 0.0 0.0 0.0 0.0 0.0Healthcare Practitioners/Technicians 3.6 0.0 5.4 11.1 10.2 0.0 6.8 0.0
Healthcare Support 0.0 0.0 3.6 11.1 1.7 0.0 5.1 7.7Protective Service 0.0 0.0 3.6 11.1 0.0 0.0 0.0 0.0
Food Preparation/Serving Related 7.1 0.0 3.6 0.0 0.0 0.0 1.7 7.7Building/Grounds Cleaning/Maintenance. 0.0 0.0 5.4 0.0 3.4 20.0 3.4 7.7
Personal Care/Service 0.0 0.0 0.0 0.0 3.4 0.0 1.7 0.0Sales and Related 5.4 8.3 7.1 11.1 8.5 20.0 5.1 0.0
Office/Administrative Support 3.6 8.3 5.4 11.1 10.2 20.0 1.7 0.0Farming/Fishing/Forestry 3.6 0.0 0.0 0.0 0.0 0.0 3.4 7.7
Construction/Extraction 1.8 8.3 0.0 0.0 1.7 10.0 3.4 0.0Installation/Maintenance/Repair 1.8 0.0 5.4 11.1 3.4 0.0 13.6 15.4
Production 7.1 8.3 0.0 0.0 3.4 0.0 3.4 15.4Transportation/Material Moving 8.9 8.3 48.0 0.0 6.8 10.0 3.4 0.0
other 21.4 25.0 56.0 0.0 10.2 10.0 15.3 7.7 7. Industry Agriculture/Forestry/Fishing/Hunting 7.1 8.3 0.0 0.0 0.0 0.0 5.1 15.4
Mining 0.0 0.0 0.0 0.0 0.0 0.0 0.0 0.0Utilities 1.8 0.0 1.8 0.0 5.1 0.0 1.7 0.0
Construction 1.8 0.0 1.8 0.0 3.4 10.0 5.1 0.0Manufacturing 14.3 8.3 8.9 0.0 6.8 0.0 5.1 15.4
Wholesale Trade 0.0 0.0 0.0 0.0 0.0 0.0 0.0 0.0Retail Trade 8.9 0.0 5.4 0.0 8.5 20.0 0.0 0.0
Transportation/Warehousing 3.6 8.3 5.4 11.1 3.4 0.0 3.4 0.0Information 0.0 0.0 5.4 11.1 3.4 0.0 0.0 0.0
Finance/Insurance 1.8 0.0 1.8 0.0 5.1 0.0 1.7 0.0Real Estate/Rental/Leasing 0.0 0.0 3.6 0.0 3.4 0.0 1.7 0.0
Professional/Scientific/Technical Services 5.4 0.0 3.6 0.0 1.7 10.0 3.4 0.0Management of Companies/Enterprises 0.0 0.0 1.8 0.0 0.0 0.0 0.0 0.0
Administrative/Support/Waste Management/Remediation 0.0 0.0 1.8 0.0 1.7 10.0 5.1 0.0Educational Services 17.9 16.7 10.7 11.1 13.6 20.0 13.6 15.4
Health Care/Social Assistance 5.4 8.3 14.3 22.2 15.3 0.0 22.0 15.4Arts/Entertainment/Recreation 1.8 0.0 0.0 0.0 0.0 0.0 0.0 0.0Accommodation/Food Services 3.6 0.0 1.8 0.0 5.1 0.0 1.7 0.0
Public Administration 3.6 16.7 1.8 0.0 6.8 10.0 5.1 0.0Other 10.7 16.7 14.3 33.3 5.1 10.0 8.5 7.7
Emp – Employed Und – Underemployed NnW – Nonworkers Note: Rounding errors may be present. Responses to the questions on occupation and industry should only be used for making comparisons between
the employed and the underemployed and not for indicating worker distribution by occupation or industry.

CBER, UA 2013 Underemployment in Alabama WIAAs 134
Table 10.2 Underemployment Survey Results, Region 10 (Percent) County/WIAA Geneva Henry Houston Pike
General Emp Und Emp Und Emp Und Emp Und
1. Percent of adults that are working full-time 79.6 77.8 78.2 69.2 77.3 73.3 79.7 57.9 2. Percent of part-timers who wish to work full-time 20.0 0.0 58.3 75.0 60.0 50.0 50.0 62.5 3. Percent of workers with more than one job 5.8 11.1 16.4 23.1 11.9 11.1 9.2 15.8 4. Average commute time (one-way) Up to 20 minutes 51.9 44.4 43.6 38.5 59.7 55.6 60.0 63.2
20 to 40 minutes 26.9 22.2 43.6 46.2 34.3 33.3 18.5 26.340 minutes to an hour 11.5 22.2 10.9 7.7 3.0 5.6 9.2 5.3
More than an hour 7.7 0.0 0.0 0.0 0.0 0.0 3.1 0.0 5. Commute distance Less than 10 miles 43.1 50.0 33.3 33.3 56.7 61.1 50.8 57.9
10 to 25 miles 33.3 12.5 40.7 16.7 32.8 27.8 32.8 36.825 to 45 miles 15.7 37.5 25.9 50.0 6.0 0.0 8.2 5.3
More than 45 miles 7.8 0.0 0.0 0.0 1.5 5.6 8.2 0.0 6. Occupation Management 13.5 11.1 9.1 7.7 10.5 11.1 13.9 15.8
Business/Financial Operations 1.9 0.0 3.6 0.0 9.0 11.1 7.7 5.3Computer/Mathematical 1.9 11.1 0.0 0.0 3.0 0.0 0.0 0.0
Architecture/Engineering 1.9 0.0 3.6 15.4 6.0 11.1 1.5 5.3Life/Physical/Social Science 0.0 0.0 0.0 0.0 0.0 0.0 1.5 5.3Community /Social Services 1.9 0.0 1.8 7.7 1.5 0.0 1.5 0.0
Legal 0.0 0.0 0.0 0.0 3.0 0.0 1.5 0.0Education/Training/Library 7.7 11.1 7.3 7.7 7.5 5.6 18.5 21.1
Arts/Design/Entertainment/Sports/Media 0.0 0.0 0.0 0.0 0.0 0.0 3.1 0.0Healthcare Practitioners/Technicians 9.6 11.1 3.6 7.7 6.0 0.0 6.2 0.0
Healthcare Support 1.9 0.0 9.1 0.0 4.5 5.6 1.5 5.3Protective Service 3.9 0.0 1.8 7.7 1.5 0.0 0.0 0.0
Food Preparation/Serving Related 3.9 11.1 3.6 0.0 4.5 5.6 3.1 5.3Building/Grounds Cleaning/Maintenance. 1.9 0.0 3.6 15.4 3.0 11.1 0.0 0.0
Personal Care/Service 0.0 0.0 1.8 0.0 3.0 5.6 3.1 0.0Sales and Related 5.8 0.0 3.6 7.7 13.4 11.1 12.3 10.5
Office/Administrative Support 5.8 0.0 9.1 0.0 6.0 5.6 4.6 5.3Farming/Fishing/Forestry 5.8 22.2 1.8 0.0 0.0 0.0 3.1 0.0
Construction/Extraction 0.0 0.0 5.5 7.7 4.5 11.1 1.5 5.3Installation/Maintenance/Repair 15.4 11.1 7.3 0.0 1.5 0.0 0.0 0.0
Production 3.9 0.0 1.8 0.0 1.5 0.0 3.1 0.0Transportation/Material Moving 1.9 0.0 7.3 7.7 3.0 0.0 1.5 5.3
other 11.5 0.0 14.6 7.7 7.5 5.6 10.8 10.5 7. Industry Agriculture/Forestry/Fishing/Hunting 9.6 22.2 7.3 0.0 4.5 11.1 6.2 5.3
Mining 0.0 0.0 0.0 0.0 0.0 0.0 0.0 0.0Utilities 1.9 0.0 5.5 0.0 4.5 5.6 1.5 0.0
Construction 1.9 0.0 0.0 0.0 3.0 0.0 3.1 10.5Manufacturing 11.5 22.2 7.3 7.7 3.0 0.0 4.6 5.3
Wholesale Trade 1.9 0.0 1.8 0.0 1.5 5.6 0.0 0.0Retail Trade 1.9 0.0 10.9 7.7 7.5 16.7 18.5 15.8
Transportation/Warehousing 5.8 0.0 9.1 15.4 7.5 11.1 4.6 5.3Information 0.0 0.0 0.0 0.0 0.0 0.0 0.0 0.0
Finance/Insurance 1.9 0.0 1.8 0.0 6.0 5.6 4.6 0.0Real Estate/Rental/Leasing 3.9 0.0 0.0 0.0 1.5 0.0 1.5 0.0
Professional/Scientific/Technical Services 3.9 0.0 1.8 7.7 4.5 0.0 1.5 0.0Management of Companies/Enterprises 0.0 0.0 0.0 0.0 0.0 0.0 0.0 0.0
Administrative/Support/Waste Management/Remediation 0.0 0.0 0.0 0.0 1.5 0.0 0.0 0.0Educational Services 7.7 11.1 7.3 7.7 9.0 11.1 23.1 26.3
Health Care/Social Assistance 11.5 22.2 18.2 7.7 14.9 5.6 12.3 15.8Arts/Entertainment/Recreation 0.0 0.0 0.0 0.0 0.0 0.0 1.5 0.0Accommodation/Food Services 1.9 0.0 1.8 0.0 7.5 5.6 1.5 0.0
Public Administration 5.8 0.0 3.6 7.7 4.5 0.0 3.1 0.0Other 7.7 11.1 5.5 15.4 6.0 5.6 3.1 5.3
Emp – Employed Und – Underemployed NnW – Nonworkers Note: Rounding errors may be present. Responses to the questions on occupation and industry should only be used for making comparisons between
the employed and the underemployed and not for indicating worker distribution by occupation or industry.

2013 Underemployment in Alabama WIAAs CBER, UA 135
Table 10.2 Underemployment Survey Results, Region 10 (Percent)
County/WIAA Region 10
General Emp Und
1. Percent of adults that are working full-time 79.0 61.2 2. Percent of part-timers who wish to work full-time 44.0 60.0 3. Percent of workers with more than one job 11.1 12.6 4. Average commute time (one-way) Up to 20 minutes 57.6 54.4
20 to 40 minutes 27.5 29.140 minutes to an hour 8.1 8.7
More than an hour 3.6 2.9 5. Commute distance Less than 10 miles 50.3 52.0
10 to 25 miles 31.6 28.025 to 45 miles 11.3 14.0
More than 45 miles 5.9 5.0 6. Occupation Management 10.0 9.7
Business/Financial Operations 5.5 2.9Computer/Mathematical 1.9 1.0
Architecture/Engineering 3.0 5.8Life/Physical/Social Science 0.2 1.0Community /Social Services 2.4 3.9
Legal 1.7 0.0Education/Training/Library 11.7 12.6
Arts/Design/Entertainment/Sports/Media 0.4 0.0Healthcare Practitioners/Technicians 6.4 2.9
Healthcare Support 3.4 3.9Protective Service 1.3 1.9
Food Preparation/Serving Related 3.4 3.9Building/Grounds Cleaning/Maintenance. 2.6 6.8
Personal Care/Service 1.7 1.0Sales and Related 7.9 7.8
Office/Administrative Support 5.8 5.8Farming/Fishing/Forestry 2.1 1.9
Construction/Extraction 2.4 5.8Installation/Maintenance/Repair 5.8 4.9
Production 3.0 4.9Transportation/Material Moving 4.5 2.9
other 13.0 8.7 7. Industry Agriculture/Forestry/Fishing/Hunting 4.9 7.8
Mining 0.0 0.0Utilities 3.0 1.0
Construction 2.6 2.9Manufacturing 7.5 6.8
Wholesale Trade 0.6 1.0Retail Trade 7.9 8.7
Transportation/Warehousing 5.3 6.8Information 1.1 1.0
Finance/Insurance 3.2 1.0Real Estate/Rental/Leasing 1.9 0.0
Professional/Scientific/Technical Services 3.2 0.9Management of Companies/Enterprises 0.2 0.0
Administrative/Support/Waste Management/Remediation 1.3 1.9Educational Services 13.0 15.5
Health Care/Social Assistance 14.3 11.7Arts/Entertainment/Recreation 0.4 0.0Accommodation/Food Services 3.2 1.0
Public Administration 4.3 3.9Other 7.5 11.7
Emp – Employed Und – Underemployed NnW – Nonworkers Note: Rounding errors may be present. Responses to the questions on occupation and industry should only be used for making comparisons between
the employed and the underemployed and not for indicating worker distribution by occupation or industry.

CBER, UA 2013 Underemployment in Alabama WIAAs 136
Table 10.2 Underemployment Survey Results, Region 10 (Percent, continued) County/WIAA Barbour Coffee Covington Dale
Emp Und Emp Und Emp Und Emp Und
8. Years at current/primary job Less than a year 21.4 25.0 16.1 0.0 15.3 10.0 22.0 23.1 1 to 3 years 8.9 8.3 8.9 22.2 1.7 0.0 6.8 0.03 to 5 years 5.4 0.0 3.6 0.0 5.1 10.0 3.4 7.7
5 to 10 years 7.1 16.7 16.1 0.0 18.6 30.0 15.3 0.010 to 20 years 12.5 16.7 21.4 22.2 20.3 20.0 27.1 46.2
More than 20 years 39.3 33.3 32.1 55.6 35.6 30.0 25.4 23.1
9. Monthly wages Less than $500 8.9 16.7 8.9 11.1 11.9 30.0 8.5 15.4$500 up to $1,000 10.7 16.7 8.9 22.2 10.2 20.0 15.3 15.4
$1,000 up to $2,000 19.6 33.3 17.9 22.2 22.0 30.0 27.1 38.5$2,000 up to $3,000 16.1 25.0 12.5 11.1 13.6 20.0 13.6 7.7$3,000 up to $4,000 14.3 8.3 7.1 0.0 11.9 0.0 15.3 7.7$4,000 up to $6,000 12.5 0.0 16.1 11.1 11.9 0.0 8.5 7.7
More than $6,000 5.4 0.0 12.5 11.1 13.6 0.0 11.9 7.7Job Fitness 10. Percent of workers whose current job fits well with their education and training, skills, and experience
85.7 66.7 87.5 55.6 84.8 40.0 84.8 61.5
11. Percent of workers who believe they are qualified for a better job
71.4 91.7 64.3 88.9 52.5 100.0 57.6 84.6
Reasons: Education and training 90.0 90.9 94.4 87.5 93.6 100.0 94.1 100.0Skills 95.0 90.9 97.2 87.5 100.0 100.0 91.2 100.0
Experience 97.5 100.0 94.4 87.5 96.8 100.0 97.1 100.0 12. Additional income for which workers would leave current job
0 to 5% more 8.0 16.7 8.7 20.0 4.0 0.0 2.9 0.05 to 15% more 32.0 33.3 13.0 20.0 20.0 0.0 14.7 0.0
15 to 30% more 8.0 0.0 26.1 20.0 40.0 75.0 32.4 40.030 to 50% more 12.0 0.0 21.7 40.0 8.0 0.0 11.8 20.0
More than 50% more 20.0 50.0 17.4 0.0 12.0 25.0 26.5 20.0 *** Would not leave current job 8.0 0.0 13.0 0.0 12.0 0.0 8.8 0.0
13. Additional commute for new job 0 to 10 miles 27.8 41.7 32.0 22.2 44.4 20.0 28.9 25.0
10 to 20 miles 30.6 25.0 44.0 55.6 29.6 30.0 32.7 25.0more than 20 miles 38.9 33.3 22.0 22.2 25.9 50.0 38.5 50.0
14. Additional one-way commute time 0 to 10 minutes 27.8 41.7 34.0 22.2 35.2 20.0 26.9 16.7
10 to 20 minutes 30.6 25.0 24.0 22.2 27.8 20.0 26.9 25.0more than 20 minutes 38.9 33.3 42.0 55.6 37.0 60.0 46.2 58.3
15. Percent of workers who sought better job in past three months
11.1 25.0 14.0 44.4 18.5 40.0 19.2 33.3
Underemployment 16. Percent of workers who say they are currently underemployed
21.4 16.1 17.0 22.0
17. Reasons respondents give for being Und NnW Und NnW Und NnW Und NnW
A lack of job opportunities in their area 75.0 29.9 33.3 15.2 70.0 27.4 84.6 19.8The low wages at the available jobs 58.3 20.5 33.3 12.1 50.0 20.2 76.9 16.3
They live too far from jobs 75.0 20.5 11.1 19.7 30.0 15.5 46.2 12.8They are in school or undergoing training 0.0 5.1 0.0 3.0 0.0 4.8 7.7 4.7
Their spouse or partner has a really good job 0.0 7.7 33.3 10.6 30.0 14.3 15.4 14.0They are retired 25.0 62.4 11.1 74.2 0.0 72.6 38.5 74.4
Because of social security limitations 8.3 28.2 0.0 18.2 10.0 25.0 15.4 22.1Disability or other health concerns 33.3 51.3 0.0 40.9 0.0 51.2 7.7 47.7
Child care responsibilities 25.0 6.8 11.1 7.6 30.0 9.5 0.0 7.0They take care of someone other than a child 25.0 12.0 11.1 12.1 30.0 11.9 0.0 12.8
Other family or personal obligations 41.7 9.4 44.4 19.7 40.0 13.1 15.4 14.0Owning a house in your area 40.0 14.0 42.9 22.0 33.3 20.3 45.5 13.2
Something else 8.3 22.2 33.3 15.2 10.0 16.7 15.4 19.8
Emp – Employed Und – Underemployed NnW – Nonworkers Note: Rounding errors may be present.

2013 Underemployment in Alabama WIAAs CBER, UA 137
Table 10.2 Underemployment Survey Results, Region 10 (Percent, continued) County/WIAA Geneva Henry Houston Pike
Emp Und Emp Und Emp Und Emp Und
8. Years at current/primary job Less than a year 13.5 11.1 16.4 23.1 10.5 16.7 12.3 26.3 1 to 3 years 1.9 0.0 7.3 15.4 7.5 0.0 7.7 0.03 to 5 years 0.0 0.0 10.9 23.1 3.0 5.6 7.7 5.3
5 to 10 years 23.1 55.6 10.9 0.0 14.9 16.7 12.3 10.510 to 20 years 23.1 11.1 23.6 15.4 20.9 27.8 18.5 26.3
More than 20 years 36.5 22.2 30.9 23.1 43.3 33.3 41.5 31.6
9. Monthly wages Less than $500 13.5 11.1 7.3 7.7 7.5 22.2 9.2 15.8$500 up to $1,000 13.5 0.0 14.6 23.1 13.4 16.7 9.2 10.5
$1,000 up to $2,000 19.2 22.2 10.9 23.1 13.4 27.8 16.9 26.3$2,000 up to $3,000 19.2 33.3 20.0 15.4 16.4 11.1 16.9 21.1$3,000 up to $4,000 17.3 33.3 16.4 15.4 14.9 5.6 18.5 5.3$4,000 up to $6,000 11.5 0.0 16.4 7.7 13.4 11.1 12.3 10.5
More than $6,000 3.9 0.0 9.1 7.7 16.4 5.6 10.8 5.3Job Fitness 10. Percent of workers whose current job fits well with their education and training, skills, and experience
82.7 44.4 90.9 69.2 85.1 61.1 88.2 84.2
11. Percent of workers who believe they are qualified for a better job
57.7 88.9 69.1 84.6 61.2 83.3 66.2 89.5
Reasons: Education and training 96.7 87.5 89.5 90.9 90.2 93.3 86.1 94.1Skills 96.7 100.0 97.4 100.0 97.6 100.0 95.4 94.1
Experience 100.0 100.0 94.7 90.9 97.6 100.0 88.4 88.2 12. Additional income for which workers would leave current job
0 to 5% more 13.0 0.0 4.4 0.0 9.7 0.0 3.2 0.05 to 15% more 26.1 50.0 17.4 20.0 19.4 12.5 25.8 9.1
15 to 30% more 17.4 0.0 47.8 60.0 29.0 50.0 22.6 36.430 to 50% more 13.0 0.0 13.0 0.0 9.7 12.5 16.1 18.2
More than 50% more 8.7 0.0 13.0 20.0 22.6 25.0 12.9 36.4 *** Would not leave current job 21.7 50.0 4.4 0.0 9.7 0.0 19.4 0.0
13. Additional commute for new job 0 to 10 miles 37.5 12.5 36.5 23.1 29.8 25.0 34.6 26.3
10 to 20 miles 40.0 50.0 38.5 61.5 40.4 37.5 25.0 21.1more than 20 miles 22.5 37.5 19.2 15.4 29.8 37.5 40.4 52.6
14. Additional one-way commute time 0 to 10 minutes 27.5 12.5 28.9 23.1 19.3 25.0 21.2 21.1
10 to 20 minutes 40.0 37.5 36.5 38.5 35.1 18.8 28.9 21.1more than 20 minutes 32.5 50.0 28.9 30.8 45.6 56.3 50.0 57.9
15. Percent of workers who sought better job in past three months
17.5 25.0 17.3 30.8 21.1 43.8 21.2 52.6
Underemployment 16. Percent of workers who say they are currently underemployed
17.3 23.6 26.9 29.2
17. Reasons respondents give for being Und NnW Und NnW Und NnW Und NnW
A lack of job opportunities in their area 55.6 29.4 76.9 42.3 50.0 14.9 73.7 30.7The low wages at the available jobs 66.7 23.5 46.2 26.8 61.1 14.9 73.7 23.9
They live too far from jobs 66.7 22.4 38.5 31.0 5.6 5.8 10.5 13.6They are in school or undergoing training 0.0 2.4 15.4 4.2 11.1 5.8 10.5 2.3
Their spouse or partner has a really good job 22.2 5.9 23.1 5.6 16.7 5.8 5.3 9.1They are retired 11.1 72.9 0.0 69.0 16.7 73.6 15.8 64.8
Because of social security limitations 0.0 29.4 0.0 26.8 11.1 31.0 5.3 26.1Disability or other health concerns 11.1 49.4 0.0 47.9 11.1 48.3 5.3 40.9
Child care responsibilities 11.1 5.9 7.7 8.5 16.7 10.3 0.0 6.8They take care of someone other than a child 11.1 11.8 30.8 14.1 27.8 6.9 10.5 15.9
Other family or personal obligations 44.4 15.3 46.2 15.5 38.9 10.3 15.8 12.5Owning a house in your area 33.3 18.4 40.0 32.8 54.6 11.9 8.3 17.3
Something else 22.2 15.3 15.4 21.1 22.2 23.0 15.8 22.7
Emp – Employed Und – Underemployed NnW – Nonworkers Note: Rounding errors may be present.

CBER, UA 2013 Underemployment in Alabama WIAAs 138
Table 10.2 Underemployment Survey Results, Region 10 (Percent, continued) County/WIAA Region 10
Emp Und
8. Years at current/primary job Less than a year 15.8 18.5 1 to 3 years 6.4 4.93 to 5 years 4.9 6.8
5 to 10 years 14.7 14.610 to 20 years 20.9 24.3
More than 20 years 35.8 31.1
9. Monthly wages Less than $500 9.4 16.5$500 up to $1,000 11.9 15.5
$1,000 up to $2,000 18.3 28.2$2,000 up to $3,000 16.0 17.5$3,000 up to $4,000 14.5 8.7$4,000 up to $6,000 12.8 6.8
More than $6,000 10.7 4.9Job Fitness 10. Percent of workers whose current job fits well with their education and training, skills, and experience
86.1 63.1
11. Percent of workers who believe they are qualified for a better job
62.5 88.4
Reasons: Education and training 91.5 93.4Skills 96.3 96.7
Experience 95.6 95.6 12. Additional income for which workers would leave current job
0 to 5% more 6.5 4.45 to 15% more 20.9 15.2
15 to 30% more 27.9 37.030 to 50% more 13.0 13.0
More than 50% more 17.2 26.1 *** Would not leave current job 12.1 2.2
13. Additional commute for new job 0 to 10 miles 34.1 25.3
10 to 20 miles 35.1 36.4more than 20 miles 29.5 38.4
14. Additional one-way commute time 0 to 10 minutes 27.5 23.2
10 to 20 minutes 31.0 25.3more than 20 minutes 40.5 50.5
15. Percent of workers who sought better job in past three months
17.8 38.4
Underemployment 16. Percent of workers who say they are currently underemployed
22.0
17. Reasons respondents give for being Und NnW
A lack of job opportunities in their area 66.0 26.3The low wages at the available jobs 60.2 19.9
They live too far from jobs 32.0 17.4They are in school or undergoing training 6.8 4.1
Their spouse or partner has a really good job 16.5 9.1They are retired 15.5 70.0
Because of social security limitations 6.8 26.2Disability or other health concerns 8.7 47.5
Child care responsibilities 11.7 7.8They take care of someone other than a child 18.5 12.1
Other family or personal obligations 34.0 13.3Owning a house in your area 36.8 18.1
Something else 28.6 21.3
Emp – Employed Und – Underemployed NnW – Nonworkers Note: Rounding errors may be present.

2013 Underemployment in Alabama WIAAs CBER, UA 139
Table 10.2 Underemployment Survey Results, Region 10 (Percent, continued)
County/WIAA Barbour Coffee Covington DaleSelected Emp NnW Und Emp NnW Und Emp NnW Und Emp NnW UndCharacteristics 18. Married Respondents 60.7 41.0 75.0 66.1 57.6 44.4 74.6 51.2 80.0 66.1 57.0 76.9 19. Sex Female 50.0 66.7 58.3 53.6 63.6 66.7 57.6 72.6 40.0 55.9 62.8 46.2
Male 50.0 33.3 41.7 46.4 36.4 33.3 42.4 27.4 60.0 44.1 37.2 53.9 20. Median age (years) 55 65 53.5 54 70.5 53 55 66.5 59 54 69 53 21. Ethnicity Hispanic 1.8 0.9 8.3 3.6 3.0 11.1 0.0 0.0 0.0 8.5 2.3 0.0
21b. Race White 64.3 48.7 41.7 82.1 84.9 88.9 88.1 81.0 80.0 72.9 79.1 61.5African-American/Other 26.8 42.7 50.0 12.5 10.6 11.1 11.9 13.1 20.0 20.3 16.3 30.8
22. Last school grade
High Sch./less, no diploma 7.1 17.1 8.3 5.4 18.2 11.1 1.7 25.0 10.0 5.1 16.3 7.7High School or GED 28.6 41.0 25.0 23.2 31.8 22.2 23.7 20.2 20.0 25.4 25.6 23.1
Some college, no degree 16.1 13.7 8.3 21.4 18.2 11.1 22.0 23.8 30.0 15.3 25.6 15.4Jr. College/trade
school/associate degree 7.1 12.8 16.7 12.5 12.1 11.1 20.3 15.5 20.0 10.2 14.0 7.7
4-year college graduate/BA 19.6 6.8 25.0 16.1 9.1 33.3 22.0 7.1 20.0 22.0 9.3 15.4Postgraduate/Masters 19.6 7.7 16.7 21.4 9.1 11.1 10.2 8.3 0.0 22.0 9.3 30.8
County/WIAA Geneva Henry Houston Pike
Selected Emp NnW Und Emp NnW Und Emp NnW Und Emp NnW UndCharacteristics 18. Married Respondents 69.2 44.7 55.6 72.7 57.8 53.9 61.2 42.5 50.0 50.8 51.1 47.4 19. Sex Female 51.9 70.6 55.6 58.2 69.0 30.8 56.7 67.8 55.6 58.5 80.3 52.6
Male 48.1 29.4 44.4 41.8 31.0 69.2 43.3 32.2 44.4 41.5 19.7 47.4 20. Median age (years) 51 67 50.0 50 67 49 54 66 48.5 53 66 52 21. Ethnicity Hispanic 0.0 1.2 0.0 1.8 1.4 0.0 3.0 1.2 0.0 1.5 0.0 0.0
21b. Race White 86.5 87.1 55.6 76.4 64.8 69.2 76.1 73.6 72.2 56.9 60.2 47.4African-American/Other 9.6 10.6 33.3 18.2 31.0 23.1 20.9 23.0 27.8 38.4 34.1 52.6
22. Last school grade
High Sch./less, no diploma 9.6 17.7 11.1 12.7 15.5 7.7 3.0 18.4 5.6 13.9 19.3 21.1High School or GED 23.1 38.8 22.2 30.9 42.3 30.8 34.3 41.4 22.2 18.5 30.7 15.8
Some college, no degree 25.0 14.1 0.0 12.7 15.5 15.4 13.4 11.5 22.2 18.5 17.1 21.1Jr. College/trade
school/associate degree 25.0 8.2 33.3 12.7 9.9 23.1 16.4 6.9 16.7 6.2 9.1 0.0
4-year college graduate/BA 15.4 12.9 33.3 20.0 8.5 15.4 17.9 17.2 27.8 23.1 10.2 21.1Postgraduate/Masters 1.9 7.1 0.0 10.9 8.5 7.7 14.9 4.6 5.6 20.0 13.6 21.1
County/WIAA Region 10
Selected Emp NnW UndCharacteristics 18. Married Respondents 64.8 49.6 59.2 19. Sex Female 55.4 67.4 52.4
Male 44.6 32.6 47.6 20. Median age (years) 53 67 52.5 21. Ethnicity Hispanic 2.6 1.2 1.9
21b. Race White 75.1 71.1 63.1African-American/Other 20.3 23.8 33.0
22. Last school grade
High Sch./less, no diploma 7.3 18.4 10.7High School or GED 26.0 34.2 22.3
Some college, no degree 17.9 17.3 16.5Jr. College/trade
school/associate degree 13.7 11.1 14.6
4-year college graduate/BA 19.6 10.1 23.3Postgraduate/Masters 15.4 8.5 12.6
Emp – Employed Und – Underemployed NnW – Nonworkers Note: Rounding errors may be present.

CBER, UA 2013 Underemployment in Alabama WIAAs 140
Table 10.2. Underemployment Survey Results, Region 10 (Percent, continued)
County/ WIAA BarbourJob Satisfaction and
Employed Underemployed Willingness to Train 23. Job Satisfaction CD D N S CS CD D N S CS
Overall Satisfaction 3.6 7.1 12.5 14.3 62.5 16.7 16.7 8.3 25.0 33.3Earnings 12.5 8.9 8.9 28.6 41.1 41.7 8.3 16.7 8.3 25.0
Retention 5.4 0.0 10.7 16.1 60.7 16.7 0.0 16.7 25.0 41.7Work 0.0 1.8 5.4 12.5 80.4 0.0 0.0 8.3 8.3 83.3
Hours 3.6 7.1 16.1 17.9 55.4 16.7 8.3 8.3 25.0 41.7Shift 5.4 3.6 5.4 19.6 66.1 8.3 8.3 8.3 16.7 58.3
Conditions 5.4 5.4 5.4 25.0 58.9 16.7 8.3 16.7 33.3 25.0Commuting Distance 8.9 5.4 14.3 5.4 66.1 16.7 0.0 16.7 8.3 58.3
24. Willingness to Train CU U N W CW CU U N W CW
For a better job 13.9 5.6 22.2 13.9 41.7 0.0 8.3 25.0 8.3 58.3If paid by workers 54.8 22.6 9.7 0.0 6.5 66.7 25.0 8.3 0.0 0.0
If co-paid by workers & Government 22.6 12.9 25.8 3.2 29.0 25.0 16.7 33.3 0.0 25.0
If paid by Government 0.0 3.2 12.9 16.1 61.3 0.0 8.3 16.7 8.3 66.7
County/ WIAA CoffeeJob Satisfaction and
Employed Underemployed Willingness to Train 23. Job Satisfaction CD D N S CS CD D N S CS
Overall Satisfaction 5.4 1.8 5.4 35.7 51.8 22.2 0.0 0.0 55.6 22.2Earnings 7.1 3.6 33.9 16.1 39.3 22.2 0.0 44.4 11.1 22.2
Retention 0.0 3.6 12.5 16.1 66.1 0.0 0.0 22.2 11.1 66.7Work 1.8 0.0 3.6 26.8 67.9 0.0 0.0 11.1 44.4 44.4
Hours 5.4 1.8 16.1 21.4 55.4 22.2 11.1 11.1 22.2 33.3Shift 1.8 0.0 10.7 17.9 69.6 11.1 0.0 11.1 11.1 66.7
Conditions 3.6 3.6 10.7 19.6 62.5 0.0 11.1 11.1 22.2 55.6Commuting Distance 5.4 7.1 5.4 10.7 71.4 0.0 22.2 0.0 11.1 66.7
24. Willingness to Train CU U N W CW CU U N W CW
For a better job 26.0 6.0 18.0 6.0 42.0 33.3 0.0 11.1 11.1 44.4If paid by workers 51.4 8.1 24.3 5.4 8.1 0.0 0.0 33.3 33.3 33.3
If co-paid by workers & Government 21.6 16.2 29.7 18.9 13.5 0.0 16.7 50.0 33.3 0.0
If paid by Government 5.4 5.4 13.5 16.2 59.5 0.0 0.0 16.7 33.3 50.0
County/ WIAA CovingtonJob Satisfaction and
Employed Underemployed Willingness to Train 23. Job Satisfaction CD D N S CS CD D N S CS
Overall Satisfaction 5.1 1.7 11.9 32.2 49.2 20.0 0.0 50.0 20.0 10.0Earnings 3.4 13.6 28.8 18.6 35.6 10.0 30.0 40.0 0.0 20.0
Retention 3.4 8.5 8.5 17.0 62.7 10.0 20.0 30.0 10.0 30.0Work 0.0 0.0 6.8 23.7 69.5 0.0 0.0 20.0 20.0 60.0
Hours 5.1 6.8 10.2 13.6 64.4 10.0 30.0 20.0 10.0 30.0Shift 1.7 1.7 10.2 20.3 66.1 0.0 0.0 10.0 40.0 50.0
Conditions 1.7 0.0 13.6 28.8 55.9 0.0 0.0 40.0 40.0 20.0Commuting Distance 6.8 5.1 6.8 15.3 66.1 20.0 10.0 0.0 10.0 60.0
24. Willingness to Train CU U N W CW CU U N W CW
For a better job 20.4 3.7 18.5 22.2 35.2 0.0 10.0 30.0 10.0 50.0If paid by workers 41.9 18.6 23.3 2.3 14.0 30.0 10.0 10.0 0.0 50.0
If co-paid by workers & Government 7.0 14.0 39.5 16.3 20.9 10.0 10.0 30.0 10.0 40.0
If paid by Government 4.7 4.7 7.0 27.9 55.8 0.0 10.0 0.0 30.0 60.0
CD = Completely dissatisfied, D = Dissatisfied, N = Neither satisfied nor dissatisfied, S = Satisfied, and CS = Completely satisfied. CU = Completely unwilling, U =Unwilling, N= Neither willing nor unwilling, W = Willing, and CW = Completely Willing. Note: Rounding errors may be present.

2013 Underemployment in Alabama WIAAs CBER, UA 141
Table 10.2. Underemployment Survey Results, Region 10 (Percent, continued)
County/ WIAA DaleJob Satisfaction and
Employed Underemployed Willingness to Train 23. Job Satisfaction CD D N S CS CD D N S CS
Overall Satisfaction 5.1 1.7 11.9 27.1 54.2 15.4 7.7 38.5 23.1 15.4Earnings 8.5 11.9 18.6 22.0 37.3 23.1 38.5 23.1 15.4 0.0
Retention 0.0 1.7 8.5 30.5 55.9 0.0 7.7 7.7 30.8 38.5Work 0.0 3.4 10.2 23.7 62.7 0.0 7.7 38.5 7.7 46.2
Hours 1.7 5.1 10.2 23.7 59.3 0.0 15.4 15.4 30.8 38.5Shift 1.7 1.7 1.7 15.3 79.7 7.7 0.0 7.7 30.8 53.9
Conditions 0.0 8.5 15.3 28.8 47.5 0.0 15.4 38.5 30.8 15.4Commuting Distance 0.0 0.0 3.4 15.3 81.4 0.0 0.0 15.4 15.4 69.2
24. Willingness to Train CU U N W CW CU U N W CW
For a better job 28.9 5.8 21.2 1.9 38.5 16.7 8.3 8.3 0.0 66.7If paid by workers 54.1 8.1 29.7 5.4 0.0 50.0 0.0 40.0 0.0 0.0
If co-paid by workers & Government 16.2 10.8 37.8 18.9 16.2 0.0 0.0 60.0 20.0 20.0
If paid by Government 13.5 0.0 5.4 13.5 67.6 0.0 0.0 0.0 20.0 80.0
County/ WIAA GenevaJob Satisfaction and
Employed Underemployed Willingness to Train 23. Job Satisfaction CD D N S CS CD D N S CS
Overall Satisfaction 5.8 0.0 7.7 25.0 61.5 11.1 0.0 0.0 33.3 55.6Earnings 7.7 9.6 32.7 13.5 36.5 11.1 11.1 44.4 11.1 22.2
Retention 9.6 3.9 11.5 19.2 53.9 22.2 11.1 22.2 33.3 11.1Work 3.9 1.9 3.9 23.1 67.3 11.1 0.0 11.1 33.3 44.4
Hours 1.9 1.9 11.5 13.5 71.2 11.1 0.0 11.1 11.1 66.7Shift 3.9 5.8 3.9 15.4 71.2 0.0 22.2 0.0 11.1 66.7
Conditions 3.9 1.9 17.3 25.0 51.9 11.1 0.0 22.2 22.2 44.4Commuting Distance 7.7 3.9 9.6 11.5 67.3 11.1 11.1 0.0 33.3 44.4
24. Willingness to Train CU U N W CW CU U N W CW
For a better job 25.0 7.5 32.5 7.5 25.0 12.5 12.5 62.5 0.0 12.5If paid by workers 46.7 23.3 20.0 0.0 6.7 57.1 28.6 14.3 0.0 0.0
If co-paid by workers & Government 10.0 10.0 50.0 13.3 16.7 0.0 14.3 42.9 28.6 14.3
If paid by Government 3.3 0.0 16.7 16.7 60.0 0.0 0.0 28.6 14.3 57.1
County/ WIAA HenryJob Satisfaction and
Employed Underemployed Willingness to Train 23. Job Satisfaction CD D N S CS CD D N S CS
Overall Satisfaction 5.5 5.5 10.9 34.6 43.6 23.1 15.4 15.4 30.8 15.4Earnings 7.3 7.3 23.6 29.1 32.7 30.8 15.4 15.4 23.1 15.4
Retention 9.1 0.0 7.3 27.3 54.6 38.5 0.0 23.1 15.4 15.4Work 5.5 0.0 7.3 29.1 58.2 23.1 0.0 15.4 30.8 30.8
Hours 3.6 7.3 9.1 20.0 60.0 7.7 15.4 15.4 15.4 46.2Shift 3.6 0.0 12.7 9.1 74.6 7.7 0.0 23.1 15.4 53.9
Conditions 3.6 7.3 14.6 20.0 54.6 15.4 7.7 30.8 15.4 30.8Commuting Distance 1.8 10.9 10.9 23.6 52.7 7.7 15.4 23.1 15.4 38.5
24. Willingness to Train CU U N W CW CU U N W CW
For a better job 19.2 1.9 13.5 17.3 48.1 7.7 0.0 7.7 23.1 61.5If paid by workers 47.6 14.3 26.2 9.5 2.4 50.0 16.7 25.0 8.3 0.0
If co-paid by workers & Government 11.9 14.3 40.5 19.1 11.9 16.7 0.0 41.7 25.0 16.7
If paid by Government 9.5 4.8 7.1 21.4 57.1 16.7 0.0 8.3 16.7 58.3
CD = Completely dissatisfied, D = Dissatisfied, N = Neither satisfied nor dissatisfied, S = Satisfied, and CS = Completely satisfied. CU = Completely unwilling, U =Unwilling, N= Neither willing nor unwilling, W = Willing, and CW = Completely Willing. Note: Rounding errors may be present.

CBER, UA 2013 Underemployment in Alabama WIAAs 142
Table 10.2. Underemployment Survey Results, Region 10 (Percent, continued)
County/ WIAA HoustonJob Satisfaction and
Employed Underemployed Willingness to Train 23. Job Satisfaction CD D N S CS CD D N S CS
Overall Satisfaction 6.0 4.5 16.4 25.4 46.3 11.1 5.6 22.2 22.2 33.3Earnings 10.5 13.4 20.9 25.4 29.9 16.7 27.8 16.7 11.1 27.8
Retention 3.0 1.5 16.4 17.9 59.7 11.1 0.0 16.7 33.3 33.3Work 1.5 1.5 10.5 25.4 61.2 5.6 5.6 22.2 22.2 44.4
Hours 3.0 4.5 10.5 20.9 61.2 11.1 11.1 0.0 22.2 55.6Shift 3.0 3.0 9.0 14.9 70.2 11.1 0.0 5.6 22.2 61.1
Conditions 3.0 3.0 9.0 26.9 56.7 5.6 11.1 11.1 22.2 44.4Commuting Distance 6.0 4.5 7.5 10.5 71.6 16.7 11.1 5.6 11.1 55.6
24. Willingness to Train CU U N W CW CU U N W CW
For a better job 22.8 0.0 21.1 15.8 38.6 6.3 0.0 25.0 12.5 56.3If paid by workers 43.2 11.4 31.8 2.3 6.8 40.0 13.3 26.7 6.7 0.0
If co-paid by workers & Government 9.1 15.9 22.7 31.8 20.5 0.0 13.3 40.0 20.0 26.7
If paid by Government 4.6 4.6 15.9 18.2 56.8 0.0 0.0 20.0 13.3 66.7
County/ WIAA PikeJob Satisfaction and
Employed Underemployed Willingness to Train 23. Job Satisfaction CD D N S CS CD D N S CS
Overall Satisfaction 6.2 6.2 15.4 18.5 52.3 10.5 15.8 26.3 21.1 21.1Earnings 13.9 13.9 20.0 20.0 32.3 31.6 21.1 31.6 0.0 15.8
Retention 7.7 4.6 13.9 13.9 58.5 21.1 10.5 15.8 15.8 36.8Work 4.6 0.0 12.3 21.5 60.0 10.5 0.0 26.3 26.3 31.6
Hours 9.2 0.0 15.4 15.4 60.0 15.8 0.0 15.8 15.8 52.6Shift 4.6 7.7 10.8 12.3 64.6 10.5 15.8 10.5 15.8 47.4
Conditions 7.7 0.0 21.5 15.4 55.4 15.8 0.0 36.8 10.5 36.8Commuting Distance 4.6 6.2 6.2 7.7 73.9 5.3 0.0 10.5 10.5 73.7
24. Willingness to Train CU U N W CW CU U N W CW
For a better job 21.2 1.9 21.2 5.8 50.0 15.8 0.0 15.8 5.3 63.2If paid by workers 46.3 22.0 24.4 0.0 7.3 43.8 18.8 25.0 0.0 12.5
If co-paid by workers & Government 12.2 12.2 39.0 14.6 19.5 6.3 6.3 25.0 12.5 43.8
If paid by Government 4.9 0.0 12.2 14.6 65.9 6.3 0.0 6.3 12.5 68.8
County/ WIAA Region 10Job Satisfaction and
Employed Underemployed Willingness to Train 23. Job Satisfaction CD D N S CS CD D N S CS
Overall Satisfaction 5.3 3.6 11.7 26.4 52.5 15.5 8.7 21.4 27.2 25.2Earnings 9.0 10.5 23.2 21.8 35.4 24.3 20.4 27.2 9.7 18.5
Retention 4.7 3.0 11.3 19.6 59.1 15.5 5.8 22.3 22.3 34.0Work 2.1 1.1 7.7 23.2 65.7 6.8 1.9 20.4 23.3 46.6
Hours 4.3 4.3 12.4 18.3 60.8 11.7 10.7 11.7 19.4 46.6Shift 3.2 3.0 8.1 15.6 70.2 7.8 5.8 9.7 20.4 56.3
Conditions 3.6 3.6 13.4 23.7 55.4 8.7 6.8 26.2 23.3 34.0Commuting Distance 5.1 5.3 7.9 12.4 69.1 9.7 7.8 9.7 13.6 59.2
24. Willingness to Train CU U N W CW CU U N W CW
For a better job 22.4 3.8 20.6 11.5 40.2 11.1 4.0 21.2 9.1 54.6If paid by workers 47.9 15.7 24.3 3.3 6.6 46.6 17.1 22.7 2.3 8.0
If co-paid by workers & Government 13.4 13.4 35.4 17.7 18.4 8.0 9.1 38.6 17.1 26.1
If paid by Government 5.9 3.0 11.2 18.4 60.3 3.41 2.27 11.36 17.05 64.77
CD = Completely dissatisfied, D = Dissatisfied, N = Neither satisfied nor dissatisfied, S = Satisfied, and CS = Completely satisfied. CU = Completely unwilling, U =Unwilling, N= Neither willing nor unwilling, W = Willing, and CW = Completely Willing. Note: Rounding errors may be present.

2013 Underemployment in Alabama WIAAs CBER, UA 143
Underemployment in Workforce Investment Advisory Area, Jefferson Region
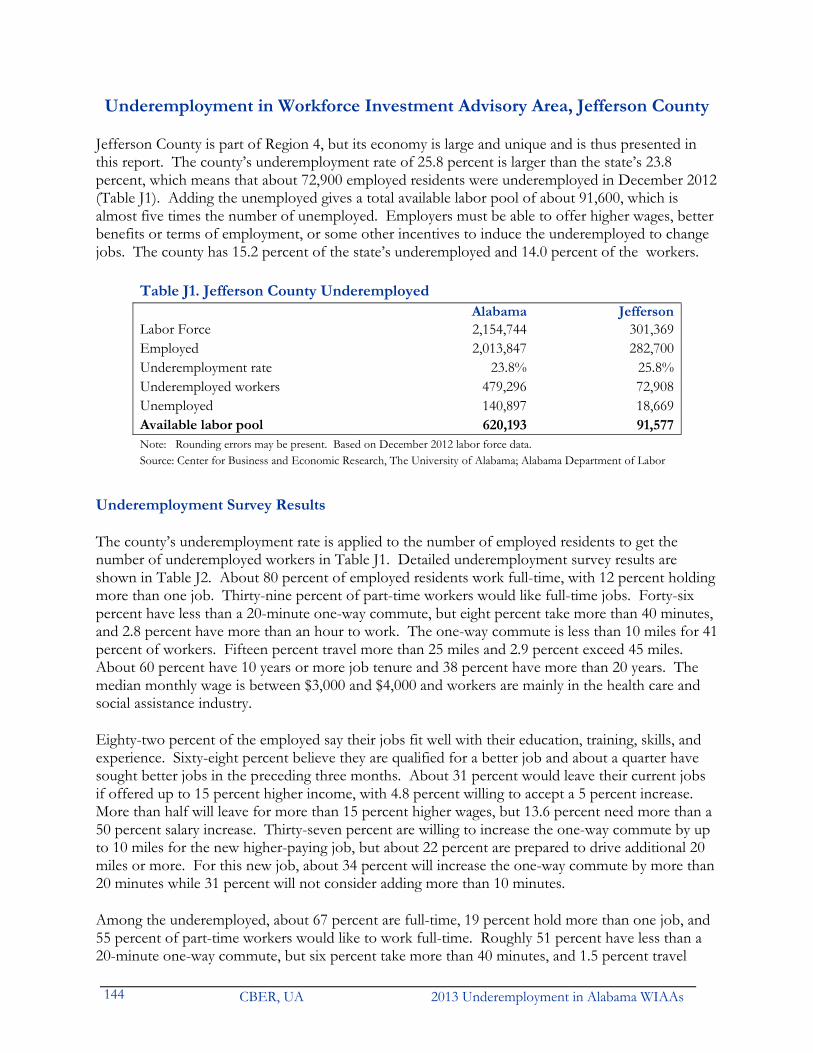
CBER, UA 2013 Underemployment in Alabama WIAAs 144
Underemployment in Workforce Investment Advisory Area, Jefferson County
Jefferson County is part of Region 4, but its economy is large and unique and is thus presented in this report. The county’s underemployment rate of 25.8 percent is larger than the state’s 23.8 percent, which means that about 72,900 employed residents were underemployed in December 2012 (Table J1). Adding the unemployed gives a total available labor pool of about 91,600, which is almost five times the number of unemployed. Employers must be able to offer higher wages, better benefits or terms of employment, or some other incentives to induce the underemployed to change jobs. The county has 15.2 percent of the state’s underemployed and 14.0 percent of the workers.
Table J1. Jefferson County Underemployed Alabama Jefferson
Labor Force 2,154,744 301,369Employed 2,013,847 282,700Underemployment rate 23.8% 25.8%Underemployed workers 479,296 72,908Unemployed 140,897 18,669Available labor pool 620,193 91,577Note: Rounding errors may be present. Based on December 2012 labor force data. Source: Center for Business and Economic Research, The University of Alabama; Alabama Department of Labor
Underemployment Survey Results
The county’s underemployment rate is applied to the number of employed residents to get the number of underemployed workers in Table J1. Detailed underemployment survey results are shown in Table J2. About 80 percent of employed residents work full-time, with 12 percent holding more than one job. Thirty-nine percent of part-time workers would like full-time jobs. Forty-six percent have less than a 20-minute one-way commute, but eight percent take more than 40 minutes, and 2.8 percent have more than an hour to work. The one-way commute is less than 10 miles for 41 percent of workers. Fifteen percent travel more than 25 miles and 2.9 percent exceed 45 miles. About 60 percent have 10 years or more job tenure and 38 percent have more than 20 years. The median monthly wage is between $3,000 and $4,000 and workers are mainly in the health care and social assistance industry.
Eighty-two percent of the employed say their jobs fit well with their education, training, skills, and experience. Sixty-eight percent believe they are qualified for a better job and about a quarter have sought better jobs in the preceding three months. About 31 percent would leave their current jobs if offered up to 15 percent higher income, with 4.8 percent willing to accept a 5 percent increase. More than half will leave for more than 15 percent higher wages, but 13.6 percent need more than a 50 percent salary increase. Thirty-seven percent are willing to increase the one-way commute by up to 10 miles for the new higher-paying job, but about 22 percent are prepared to drive additional 20 miles or more. For this new job, about 34 percent will increase the one-way commute by more than 20 minutes while 31 percent will not consider adding more than 10 minutes.
Among the underemployed, about 67 percent are full-time, 19 percent hold more than one job, and 55 percent of part-time workers would like to work full-time. Roughly 51 percent have less than a 20-minute one-way commute, but six percent take more than 40 minutes, and 1.5 percent travel

2013 Underemployment in Alabama WIAAs CBER, UA 145
more than an hour to work. Forty-seven percent of the underemployed commute less than 10 miles one-way, almost 10 percent travel more than 25 miles. Forty-nine percent of the underemployed have been in their current jobs for 10 years or more, compared to 60 percent of the employed. The median monthly wage is between $2,000 and $3,000; 46 percent of underemployed workers earn up to $2,000 per month compared to 33 percent of all workers. More of the underemployed are in health care and social assistance and retail trade industries.
About 66 percent of the underemployed say their jobs fit well with their education, training, skills, and experience. However, 83 percent believe they are qualified for a better job and about 38 percent have sought better jobs in the preceding three months. Thirty-six percent would leave their current job for up to 15 percent higher income, with 7.1 percent willing to do so for a 5 percent higher wage. About 54 percent would leave their current jobs for more than 15 percent higher wages, but 14.3 percent want more than 50 percent higher wages. About 38 percent are willing to increase their one-way commute by up to 10 miles for the new higher-paying job, but 23 percent are willing to drive additional 20 miles or more. For this new job, 39 percent will increase the one-way commute by more than 20 minutes while another 29 percent will not consider adding more than 10 minutes.
Most workers in Jefferson County are satisfied with their jobs but the underemployed are less satisfied. About 57 percent of the underemployed are satisfied or completely satisfied with their jobs compared to 75 percent of all workers. Workers are most satisfied with their work shift and least satisfied with their earnings. The underemployed are also most satisfied with their work shift, but much less satisfied with their earnings. Workers are generally willing to train for a new or better job, with the underemployed being much more willing. About 64 percent of the underemployed are willing or completely willing to train for a new or better job compared to 57 percent of all workers. The willingness to train is highest when the cost is fully borne by government and lowest when the trainee must pay the full costs. Underemployed workers are more willing to train for the new or better job unless they have to pay the full cost the training.
Of the 542 respondents, 252 or 46 percent were employed. The primary reasons respondents gave for being underemployed are lack of job opportunities, low wages at available jobs, and other family or personal obligations. For nonworkers the major reasons are retirement, disability or other health concerns, and social security limitations. Sixty-one percent of employed respondents, 45 percent of nonworkers, and 51 percent of the underemployed are married. Men made up half of the employed, 32 percent of nonworkers, and 48 percent of the underemployed. The median age is 50 for the employed, 49 for the underemployed, and 67 for nonworkers. About 63 percent of the underemployed and nonworkers and 66 percent of the employed are white; Hispanics are a very small portion of respondents. Thirty percent of the employed, 29 percent of underemployed, and 32 percent of nonworkers are African-Americans or other nonwhite ethnic groups.
About four percent of the employed hold a high school diploma or equivalent, compared to 15 percent of nonworkers. All the underemployed respondents in the county hold a high school diploma or equivalent. Forty-seven percent of employed and underemployed hold bachelor’s or higher degrees, compared to 26 percent of nonworkers. At 91,600-strong, Jefferson County clearly has a very large and well-educated labor pool that is willing to commute and is seeking higher wage work.

CBER, UA 2013 Underemployment in Alabama WIAAs 146
Table J2. Underemployment Survey Results, Jefferson County (Percent)
General Employed Underemployed 1. Percent of adults that are working full-time 79.9 66.7 2. Percent of part-timers who would like to work full-time 38.5 54.6 3. Percent of workers with more than one job 12.3 18.5 4. Average commute time (one-way) Less than 20 minutes 46.0 50.8
20 to 40 minutes 41.7 35.440 minutes to an hour 5.2 4.6
More than an hour 2.8 1.5 5. Commute distance Less than 10 miles 41.2 46.8
10 to 25 miles 41.2 40.325 to 45 miles 12.4 9.7
More than 45 miles 2.9 0.0
6. Occupation Management 13.1 10.8Business/Financial Operations 9.1 3.1
Computer/Mathematical 0.0 0.0Architecture/Engineering 2.0 4.6
Life/Physical/Social Science 0.8 3.1Community /Social Services 2.0 0.0
Legal 2.4 1.5Education/Training/Library 5.2 3.1
Arts/Design/Entertainment/Sports/Media 1.6 4.6Healthcare Practitioners/Technicians 8.3 12.3
Healthcare Support 8.7 7.7Protective Service 0.8 1.5
Food Preparation/Serving Related 3.6 6.2Building/Grounds Cleaning/Maintenance. 2.0 3.1
Personal Care/Service 2.4 3.1Sales and Related 6.8 6.2
Office/Administrative Support 6.0 4.6Farming/Fishing/Forestry 0.4 0.0
Construction/Extraction 1.6 0.0Installation/Maintenance/Repair 4.4 1.5
Production 2.0 3.1Transportation/Material Moving 2.4 4.6
other 14.7 15.4 7. Industry Agriculture/Forestry/Fishing/Hunting 0.8 0.0
Mining 0.0 0.0Utilities 3.6 1.5
Construction 5.6 7.7Manufacturing 4.8 4.6
Wholesale Trade 0.4 0.0Retail Trade 6.8 13.9
Transportation/Warehousing 3.6 3.1Information 1.6 1.5
Finance/Insurance 7.9 4.6Real Estate/Rental/Leasing 1.6 1.5
Professional/Scientific/Technical Services 3.2 1.5Management of Companies/Enterprises 1.6 1.5
Administrative/Support/Waste Management/Remediation Services 0.0 0.0Educational Services 7.1 3.1
Health Care/Social Assistance 23.4 27.7Arts/Entertainment/Recreation 0.4 1.5Accommodation/Food Services 4.4 6.2
Public Administration 4.8 4.6Other Services 4.4 3.1
Note: Rounding errors may be present. Responses to the questions on occupation and industry should only be used for making comparisons between the employed and the underemployed and not for indicating worker distribution by occupation or industry.

2013 Underemployment in Alabama WIAAs CBER, UA 147
Table J2. Underemployment Survey Results, Jefferson County (Percent, continued) Employed Underemployed 8. Number of years at current/primary job Less than a year 12.6 8.2
1 to 3 years 7.1 9.83 to 5 years 8.6 6.6
5 to 10 years 9.4 11.510 to 20 years 20.4 21.3
More than 20 years 40.0 39.3 9. Monthly wages Less than $500 7.5 9.8
$500 up to $1,000 5.5 14.8$1,000 up to $2,000 16.9 21.3$2,000 up to $3,000 14.9 18.0$3,000 up to $4,000 13.7 11.5$4,000 up to $6,000 13.3 8.2
More than $6,000 18.8 6.6
Job Fitness
10. Percent of workers whose current job fits well with their education and training, skills, and experience
81.8 66.2
11. Percent of workers who believe they are qualified for a better job 67.9 83.1
Reasons: Education and training 92.4 94.4Skills 93.0 92.6
Experience 95.9 98.2 12. Additional income for which workers would leave current job
0 to 5% more 4.8 7.15 to 15% more 26.4 28.6
15 to 30% more 27.2 21.430 to 50% more 10.4 17.9
More than 50% more 13.6 14.3 *** Would not leave current job 14.4 10.7
13. Additional commute for such a new job 0 to 10 miles 37.0 37.5
10 to 20 miles 38.0 35.7more than 20 miles 21.6 23.2
14. Additional one-way commute time for this job 0 to 10 minutes 31.3 28.6
10 to 20 minutes 32.7 30.4more than 20 minutes 34.1 39.3
15. Percent of workers who sought better job in past three months 24.5 37.5 16. Percent of workers who say they are currently underemployed 25.8 17. Reasons respondents give for being Underemployed Nonworkers
Lack of job opportunities in their area 55.4 19.7Low wages at the available jobs 44.6 15.5
Live too far from jobs 13.9 8.3In school or undergoing training 9.2 4.1
Spouse or partner has a really good job 10.8 7.6They are retired 9.2 69.0
Because of social security limitations 3.1 25.9Disability or other health concerns 6.2 45.5
Child care responsibilities 21.5 6.6Care of someone other than a child 9.2 11.0
Other family or personal obligations 29.2 11.0Owning a house in their area 18.5 18.1
Something else 29.2 16.6Note: Rounding errors may be present.
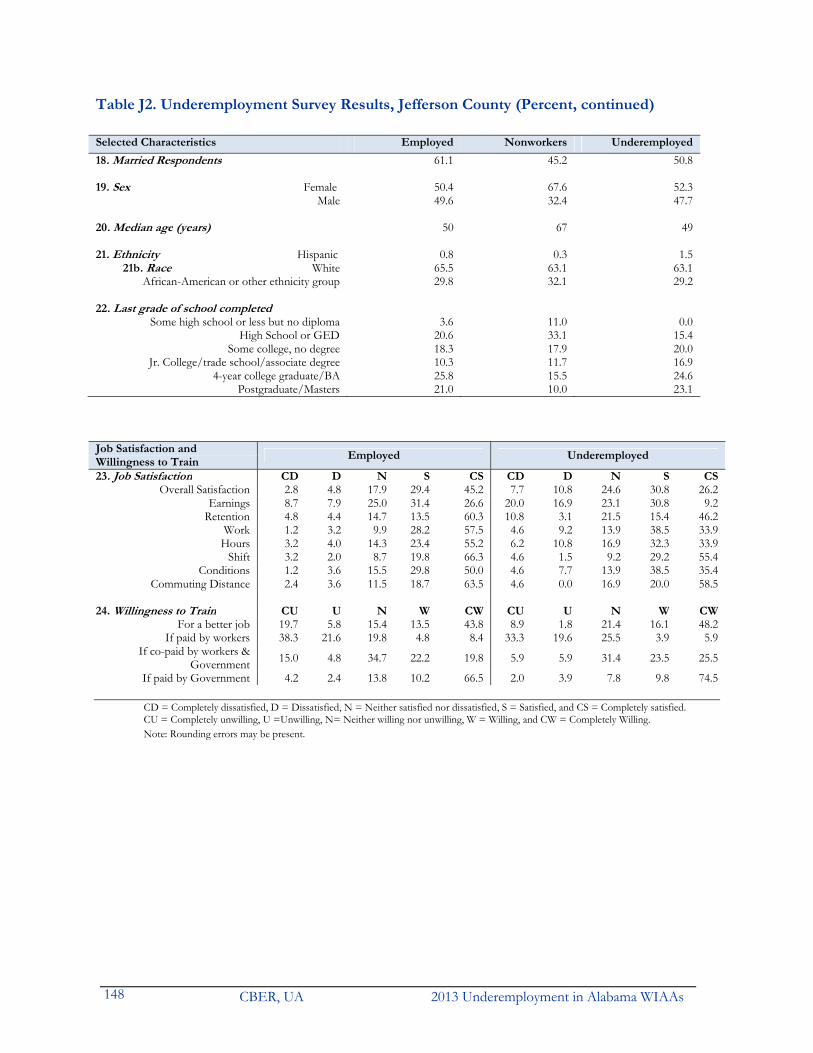
CBER, UA 2013 Underemployment in Alabama WIAAs 148
Table J2. Underemployment Survey Results, Jefferson County (Percent, continued) Selected Characteristics Employed Nonworkers Underemployed
18. Married Respondents 61.1 45.2 50.8 19. Sex Female 50.4 67.6 52.3
Male 49.6 32.4 47.7 20. Median age (years) 50 67 49 21. Ethnicity Hispanic 0.8 0.3 1.5
21b. Race White 65.5 63.1 63.1African-American or other ethnicity group 29.8 32.1 29.2
22. Last grade of school completed
Some high school or less but no diploma 3.6 11.0 0.0High School or GED 20.6 33.1 15.4
Some college, no degree 18.3 17.9 20.0Jr. College/trade school/associate degree 10.3 11.7 16.9
4-year college graduate/BA 25.8 15.5 24.6Postgraduate/Masters 21.0 10.0 23.1
Job Satisfaction and Employed Underemployed
Willingness to Train 23. Job Satisfaction CD D N S CS CD D N S CS
Overall Satisfaction 2.8 4.8 17.9 29.4 45.2 7.7 10.8 24.6 30.8 26.2Earnings 8.7 7.9 25.0 31.4 26.6 20.0 16.9 23.1 30.8 9.2
Retention 4.8 4.4 14.7 13.5 60.3 10.8 3.1 21.5 15.4 46.2Work 1.2 3.2 9.9 28.2 57.5 4.6 9.2 13.9 38.5 33.9
Hours 3.2 4.0 14.3 23.4 55.2 6.2 10.8 16.9 32.3 33.9Shift 3.2 2.0 8.7 19.8 66.3 4.6 1.5 9.2 29.2 55.4
Conditions 1.2 3.6 15.5 29.8 50.0 4.6 7.7 13.9 38.5 35.4Commuting Distance 2.4 3.6 11.5 18.7 63.5 4.6 0.0 16.9 20.0 58.5
24. Willingness to Train CU U N W CW CU U N W CW
For a better job 19.7 5.8 15.4 13.5 43.8 8.9 1.8 21.4 16.1 48.2If paid by workers 38.3 21.6 19.8 4.8 8.4 33.3 19.6 25.5 3.9 5.9
If co-paid by workers & Government 15.0 4.8 34.7 22.2 19.8 5.9 5.9 31.4 23.5 25.5
If paid by Government 4.2 2.4 13.8 10.2 66.5 2.0 3.9 7.8 9.8 74.5
CD = Completely dissatisfied, D = Dissatisfied, N = Neither satisfied nor dissatisfied, S = Satisfied, and CS = Completely satisfied. CU = Completely unwilling, U =Unwilling, N= Neither willing nor unwilling, W = Willing, and CW = Completely Willing. Note: Rounding errors may be present.

2013 Underemployment in Alabama WIAAs CBER, UA 149
Underemployment in Workforce Investment Advisory Area, Mobile Region

CBER, UA 2013 Underemployment in Alabama WIAAs 150
Underemployment in Workforce Investment Advisory Area, Mobile County
Mobile County is part of WIAA Region 10. The county underemployment rate of 23.9 percent is slightly higher than the state’s 23.8 percent, which means that about 42,300 resident workers were underemployed in December 2012 (Table M1). Adding the unemployed gives a total available labor pool of about 56,100, about four times the number of unemployed and is more realistic as a measure of available labor in the county. Employers must be able to offer higher wages, better benefits or terms of employment, or some other incentives to induce the underemployed to change jobs. The county has 8.8 percent of the state’s underemployed and the same share of the state’s workers.
Table M1. Mobile Region Underemployed Alabama Mobile
Labor Force 2,154,744 190,597Employed 2,013,847 176,807Underemployment rate 23.8% 23.9%Underemployed workers 479,296 42,292Unemployed 140,897 13,790Available labor pool 620,193 56,082Note: Rounding errors may be present. Based on December 2012 labor force data. Source: Center for Business and Economic Research, The University of Alabama; Alabama Department of Labor
Underemployment Survey Results
The Mobile WIAA underemployment rate is applied to the number of employed residents to get the number of underemployed workers in Table M1. Detailed underemployment survey results are shown in Table M2. About 79 percent of workers are full-time, 10 percent hold multiple jobs, and 24 percent of part-timers want full-time jobs. Forty-eight percent of the employed have less than a 20-minute one-way commute, but 11 percent take more than 40 minutes and 1.6 percent need more than an hour. The one-way commute is less than 10 miles for half of the employed, more than 25 miles for 13 percent, and 1.7 percent exceed 45 miles. About 60 percent have been in their current jobs for 10 years or more and 40 percent have more than 20 years job tenure. The median monthly wage is between $3,000 and $4,000. Health care and social assistance, educational services, retail trade sectors are major employers.
Of the employed, 86 percent claim their jobs fit well with their education, training, skills, and experience; 65 percent believe they are qualified for a better job and 22 percent have sought better jobs in the preceding three months. Twenty-four percent would leave their current jobs if offered up to 15 percent higher income, with five percent willing to accept 5 percent higher income; 54 percent want more than 15 percent higher wages and 10.6 percent need more than a 50 percent salary increase. Thirty-six percent are ready to increase their one-way commute by up to 10 miles for the higher-paying job, but 24 percent are willing to go additional 20 or more miles—36 percent will commute more than 20 minutes extra but 26 percent will not consider anything over 10 minutes.
Among the underemployed, about 66 percent are full-time, 15 percent have more than one job, and 33 percent of part-time workers would like to work full-time. Forty-eight percent have less than a 20-minute one-way commute and 12 percent take more than 40 minutes, with 1.6 percent needing more than an hour. The commute is less than 10 miles for half of the underemployed, more than 25

2013 Underemployment in Alabama WIAAs CBER, UA 151
miles for 13 percent, and over 45 miles for 1.7 percent. The underemployed and employed respondents have similar job tenure. The median monthly wage is between $2,000 and $3,000; 64 percent earn $3,000 or less compared to 45 percent of employed. The underemployed can typically be found in education services, health care and social assistance, and retail trade sectors.
About 72 percent of the underemployed say their jobs fit well with their education, training, skills, and experience; 86 percent believe they are qualified for a better job and 33 percent have sought better jobs in the preceding three months. Twenty-nine percent would leave current job for up to 15 percent higher income—9 percent will accept a 5 percent increase. Fifty-three percent will leave for more than 15 percent higher wages, with 9.9 percent wanting more than 50 percent higher wages. Thirty-seven percent are willing to increase their one-way commute by up to 10 miles for the higher-paying job, but 21 percent are prepared for additional 20 miles or more; 37 percent will increase the commute by more than 20 minutes while 27 percent will not consider adding more than 10 minutes.
Most workers in Mobile County are satisfied with their jobs but the underemployed are less satisfied. About 56 percent of the underemployed are satisfied or completely satisfied with their jobs compared to 75 percent of all workers. Workers are most satisfied with the hours they work and least satisfied with their earnings. The underemployed are also most satisfied with the hours they work, but much less satisfied with their earnings. Workers are generally willing or completely willing to train for a new or better job, with the underemployed being slightly more willing (64 percent versus 61 percent). The willingness to train is highest when the cost is fully borne by government and lowest when the trainee must pay the full costs. Underemployed workers are more willing to train for a new or better job even if they have to pay all the training cost.
Of the 675 respondents, 255 or 38 percent are employed, of whom 61 say they are underemployed. The main reasons respondents gave for being underemployed are low wages at available jobs, a lack of job opportunities in their area, other family or personal obligations, and low wages at available jobs. For nonworkers the primary reasons for being unemployed are retirement, disability or other health concerns, and social security limitations. Sixty-six percent of employed respondents are married, compared to 48 percent of nonworkers and 62 percent of the underemployed. Men made up 46 percent of employed respondents, 33 percent of nonworkers, and 41 percent of the underemployed. The median age is 54 for the employed, 53.5 for the underemployed, and 67 for nonworkers. Sixty-nine percent of the employed, 63 percent of nonworkers and 64 percent of the underemployed are white Hispanics are a very small portion of respondents; they made up 1.2 percent of employed, 2.1 percent of nonworkers, and 3.3 percent of underemployed. African-Americans were about 28 percent of employed, 31 percent of nonworkers, and 33 percent of underemployed.
Two percent of all employed and the underemployed do not hold a high school diploma or equivalent, compared to 16 percent of nonworkers. Forty-three percent of employed and 46 percent of underemployed respondents hold bachelors or higher degrees; 21 percent of nonworkers do. Clearly, there is a large (56,100-strong) educated labor pool in the Mobile County that is seeking higher-wage work and willing to commute.

CBER, UA 2013 Underemployment in Alabama WIAAs 152
Table M2. Underemployment Survey Results, Mobile County (Percent)
General Employed Underemployed 1. Percent of adults that are working full-time 78.6 65.6 2. Percent of part-timers who would like to work full-time 24.1 33.3 3. Percent of workers with more than one job 9.8 14.8 4. Average commute time (one-way) Less than 20 minutes 47.8 47.5
20 to 40 minutes 38.8 37.7 40 minutes to an hour 6.7 9.8
More than an hour 2.8 1.6 5. Commute distance Less than 10 miles 44.4 50.0
10 to 25 miles 39.5 33.3 25 to 45 miles 10.5 11.7
More than 45 miles 4.0 1.7
6. Occupation Management 11.8 6.6 Business/Financial Operations 5.5 6.6
Computer/Mathematical 2.4 3.3Architecture/Engineering 2.8 0.0
Life/Physical/Social Science 0.8 3.3Community /Social Services 1.2 1.6
Legal 1.2 0.0Education/Training/Library 10.2 11.5
Arts/Design/Entertainment/Sports/Media 1.2 0.0Healthcare Practitioners/Technicians 5.9 3.3
Healthcare Support 5.5 4.9Protective Service 1.2 1.6
Food Preparation/Serving Related 1.6 3.3Building/Grounds Cleaning/Maintenance. 1.2 3.3
Personal Care/Service 2.0 4.9Sales and Related 11.0 8.2
Office/Administrative Support 8.2 9.8Farming/Fishing/Forestry 0.4 0.0
Construction/Extraction 2.0 0.0Installation/Maintenance/Repair 3.9 4.9
Production 3.5 4.9Transportation/Material Moving 3.1 1.6
other 13.7 16.4 7. Industry Agriculture/Forestry/Fishing/Hunting 1.2 1.6
Mining 0.4 0.0Utilities 2.4 0.0
Construction 4.7 3.3Manufacturing 9.0 6.6
Wholesale Trade 2.0 0.0Retail Trade 7.5 11.5
Transportation/Warehousing 4.3 1.6Information 0.4 0.0
Finance/Insurance 3.1 3.3Real Estate/Rental/Leasing 2.0 1.6
Professional/Scientific/Technical Services 3.9 1.6Management of Companies/Enterprises 1.2 1.6
Administrative/Support/Waste Management/Remediation Services 0.4 0.0Educational Services 12.9 21.3
Health Care/Social Assistance 18.4 21.3Arts/Entertainment/Recreation 1.2 0.0Accommodation/Food Services 1.6 1.6
Public Administration 2.8 0.0Other Services 7.5 4.9
Note: Rounding errors may be present. Responses to the questions on occupation and industry should only be used for making comparisons between the employed and the underemployed and not for indicating worker distribution by occupation or industry.

2013 Underemployment in Alabama WIAAs CBER, UA 153
Table M2. Underemployment Survey Results, Mobile County (Percent, continued) Employed Underemployed 8. Number of years at current/primary job Less than a year 12.6 8.2
1 to 3 years 7.1 9.83 to 5 years 8.6 6.6
5 to 10 years 9.4 11.510 to 20 years 20.4 21.3
More than 20 years 40.0 39.3 9. Monthly wages Less than $500 7.5 9.8
$500 up to $1,000 5.5 14.8$1,000 up to $2,000 16.9 21.3$2,000 up to $3,000 14.9 18.0$3,000 up to $4,000 13.7 11.5$4,000 up to $6,000 13.3 8.2
More than $6,000 18.8 6.6
Job Fitness
10. Percent of workers whose current job fits well with their education and training, skills, and experience
85.9 72.1
11. Percent of workers who believe they are qualified for a better job 65.1 85.3
Reasons: Education and training 91.0 100.0Skills 94.6 94.2
Experience 97.0 100.0 12. Additional income for which workers would leave current job
0 to 5% more 5.0 8.85 to 15% more 19.2 20.6
15 to 30% more 28.4 20.630 to 50% more 14.9 14.7
More than 50% more 10.6 17.7 *** Would not leave current job 17.7 8.8
13. Additional commute for such a new job 0 to 10 miles 35.6 36.5
10 to 20 miles 37.6 38.5more than 20 miles 24.3 21.2
14. Additional one-way commute time for this job 0 to 10 minutes 26.2 25.0
10 to 20 minutes 36.6 36.5more than 20 minutes 35.6 36.5
15. Percent of workers who sought better job in past three months 22.3 32.7 16. Percent of workers who say they are currently underemployed 23.9 17. Reasons respondents give for being Underemployed Nonworkers
Lack of job opportunities in their area 47.5 22.4Low wages at the available jobs 50.8 17.1
Live too far from jobs 11.5 11.0In school or undergoing training 6.6 3.1
Spouse or partner has a really good job 11.5 11.4They are retired 11.5 71.0
Because of social security limitations 8.2 25.2Disability or other health concerns 4.9 44.1
Child care responsibilities 26.2 10.7Care of someone other than a child 9.8 12.9
Other family or personal obligations 27.9 14.5Owning a house in their area 19.2 17.5
Something else 21.3 21.9Note: Rounding errors may be present.

CBER, UA 2013 Underemployment in Alabama WIAAs 154
Table M2. Underemployment Survey Results, Mobile County (Percent, continued) Selected Characteristics Employed Nonworkers Underemployed
18. Married Respondents 66.3 48.1 62.3 19. Sex Female 53.7 67.4 59.0
Male 46.3 32.6 41.0 20. Median age (years) 54 67 53.5 21. Ethnicity Hispanic 1.2 2.1 3.3
21b. Race White 69.4 62.6 63.9African-American or other ethnicity group 27.8 30.7 32.8
22. Last grade of school completed
Some high school or less but no diploma 2.0 15.7 1.6High School or GED 23.5 36.2 19.7
Some college, no degree 18.0 15.7 21.3Jr. College/trade school/associate degree 12.9 10.7 9.8
4-year college graduate/BA 25.9 11.9 24.6Postgraduate/Masters 17.3 8.8 21.3
Job Satisfaction and Employed Underemployed
Willingness to Train 23. Job Satisfaction CD D N S CS CD D N S CS
Overall Satisfaction 2.8 7.5 14.9 22.8 52.2 3.3 16.4 24.6 16.4 39.3Earnings 11.8 12.9 18.4 23.1 32.6 26.2 19.7 23.0 14.8 14.8
Retention 3.5 3.1 11.0 19.6 61.6 9.8 6.6 26.2 26.2 44.3Work 2.4 3.1 11.0 19.2 63.9 6.6 8.2 13.1 26.2 45.9
Hours 4.7 4.7 6.7 21.6 62.0 8.2 8.2 9.8 23.0 50.8Shift 2.8 4.3 8.6 14.5 68.6 1.6 9.8 14.8 14.8 57.4
Conditions 1.6 3.5 15.7 23.9 54.9 3.3 6.6 27.9 23.0 39.3Commuting Distance 3.9 4.7 12.9 13.7 63.9 3.3 6.6 13.1 16.4 60.7
24. Willingness to Train CU U N W CW CU U N W CW
For a better job 22.3 3.5 11.4 14.4 47.0 21.2 3.9 9.6 13.5 50.0If paid by workers 41.4 17.2 17.8 8.3 10.2 36.6 19.5 17.1 7.3 12.2
If co-paid by workers & Government 15.9 10.2 31.2 17.2 22.9 9.8 9.8 22.0 26.8 26.8
If paid by Government 5.1 3.8 11.5 10.8 66.9 4.9 0.0 4.9 9.8 78.1
CD = Completely dissatisfied, D = Dissatisfied, N = Neither satisfied nor dissatisfied, S = Satisfied, and CS = Completely satisfied. CU = Completely unwilling, U =Unwilling, N= Neither willing nor unwilling, W = Willing, and CW = Completely Willing. Note: Rounding errors may be present.