under dry and wet weather conditions in the downtown of
TRANSCRIPT
1
From the doctoral research work by Pham Van Quan on Characterization of urban inundation impacts by distributed model simulation and pathogenic pollution monitoring in downtown of Hanoi
Hiroaki Furumai
Research Center for Water Environment Technology/Dept. of Urban Engineering
The University of Tokyo
Water Quality Monitoring Work under dry and wet weather conditions
in the downtown of Hanoi city
4th Int. Cord. Group Meeting of GEOSS/AWCI in Kyoto, Feb, 2009
2
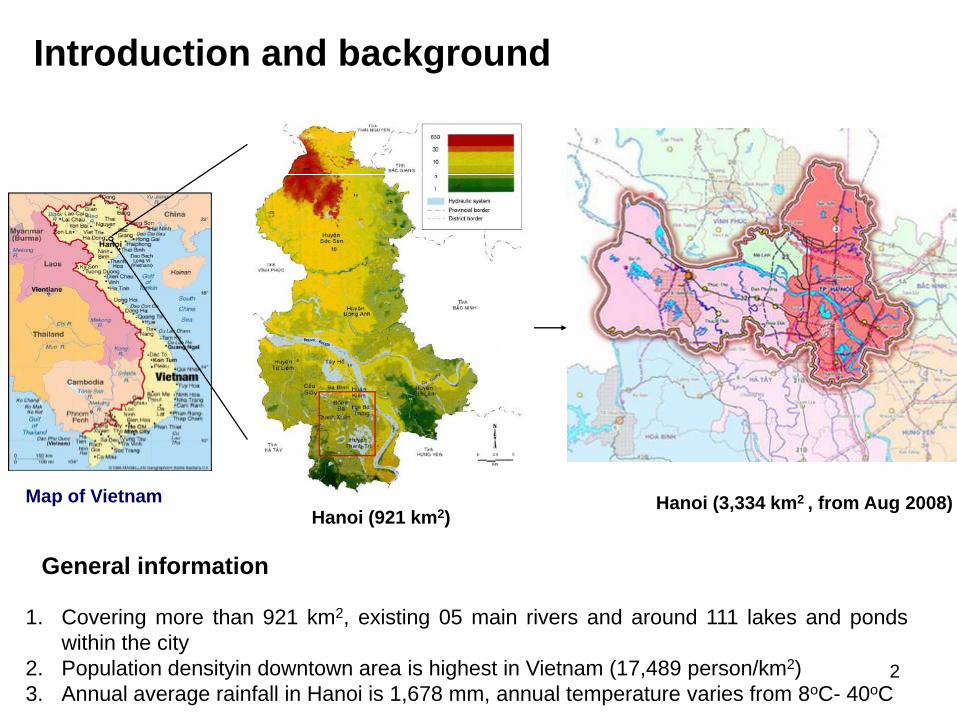
Introduction and background
Map of Vietnam
1. Covering more than 921 km2, existing 05 main rivers and around 111 lakes and pondswithin the city
2. Population densityin downtown area is highest in Vietnam (17,489 person/km2)3. Annual average rainfall in Hanoi is 1,678 mm, annual temperature varies from 8oC- 40oC
Hanoi (921 km2)Hanoi (3,334 km2 , from Aug 2008)
General information
3
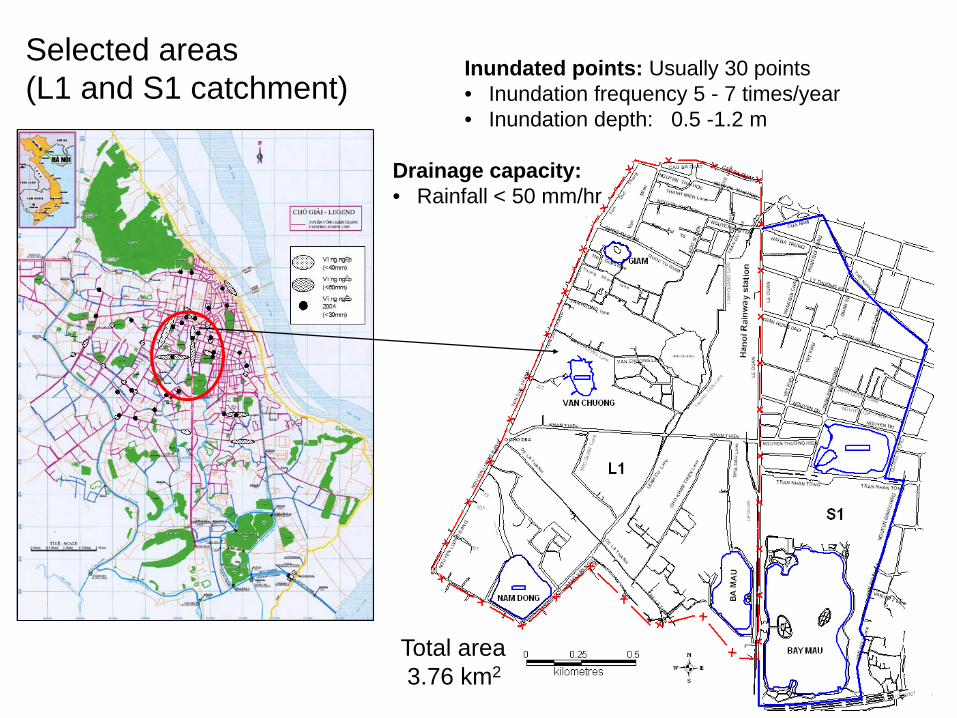
Selected areas (L1 and S1 catchment)
Total area3.76 km2
Inundated points: Usually 30 points• Inundation frequency 5 - 7 times/year• Inundation depth: 0.5 -1.2 m
Drainage capacity:• Rainfall < 50 mm/hr

4
Public toilet and septic tanks
Storm water
Grey water
Individual house and septic tanks
Grey water
Compact house and septic tanks
Fish pond
Vegetable fields
Irrigation channel
Tertiary network managed by localAuthority and community
Secondary and primary network managed by Hanoi Sewerage and Drainage Company
Wastewater reuse in peri-urban areas by farmer
Sewerage system in Hanoi
5
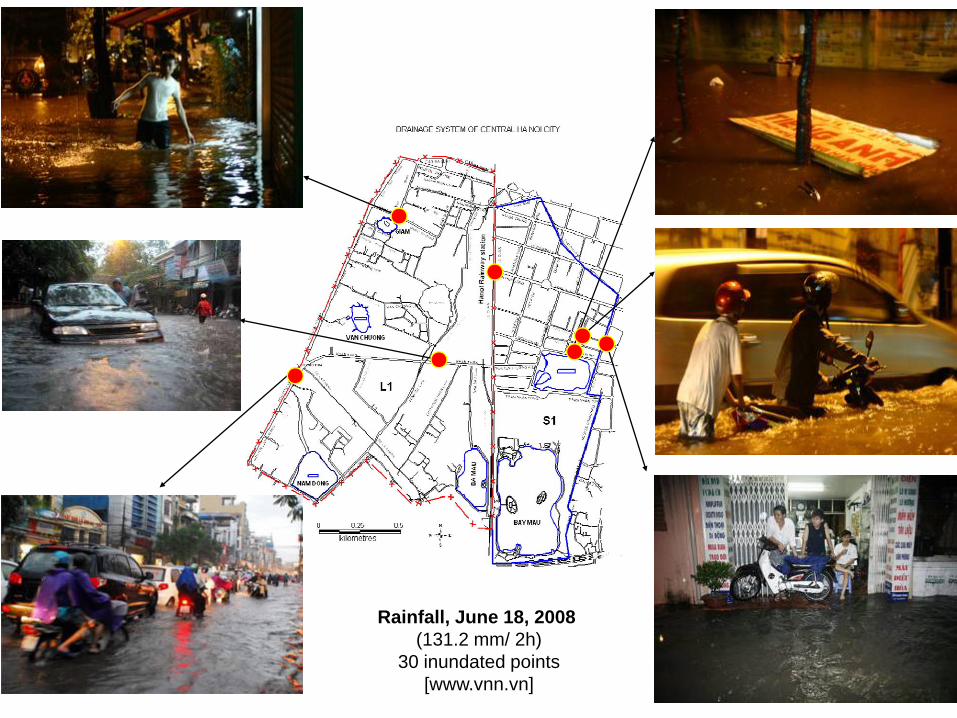
Rainfall, June 18, 2008 (131.2 mm/ 2h)
30 inundated points[www.vnn.vn]
6
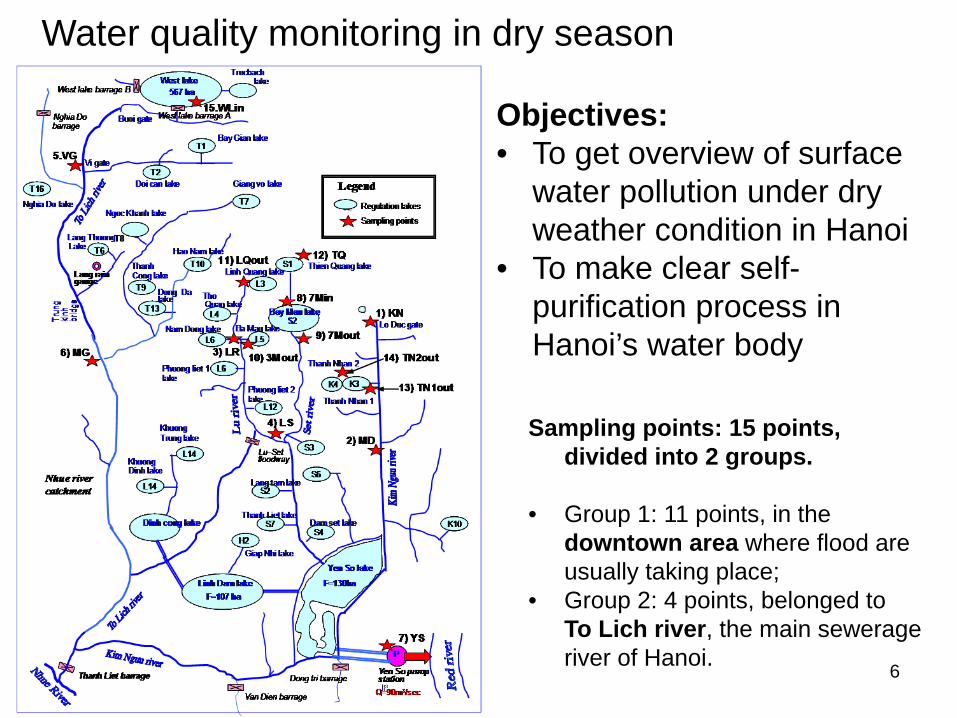
Sampling points: 15 points, divided into 2 groups.
• Group 1: 11 points, in the downtown area where flood are usually taking place;
• Group 2: 4 points, belonged to To Lich river, the main sewerage river of Hanoi.
Water quality monitoring in dry season
Objectives: • To get overview of surface
water pollution under dry weather condition in Hanoi
• To make clear self-purification process in Hanoi’s water body

7
Typical Vietnam standards for surface water environment
8
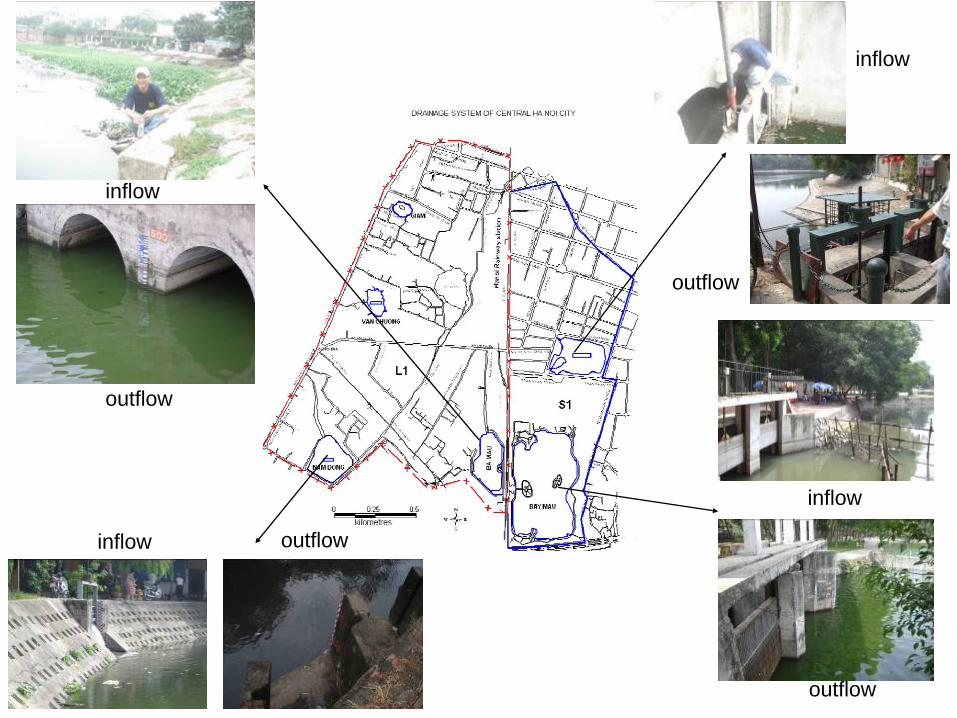
outflowinflow
inflow
outflow
inflow
outflow
inflow
outflow

9
Sampling points and water quality data
No Location In short pH [-]
DO[mg/l]
COD[mg/l]
P-COD[mg/l]
D-COD[mg/l]
T-N [mg/l]
T.coliform[CFU/ml]
E.coli[CFU/ml]
1Kim Nguu river, Lo Duc gate
KN 7.8 4.0 357.8 214.1 143.8 29.2 184000 63000
2Kim Nguu river, Mai Dong bridge
MD 8.0 3.3 151.6 68.8 82.8 11.1 135000 41000
3Lu river, start point
LR 7.6 2.5 93.8 57.8 35.9 35.4 91000 33000
4Lu - Set river flood way
LS 7.5 2.9 87.5 62.5 25.0 32.7 201000 75000
5To lich river, Vi gate
VG 7.5 2.5 115.6 90.6 25.0 34.6 106000 29000
6To lich river, Moc gate
MG 7.6 2.7 75.0 46.9 28.1 59.2 105000 36000
7Yen So pump station
YS 7.6 2.4 90.6 50.0 40.6 38.3 43000 19000
8Bay Mau lake, inflow from drainage
7M in 7.5 3.1 156.3 132.8 23.4 19.2 4100 800
9Bay Mau lake, outflow
7M out 8.0 5.3 29.7 10.9 18.8 17.2 80 15
10Ba Mau lake, outflow
3M out 8.1 4.7 96.9 79.7 17.2 26.9 10200 1600
11Linh Quang lake, outflow
LQ out 7.8 2.5 46.9 35.9 10.9 22.1 219000 94000
12Thien Quang lake, lake water
TQ 8.1 6.4 75.0 60.9 14.1 23.7 385 60
13Thanh Nhan 1 lake, outflow
TN1 out 8.9 9.7 40.6 25.0 15.6 20.6 160 10
14Thanh Nhan 2 lake, outflow
TN2 out 8.2 7.9 34.4 20.3 14.1 16.9 190 30
15West lake, inflow from drainage
WL in 7.6 5.0 46.9 28.1 18.8 24.8 94000 17000

10
Vietnam standard class B
Vietnam standard class B
Vietnam standard class A
Vietnam standard class BFor NO3-N+NH4-N
Vietnam standard class B
Vietnam standard class A
11
LS
YS
LR
VG
7M out
TN2 out
LQ out
WL in
TQ
3M out
MD
7M in
Influent
TN1 out
MG
Effluent
KN
0 10 20 30 40 50 60 70
Ward method / Normalized data/ Squared Euclidean Distance
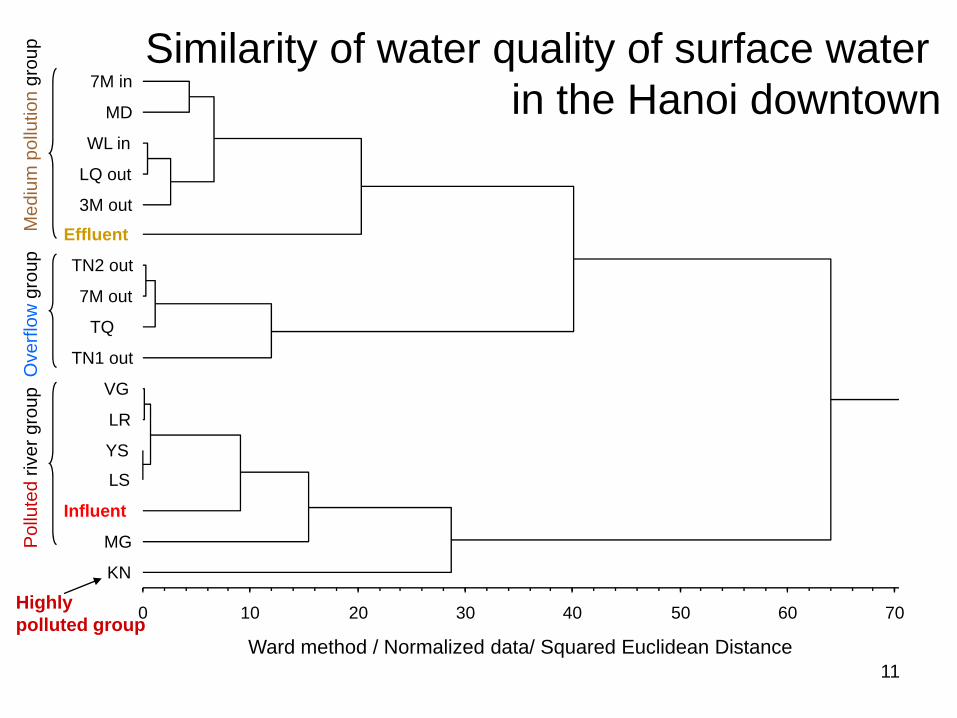
Pol
lute
d riv
er g
roup
Ove
rflow
gro
upM
ediu
m p
ollu
tion
grou
p
Highly polluted group
Similarity of water quality of surface water in the Hanoi downtown
12
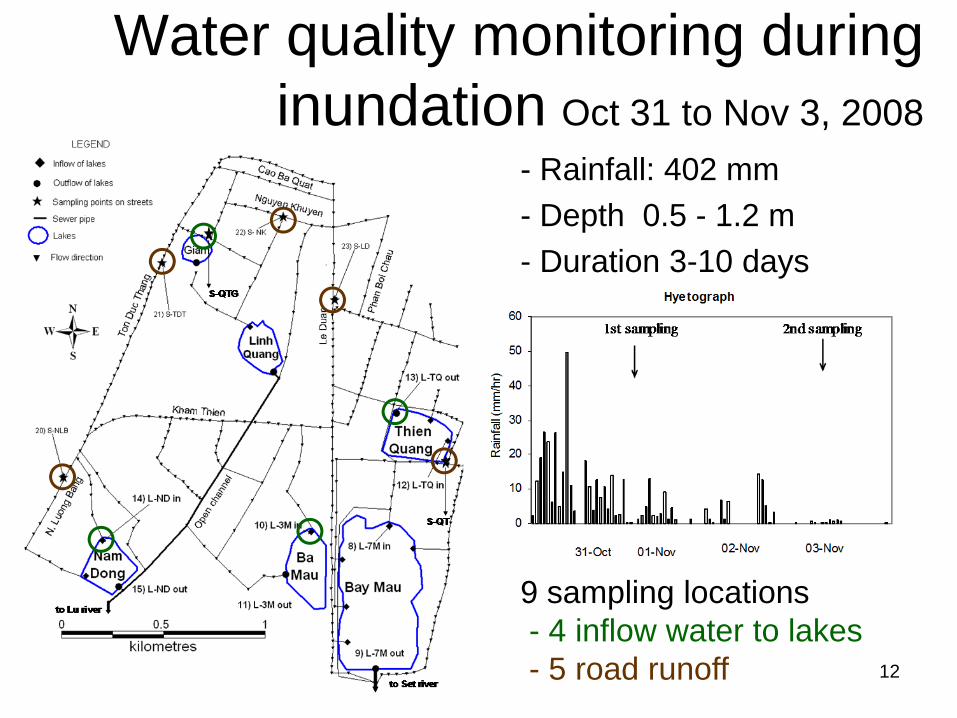
Water quality monitoring during inundation Oct 31 to Nov 3, 2008
- Rainfall: 402 mm- Depth 0.5 - 1.2 m- Duration 3-10 days
9 sampling locations - 4 inflow water to lakes- 5 road runoff
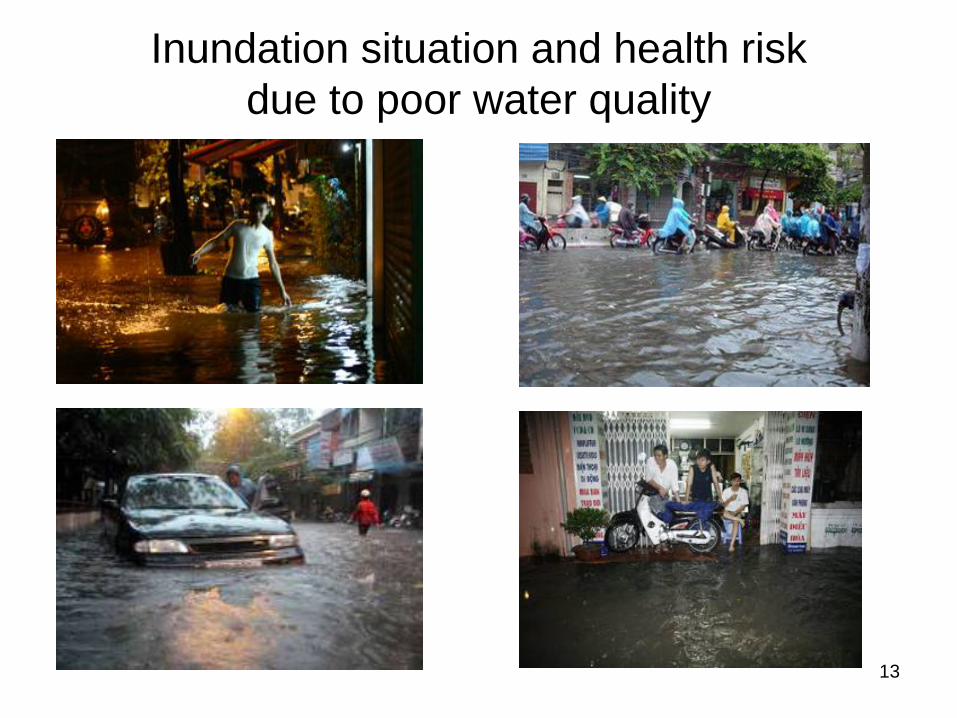
13
Inundation situation and health risk due to poor water quality
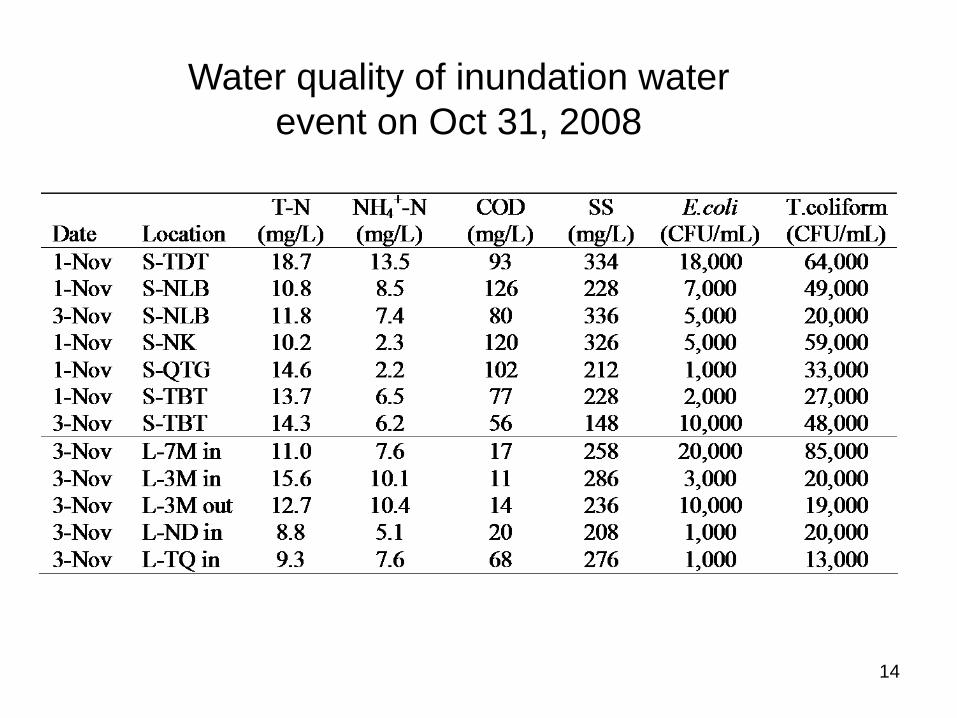
14
Water quality of inundation waterevent on Oct 31, 2008

15
Similarity of sampling locations under different weather
conditions

16
Water qualities during inundation
at different sampling pointsWater quality standard for Class B
T. coliform
T-N
NH4-N standard
T.coli standard
NO3-N standard
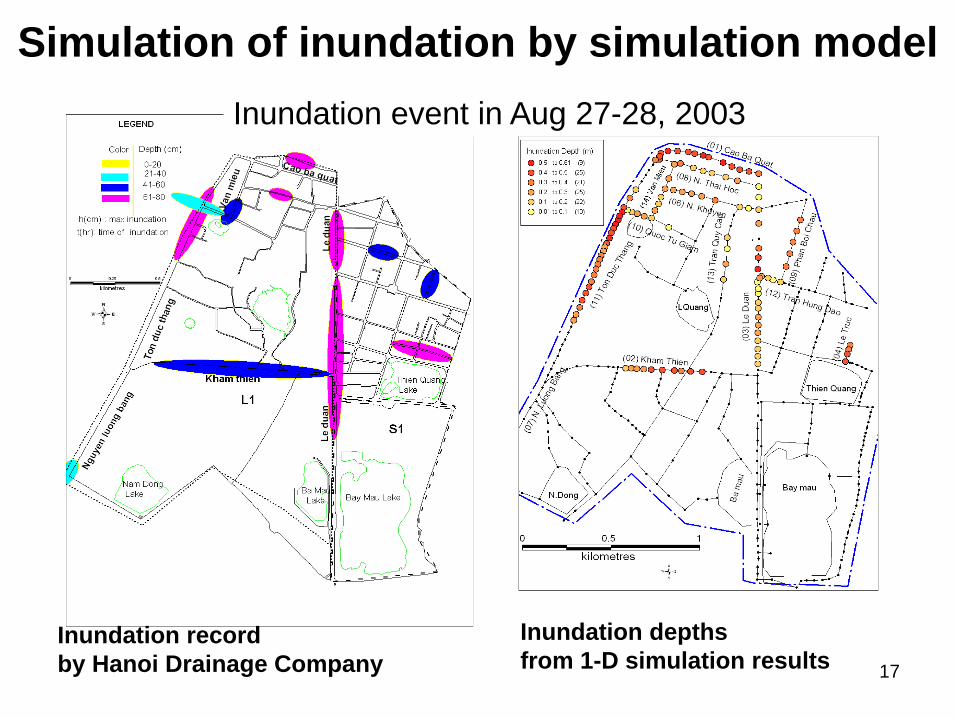
17
Inundation record by Hanoi Drainage Company
Inundation event in Aug 27-28, 2003
Inundation depthsfrom 1-D simulation results
Simulation of inundation by simulation model
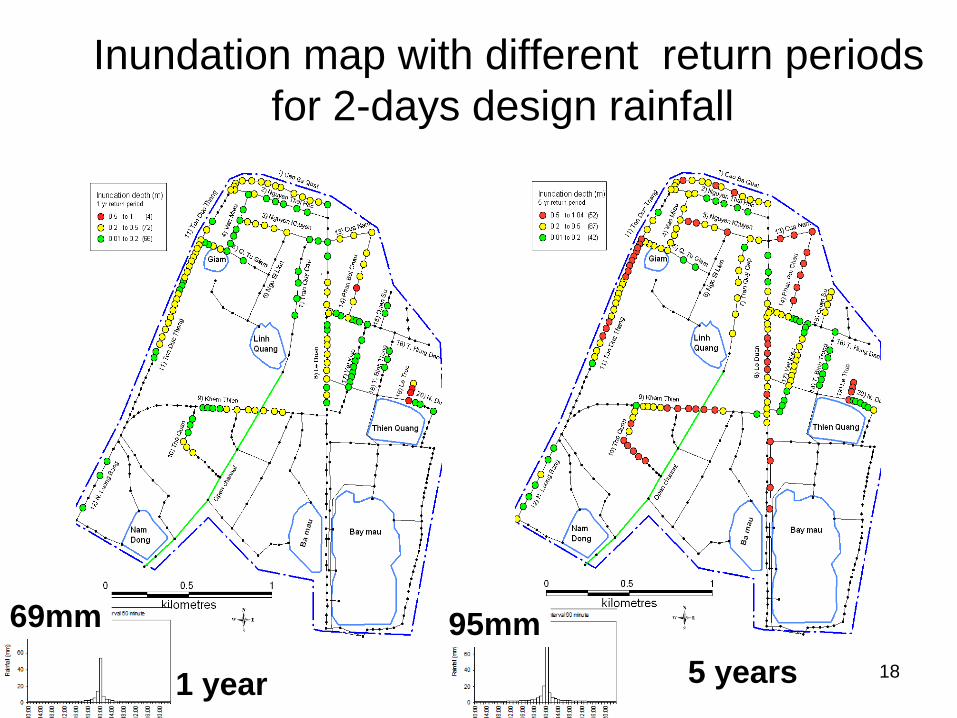
18
Inundation map with different return periodsfor 2-days design rainfall
1 year 5 years
69mm 95mm

19
Overlapping inundation depths with water monitoring data

20
Promotion of water quality study
• Idea on integrated study of Flood and Water Quality
• Case study is needed• Candidate basins?
21
Integrated study of Flood and WQ
1. Selection of points: hot spots, references2. Sampling procedure: sampling kits,
selected water quality parameter3. Pollutant sources identification: Point
and non-point pollution sources
Tool and Strategy- Watershed-based hydrological model in association
with water quality model- WQ mapping with flood/inundation areas

22
Integrated study of Drought and WQ
• Water quality change between drought and non-drought years
• Different water usage and their resources• Eutrophication occurrence during drought