unctad wir2012 chapter ii en
TRANSCRIPT

CHAPTER II
REGIONAL TRENDS IN FDI
Salient features of 2011 FDI trends by region include the following:
• Sub-Saharan Africa drew FDI not only to its natural resources, but also to its emerging consumer markets as the growth outlook remained positive. Political uncertainty in North Africa deterred investment in that region.
• FDI inflows reached new record levels in both East Asia and South-East Asia, while the latter is catching up with the former through higher FDI growth.
• FDI inflows to South Asia turned around as a result of higher inflows to India, the dominant FDI recipient in the region.
• Regional and global crises still weigh on FDI in West Asia, and prospects remain unclear.
• South America was the main driver of FDI growth in Latin America and the Caribbean. The pattern of investment by traditional investors – Europe and the United States – is changing, while there has been an advance in FDI from developing countries and Japan. A recent shift towards industrial policy in major countries may lead to investment flows to targeted industries.
• FDI flows to economies in transition recovered strongly. They are expected to grow further, partly because of the accession of the Russian Federation to the World Trade Organization (WTO).
• The search for energy and mineral resources resulted in cross-border megadeals in developed countries, but the eurozone crisis and a generally weak outlook still cloud investor sentiment.
• FDI inflows to the structurally weak, vulnerable and small economies were mixed. While FDI to landlocked developing countries (LLDCs) grew strongly, inflows to least developed countries (LDCs) and small island developing States (SIDS) continued to fall.

World Investment Report 2012: Towards a New Generation of Investment Policies38
INTRODUCTION
In 2011, FDI inflows increased in all major economic groups − developed, developing and transition economies (table II.1). Developing countries accounted for 45 per cent of global FDI inflows in 2011. The increase was driven by East and South-East Asia and Latin America. East and South-East Asia still accounted for almost half of FDI in developing economies. Inflows to the transition economies of South-East Europe, the Commonwealth of Independent States (CIS) and Georgia accounted for another 6 per cent of the global total.
The rise in FDI outflows was driven mainly by the growth of FDI from developed countries.
The growth in outflows from developing economies seen in the past several years appeared to lose some momentum in 2011 because of significant declines in flows from Latin America and the Caribbean and a slowdown in the growth of investments from developing Asia (excluding West Asia).
FDI inflows to the structurally weak, vulnerable and small economies bounced back from $42.2 billion in 2010 to $46.7 billion in 2011, owing to the strong growth in FDI to LLDCs (table II.1). However, the improvement in their share was hardly visible, as FDI inflows to both LDCs and SIDS continued to fall.
Table II.1. FDI flows, by region, 2009–2011(Billions of dollars and per cent)
RegionFDI inflows FDI outflows
2009 2010 2011 2009 2010 2011
World 1 197.8 1 309.0 1 524.4 1 175.1 1 451.4 1 694.4
Developed economies 606.2 618.6 747.9 857.8 989.6 1 237.5
Developing economies 519.2 616.7 684.4 268.5 400.1 383.8
Africa 52.6 43.1 42.7 3.2 7.0 3.5
East and South-East Asia 206.6 294.1 335.5 176.6 243.0 239.9
South Asia 42.4 31.7 38.9 16.4 13.6 15.2
West Asia 66.3 58.2 48.7 17.9 16.4 25.4
Latin America and the Caribbean 149.4 187.4 217.0 54.3 119.9 99.7
Transition economies 72.4 73.8 92.2 48.8 61.6 73.1
Structurally weak, vulnerable and small economiesa 45.2 42.2 46.7 5.0 11.5 9.2
LDCs 18.3 16.9 15.0 1.1 3.1 3.3
LLDCs 28.0 28.2 34.8 4.0 9.3 6.5
SIDS 4.4 4.2 4.1 0.3 0.3 0.6
Memorandum: percentage share in world FDI flowsDeveloped economies 50.6 47.3 49.1 73.0 68.2 73.0
Developing economies 43.3 47.1 44.9 22.8 27.6 22.6
Africa 4.4 3.3 2.8 0.3 0.5 0.2
East and South-East Asia 17.2 22.5 22.0 15.0 16.7 14.2
South Asia 3.5 2.4 2.6 1.4 0.9 0.9
West Asia 5.5 4.4 3.2 1.5 1.1 1.5
Latin America and the Caribbean 12.5 14.3 14.2 4.6 8.3 5.9
Transition economies 6.0 5.6 6.0 4.2 4.2 4.3
Structurally weak, vulnerable and small economiesa 3.8 3.2 3.1 0.4 0.8 0.5
LDCs 1.5 1.3 1.0 0.1 0.2 0.2
LLDCs 2.3 2.2 2.3 0.3 0.6 0.4
SIDS 0.4 0.3 0.3 0.0 0.0 0.0
Source: UNCTAD, FDI/TNC database (www.unctad.org/fdistatistics).a Without double counting.

CHAPTER II Regional Trends in FDI 39
1. AfricaA. REGIONAL TRENDS
Table B. Cross-border M&As by industry, 2010–2011(Millions of dollars)
Sector/industry Sales Purchases2010 2011 2010 2011
Total 8 072 7 205 3 309 4 812Primary 2 516 1 664 - 28 - 22
Mining, quarrying and petroleum 2 516 1 595 - 28 - 22Manufacturing 303 1 922 404 4 393
Food, beverages and tobacco 263 1 026 2 15Chemicals and chemical products 5 155 - 15 810Metals and metal products 32 286 - -Electrical and electronic equipment - 9 470 - -
Services 5 253 3 619 2 933 441Trade 84 2 161 - 49 - 181Transport, storage and communications 1 912 489 - - 10Finance 134 910 2 547 674Business services 2 994 149 436 37
Table C. Cross-border M&As by region/country, 2010–2011(Millions of dollars)
Region/country Sales Purchases2010 2011 2010 2011
World 8 072 7 205 3 309 4 812Developed economies 6 722 4 308 1 371 4 265
European Union 1 838 2 528 1 240 1 987United States 1 931 1 408 45 41Japan 3 199 649 - -Other developed countries - 246 - 278 86 2 236
Developing economies 1 048 2 865 1 550 547Africa 365 408 365 408East and South-East Asia 499 1 679 257 - 78South Asia 10 922 318 38 217West Asia - 10 653 464 965 -Latin America and the Caribbean - 84 - 5 - 75 -
Transition economies 51 - 130 388 -
Table D. Greenfield FDI projects by industry, 2010–2011(Millions of dollars)
Sector/industry Africa as destination Africa as investors2010 2011 2010 2011
Total 88 918 82 315 16 662 16 551Primary 20 237 22 824 1 246 4 640
Mining, quarrying and petroleum 20 237 22 824 1 246 4 640Manufacturing 39 506 31 205 7 506 4 798
Food, beverages and tobacco 1 888 5 185 175 628Coke, petroleum and nuclear fuel 23 235 9 793 5 684 2 212Metals and metal products 2 093 5 185 429 9Motor vehicles and other transport equipment 2 568 3 118 99 -
Services 29 175 28 286 7 910 7 113Electricity, gas and water 5 432 10 477 899 1 441Construction 7 630 3 303 - 1 223Transport, storage and communications 6 381 5 345 2 627 68Business services 5 429 5 619 1 274 2 282
Table E. Greenfield FDI projects by region/country, 2010–2011(Millions of dollars)
Partner region/economy Africa as destination Africa as investors2010 2011 2010 2011
World 88 918 82 315 16 662 16 551Developed economies 48 554 38 939 1 192 487
European Union 32 095 23 633 373 182United States 5 507 6 627 49 259Japan 473 1 299 - -Other developed countries 10 479 7 380 769 45
Developing economies 37 752 42 649 15 462 16 064Africa 12 226 10 368 12 226 10 368East and South-East Asia 9 929 12 357 141 400South Asia 4 890 11 113 75 980West Asia 9 897 7 038 2 517 150Latin America and the Caribbean 809 1 774 503 1 167
Transition economies 2 612 727 8 -
Fig. B - AfricaFDI in�ows
0
10
20
30
40
50
60
70
2005
Share in world total
2006 2007 2008 2009 2010 2011
Central Africa Southern Africa West Africa East Africa North Africa
Fig. C - AfricaFDI out�ows
- 4
- 2
0
2
4
6
8
10
2005 2006 2007 2008 2009 2010 2011
Central Africa Southern Africa West Africa East Africa North Africa
3.1 2.5 2.6 3.2 4.4 3.3 2.8 0.2 0.6 0.4 0.4 0.3 0.5 0.2
Figure C. FDI outflows, 2005–2011(Billions of dollars)
Figure B. FDI inflows, 2005–2011(Billions of dollars)
Fig. FID �ows - Africa
(Host) (Home)
0.0 1.0 2.0 3.0 4.0 5.0 6.0 7.0 8.0 9.0 10.0
Algeria
Congo
Ghana
South Africa
Nigeria
2011 2010
0.0 0.2 0.4 0.6 0.8 1.0 1.2 1.4 1.6
2011 2010
Angola
Zambia
Egypt
Algeria
Liberia
Figure A. FDI flows, top 5 host and home economies, 2010–2011(Billions of dollars)
Table A. Distribution of FDI flows among economies, by range,a 2011
Range Inflows OutflowsAbove $3.0 billion
Nigeria, South Africa and Ghana ..
$2.0 to $2.9 billion
Congo, Algeria, Morocco, Mozambique, Zambia ..
$1.0 to $1.9 billion
Sudan, Chad, Democratic Republic of the Congo, Guinea, Tunisia, United Republic of Tanzania, Niger
Angola, Zambia
$0.5 to $0.9 billion
Madagascar, Namibia, Uganda, Equatorial Guinea, Gabon, Botswana, Liberia
Egypt, Algeria
$0.1 to $0.4 billion
Zimbabwe, Cameroon, Côte d'Ivoire, Kenya, Senegal, Mauritius, Ethiopia, Mali, Seychelles, Benin, Central African Republic, Rwanda, Somalia
Liberia, Morocco, Libya
Below $0.1 billion
Swaziland, Cape Verde, Djibouti, Malawi, Togo, Lesotho, Sierra Leone, Mauritania, Gambia, Guinea-Bissau, Eritrea, São Tomé and Principe, Burkina Faso, Comoros, Burundi, Egypt, Angola
Democratic Republic of the Congo, Mauritius, Gabon, Sudan, Senegal, Niger, Tunisia, Togo, Zimbabwe, Kenya, Côte d'Ivoire, Seychelles, Ghana, Guinea, Swaziland, Mauritania, Burkina Faso, Botswana, Benin, Mali, Guinea-Bissau, São Tomé and Principe, Cape Verde, Namibia, Mozambique, Cameroon, South Africa, Nigeria
a Economies are listed according to the magnitude of their FDI flows.
World Investment Report 2012: Towards a New Generation of Investment Policies40
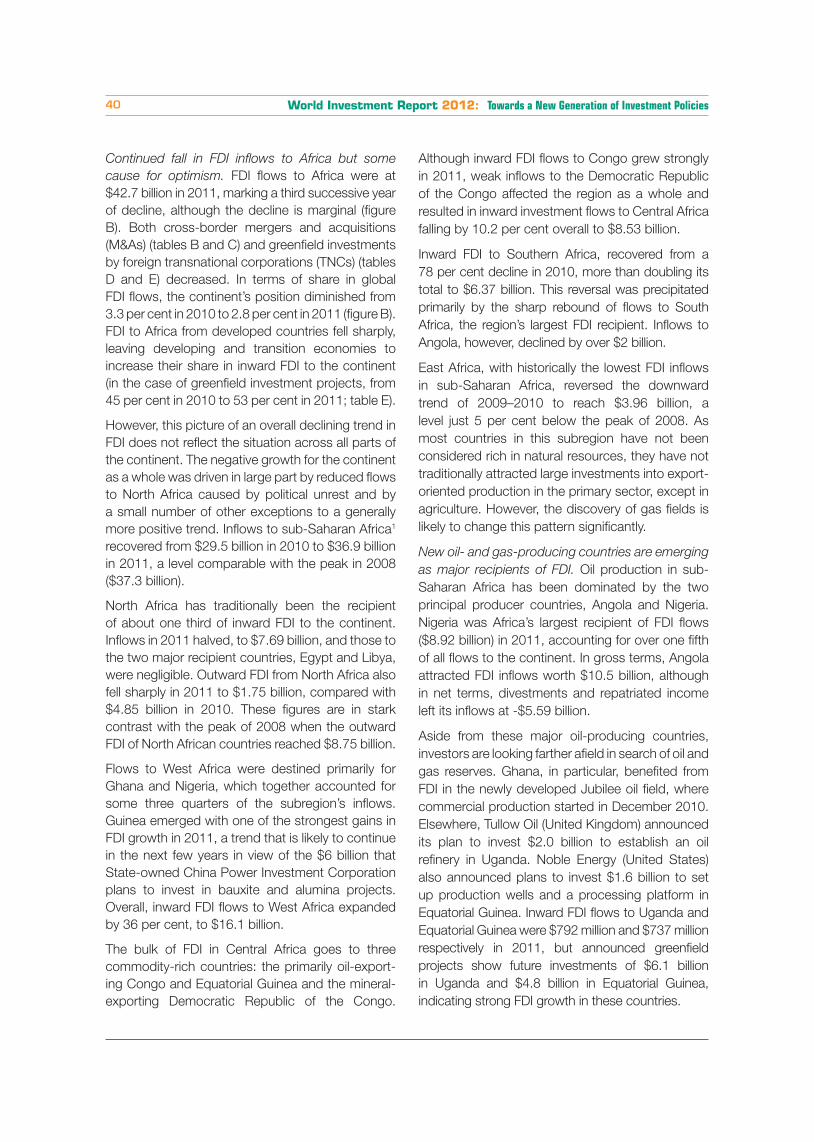
Continued fall in FDI inflows to Africa but some cause for optimism. FDI flows to Africa were at $42.7 billion in 2011, marking a third successive year of decline, although the decline is marginal (figure B). Both cross-border mergers and acquisitions (M&As) (tables B and C) and greenfield investments by foreign transnational corporations (TNCs) (tables D and E) decreased. In terms of share in global FDI flows, the continent’s position diminished from 3.3 per cent in 2010 to 2.8 per cent in 2011 (figure B). FDI to Africa from developed countries fell sharply, leaving developing and transition economies to increase their share in inward FDI to the continent (in the case of greenfield investment projects, from 45 per cent in 2010 to 53 per cent in 2011; table E).
However, this picture of an overall declining trend in FDI does not reflect the situation across all parts of the continent. The negative growth for the continent as a whole was driven in large part by reduced flows to North Africa caused by political unrest and by a small number of other exceptions to a generally more positive trend. Inflows to sub-Saharan Africa1 recovered from $29.5 billion in 2010 to $36.9 billion in 2011, a level comparable with the peak in 2008 ($37.3 billion).
North Africa has traditionally been the recipient of about one third of inward FDI to the continent. Inflows in 2011 halved, to $7.69 billion, and those to the two major recipient countries, Egypt and Libya, were negligible. Outward FDI from North Africa also fell sharply in 2011 to $1.75 billion, compared with $4.85 billion in 2010. These figures are in stark contrast with the peak of 2008 when the outward FDI of North African countries reached $8.75 billion.
Flows to West Africa were destined primarily for Ghana and Nigeria, which together accounted for some three quarters of the subregion’s inflows. Guinea emerged with one of the strongest gains in FDI growth in 2011, a trend that is likely to continue in the next few years in view of the $6 billion that State-owned China Power Investment Corporation plans to invest in bauxite and alumina projects. Overall, inward FDI flows to West Africa expanded by 36 per cent, to $16.1 billion.
The bulk of FDI in Central Africa goes to three commodity-rich countries: the primarily oil-export-ing Congo and Equatorial Guinea and the mineral- exporting Democratic Republic of the Congo.
Although inward FDI flows to Congo grew strongly in 2011, weak inflows to the Democratic Republic of the Congo affected the region as a whole and resulted in inward investment flows to Central Africa falling by 10.2 per cent overall to $8.53 billion.
Inward FDI to Southern Africa, recovered from a 78 per cent decline in 2010, more than doubling its total to $6.37 billion. This reversal was precipitated primarily by the sharp rebound of flows to South Africa, the region’s largest FDI recipient. Inflows to Angola, however, declined by over $2 billion.
East Africa, with historically the lowest FDI inflows in sub-Saharan Africa, reversed the downward trend of 2009–2010 to reach $3.96 billion, a level just 5 per cent below the peak of 2008. As most countries in this subregion have not been considered rich in natural resources, they have not traditionally attracted large investments into export-oriented production in the primary sector, except in agriculture. However, the discovery of gas fields is likely to change this pattern significantly.
New oil- and gas-producing countries are emerging as major recipients of FDI. Oil production in sub-Saharan Africa has been dominated by the two principal producer countries, Angola and Nigeria. Nigeria was Africa’s largest recipient of FDI flows ($8.92 billion) in 2011, accounting for over one fifth of all flows to the continent. In gross terms, Angola attracted FDI inflows worth $10.5 billion, although in net terms, divestments and repatriated income left its inflows at -$5.59 billion.
Aside from these major oil-producing countries, investors are looking farther afield in search of oil and gas reserves. Ghana, in particular, benefited from FDI in the newly developed Jubilee oil field, where commercial production started in December 2010. Elsewhere, Tullow Oil (United Kingdom) announced its plan to invest $2.0 billion to establish an oil refinery in Uganda. Noble Energy (United States) also announced plans to invest $1.6 billion to set up production wells and a processing platform in Equatorial Guinea. Inward FDI flows to Uganda and Equatorial Guinea were $792 million and $737 million respectively in 2011, but announced greenfield projects show future investments of $6.1 billion in Uganda and $4.8 billion in Equatorial Guinea, indicating strong FDI growth in these countries.

CHAPTER II Regional Trends in FDI 41
If oil reserves off the Atlantic coast of Africa have drawn significant FDI to that region, natural gas reserves in East Africa, especially the offshore fields of Mozambique and the United Republic of Tanzania, hold equal promise. In 2011, inflows of FDI to Mozambique doubled from the previous year, to $2.09 billion. New discoveries of large-scale gas reserves continue to be made in 2012. Development of gas fields and the liquefied natural gas (LNG) industry will require huge upfront investments and presents considerable technological challenges. FDI is certain to play a large role in developing this industry in the region, as exemplified by the plans announced by Eni (Italy) to invest $50 billion to develop the gas fields recently discovered in Mozambique.
Sectoral shift emerging, especially towards services. The limited volume of FDI to Africa tends to make inflows vary widely from year to year. Nevertheless, viewed over a longer time period, a discernible sectoral shift is taking place in FDI to Africa. Data on greenfield projects by three-year periods show that, contrary to popular perceptions, the relative importance of the primary sector is declining, although the total value of projects is holding steady (figure II.1).
The data on projects in services in the period 2006–2008 are inflated by the announcements of no fewer than 13 construction projects worth more than $3 billion each, which take many years to complete. Still, a general ascendancy of the services sector is clear. Aside from the construction industry, projects are drawn into industries such as electric, gas and water distribution, and transport,
storage and communications in the services sector and industries such as coke, petroleum products and nuclear fuel in the manufacturing sector.
This shift is more about diversification of natural-resource-related activities than a decline of the extractive industry. Many of the projects in manufacturing and services are premised on the availability of natural resources or play a supporting role for the extractive industry. Such projects include a $15 billion project by Western Goldfields (Canada) to construct a coal-fired power station in Nigeria and an $8 billion project by Klesch & Company (United Kingdom) to build an oil refinery in Libya, both announced in 2008.
Better prospects for 2012. The region’s prospects for FDI in 2012 are promising, as strong economic growth, ongoing economic reforms and high commodity prices have improved investor perceptions of the continent. Relatively high profitability of FDI in the continent is another factor. Data on the profitability of United States FDI (FDI income as a share of FDI stock) show a 20 per cent return in Africa in 2010, compared with 14 per cent in Latin America and the Caribbean and 15 per cent in Asia (United States Department of Commerce, 2011: 51). In addition to traditional patterns of FDI to the extractive industries, the emergence of a middle class is fostering the growth of FDI in services such as banking, retail and telecommunications. UNCTAD’s forecast of FDI inflows also points to this pattern (figure I.10). It is especially likely if investor confidence begins to return to North Africa and compensates for the recent declines in this region.
Figure II.1. Value of greenfield investments in Africa, by sector, 2003–2011(Billions of dollars)
Source: UNCTAD, based on data from Financial Times Ltd, fDi Markets (www.fDimarkets.com).
050
100150200250300350400450500
2003–2005 2006–2008 2009–2011
ServicesManufacturingPrimary
World Investment Report 2012: Towards a New Generation of Investment Policies42
2. East and South-East Asia
Table B. Cross-border M&As by industry, 2010–2011(Millions of dollars)
Sector/industry Sales Purchases2010 2011 2010 2011
Total 26 417 32 715 67 609 67 966Primary - 427 5 214 18 844 19 301
Mining, quarrying and petroleum - 607 4 780 18 932 19 695Manufacturing 11 423 10 253 6 994 12 609
Food, beverages and tobacco 2 383 3 078 3 714 961Chemicals and chemical products 1 796 1 159 2 396 6 596Electrical and electronic equipment 864 3 279 - 331 1 794Precision instruments 78 806 3 684
Services 15 421 17 248 41 771 36 056Electricity, gas and water 796 2 280 1 345 3 855Trade 194 1 704 1 912 1 752Finance 952 6 484 33 111 31 215Business services 5 642 4 365 - 483 - 1 273
Table C. Cross-border M&As by region/country, 2010–2011(Millions of dollars)
Region/country Sales Purchases2010 2011 2010 2011
World 26 417 32 715 67 609 67 966Developed economies 7 439 15 007 34 985 45 773
European Union 1 288 4 548 17 977 13 906United States 673 2 086 4 849 12 369Japan 3 229 6 760 647 1 084Other developed countries 2 249 1 613 11 511 18 414
Developing economies 18 087 15 346 32 604 21 814Africa 257 - 78 499 1 679East and South-East Asia 18 870 12 968 18 870 12 968South Asia 1 201 539 - 1 731 - 2 417West Asia - 2 320 1 758 127 253Latin America and the Caribbean 79 159 14 664 9 311
Transition economies - 1 531 20 379
Table D. Greenfield FDI projects by industry, 2010–2011(Millions of dollars)
Sector/industryEast and South-East Asia as destination
East and South-East Asia as investors
2010 2011 2010 2011Total 213 770 206 924 143 094 125 466
Primary 3 658 4 444 4 262 5 158Mining, quarrying and petroleum 3 647 4 444 4 262 5 158
Manufacturing 129 489 131 800 104 303 85 119Chemicals and chemical products 16 410 25 582 7 980 6 480Metals and metal products 14 856 16 735 16 028 24 522Electrical and electronic equipment 34 930 21 578 26 528 11 376Motor vehicles and other transport equipment 28 559 17 921 10 523 9 084
Services 80 623 70 681 34 530 35 189Construction 4 601 7 021 5 030 3 840Transport, storage and communications 13 226 19 141 5 943 6 745Finance 15 900 16 451 4 777 5 250Business services 13 471 10 255 4 200 1 682
Table E. Greenfield FDI projects by region/country, 2010–2011(Millions of dollars)
Partner region/economyEast and South-East Asia as destination
East and South-East Asia as investors
2010 2011 2010 2011World 213 770 206 924 143 094 125 466
Developed economies 136 798 133 339 32 559 16 470European Union 44 341 57 936 5 567 7 123United States 44 237 33 515 8 093 5 961Japan 36 353 30 198 362 510Other developed countries 11 866 11 690 18 537 2 877
Developing economies 71 324 72 353 105 283 102 434Africa 141 400 9 929 12 357East and South-East Asia 63 779 56 138 63 779 56 138South Asia 1 955 10 973 18 556 19 050West Asia 2 910 3 965 2 541 5 930Latin America and the Caribbean 2 531 675 9 556 8 950
Transition economies 5 648 1 232 5 253 6 563
Table A. Distribution of FDI flows among economies, by range,a 2011
Range Inflows Outflows
Above $50 billion
China, Hong Kong (China), Singapore
Hong Kong (China), China
$10 to $49 billion
Indonesia, MalaysiaSingapore, Republic of Korea, Malaysia, Taiwan Province of China, Thailand
$1.0 to $9.9 billion
Viet Nam, Thailand, Mongolia, Republic of Korea, Macao (China), Philippines, Brunei Darussalam
Indonesia, Viet Nam
$0.1 to $0.9 billion
Cambodia, Myanmar, Lao People's Democratic Republic
..
Below $0.1 billion
Democratic People's Republic of Korea, Timor-Leste, Taiwan Province of China
Mongolia, Macao (China), Cambodia, Brunei Darussalam, Philippines, Lao People's Democratic Republic
a Economies are listed according to the magnitude of their FDI flows.Fig. B - East & South-East AsiaFDI in�ows
Fig. C - East & South-East AsiaFDI out�ows
0
40
80
120
160
200
240
280
320
2005 2006 2007 2008 2009 2010 2011
South-East Asia East Asia
0
40
80
120
160
200
240
2005 2006 2007 2008 2009 2010 2011
South-East Asia East Asia
Share in world total
16.3 13.4 12.0 13.2 17.2 22.5 22.0 7.9 8.1 7.9 8.4 15.0 16.7 14.2
Figure C. FDI outflows, 2005–2011(Billions of dollars)
Figure B. FDI inflows, 2005–2011(Billions of dollars)
0 20 40 60 80 100 120 140
Malaysia
Indonesia
Singapore
Hong Kong, China
China
0 20 40 60 80 100 120
Malaysia
Republic of Korea
Singapore
China
Hong Kong, China
Fig. FID �ows - East and South-East Asia
Fig. FID �ows - Africa
(Host) (Home)
2011 2010 2011 2010
Figure A. FDI flows, top 5 host and home economies, 2010–2011(Billions of dollars)

CHAPTER II Regional Trends in FDI 43
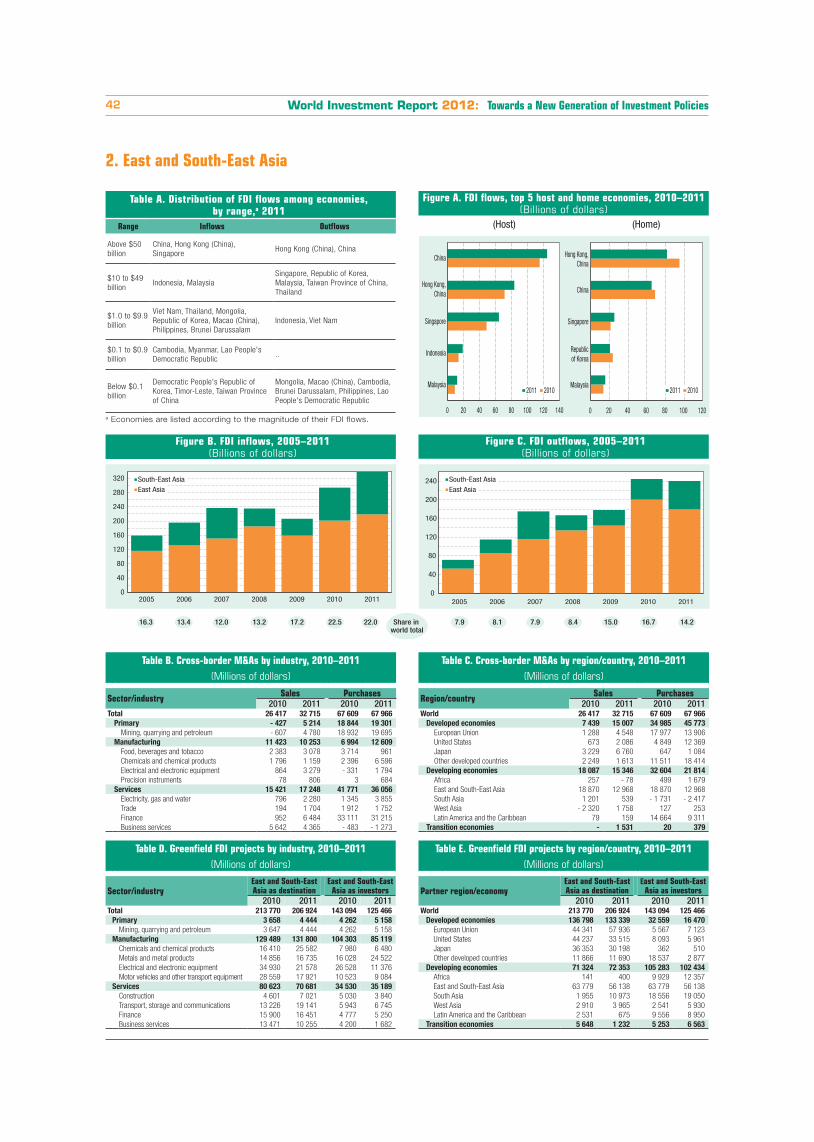
South-East Asia is catching up. Registering a 14 per cent increase, total FDI inflows to East and South-East Asia amounted to $336 billion in 2011 (figure B). The region accounted for 22 per cent of total global FDI flows, up from about 12 per cent before the global financial crisis. FDI inflows reached new records in both subregions, as well as in the major economies, such as China; Hong Kong, China; Singapore and Indonesia (figure A).
South-East Asia continued to outperform East Asia in FDI growth. Inflows to the former reached $117 billion, up 26 per cent, compared with $219 billion, up 9 per cent, in the latter, narrowing the gap between the two subregions (figure B, annex table I.1).
Among the economies of the Association of Southeast Asian Nations (ASEAN), four – Brunei Darussalam, Indonesia, Malaysia and Singapore – saw a considerable rise in their FDI inflows. The performance of the relatively low-income countries, namely Cambodia, the Lao People’s Democratic Republic and Myanmar was generally good as well, though Viet Nam declined slightly. Although natural disaster in Thailand disrupted production by foreign affiliates in the country, particularly in the automobile and electronic industries, and exposed a weakness of the current supply-chain management systems, FDI inflows to the country remained at a high level of nearly $10 billion, only marginally lower than that of 2010. Overall, as East Asian countries, particularly China, have continued to experience rising wages and production costs, the relative competitiveness of ASEAN in manufacturing has been enhanced. Accordingly, some foreign affiliates in China’s coastal regions are relocating to South-East Asia,2 while others are moving their production facilities to inland China.
The performance of East Asian economies showed a mixed picture. FDI flows to China reached a historically high level of $124 billion in 2011. The second largest recipient in the subregion, Hong Kong, China, saw its inflows increase to $83 billion (figure A), a historic high as well. By contrast, inflows to the Republic of Korea and Taiwan Province of China declined to $4.7 billion and -$2 billion, respectively.
Japan gains ground as investor in the region. Partly as a result of the significant appreciation
of the Japanese yen in 2011, TNCs from Japan have strengthened their efforts in investing abroad (section A.7), particularly in low-cost production locations in South-East Asia. For instance, in 2011, attracted by low labour costs and good growth prospects, Japanese companies pledged to invest about $1.8 billion in Viet Nam.3 In China, FDI from Japan rose from $4 billion (4 per cent of total inflows) in 2010 to $6 billion (9 per cent of total inflows) in 2011. In Mongolia, large projects in extractive industries, including the Tavan Tolgoi coal mine, are being implemented or negotiated, some with Japanese investors. In addition, negotiation of the Economic Partnership Agreement with Japan may bring in more FDI to Mongolia.
Owing to the worsening sovereign debt crisis and related liquidity problems at home, TNCs from Europe have slowed their pace of expansion in East and South-East Asia since late 2011. In particular, some European banks have undertaken divestments from the region, selling their Asian operations to regional players, a trend which may continue this year with banks such as HSBC and Royal Bank of Scotland selling assets in Hong Kong, China; Thailand; and Malaysia. The actions of TNCs from the United States were mixed: some in industries such as home appliances have been relocating production facilities to their home countries,4 while others in industries such as automotives have continued to expand in Asia.5
Greenfield investment dominates, but M&As are on the rise. Greenfield investment is the dominant mode of entry in East and South-East Asia, although the total amount of investment decreased slightly in 2011 to about $207 billion. In contrast, cross-border M&As sales in the region increased by about 24 per cent to $33 billion, driven by a surge in South-East Asia, where total M&A sales more than doubled, reaching $20 billion. Sales in East Asia dropped by one fourth, with a rise in M&As in China (up 77 per cent to $11 billion) cancelled out by a fall in those in Hong Kong, China (down 92 per cent to $1 billion).
In manufacturing, the major industries in which greenfield investment took place were chemical products, electronics, automotive and metal and metal products in that order, while those most targeted for cross-border M&As were electronics and food and beverages. M&A sales also increased
World Investment Report 2012: Towards a New Generation of Investment Policies44
in services, contributing to a longer-term shift. In China, for example, FDI flows to services surpassed those to manufacturing for the first time as the result of a rise in flows to non-financial services and a slowdown of flows to manufacturing. FDI in finance is expected to grow as the country continues to open its financial markets,6 and as foreign banks, including HSBC (United Kingdom) and Citigroup (United States), expand their presence through both M&As and organic growth.7
Outward FDI: East Asia slows down while South-East Asia sets a new record. FDI outflows from East and South-East Asia as a whole remained more or less stable after the significant increase in 2010 (figure C). FDI outflows from East Asia dropped by 9 per cent to $180 billion, the first decline since 2005, while those from South-East Asia rose 36 per cent to $60 billion, a record high.
FDI outflows from Hong Kong, China, the region’s financial centre and largest source of FDI, declined in 2011 by 14.5 per cent to $82 billion, but increased in the last quarter of the year. FDI outflows from China dropped by 5.4 per cent to $65 billion. In contrast, outflows from Singapore, the leading source of FDI in South-East Asia, registered a 19 per cent growth, reaching $25 billion. Outflows from Thailand and Indonesia surged, reaching $11 billion and $8 billion. The boom was driven mainly by cross-border M&As in the case of Thailand and by greenfield investments in the case of Indonesia.
Diverging patterns in overseas M&As. TNCs from East and South-East Asia continued to expand globally by actively acquiring overseas assets. Their M&A purchases worldwide amounted to $68 billion in 2011, marginally higher than the previous record set in 2010. Their cross-border M&A activities demonstrated diverging trends: total purchases in developed countries increased by 31 per cent to $46 billion, while those in developing countries declined by 33 per cent to $22 billion (table C). The rise in their M&As in developed countries as a whole was driven mainly by increases in Australia (up 20 per cent to $8 billion), Canada (up 99 per cent to $9 billion) and the United States (up 155 per cent to $12 billion), while the value of total purchases in Europe decreased by 8 per cent to $17 billion. The rise in M&A purchases in the developed
world corresponded to an increase in M&As in manufacturing, to $13 billion (table B). Greenfield investment by TNCs from East and South-East Asia dropped, in both number and value (tables D and E). The number of recorded greenfield projects undertaken by firms based in East and South-East Asia was about 1,200. The value of investments dropped by 12 per cent to about $125 billion.
In manufacturing, East and South-East Asian TNCs in industries such as metals and metal products as well as food and beverages have been investing more frequently through greenfield investment. In services, companies from East Asia in particular continued to be active players in the M&A markets in both developed and developing countries.
Short-term prospects: slowing growth. FDI growth in the region has slowed since late 2011 because of growing uncertainties in the global economy. FDI to manufacturing stagnated in China, but the country is increasingly attracting market-seeking FDI, especially in services. According to the annual World Investment Prospects Survey (WIPS) undertaken by UNCTAD this year, China continues to be the most favoured destination of FDI inflows. FDI prospects in South-East Asia remain promising, as the rankings of ASEAN economies, such as Indonesia and Thailand, have risen markedly in the survey.

CHAPTER II Regional Trends in FDI 45
3. South Asia
Table B. Cross-border M&As by industry, 2010–2011(Millions of dollars)
Sector/industry Sales Purchases2010 2011 2010 2011
Total 5 569 12 875 26 682 6 078Primary 18 8 997 5 240 111
Mining, quarrying and petroleum 18 8 997 5 240 111Manufacturing 5 960 1 940 2 499 1 489
Wood and wood products - 435 - 6Chemicals and chemical products 4 194 85 174 1 370Non-metallic mineral products 3 152 393 24Motor vehicles and other transport equipment 4 977 - 14 470
Services - 409 1 937 18 943 4 478Electricity, gas and water - 310 95 1 636Trade 53 341 29 -Finance 275 701 5 745 1 461Business services - 602 291 424 96
Table C. Cross-border M&As by region/country, 2010–2011(Millions of dollars)
Region/country Sales Purchases2010 2011 2010 2011
World 5 569 12 875 26 682 6 078Developed economies 7 439 14 870 7 836 5 239
European Union 153 12 450 971 1 094United States 5 319 1 576 3 343 23Japan 1 372 986 - 40Other developed countries 596 - 142 3 522 4 082
Developing economies - 1 910 - 2 017 18 823 1 083Africa 38 217 10 922 318East and South-East Asia - 1 731 - 2 417 1 201 539South Asia 342 46 342 46West Asia 177 133 898 -Latin America and the Caribbean - 735 3 5 460 180
Transition economies - - 24 - 245
Table E. Greenfield FDI projects by region/country, 2010–2011(Millions of dollars)
Partner region/economySouth Asia
as destinationSouth Asia
as investors2010 2011 2010 2011
World 62 899 68 019 20 777 35 593Developed economies 38 423 41 532 6 368 4 503
European Union 18 858 16 008 3 619 2 512United States 11 169 14 024 728 1 497Japan 6 258 8 366 8 8Other developed countries 2 138 3 135 2 012 485
Developing economies 23 900 26 097 13 341 30 266Africa 75 980 4 890 11 113East and South-East Asia 18 556 19 050 1 955 10 973South Asia 2 177 1 910 2 177 1 910West Asia 2 266 4 093 3 752 5 672Latin America and the Caribbean 826 64 566 598
Transition economies 576 389 1 069 824
Table D. Greenfield FDI projects by industry, 2010–2011(Millions of dollars)
Sector/industrySouth Asia
as destinationSouth Asia
as investors2010 2011 2010 2011
Total 62 899 68 019 20 777 35 593Primary 1 080 - 679 4 165
Mining, quarrying and petroleum 1 080 - 679 4 165Manufacturing 43 943 47 649 12 446 19 435
Chemicals and chemical products 4 224 4 567 3 905 1 370Metals and metal products 13 635 19 223 3 740 8 287Machinery and equipment 2 809 3 157 404 132Motor vehicles and other transport equipment 9 483 11 466 2 349 2 628
Services 17 876 20 369 7 653 11 993Construction 1 554 2 640 511 776Transport, storage and communications 4 554 3 675 501 345Finance 2 108 2 552 1 823 1 710Business services 2 722 5 879 1 785 3 228
Table A. Distribution of FDI flows among economies, by range,a 2011
Range Inflows Outflows
Above $10 billion
India India
$1.0 to $9.9 billion
Islamic Republic of Iran, Pakistan, Bangladesh
..
$0.1 to $0.9 billion
Sri Lanka, Maldives Islamic Republic of Iran
Below $0.1 billion
Nepal, Afghanistan, Bhutan Pakistan, Sri Lanka, Bangladesh
a Economies are listed according to the magnitude of their FDI flows.
Fig. B - South AsiaFDI in�ows
Fig. C - South AsiaFDI in�ows
0
10
20
30
40
50
60
2005 2006 2007 2008 2009 2010 2011 2005 2006 2007 2008 2009 2010 2011
Share in world total
1.5 1.9 1.8 3.0 3.5 2.4 2.6 0.4 1.0 0.9 1.0 1.4 0.9 0.9
0
5
10
15
20
25
Figure C. FDI outflows, 2005–2011(Billions of dollars)
Figure B. FDI inflows, 2005–2011(Billions of dollars)
Fig. FID �ows - South Asia
(Host) (Home)
Sri Lanka
Bangladesh
Pakistan
Iran, IslamicRepublic of
India India
Bangladesh
Sri Lanka
Pakistan
Iran, IslamicRepublic of
0 5 10 15 20 25 30 35 0 3 6 9 12 15
2011 2010 2011 2010
Figure A. FDI flows, top 5 host and home economies, 2010–2011(Billions of dollars)
World Investment Report 2012: Towards a New Generation of Investment Policies46
FDI inflows to South Asia have turned around. Inflows rose by 23 per cent to $39 billion in 2011 (2.6 per cent of global FDI flows) after a slide in 2009–2010 (figure B). The recovery derived mainly from the inflows of $32 billion to India, the dominant FDI recipient in South Asia. Inflows to the Islamic Republic of Iran and Pakistan, recipients of the second and third largest FDI flows, amounted to $4.2 billion and $1.3 billion (figure A). Bangladesh has also emerged as an important recipient, with inflows increasing to a record high of $1.1 billion.
In 2011, about 145 cross-border M&As and 1,045 greenfield FDI projects by foreign TNCs were recorded in South Asia (annex tables I.4 and I.9). Cross-border M&As rose by about 131 per cent in value, and the total reached $13 billion (tables B and C), surpassing the previous record set in 2008. The significant increase was driven mainly by a number of large transactions in extractive industries undertaken by acquirers from the European Union (EU), as well as from developing Asia. By contrast, cross-border M&A sales in manufacturing declined by about two thirds, to a level below $2 billion (table B). Sales in services amounted to $2 billion as well but were still much below the annual amounts during 2006–2009. Within manufacturing, the automotive industry ($1 billion) was the main target of investors, while in services, finance ($700 million) was the main target.
FDI outflows from South Asia picked up as well. In 2011, outflows from the region rose by 12 per cent to $15 billion, after a decline of three years. Outflows from India, the dominant source of FDI from the region, increased from $13.2 billion in 2010 to $14.8 billion in 2011 (figure A). However, Indian TNCs became less active in acquiring overseas assets. The amount of total cross-border M&A purchases decreased significantly in all three sectors: from $5.2 billion to $111 million in the primary sector, from $2.5 billion to $1.5 billion in manufacturing, and from $19.0 billion to $4.5 billion in services. The drop was compensated largely by a rise in overseas greenfield projects, particularly in extractive industries, metal and metal products, and business services (table D).
Indian companies in information technology services have long been active players in global
markets. In recent years, firms in service industries such as banking and food services have also become increasingly active in overseas markets, particularly in developed countries and especially in the United Kingdom. In early 2012, the State Bank of India started offering mortgages in the United Kingdom. India Hospitality Corp. acquired Adelie Food Holding, based in the United Kingdom, for $350 million, to capture growth opportunities in the Indian fast food market.
Cautiously optimistic prospects. Countries in the region face various challenges, which need to be tackled in order to build an attractive investment climate for enhancing development. Recent developments have highlighted new opportunities (box II.1). The growth of inflows so far appears likely to keep its momentum in 2012. As economic growth in India has slowed, however, concerns have arisen about short-term prospects for FDI inflows to South Asia. Whether countries in the region can overcome old challenges and grasp new opportunities to attract investment will depend to a large extent on Governments’ efforts to further open their economies and deepen regional economic integration.
CHAPTER II Regional Trends in FDI 47
Box II.1. Attracting investment for development: old challenges and new opportunities for South Asia
South Asian countries face different challenges in building a conducive business environment and an attractive investment climate, which are crucial for promoting economic development. These challenges include, for instance, stabilization in Afghanistan, security concerns in the Islamic Republic of Iran and Pakistan, and macroeconomic as well as political issues in India. Two issues stand out as major concerns: political risks and obstacles at the country level and weak integration processes at the regional level.
At the country level, high political risks and obstacles have been an important factor deterring FDI inflows. Countries in the region rank high in the country risk guides of political-risk assessment services, and political restrictions on both FDI and business links between countries in the region have long existed. This has deterred FDI inflows and negatively affected the countries’ FDI performance.
However, recent developments have highlighted new opportunities. For instance, the political relationship between India and Pakistan, the two major economies on the subcontinent, has been moving towards greater cooperation, with Pakistan granting India most-favoured-nation status in November 2011 and India recently announcing that it will allow FDI from Pakistan. In Afghanistan, some FDI has started to flow into extractive industries.
At the regional level, progress in economic integration (with the South Asian Association for Regional Cooperation as the key architect) has been slow, and the trade barriers between neighbouring countries in the region are among the highest in the world. South Asia is perhaps one of the least integrated developing regions: intraregional trade accounts for about 2 per cent of total gross domestic product (GDP), compared with more than 20 per cent in East Asia. In addition, investment issues have not yet been included in the regional integration process. As a result, the region has not been able to realize its potential for attracting FDI inflows, especially in promoting intraregional FDI flows. In 2011, intraregional greenfield investment accounted for merely 3 per cent of the regional total, compared with 27 per cent in East and South-East Asia.
Nevertheless, high economic growth in major economies in the subregion has created a momentum for regional integration in recent years, and South Asian countries have increasingly realized that regional integration can help them improve the climate for investment and business. The inclusion of an investment agenda in the regional integration process and in particular the creation of a regional investment area can play an important role in this regard.
Source: UNCTAD and UNESCAP.

World Investment Report 2012: Towards a New Generation of Investment Policies48
4. West Asia
Table B. Cross-border M&As by industry, 2010–2011(Millions of dollars)
Sector/industry Sales Purchases2010 2011 2010 2011
Total 4 887 9 713 - 15 278 6 136Primary 170 2 730 1 484 37
Mining, quarrying and petroleum 170 2 682 1 484 37Manufacturing 2 416 665 18 780
Wood and wood products 10 37 16 -Chemicals and chemical products 19 180 - 19 - 89Metals and metal products 410 174 - - 2Machinery and equipment - 310 - 3
Services 2 301 6 317 - 16 780 5 319Electricity, gas and water - 59 555 400 190Transport, storage and communications 100 338 - 10 721 - 2 568Finance 1 611 4 128 - 4 163 7 954Business services 172 895 281 314
Table C. Cross-border M&As by region/country, 2010–2011(Millions of dollars)
Region/country Sales Purchases2010 2011 2010 2011
World 4 887 9 713 - 15 278 6 136Developed economies 2 257 8 222 - 2 555 2 599
European Union 1 472 9 412 - 683 5 083United States 112 - 1 579 - 2 333 - 1 110Japan 343 33 - -Other developed countries 331 356 461 - 1 374
Developing economies 2 062 1 187 - 12 724 3 420Africa 965 - - 10 653 464East and South-East Asia 127 253 - 2 320 1 758South Asia 898 - 177 133West Asia 72 916 72 916Latin America and the Caribbean - 18 - 147
Transition economies 21 5 - 117
Table D. Greenfield FDI projects by industry, 2010–2011(Millions of dollars)
Sector/industry West Asia as destination West Asia as investors2010 2011 2010 2011
Total 60 011 69 151 37 190 44 194Primary 1 631 915 - 503
Mining, quarrying and petroleum 1 631 915 - 503Manufacturing 23 395 39 640 7 538 19 444
Food, beverages and tobacco 1 443 3 783 1 110 2 414Coke, petroleum and nuclear fuel 1 165 4 472 2 122 7 633Chemicals and chemical products 8 977 13 877 1 771 3 372Metals and metal products 3 155 8 260 737 3 088
Services 34 985 28 595 29 652 24 247Electricity, gas and water 6 004 6 744 570 2 611Construction 11 231 6 620 13 630 12 603Hotels and restaurants 5 431 4 686 2 921 1 920Business services 3 976 3 199 4 805 921
Table E. Greenfield FDI projects by region/country, 2010–2011(Millions of dollars)
Partner region/economy West Asia as destination West Asia as investors2010 2011 2010 2011
World 60 011 69 151 37 190 44 194Developed economies 36 532 38 990 3 769 9 687
European Union 23 370 14 911 3 454 7 481United States 8 219 18 121 123 1 937Japan 1 162 2 896 - -Other developed countries 3 782 3 062 192 269
Developing economies 21 726 29 466 28 313 33 371Africa 2 517 150 9 897 7 038East and South-East Asia 2 541 5 930 2 910 3 965South Asia 3 752 5 672 2 266 4 093West Asia 12 403 17 535 12 403 17 535Latin America and the Caribbean 513 178 836 699
Transition economies 1 753 695 5 108 1 135
Table A. Distribution of FDI flows among economies, by range,a 2011
Range Inflows Outflows
Above $10 billion
Saudi Arabia, Turkey ..
$5.0 to $9.9 billion
United Arab Emirates Kuwait, Qatar
$1.0 to $4.9 billion
Lebanon, Iraq, Jordan, Syrian Arab Republic
Saudi Arabia, Turkey, United Arab Emirates
Below $1.0 billion
Oman, Bahrain, Kuwait, Palestinian Territory, Qatar, Yemen
Lebanon, Bahrain, Oman, Iraq, Yemen, Jordan, Syrian Arab Republic, Palestinian Territory
a Economies are listed according to the magnitude of their FDI flows.Fig. B - West Asia
FDI in�ows
0
10
20
30
40
50
60
70
80
90
100
2005 2006 2007 2008 2009 2010 2011
Fig. C - West AsiaFDI out�ows
0
10
20
30
40
50
2005 2006 2007 2008 2009 2010 2011
Other West Asia Turkey Gulf Cooperation Council (GCC)
Other West Asia Turkey Gulf Cooperation Council (GCC)
Share in world total
4.5 4.6 4.0 5.1 5.5 4.4 3.2 1.4 1.6 1.5 1.9 1.5 1.1 1.5
Figure C. FDI outflows, 2005–2011(Billions of dollars)
Figure B. FDI inflows, 2005–2011(Billions of dollars)
Fig. FID �ows - West Asia
(Host) (Home)
0 5 10 15 20 25 30
Iraq
Lebanon
United Arab
Emirates
Turkey
Saudi Arabia
0 1 2 3 4 5 6 7 8 9 10
United Arab
Emirates
Turkey
Saudi Arabia
Qatar
Kuwait
2011 2010 2011 2010
Figure A. FDI flows, top 5 host and home economies, 2010–2011(Billions of dollars)

CHAPTER II Regional Trends in FDI 49
Inflows to West Asia declined for a third year. They decreased by 16 per cent to $49 billion in 2011, affected by both the continuing political instability and the deterioration of global economic prospects in the second half of 2011. The level is the lowest since 2005 – when FDI flows stood at about $44 billion – and far below the record high of about $92 billion registered in 2008 (figure B).
Gulf Cooperation Council (GCC) countries are still recovering from the suspension or cancellation of large-scale projects in previous years. They registered a drop of 35 per cent in FDI inflows, which brought their share in the region’s total from 69 per cent in 2010 to 53 per cent in 2011. Saudi Arabia – the region’s biggest recipient – saw a 42 per cent fall in 2011 to $16 billion, which largely explains the overall decline. FDI flows to Oman and Qatar also decreased – reaching negative values in the latter – but those to Bahrain, Kuwait and the United Arab Emirates rebounded from relatively low values (figure A and annex table I.1).
Some of the big and expensive projects that had prospered in these countries during the pre-crisis period had to be suspended or cancelled when project finance dried up in the wake of the global financial crisis. After a period of calm and consolidation, projects started slowly coming back on line in 2010 but soon faced delays caused by the Arab uprising across the region during 2011, and by new uncertainties about global economic prospects. Some big projects with strong sponsors have managed to secure financing, sometimes with greater use of export credit agencies, in particular from Japan and the Republic of Korea, and highly liquid regional bank lenders.8
As of October 2011, the cancelled or suspended construction projects in the Middle East and North African market were estimated at $1.74 trillion, with $958 billion in the United Arab Emirates alone and $354 billion in Saudi Arabia.9 Construction was one of the most important areas for investment to have emerged in the last oil boom, and the pace of its activity is among the key indicators of investment behaviour in housing, tourism, infrastructure, refineries, petrochemicals and real estate, where foreign investment prospered during the boom years.
Strong recovery of FDI into Turkey. Turkey stood as an exception to regional trends, with inflows registering a 76 per cent increase to $16 billion (figure A), maintaining the country’s position as the region’s second largest FDI recipient and increasing its share in the region’s total from 16 to 33 per cent. The increase in inflows was mainly the result of a more than three-fold increase in cross-border M&A sales (annex table I.3), with two big deals making up most of the total.10 In addition, Turkey’s FDI promotion policy has been shifting towards a more sector-specific approach, aiming directly at high value added, high-tech and export-oriented projects. Investments in automotive and petrochemical industries have been designated primary objectives by the Investment Support and Promotion Agency, and the mining sector will soon be added as well.11
Political and social unrest has halted FDI to non-GCC Arab countries. Flows to this group of countries – which represented 14 per cent of the region’s total – declined by 26 per cent in 2011 to $7 billion. Spreading political and social unrest has halted FDI inflows in the Syrian Arab Republic and Yemen. Flows to Lebanon were affected by the slowdown in the real estate sector – the most important recipient of FDI – as a consequence of adverse spillovers of both the global financial crisis and the regional unrest.
Increased oil revenues helped boost FDI outflows. FDI outflows from West Asia rebounded by 54 per cent in 2011 after bottoming out at a five-year low in 2010 (figure C). The rise in oil prices since the end of 2010 made more funds available for outward FDI from the GCC countries. In addition to these countries – the region’s main outward-investing economies – Turkey registered a 68 per cent increase in outward FDI flows. This is reflected in the recovery of both cross-border M&A purchases and greenfield projects abroad by Turkish investors, with a strong shift of greenfield FDI projects from developed and transition economies to neighbouring developing regions and countries.
FDI prospects are still negative for inward FDI to the region. UNCTAD projects that FDI inflows will continue declining in 2012, judging by preliminary data on cross-border M&A sales and greenfield investment for the first five months of 2012, as
World Investment Report 2012: Towards a New Generation of Investment Policies50
uncertainties at the global and regional levels are likely to cause foreign investors to remain cautious about their investment plans in the region.
In the longer term, however, the concentration of oil wealth in the region and the strategic need to
Box II.2. Economic diversification and FDI in the GCC countries
Economic diversification has recently taken high political priority in West Asia, as the lack of job prospects for a rapidly growing, educated and young population was a key trigger of political unrest. The oil-rich countries saw in the surge of oil prices in the early 2000s an opportunity for change. In 2001, the six GCC members signed an economic agreement aiming to boost their diversification efforts by encouraging the private sector, including foreign investors, to play a more active role and implementing liberalization measures to this end.
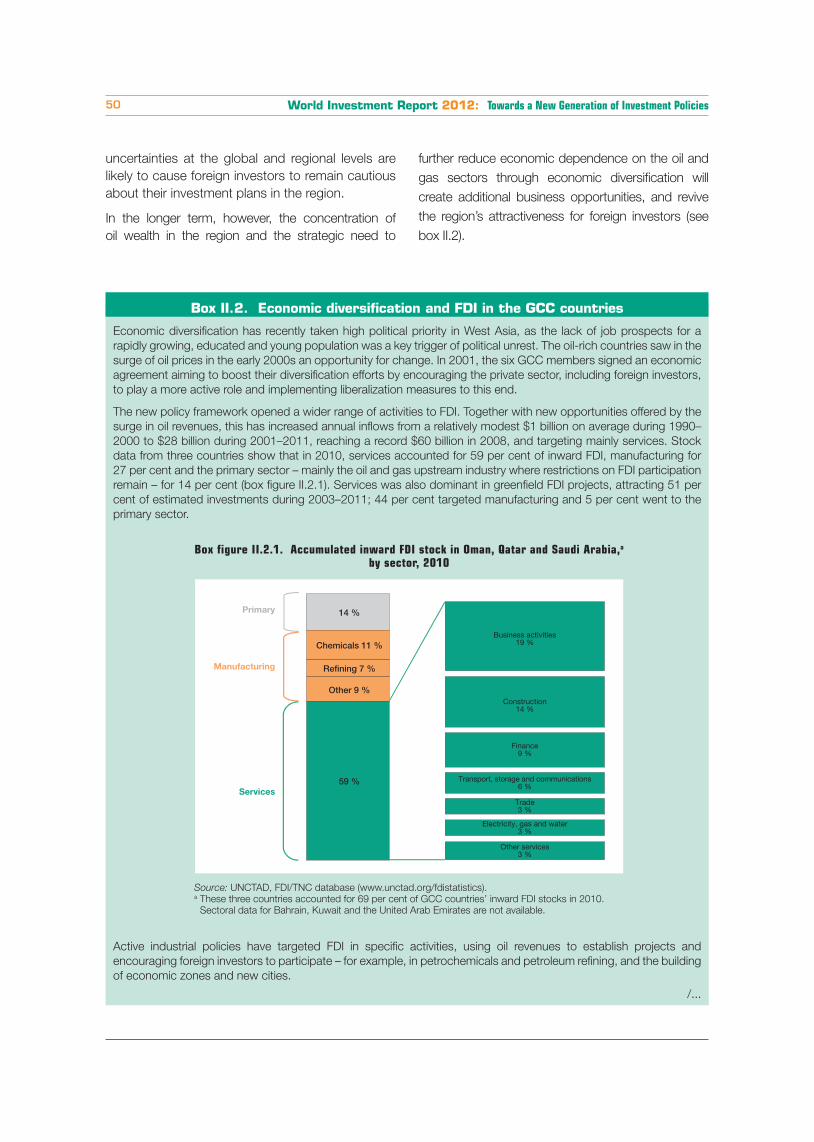
The new policy framework opened a wider range of activities to FDI. Together with new opportunities offered by the surge in oil revenues, this has increased annual inflows from a relatively modest $1 billion on average during 1990–2000 to $28 billion during 2001–2011, reaching a record $60 billion in 2008, and targeting mainly services. Stock data from three countries show that in 2010, services accounted for 59 per cent of inward FDI, manufacturing for 27 per cent and the primary sector – mainly the oil and gas upstream industry where restrictions on FDI participation remain – for 14 per cent (box figure II.2.1). Services was also dominant in greenfield FDI projects, attracting 51 per cent of estimated investments during 2003–2011; 44 per cent targeted manufacturing and 5 per cent went to the primary sector.
Box figure II.2.1. Accumulated inward FDI stock in Oman, Qatar and Saudi Arabia,a
by sector, 2010
Source: UNCTAD, FDI/TNC database (www.unctad.org/fdistatistics).a These three countries accounted for 69 per cent of GCC countries’ inward FDI stocks in 2010.
Sectoral data for Bahrain, Kuwait and the United Arab Emirates are not available.
Active industrial policies have targeted FDI in specific activities, using oil revenues to establish projects and encouraging foreign investors to participate – for example, in petrochemicals and petroleum refining, and the building of economic zones and new cities.
/...
further reduce economic dependence on the oil and gas sectors through economic diversification will create additional business opportunities, and revive the region’s attractiveness for foreign investors (see box II.2).
Re�ning 7 %
Other 9 %
14 %
Chemicals 11 %
Primary
Manufacturing
Services59 %
Business activities19 %
Construction14 %
Finance9 %
Trade3 %
Electricity, gas and water3 %
Other services3 %
Transport, storage and communications6 %
CHAPTER II Regional Trends in FDI 51
Box II.2. Economic diversification and FDI in the GCC countries (concluded)
The soaring oil prices and increasing refining margins in the 2000s encouraged Gulf countries to establish refinery/petrochemical complexes to produce products with higher value added. They also opened the door wider to international oil companies, as providers of technologies and market experience. Several projects have been built or are under way, through joint ventures or non-equity agreements with foreign TNCs. Several are hosted in Saudi Arabia, such as Petro Rabigh (with Sumitomo Chemical (Japan)), Al Jubail (with Total (France)), and Fujian (with ExxonMobil (United States) and Sinopec (China)), among others. Similar projects also took place in the United Arab Emirates, Qatar and Oman.
Building economic zones and cities has generally consisted of providing advanced information and communications technology, infrastructure and services to attract leading tenants to help establish new, globally competitive industries, especially service-based ones. More than 55 such cities or zones have been established or are under way, generally targeting knowledge-intensive industries.
GCC countries clearly experienced higher growth in their non-oil sectors during the 2000s (IMF, 2011), and the shift in their FDI policy allowed foreign direct investors to participate. Progress in equal treatment of GCC-country citizens – in freedom of movement, work, residence, economic engagement, capital movement and real estate ownership – has spurred intra-GCC FDI, which has helped develop services activities.
Despite this progress, hydrocarbons still dominate real GDP and export revenues, and the expansion of the non-oil sectors has not meant a decline in dependence on oil.a High growth rates in non-oil activities have created relatively few job opportunities for national workforce to assuage the high unemployment rates and reliance on government posts.b This might indicate a mismatch between career aspirations and available opportunities, on the one hand, and between the skills required by the private sector and those available in the workforce, on the other. This introduces the risk of the consolidation of a dual system, where modern enclaves with expatriate management and workforces are disconnected from the skills of the national workforce which relies mostly on government jobs.
GCC countries face common challenges. The scale of diversification plans will require both private and public funding, as well as cooperation and coordination between public and private sectors, which will continue to provide investment opportunities for TNCs.
Source: UNCTAD.a Oil revenues represented 60–88 per cent on average of government revenues during 2005–2009, and its share in export
revenues was 76–95 per cent in 2008, except in the United Arab Emirates, where it was 43 per cent (Samba, 2010).b In 2008, national unemployment was estimated at close to 13 per cent in Saudi Arabia, 14 per cent in the United Arab
Emirates and 15 per cent in both Bahrain and Oman. The majority of those employed worked in government; 88 per cent of nationals in Qatar, 86 per cent in Kuwait, 72 per cent in Saudi Arabia and 47 per cent in Oman. In 2007–2008, the share of migrants in total employment was estimated at 74 per cent in Bahrain, 77 per cent in Oman, 92 per cent in Qatar and 87 per cent in Saudi Arabia (Baldwin-Edwards, 2011).
World Investment Report 2012: Towards a New Generation of Investment Policies52
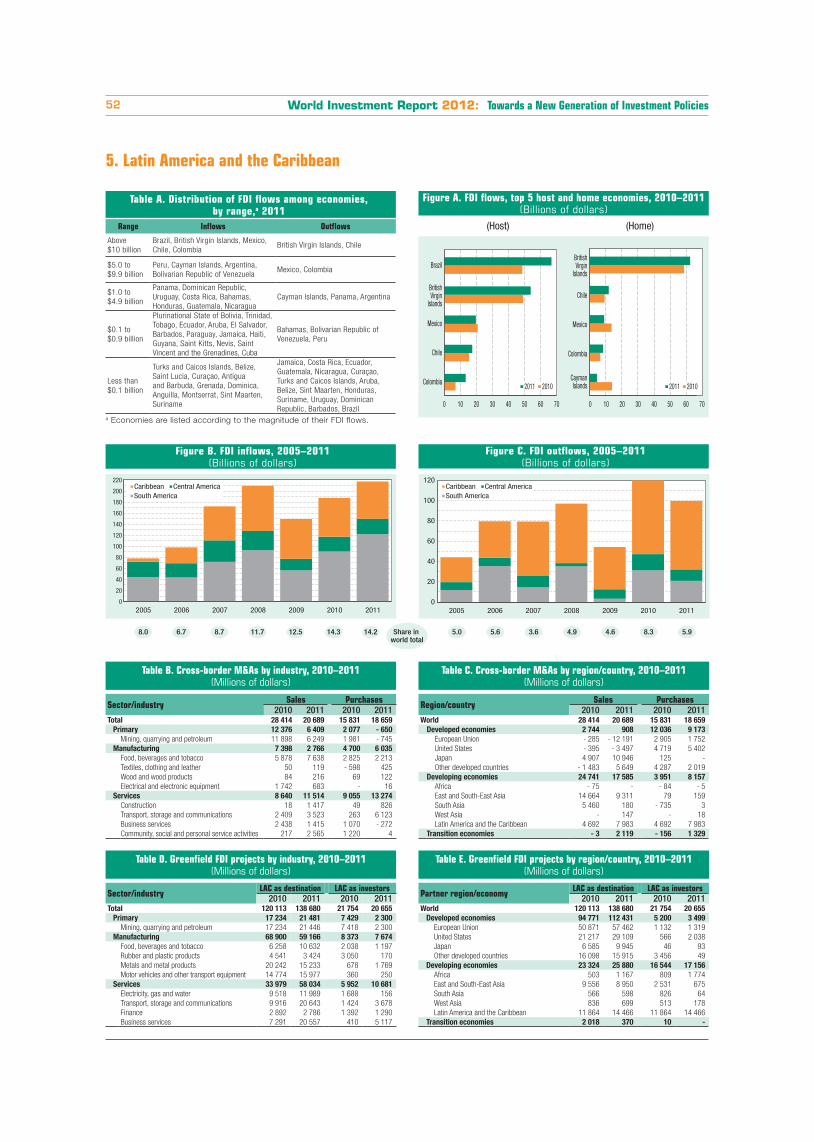
5. Latin America and the Caribbean
Table B. Cross-border M&As by industry, 2010–2011(Millions of dollars)
Sector/industry Sales Purchases2010 2011 2010 2011
Total 28 414 20 689 15 831 18 659Primary 12 376 6 409 2 077 - 650
Mining, quarrying and petroleum 11 898 6 249 1 981 - 745Manufacturing 7 398 2 766 4 700 6 035
Food, beverages and tobacco 5 878 7 638 2 825 2 213Textiles, clothing and leather 50 119 - 598 425Wood and wood products 84 216 69 122Electrical and electronic equipment 1 742 683 - 16
Services 8 640 11 514 9 055 13 274Construction 18 1 417 49 826Transport, storage and communications 2 409 3 523 263 6 123Business services 2 438 1 415 1 070 - 272Community, social and personal service activities 217 2 565 1 220 4
Table C. Cross-border M&As by region/country, 2010–2011(Millions of dollars)
Region/country Sales Purchases2010 2011 2010 2011
World 28 414 20 689 15 831 18 659Developed economies 2 744 908 12 036 9 173
European Union - 285 - 12 191 2 905 1 752United States - 395 - 3 497 4 719 5 402Japan 4 907 10 946 125 -Other developed countries - 1 483 5 649 4 287 2 019
Developing economies 24 741 17 585 3 951 8 157Africa - 75 - - 84 - 5East and South-East Asia 14 664 9 311 79 159South Asia 5 460 180 - 735 3West Asia - 147 - 18Latin America and the Caribbean 4 692 7 983 4 692 7 983
Transition economies - 3 2 119 - 156 1 329
Table D. Greenfield FDI projects by industry, 2010–2011(Millions of dollars)
Sector/industry LAC as destination LAC as investors2010 2011 2010 2011
Total 120 113 138 680 21 754 20 655Primary 17 234 21 481 7 429 2 300
Mining, quarrying and petroleum 17 234 21 446 7 418 2 300Manufacturing 68 900 59 166 8 373 7 674
Food, beverages and tobacco 6 258 10 632 2 038 1 197Rubber and plastic products 4 541 3 424 3 050 170Metals and metal products 20 242 15 233 678 1 769Motor vehicles and other transport equipment 14 774 15 977 360 250
Services 33 979 58 034 5 952 10 681Electricity, gas and water 9 518 11 989 1 688 156Transport, storage and communications 9 916 20 643 1 424 3 678Finance 2 892 2 786 1 392 1 290Business services 7 291 20 557 410 5 117
Table E. Greenfield FDI projects by region/country, 2010–2011(Millions of dollars)
Partner region/economy LAC as destination LAC as investors2010 2011 2010 2011
World 120 113 138 680 21 754 20 655Developed economies 94 771 112 431 5 200 3 499
European Union 50 871 57 462 1 132 1 319United States 21 217 29 109 566 2 038Japan 6 585 9 945 46 93Other developed countries 16 098 15 915 3 456 49
Developing economies 23 324 25 880 16 544 17 156Africa 503 1 167 809 1 774East and South-East Asia 9 556 8 950 2 531 675South Asia 566 598 826 64West Asia 836 699 513 178Latin America and the Caribbean 11 864 14 466 11 864 14 466
Transition economies 2 018 370 10 -
Fig. B - LACFDI in�ows
Fig. C - LAC FDI out�ows
0
20
40
60
80
100
120
140
160
180
200
220
2005 2006 2007 2008 2009 2010 2011 0
20
40
60
80
100
120
2005 2006 2007 2008 2009 2010 2011
Caribbean Central America South America
Caribbean Central America South America
Share in world total
8.0 6.7 8.7 11.7 12.5 14.3 14.2 5.0 5.6 3.6 4.9 4.6 8.3 5.9
Figure C. FDI outflows, 2005–2011(Billions of dollars)
Figure B. FDI inflows, 2005–2011(Billions of dollars)
Fig. FID �ows - LAC
(Host) (Home)
0 10 20 30 40 50 60 70
Colombia
Chile
Mexico
British Virgin
Islands
Brazil
0 10 20 30 40 50 60 70
Cayman Islands
Colombia
Mexico
Chile
British Virgin
Islands
2011 2010 2011 2010
Figure A. FDI flows, top 5 host and home economies, 2010–2011(Billions of dollars)
Table A. Distribution of FDI flows among economies, by range,a 2011
Range Inflows Outflows
Above $10 billion
Brazil, British Virgin Islands, Mexico, Chile, Colombia
British Virgin Islands, Chile
$5.0 to $9.9 billion
Peru, Cayman Islands, Argentina, Bolivarian Republic of Venezuela
Mexico, Colombia
$1.0 to $4.9 billion
Panama, Dominican Republic, Uruguay, Costa Rica, Bahamas, Honduras, Guatemala, Nicaragua
Cayman Islands, Panama, Argentina
$0.1 to $0.9 billion
Plurinational State of Bolivia, Trinidad, Tobago, Ecuador, Aruba, El Salvador, Barbados, Paraguay, Jamaica, Haiti, Guyana, Saint Kitts, Nevis, Saint Vincent and the Grenadines, Cuba
Bahamas, Bolivarian Republic of Venezuela, Peru
Less than $0.1 billion
Turks and Caicos Islands, Belize, Saint Lucia, Curaçao, Antigua and Barbuda, Grenada, Dominica, Anguilla, Montserrat, Sint Maarten, Suriname
Jamaica, Costa Rica, Ecuador, Guatemala, Nicaragua, Curaçao, Turks and Caicos Islands, Aruba, Belize, Sint Maarten, Honduras, Suriname, Uruguay, Dominican Republic, Barbados, Brazil
a Economies are listed according to the magnitude of their FDI flows.
CHAPTER II Regional Trends in FDI 53
South America is the main driver of FDI growth to the region. FDI flows to Latin America and the Caribbean increased by 16 per cent to a record $217 billion in 2011, driven mainly by increasing inflows to South America (up 34 per cent). Inflows to Central America and the Caribbean, excluding offshore financial centres, increased by 4 per cent, while those to the offshore financial centres registered a 4 per cent decrease.
The high growth of FDI in South America was mainly due to its expanding consumer markets, high growth rates and natural-resource endowment. In 2011 Brazil remained by far the largest FDI target, with inflows increasing by 37 per cent to $67 billion – 55 per cent of the total in South America and 31 per cent of the total in the region. The size of Brazil’s domestic market explains its attractiveness, as does its strategic position in South America, which brings within easy reach other emerging and fast-growing markets, such as Argentina, Chile, Colombia and Peru.
Another important driver for FDI growth to South America has been the relatively high rate of return on investments in the region. Since 2003, South American countries have witnessed significant growth of income on FDI: from an annual average of $11 billion during 1994–2002, equivalent to 0.84 per cent of the subregion’s GDP, to an annual average of $60 billion during 2003–2011, equivalent to 2.44 per cent of GDP. In 2011, FDI income increased another 17 per cent, reaching $95 billion.12
The rise in FDI income during the 2000s, in parallel with the increase in FDI stock (a nine-fold increase between 1994 and 2011) and share in GDP (from 11 to 28 per cent share in current GDP), was in part driven by increased investment in extractive industries, which have enjoyed high profitability and have attracted a significant part of FDI inflows since the commodity price boom. For example, in Chile this industry accounted for 43 per cent of accumulated FDI inflows during 2006–2010. Its share in Brazil’s FDI stock grew from 3 per cent at the end of 2005 to 15 per cent at the end of 2010. In Peru its share grew from 14 per cent at the end of 2003 to 26 per cent at the end of 2010, while in Colombia its share jumped from 17 per cent in 1994–2002 to 54 per cent in 2003–2011, attracting about two thirds of FDI inflows in 2009–2011.13 The rates of return on inward FDI14 in the
extractive industry in Argentina and Chile were 30 per cent and 20 per cent, respectively, in 2010, while those on total inward FDI were 11 per cent and 14 per cent, respectively.15 The importance of FDI income is evident in the high share of reinvested earnings, which represented 45 per cent of FDI flows to South American countries other than Brazil16 in 2003–2011, compared with 11 per cent in 1994–2002. Although high and rapidly growing FDI profits boost investment in productive capacity in host countries, they also entail risks, in that cash flows are available for repatriation or for short-term investment in local markets.
Offshore financial centres have surged as significant destinations for FDI since the beginning of the global financial crisis in 2007. After reaching a record $77 billion in 2008, FDI flows declined in 2009 by 9 per cent, after the OECD undertook initiatives to tackle banking secrecy and tax evasion through offshore financial centres. In 2011, flows decreased by 4 per cent to $67 billion, equivalent to 31 per cent for the region’s total. However, they remained much higher than their pre-crisis level ($21 billion annual average in 2004–2006).
In 2011, inflows to the subregions of Central America and the Caribbean, excluding offshore financial centres, increased by 4 per cent to $29 billion – 13 per cent of total flows to Latin America and the Caribbean. A relatively more positive outlook for the United States, with which these countries have deep economic ties, offset the impact of the weakening global economy on FDI. Inflows to Mexico, which accounted for 69 per cent of total inflows to these countries, decreased by 6 per cent because of an 85 per cent drop in cross-border M&A sales, from $8 billion in 2010 to $1.2 billion in 2011. Nevertheless, FDI in Mexico’s automotive and auto-component industry – an industry that is almost entirely foreign owned – was thriving. International auto companies continued to make new investments, especially in small and fuel-efficient vehicles and components. Investment by original equipment manufacturers has brought with it small and medium-sized firms in the auto parts industry. Investments for new automobile projects in Mexico from 2006 to 2012 are estimated to total $15 billion. Nissan, Ford and Honda have announced plans to invest $2 billion, $1.5 billion and $800 million.17

World Investment Report 2012: Towards a New Generation of Investment Policies54
A reconfiguration of investments is taking place in the region. Although traditional investors from Europe and North America increased their investment in greenfield FDI projects in Latin America and the Caribbean in 2011 (up 17 per cent) and remained by far the main actors in such projects (72 per cent of the total in 2011), they have also divested more assets than they have purchased in the region’s cross-border M&A market in the past three years. This changing pattern of FDI by traditional investors is occurring at the same time as the advance of TNCs from developing economies and Japan (table C). TNCs from Colombia, Mexico, China and India have been the most active investors from developing countries.
A retreat from the region by some major European financial institutions has been accelerating in 2012, as pressure to bolster their balance sheets grows – potentially leaving a gap to be filled by local or regional institutions looking to become international. For example, Banco Santander SA (Spain) announced in December 2011 an agreement to sell its Colombian unit to CorpBanca (Chile) for $1.2 billion, along with a 7.8 per cent stake in its Chilean unit.18 Earlier in the year Santander announced sales of stakes in other Latin American businesses, including its bank in Brazil and 51 per cent of its Latin American insurance arm. These moves, driven by the need to boost capital at home in order to meet more stringent requirements from European regulators, constitute a major reversal of this bank’s strategy of the 1990s, when its growing presence in the continent was seen as central to its global expansion plans. In a similar move driven by the same motives, ING (Netherlands) announced that it would sell its insurance and pensions businesses across much of Latin America to the Grupo de Inversiones Suramericana (Colombia), which will pay $3.85 billion for pension and investment units in a handful of countries, including Colombia.19
FDI outflows have become volatile. Outward FDI flows from Latin America and the Caribbean have become volatile since the global financial crisis. They decreased by 17 per cent in 2011, after a 121 per cent increase in 2010, which had followed a 44 per cent decline in 2009. This volatility is due to the growing importance of flows that are not
necessarily related to investment in productive activity abroad, as reflected by the high share of offshore financial centres in total FDI flows from the region, and the increasing repatriation of intracompany loans by Brazilian outward investors, which reached a record $21 billion in 2011.
The global financial crisis has accelerated the shift towards industrial policy in Argentina and Brazil. This shift began in the early 2000s, during the recession that hit the region in 1998–2002. The recession was perceived as a failure of the economic model of the 1990s to deliver economic growth and reduce poverty. As a consequence, a number of Latin American countries entered a new phase, marked by a review of the role of the State in the economy and rehabilitation of industrial policy, which is slowly returning after practical exclusion from the previous economic model.20 Some countries – Argentina in 2001, Mexico in 2002 and Brazil in 200321 – began announcing plans to promote specific industries and activities (Peres, 2011).22
More recently, the global economic crisis accelerated this shift towards industrial policy in Argentina and Brazil. Both countries implemented policies to support industries not only by fostering investment, innovation and foreign trade, but also by protecting the domestic market and local manufacturing – already weakened by the appreciation of local currencies23 – from the flood of cheap manufactured goods seeking to counter weak demand in the United States and Europe. Both countries want their local industries to capitalize on their domestic consumption boom and aim to establish a homegrown high-technology industry that will help them diversify their economies and move up the value chain.
Since the global economic crisis began, a number of measures adopted by Argentina and Brazil have reversed some of the unilateral trade liberalization measures implemented in the 1990s, in efforts to make local manufacturing more cost-effective and persuade producers to set up locally. These measures include higher tariff barriers, more stringent criteria for licenses and increased preference margins for domestic production in public procurement in the case of Brazil.24 In addition, Brazil increased the tax on manu-factured products (Imposto sobre Produtos
CHAPTER II Regional Trends in FDI 55
Industrializados) levied on certain national and imported vehicles by 30 percentage points, while granting a rate reduction equivalent to 30 percentage points to vehicles that have at least 65 per cent regional content (defined as that of Brazil, the Mercado Común del Sur (MERCOSUR) or Mexico) and that meet other requirements.25 Moreover, Brazil unveiled a new policy in August 2011. It included the replacement of the corporate payroll contribution to social security (20 per cent) by a 1.5 per cent tax on gross revenues for firms in labour-intensive sectors starting in December 2012, and the expansion of Banco Nacional do Desenvolvimento loan programmes. At the MERCOSUR level, members agreed in December 2011 to impose a 35 per cent tariff, the maximum allowed under WTO rules, on 100 additional goods, subject to MERCOSUR’s common tariff on imports from outside the bloc. The new tariffs will be imposed until December 2014. Capital goods, textiles and chemical imports are the likely targets.26
These policies may induce “barrier hopping” FDI into the region. Indeed, they seem to have had an impact on the strategy of TNCs in these countries. In Brazil, TNC automakers announced a flurry of investments into the auto sector at the end of 2011.For instance, among the new investments planned for Brazil or already under way, Chery (China) has begun construction of a $400 million plant that will produce 150,000 vehicles a year; Volkswagen has announced plans to invest $4.5 billion in the country until 2016; and the Renault-Nissan alliance will invest $1.5 billion to build a new Nissan plant in Rio de Janeiro state, where production is due to begin in 2014, and $200 million in its existing Curitiba site. Another Chinese group, JAC Motors, is planning to invest RMB 900 million for a plant with a capacity of 100,000 units, while BMW is also reportedly looking to establish its first factory in Latin America in Brazil.27 In addition, after being granted tax incentives, Foxconn (Taiwan Province of China) plans to build five additional factories in Brazil to help cater to demand for Apple iPads and other tablets, which together are expected to require an annual run rate of nearly 400 million units within five years.28 In Argentina, in a context of a boom in agriculture exports and the domestic auto market (with growth of about 30 per cent per year), the Government began in 2011 negotiating with
automakers and agriculture-machinery producers to source and produce locally. In addition, a number of TNCs announced new investments in the country.29
More recently, after declaring the achievement of self-sufficiency in hydrocarbons and their exploita-tion, industrialization, transportation and marketing to be of national public interest, the Government renationalized 51 per cent of Argentina’s largest oil company, YPF (see box III.4). The Government was prompted to retake control of the industry by Argentina’s first fuels deficit in 17 years.30 YPF has announced it will look for both local and interna-tional partners to finance exploration in the Vaca Muerta shale, which could hold the world’s third largest reserves of unconventional gas and oil.
Argentina and Brazil are revising their development strategies as they pursue more active policies for promoting industrialization and broader development goals. This revival of industrial policies is likely to have an impact on both FDI policy and FDI strategy. FDI policy is likely to depend increasingly on the industry in question and the role the Governments want to assign to FDI, which in turn will affect FDI strategy. While the era of across-the-board liberalization policies for FDI seems to be over, this change does not seem to be deterring FDI flows, which have boomed in Brazil in recent years and steadily increased in Argentina since the region resumed growth in 2003–2004.
Short-term prospects of FDI to Latin America and the Caribbean are muted. The region is likely to remain attractive to foreign direct investors given its natural resources and its relatively higher growth prospects at a time of overall global uncertainty. In addition, the shift towards a greater use of industrial policy may induce “barrier-hopping” FDI into the region, and appears to have already had an effect on firms’ investment plans. However, the uncertainty created at the global level by the European debt crisis is affecting the region’s short-term prospects and impacting on FDI, which is likely to register, at the best, a slight growth in 2012.
World Investment Report 2012: Towards a New Generation of Investment Policies56
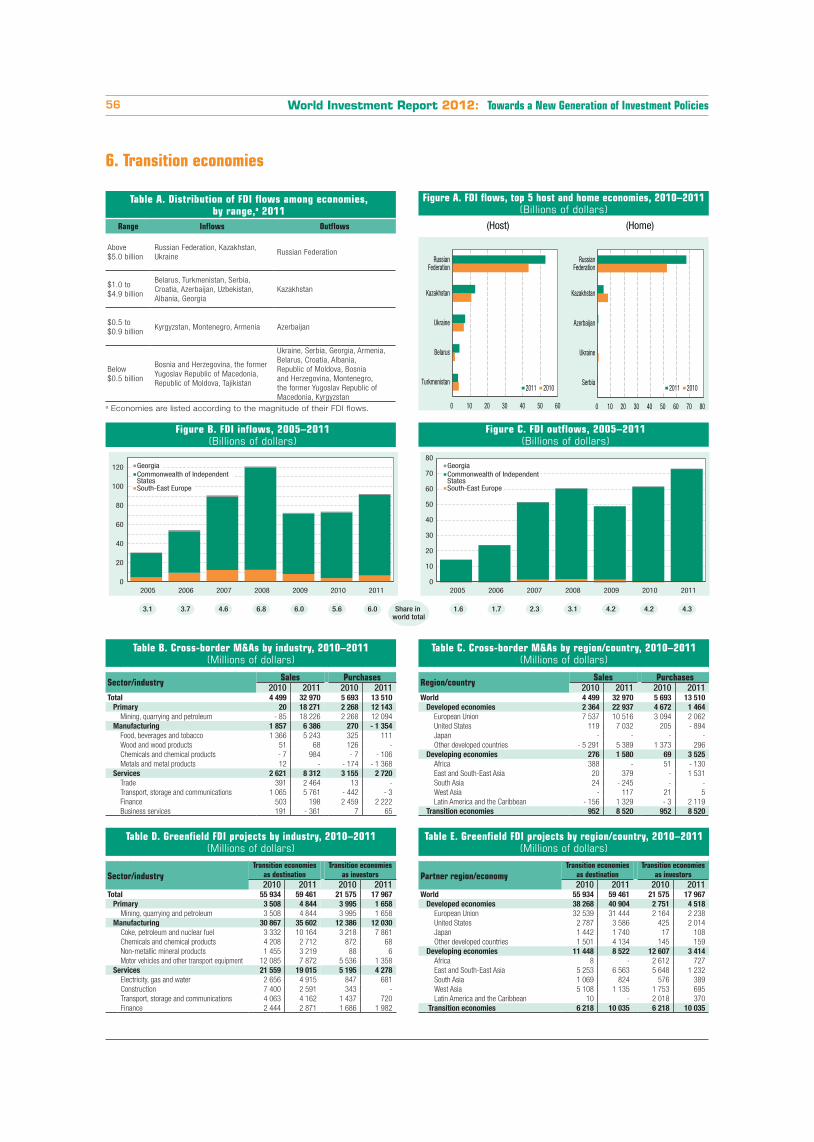
6. Transition economies
Table C. Cross-border M&As by region/country, 2010–2011(Millions of dollars)
Region/country Sales Purchases2010 2011 2010 2011
World 4 499 32 970 5 693 13 510Developed economies 2 364 22 937 4 672 1 464
European Union 7 537 10 516 3 094 2 062United States 119 7 032 205 - 894Japan - - - -Other developed countries - 5 291 5 389 1 373 296
Developing economies 276 1 580 69 3 525Africa 388 - 51 - 130East and South-East Asia 20 379 - 1 531South Asia 24 - 245 - -West Asia - 117 21 5Latin America and the Caribbean - 156 1 329 - 3 2 119
Transition economies 952 8 520 952 8 520
Table D. Greenfield FDI projects by industry, 2010–2011(Millions of dollars)
Sector/industryTransition economies
as destinationTransition economies
as investors2010 2011 2010 2011
Total 55 934 59 461 21 575 17 967Primary 3 508 4 844 3 995 1 658
Mining, quarrying and petroleum 3 508 4 844 3 995 1 658Manufacturing 30 867 35 602 12 386 12 030
Coke, petroleum and nuclear fuel 3 332 10 164 3 218 7 861Chemicals and chemical products 4 208 2 712 872 68Non-metallic mineral products 1 455 3 219 88 6Motor vehicles and other transport equipment 12 085 7 872 5 536 1 358
Services 21 559 19 015 5 195 4 278Electricity, gas and water 2 656 4 915 847 681Construction 7 400 2 591 343 -Transport, storage and communications 4 063 4 162 1 437 720Finance 2 444 2 871 1 686 1 982
Table E. Greenfield FDI projects by region/country, 2010–2011(Millions of dollars)
Partner region/economyTransition economies
as destinationTransition economies
as investors2010 2011 2010 2011
World 55 934 59 461 21 575 17 967Developed economies 38 268 40 904 2 751 4 518
European Union 32 539 31 444 2 164 2 238United States 2 787 3 586 425 2 014Japan 1 442 1 740 17 108Other developed countries 1 501 4 134 145 159
Developing economies 11 448 8 522 12 607 3 414Africa 8 - 2 612 727East and South-East Asia 5 253 6 563 5 648 1 232South Asia 1 069 824 576 389West Asia 5 108 1 135 1 753 695Latin America and the Caribbean 10 - 2 018 370
Transition economies 6 218 10 035 6 218 10 035
Table A. Distribution of FDI flows among economies, by range,a 2011
Range Inflows Outflows
Above $5.0 billion
Russian Federation, Kazakhstan, Ukraine
Russian Federation
$1.0 to $4.9 billion
Belarus, Turkmenistan, Serbia, Croatia, Azerbaijan, Uzbekistan, Albania, Georgia
Kazakhstan
$0.5 to $0.9 billion
Kyrgyzstan, Montenegro, Armenia Azerbaijan
Below $0.5 billion
Bosnia and Herzegovina, the former Yugoslav Republic of Macedonia, Republic of Moldova, Tajikistan
Ukraine, Serbia, Georgia, Armenia, Belarus, Croatia, Albania, Republic of Moldova, Bosnia and Herzegovina, Montenegro, the former Yugoslav Republic of Macedonia, Kyrgyzstan
a Economies are listed according to the magnitude of their FDI flows.Fig. B - TransitionFDI in�ows
0
20
40
60
80
100
120
2005 2006 2007 2008 2009 2010 2011
Fig. B - TransitionFDI out�ows
0
10
20
30
40
50
60
70
80
2005 2006 2007 2008 2009 2010 2011
Georgia Commonwealth of Independent States South-East Europe
Georgia Commonwealth of Independent States South-East Europe
Share in world total
3.1 3.7 4.6 6.8 6.0 5.6 6.0 1.6 1.7 2.3 3.1 4.2 4.2 4.3
Figure C. FDI outflows, 2005–2011(Billions of dollars)
Figure B. FDI inflows, 2005–2011(Billions of dollars)
Fig. FID �ows - Transition
(Host) (Home)
0 10 20 30 40 50 60
Turkmenistan
Belarus
Ukraine
Kazakhstan
Russian Federation
0 10 20 30 40 50 60 70 80
Serbia
Ukraine
Azerbaijan
Kazakhstan
Russian Federation
2011 2010 2011 2010
Figure A. FDI flows, top 5 host and home economies, 2010–2011(Billions of dollars)
Table B. Cross-border M&As by industry, 2010–2011(Millions of dollars)
Sector/industry Sales Purchases2010 2011 2010 2011
Total 4 499 32 970 5 693 13 510Primary 20 18 271 2 268 12 143
Mining, quarrying and petroleum - 85 18 226 2 268 12 094Manufacturing 1 857 6 386 270 - 1 354
Food, beverages and tobacco 1 366 5 243 325 111Wood and wood products 51 68 126 -Chemicals and chemical products - 7 984 - 7 - 106Metals and metal products 12 - - 174 - 1 368
Services 2 621 8 312 3 155 2 720Trade 391 2 464 13 -Transport, storage and communications 1 065 5 761 - 442 - 3Finance 503 198 2 459 2 222Business services 191 - 361 7 65
CHAPTER II Regional Trends in FDI 57
Recovery of FDI flows. FDI to economies in transition in South-East Europe, the CIS and Georgia31 recovered strongly in 2011, prompted by the dynamism of cross-border M&A deals, although greenfield investments are still the dominant form of entry. Inflows rose by 25 per cent, to $92 billion (figure B). In South-East Europe, manufacturing FDI increased, buoyed by competitive production costs and open access to EU markets, while in the CIS, resource-based economies benefited from continued natural-resource-seeking FDI. Compared with foreign portfolio flows, FDI flows were remarkably stable, underscoring their importance for development. Large countries continued to account for the lion’s share of inward FDI. Inflows remained concentrated in a few economies, with the top five destinations accounting for 87 per cent of the flows (figure A).
The Russian Federation saw FDI flows grow by 22 per cent, reaching $53 billion, the third highest level ever recorded. Foreign investors were motivated by the continued strong growth of the domestic market and affordable labour costs, coupled with productivity gains. They also continued to be attracted by high returns in energy and other natural-resource-related projects, as shown by the partnership deal between Exxon Mobil (United States) and the State-owned oil company Rosneft (Russian Federation) to develop the rich, untapped reserves of the Arctic zone.
Cross-border M&As were particularly dynamic. The FDI rebound was due mainly to a surge in the value of cross-border M&As, from $4.5 billion in 2010 to $33 billion in 2011 (tables B and C), driven by a number of large transactions. The takeover of Polyus Gold (Russian Federation) for $6.3 billion by the KazakhGold Group (Kazakhstan) was the largest. Although deals in energy, mining, oil and gas tend to attract the most media attention, the consumer market was also a target for cross-border M&As in 2011.32
TNCs from around the world invested in the region; “round-tripping” FDI was still high. Developed countries, mainly EU members, continued to account for the largest share of FDI projects (both cross-border M&As and greenfield investments), though projects from developing and transition economies gained importance. Overall, FDI flows
between transition countries remained relatively low, accounting for an average of 10 per cent of the region’s total FDI projects, although they increased 20 per cent since 2010, mainly due to intraregional M&As. A large part of FDI flows to the transition economies continued to come from offshore centres, as “round-tripping” or transhipment transactions. As a result, Cyprus and the British Virgin Islands were the largest two investors in the region in 2011, representing almost one third of total inflows.
FDI in services remained sluggish but new impetus may come from the WTO accession of the Russian Federation. In 2011, FDI projects in transition economies rose in all three sectors of production (tables B and D). Compared with the pre-crisis level (2005–2007), the value of FDI in the primary sector increased almost four-fold; FDI in manufacturing rose by 28 per cent while FDI in services remained lower. Over the long run, however, FDI in services is expected to rise because of the accession of the Russian Federation to the WTO (box II.3). Through that accession the country has further committed to integrate itself into the global economic system, which will boost foreign investors’ confidence and improve the overall investment environment. The services sector may well replace the manufacturing sector as the engine of FDI growth, while in the manufacturing sector, domestic and foreign investors will most likely consolidate as the landscape becomes more competitive. In the primary sector, the impact on FDI will vary by industry.
Record-high FDI outflows, and not only by natural-resource-based TNCs. FDI outflows from the transition economies, mainly from the Russian Federation, reached an all-time record level in 2011 (figure C). Natural-resource-based TNCs in transition economies, supported by high commodity prices and higher stock market valuations, continued their expansion into emerging markets rich in natural resources. For example, TNK-BP (Russian Federation) entered the Brazilian oil industry with a $1 billion acquisition of a 45 per cent stake in 21 oil blocks located in the Solimoes Basin. At the same time, the company base of outward FDI continued widening as other firms from various industries also invested. For example, Sberbank – the largest Russian bank and the third largest European one
World Investment Report 2012: Towards a New Generation of Investment Policies58
Box II.3. The Russian Federation’s accession to the WTO: implications for inward FDI flows
On 16 December 2011, at its Ministerial meeting in Geneva, the WTO formally approved the terms of the Russian Federation’s entry to the WTO.a Fulfilling the WTO obligations will involve substantial trade and investment liberalization measures. These measures will have implications for FDI flows to the Russian Federation in all three sectors, which will be felt even more strongly after the transition to full compliance with WTO standards.
• The services sector. This sector accounts for more than 40 per cent of GDP in the Russian Federation. Liberalization will gradually open the country’s services market to foreign investors. The Russian Federation has undertaken special obligations in 11 services industries and 116 sub-industries. For example:- In banking, foreign banks may now establish majority-owned affiliates, and the threshold of foreign participation
has been raised to 50 per cent (with the exception of foreign investment in privatized banks, in which greater ownership is possible).b However, even though the country has allowed the establishment of branches of international banks, they must be registered as Russian entities, have their own capital and be subject to supervision by the Russian central bank.
- In insurance, the share of foreign ownership has been expanded to 100 per cent in non-life insurance companies and to 50 per cent in the life insurance market (up from 15 per cent in both).
- In trade, 100 per cent foreign firms are allowed to participate in both the wholesale and the retail segments. - In business services, the country has committed to market access and national treatment for a wide variety of
professions. Foreign companies have been permitted to operate as 100 per cent foreign-owned entities.- In telecommunications, restrictions of foreign participation to 49 per cent will be eliminated within four years after
the WTO accession. - In distribution services, 100 per cent foreign-owned companies have been allowed to engage in wholesale, retail
and franchise activities, as well as express delivery services, including the distribution of pharmaceuticals.
• The manufacturing sector. Most manufacturing industries had been largely open to foreign investors and had already attracted a significant amount of FDI, so accession to the WTO may not immediately have substantial FDI-generating effects. Indeed, the reduction of import restrictions and the elimination of trade-related investment measures in industries such as automobiles and food industries may reduce incentives to FDI by eroding the possibility of “barrier-hopping”. Nevertheless, over time, freer access to imported inputs could help improve the cost-quality conditions of manufacturing and increase the attractiveness of the economy as a site for efficiency-oriented manufacturing FDI. Some industries that are not competitive, such as mechanical engineering, may lose FDI potential as they undergo downsizing in the aftermath of WTO accession and the end of their current protection. Industries such as ferrous and non-ferrous metallurgy and chemical products may benefit from WTO accession and better access to foreign markets, but only in the long run. Metallurgy and chemicals are already competitive in world markets and operate without major subsidies.
• The primary sector. WTO accession may benefit FDI in the mining sector but hinder FDI in agriculture. Foreign investors may also be attracted to export-oriented oil and gas production (within the limits of the strategic sectors law) because these activities will benefit from the liberalization of markets and elimination of export quotas. Business opportunities are expected to be more scarce in agriculture, in which output may even contract. The Institute of Economic Forecasting of the Russian Academy of Sciences estimates that the country will lose $4 billion a year in agricultural production. This estimate is based on the assumption that local production will not be able to improve productivity and competitiveness. If local producers react by modernizing successfully, the losses may be more moderate. Competitive foreign producers would still find niche markets in food and beverages.
Upon accession, pursuant to the WTO Agreement on Trade-Related Investment Measures, the Russian Federation will be prohibited from imposing certain conditions on enterprises operating in the country, including those with foreign investments.
Source: UNCTAD, based on Kostyunina (2012).a The Russian Federation will have until mid-July 2013 to ratify the accession agreement and will become a member
30 days after it notifies the WTO of its ratification.b In addition, foreign affiliates in banking will be allowed to provide a variety of services, including asset management
services, credit cards and other types of payments; to own and trade all kinds of securities available in the country, including government securities; and to participate in the privatization of State-owned enterprises.
CHAPTER II Regional Trends in FDI 59
in terms of market capitalization – was pursuing major acquisitions abroad (e.g. in 2011 the bank completed the acquisition of Volksbank (Austria) affiliates in four transition economies33 and four new EU member countries34). As corporate customers of Russian banks venture abroad, they demand that their banks have a local presence in host countries to help finance their activities there. Russian technology-based firms also acquired large assets, especially in developed markets (e.g. Sky Technology acquired 10 per cent of Twitter (United States)).
The new privatization agenda in the aftermath of the crisis is expected to contribute to FDI growth. After two decades of transition, privatization is well advanced in large parts of South-East Europe and the CIS. Nevertheless, some countries retain assets that could be privatized. Privatization will be revived after the lull of 2008–2010. During the crisis, Governments’ reluctance to bring politically sensitive companies to the market and international investors’ lack of confidence left little room for privatization projects. However, with signs of an economic upturn and pressure on State budgets, the process is expected to gain new momentum.
For instance, the Government of the Russian Federation approved partial privatization of 10 major State-owned companies before 2013, which could bring an extra Rub 1 trillion ($33 billion) to the State budget. The effort includes minority shares in the major oil company Rosneft, the hydropower generator RusHydro, the Federal Grid Company of Unified Energy Systems, the country’s largest shipping company (Sovcomflot), Sberbank, VTB Bank, the United Grain Company, the Rosagroleasing agricultural leasing company, the oil pipeline company Transneft and the national rail monopoly (Russian Railways). In Serbia, two large publicly owned enterprises are expected to be privatized in 2012: Telekom Srbija and the catering service of the national airline, JAT. In Bosnia and Herzegovina, the Government is hoping to raise about $5 billion in 2012–2013, mainly by privatizing assets in 25 large companies included in previous privatization plans. In Croatia, the State holds a minority stake in over 600 companies and more than 50 per cent of assets in over 60 companies. Seeking to leverage increased investor attention on
the back of its accession to the EU in 2013, Croatia is set to reinvigorate its privatization drive.
Both inflows and outflows are expected to rise further. FDI flows to transition economies are expected to continue to grow in the medium term, reflecting a more investor-friendly environment, WTO accession by the Russian Federation and new privatization programmes. FDI from developing countries is also expected to rise further, aided by joint initiatives to support direct investments in some transition economies. For example, CIC, China’s main sovereign wealth fund, and the Russian Direct Investment Fund (RDIF) agreed to contribute $1 billion each to an RDIF-managed fund. The fund will make 70 per cent of its investments in the Russian Federation, Kazakhstan and Belarus. In 2012, CIC bought a small stake in VTB Bank (Russian Federation) as part of a deal to privatize 10 per cent of the bank. However, FDI inflows in the first quarter of 2012 are slightly lower compared with the same period in 2011.
Outward FDI, too, is set to thrive in 2012 and beyond, thanks to high commodity prices and economic recovery in home countries that have extensive natural resources. The increasing number of new outward investors is another factor driving the volume of outward FDI.

World Investment Report 2012: Towards a New Generation of Investment Policies60
7. Developed countries
Table A. Distribution of FDI flows among economies, by range,a 2011
Range Inflows OutflowsAbove $100 billion
United StatesUnited States, Japan, United Kingdom
$50 to $99 billion
Belgium, United Kingdom France, Belgium, Switzerland, Germany, Canada
$10 to $49 billion
Australia, France, Canada, Germany, Spain, Italy, Luxembourg, Netherlands, Poland, Denmark, Austria, Ireland, Sweden, Israel, Portugal
Italy, Spain, Netherlands, Austria, Sweden, Denmark, Norway, Australia, Portugal, Luxembourg
$1 to $9 billion
Czech Republic, Hungary, Norway, New Zealand, Romania, Slovakia, Bulgaria, Greece, Latvia, Lithuania, Iceland, Slovenia
Poland, Finland, Hungary, Israel, New Zealand, Cyprus, Greece, Czech Republic
Below $1 billion
Malta, Bermuda, Cyprus, Estonia, Gibraltar, Finland, Switzerland, Japan
Slovakia, Bulgaria, Lithuania, Slovenia, Latvia, Romania, Malta, Iceland, Bermuda, Estonia, Ireland
a Economies are listed according to the magnitude of their FDI flows.
Table B. Cross-border M&As by industry, 2010–2011(Millions of dollars)
Sector/industry Sales Purchases2010 2011 2010 2011
Total 257 152 409 691 223 726 400 929Primary 52 783 81 186 31 837 32 085
Mining, quarrying and petroleum 47 971 80 306 31 330 31 904Manufacturing 102 486 176 213 106 146 184 659
Food, beverages and tobacco 27 951 26 509 26 504 23 880Chemicals and chemical products 26 987 78 517 41 085 76 684Metals and metal products 569 5 729 2 754 19 394Electrical and electronic equipment 10 585 23 043 6 383 17 145
Services 101 882 152 293 85 744 184 186Trade 12 201 14 231 5 812 6 495Transport, storage and communications 7 765 23 920 11 785 41 725Finance 26 331 23 609 65 408 92 744Business services 34 755 38 374 25 368 32 999
Table C. Cross-border M&As by region/country, 2010–2011(Millions of dollars)
Region/country Sales Purchases2010 2011 2010 2011
World 257 152 409 691 223 726 400 929Developed economies 185 916 334 673 185 916 334 673
European Union 13 958 89 785 85 102 144 085United States 79 769 123 184 70 191 115 523Japan 18 134 43 314 3 249 3 752Other developed countries 74 056 78 391 27 374 71 313
Developing economies 53 668 67 049 35 446 43 319Africa 1 371 4 265 6 722 4 308East and South-East Asia 34 985 45 773 7 439 15 007South Asia 7 836 5 239 7 439 14 870West Asia -2 555 2 599 2 257 8 222Latin America and the Caribbean 12 036 9 173 2 744 908
Transition economies 4 672 1 464 2 364 22 937
Table D. Greenfield FDI projects by industry, 2010–2011(Millions of dollars)
Sector/industryDeveloped countries
as destinationDeveloped countries
as investors2010 2011 2010 2011
Total 300 648 276 430 643 504 643 490Primary 13 151 18 497 43 149 57 580
Mining, quarrying and petroleum 13 151 18 415 43 149 57 464Manufacturing 149 458 116 105 334 910 312 495
Chemicals and chemical products 11 664 11 745 37 548 51 484Metals and metal products 10 668 6 629 43 493 32 232Electrical and electronic equipment 22 086 17 554 41 497 36 371Motor vehicles and other transport equipment 27 356 25 318 78 501 70 814
Services 138 038 141 829 265 445 273 414Electricity, gas and water 37 654 51 257 69 153 74 904Transport, storage & communications 22 390 17 881 45 660 57 712Finance 15 944 17 354 30 616 32 739Business services 28 799 24 812 50 884 58 776
Table E. Greenfield FDI projects by region/country, 2010–2011(Millions of dollars)
Partner region/economyDeveloped countries
as destinationDeveloped countries
as investors2010 2011 2010 2011
World 300 648 276 430 643 504 643 490Developed economies 248 810 237 251 248 810 237 251
European Union 156 393 130 499 146 232 146 425United States 52 863 52 733 53 161 43 643Japan 13 616 21 107 5 967 5 371Other developed countries 25 938 32 911 43 450 41 812
Developing economies 49 087 34 661 356 427 365 335Africa 1 192 487 48 554 38 939East and South-East Asia 32 559 16 470 136 798 133 339South Asia 6 368 4 503 38 423 41 532West Asia 3 769 9 687 36 532 38 990Latin America and the Caribbean 5 200 3 499 94 771 112 431
Transition economies 2 751 4 518 38 268 40 904
Fig. B - DevelopedFDI in�ows
Fig. C - DevelopedFDI out�ows
0
300
600
900
1 200
1 500
2005 2006 2007 2008 2009 2010 2011 0
400
800
1 200
1 600
2 000
2005 2006 2007 2008 2009 2010 2011
North America Other developed Europe Other developed countries European Union
North America Other developed Europe Other developed countries European Union
Share in world total
63.5 67.1 66.3 56.9 50.6 47.3 49.1 83.5 81.4 83.2 80.3 73.0 68.2 73.0
Figure C. FDI outflows, 2005–2011(Billions of dollars)
Figure B. FDI inflows, 2005–2011(Billions of dollars)
Fig. FID �ows - Developed
(Host) (Home)
0 50 100 150 200 250
France
Australia
UnitedKingdom
Belgium
UnitedStates
0 50 100 150 200 250 300 350 400 450
Belgium
France
UnitedKingdom
Japan
UnitedStates
2011 2010 2011 2010
Figure A. FDI flows, top 5 host and home economies, 2010–2011(Billions of dollars)

CHAPTER II Regional Trends in FDI 61
Both inward and outward FDI up in 2011. Inflows to developed countries, which bottomed out in 2009, accelerated their recovery in 2011 to reach $748 billion, up 21 per cent from the previous year. The recovery has nonetheless made up only one fifth of the ground lost during the financial crisis. Inflows remained at 77 per cent of the average over the three years before the crisis began. Inflows to Europe, which were still in decline in 2010, showed a strong turnaround while robust recovery in the United States continued. Australia and New Zealand attracted significant volumes, and Japan saw a net divestment for the second successive year (annex table I.1).
Recovery of outward FDI from developed countries gathered pace in 2011 (up 25 per cent from 2010). Outflows reached $1.24 trillion, a level comparable with the pre-crisis average of 2005–2007. The growth came on the strength of outward FDI from the United States and Japan (figure A). Outward FDI from the United States reached $397 billion, exceeding the peak of 2007 ($394 billion). Japanese outward FDI doubled to $114 billion (annex table I.1). The trend in Europe is more mixed. While outward FDI from the United Kingdom almost tripled (up 171 per cent) to $107 billion, flows from Germany dropped by half ($54.4 billion) and from the Netherlands by nearly as much ($31.9 billion). Outflows from Denmark and Portugal were at a record high.
Re-emergence of Japan as the second largest investor. Outward FDI flows from Japan doubled in 2011 to $114 billion, approximating the peak in 2008 of $128 billion and showing a strong revival after the decline in 2009–2010. The underlying “push” factors for Japanese TNCs remained the same. In addition to manufacturing FDI seeking low-cost locations, the strength of the yen and the weak growth prospects of the home economy are prompting Japanese TNCs to seek growth opportunities and strategic assets in overseas markets.
One of the most notable examples in recent years is the acquisition of Nycomed (Switzerland) by the pharmaceutical company Takeda for $13.7 billion. This deal was the second largest cross-border purchase by a Japanese TNC ever. Access to markets in Europe and North America, as well as
emerging countries, was thought to be the rationale behind this acquisition. Similarly, the purchase of CaridianBCT (United States) for $2.6 billion gave Terumo, Japan’s largest medical device maker, access to North American customers in the blood transfusion equipment market. Market-seeking motives were also behind the purchase by the Japanese beverage group Kirin of a 50.45 per cent stake in Schincariol (Brazil) for $2.5 billion and of a 14.7 per cent stake in Fraser and Neave (Singapore) for $970 million.
In addition to markets, the search for assets in the form of natural resources and technology has become prominent in recent acquisitions by Japanese TNCs. Examples include the acquisition of a 24.5 per cent stake in Anglo America Sur (Chile) by Mitsubishi Corp., which subsequently announced a plan to double its global copper production. Mitsubishi Corp. and other Japanese sogo shosha have re-emerged as important direct investors in commodity and natural resources.
Support measures by the Japanese Government may have played a role in promoting strategic-asset-seeking FDI. In August 2011, the Government established a $100 billion programme to encourage private sector firms to exchange yen funds for foreign currencies, as part of efforts to ease the negative effects of the strong yen. Such funds can be used to finance the acquisition of foreign firms and natural resources by Japanese TNCs.35 Toshiba accessed this facility for its $2.3 billion acquisition of Landis+Gyr (Switzerland), a manufacturer of electricity meters that has expertise in smart grids. Sony used it to take full control of the joint venture Sony Ericsson.
Continuing boom in mining. The demand for commodities remains strong despite the slowdown in the global economy. Cross-border M&As nearly doubled in this sector in 2011 (table B). Greenfield data also show a 40 per cent increase from 2010 to 2011 (table D). The development of shale gas extraction in the United States was a major factor driving FDI. For example, BHP Billiton (Australia) purchased gas producer Petrohawk Energy (United States) for $12.1 billion. Other developed countries rich in natural resources, notably Australia and Canada, also continued to attract FDI in the mining industry for minerals such as coal, copper, gold

World Investment Report 2012: Towards a New Generation of Investment Policies62
and iron ore. Major deals in the industry included the purchase of Equinox Minerals (Australia) by the world’s largest gold producer, Barrick Gold (Canada), for $7.35 billion as well as those of Consolidated Thompson Iron Mines (Canada) by Cliffs Natural Resources (United States) for $4.35 billion and Western Coal (Canada) by Walter Energy (United States) for $2.91 billion.
Behind the optimistic outlook for the extractive industry is the growing demand in emerging markets. Not surprisingly, therefore, TNCs from developing countries were also increasingly active in acquiring natural-resource assets overseas, including in developed countries. Sinopec (China) acquired the oil and gas explorer Daylight Energy (Canada) for $2.07 billion. GVK Power (India) acquired Hancock Coal (Australia) for $1.26 billion. Brazilian oil company HRT Participações acquired UNX Energy (Canada) for $711 million.
Restructuring in the financial industry continues. Financial institutions continued offloading overseas assets to repay the State aid they received during the financial crisis and also to strengthen their capital base so as to meet the requirements of Basel III and even tougher targets set by the European Banking Authority. In 2011, American International Group paid back an additional $2.15 billion to the Government of the United States following the sale of its life insurance unit, Nan Shan, in Taiwan Province of China. In another example cited earlier, Santander (Spain) sold its Colombian business, including Banco Santander Colombia, to CorpBanca (Chile) for $2.16 billion.
Divestments in the financial industry are not just about retrenchment but are also motivated by the desire to concentrate on fewer business areas and geographies to achieve scale. For instance, the French insurer AXA SA held a 54 per cent stake in AXA Asia Pacific, which ran life insurance and wealth management businesses in the Asia-Pacific region. In a deal worth $13.1 billion, AXA SA took full control of AXA Asia Pacific to pursue its focus on growing in Asia, while divesting AXA Asia Pacific’s operations in Australia and New Zealand to AMP, which, for its part, sought scale and became the largest firm in the Australian wealth management sector with this acquisition. In a separate development, AXA sold its Canadian division to Intact Financial (Canada),
which was seeking to diversify its businesses, for $2.78 billion.
The eurozone crisis and FDI in Greece, Italy, Portugal and Spain. Despite the intensified eurozone crisis, total FDI flows into and out of the four most affected countries appeared to show little impact. FDI inflows were up in Portugal, Italy and Greece, and close to the average of the previous two years for Spain (table II.2). However, underlying variables showed signs of distress. Given the depth of recession, especially in Greece, reinvested earnings – one of three components of FDI – were down in all four countries (as they depend on the earnings of existing foreign affiliates in the host country). Intracompany loans (“other capital” in table II.2) were also down in Italy and Spain, indicating that TNCs withdrew debt capital from their foreign affiliates in these countries. The fact that intracompany loans were negative for Greece between 2007 and 2010 is indicative of the protracted nature of the crisis and of the level of adaptation on the part of TNCs.
M&A data do not show systematic patterns of divestment from the four countries by foreign TNCs, although sales of locally owned assets to foreign investors have increased. In Italy, the value of net M&A sales (acquisition of domestic firms by foreign TNCs) doubled from $6 billion in 2010 to $13 billion in 2011. A single large divestment worth $22 billion distorts the picture on divestment of assets. M&A sales in Spain and particularly in Portugal saw some acquisitions by Latin American TNCs. Consistent with M&A data, the equity components of FDI were at a relatively high level in all four countries, as their economic situation and asset valuations may have created acquisition targets.
Data on FDI outflows from the same countries show that outflows declined until 2009 or 2010 and then began to recover much as they did in other European countries – although the scale of outward FDI from Greece and Portugal has traditionally been low. Data on the components of outward FDI suggest that TNCs may have transferred some assets to foreign affiliates (or left assets there in the form of reinvested earnings). In Italy and Spain, for instance, total outward FDI flows in 2011 were, respectively, only 49 per cent and 27 per cent of the peaks of 2007 (table II.3). In contrast, outflows of “other capital” – mainly intracompany loans –
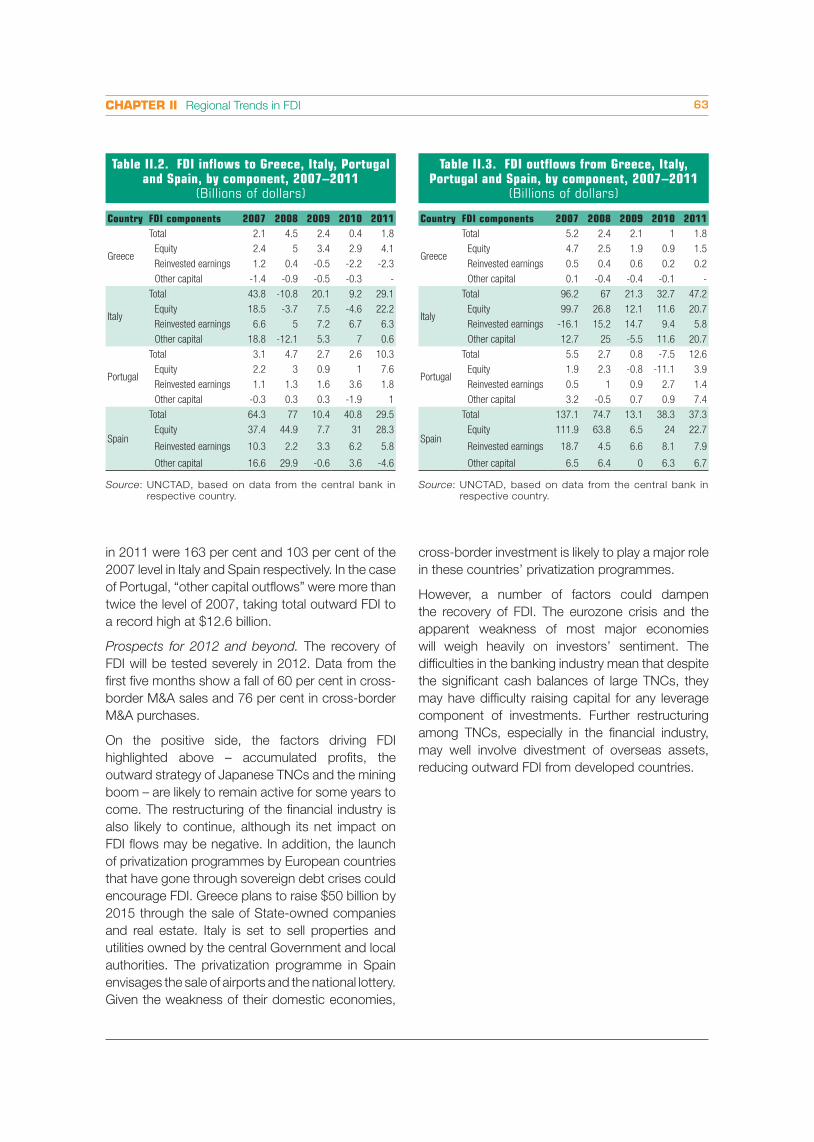
CHAPTER II Regional Trends in FDI 63
in 2011 were 163 per cent and 103 per cent of the 2007 level in Italy and Spain respectively. In the case of Portugal, “other capital outflows” were more than twice the level of 2007, taking total outward FDI to a record high at $12.6 billion.
Prospects for 2012 and beyond. The recovery of FDI will be tested severely in 2012. Data from the first five months show a fall of 60 per cent in cross-border M&A sales and 76 per cent in cross-border M&A purchases.
On the positive side, the factors driving FDI highlighted above – accumulated profits, the outward strategy of Japanese TNCs and the mining boom – are likely to remain active for some years to come. The restructuring of the financial industry is also likely to continue, although its net impact on FDI flows may be negative. In addition, the launch of privatization programmes by European countries that have gone through sovereign debt crises could encourage FDI. Greece plans to raise $50 billion by 2015 through the sale of State-owned companies and real estate. Italy is set to sell properties and utilities owned by the central Government and local authorities. The privatization programme in Spain envisages the sale of airports and the national lottery. Given the weakness of their domestic economies,
cross-border investment is likely to play a major role in these countries’ privatization programmes.
However, a number of factors could dampen the recovery of FDI. The eurozone crisis and the apparent weakness of most major economies will weigh heavily on investors’ sentiment. The difficulties in the banking industry mean that despite the significant cash balances of large TNCs, they may have difficulty raising capital for any leverage component of investments. Further restructuring among TNCs, especially in the financial industry, may well involve divestment of overseas assets, reducing outward FDI from developed countries.
Table II.2. FDI inflows to Greece, Italy, Portugal and Spain, by component, 2007–2011
(Billions of dollars)
Country FDI components 2007 2008 2009 2010 2011
Greece
Total 2.1 4.5 2.4 0.4 1.8
Equity 2.4 5 3.4 2.9 4.1
Reinvested earnings 1.2 0.4 -0.5 -2.2 -2.3
Other capital -1.4 -0.9 -0.5 -0.3 -
Italy
Total 43.8 -10.8 20.1 9.2 29.1
Equity 18.5 -3.7 7.5 -4.6 22.2
Reinvested earnings 6.6 5 7.2 6.7 6.3
Other capital 18.8 -12.1 5.3 7 0.6
Portugal
Total 3.1 4.7 2.7 2.6 10.3
Equity 2.2 3 0.9 1 7.6
Reinvested earnings 1.1 1.3 1.6 3.6 1.8
Other capital -0.3 0.3 0.3 -1.9 1
Spain
Total 64.3 77 10.4 40.8 29.5
Equity 37.4 44.9 7.7 31 28.3
Reinvested earnings 10.3 2.2 3.3 6.2 5.8
Other capital 16.6 29.9 -0.6 3.6 -4.6
Source: UNCTAD, based on data from the central bank in respective country.
Table II.3. FDI outflows from Greece, Italy, Portugal and Spain, by component, 2007–2011
(Billions of dollars)
Country FDI components 2007 2008 2009 2010 2011
Greece
Total 5.2 2.4 2.1 1 1.8
Equity 4.7 2.5 1.9 0.9 1.5
Reinvested earnings 0.5 0.4 0.6 0.2 0.2
Other capital 0.1 -0.4 -0.4 -0.1 -
Italy
Total 96.2 67 21.3 32.7 47.2
Equity 99.7 26.8 12.1 11.6 20.7
Reinvested earnings -16.1 15.2 14.7 9.4 5.8
Other capital 12.7 25 -5.5 11.6 20.7
Portugal
Total 5.5 2.7 0.8 -7.5 12.6
Equity 1.9 2.3 -0.8 -11.1 3.9
Reinvested earnings 0.5 1 0.9 2.7 1.4
Other capital 3.2 -0.5 0.7 0.9 7.4
Spain
Total 137.1 74.7 13.1 38.3 37.3
Equity 111.9 63.8 6.5 24 22.7
Reinvested earnings 18.7 4.5 6.6 8.1 7.9
Other capital 6.5 6.4 0 6.3 6.7
Source: UNCTAD, based on data from the central bank in respective country.

World Investment Report 2012: Towards a New Generation of Investment Policies64
1. Least developed countries
B. TRENDS IN STRUCTURALLY WEAK, VULNERABLE AND SMALL ECONOMIES
Table B. Cross-border M&As by industry, 2010–2011(Millions of dollars)
Sector/industry Sales Purchases2010 2011 2010 2011
Total 2 201 504 277 353Primary 1 094 - 191 20 -
Mining, quarrying and petroleum 1 094 - 191 20 -Manufacturing 94 624 1 -
Food, beverages and tobacco 65 632 - -Textiles, clothing and leather 10 - - -Chemicals and chemical products 20 4 - -Metals and metal products - 5 1 -
Services 1 013 70 257 353Electricity, gas and water 110 - - -Trade - 6 - -Transport, storage and communications 903 50 - -Finance - 14 257 353
Table C. Cross-border M&As by region/country, 2010–2011 (Millions of dollars)
Region/country Sales Purchases2010 2011 2010 2011
World 2 201 504 277 353Developed economies 1 655 436 20 -
European Union 786 180 1 -United States 1 313 - 10 - -Japan - 450 - -Other developed countries - 445 - 183 20 -
Developing economies 511 68 257 353Africa 252 - 14 257 353East and South-East Asia 183 75 - -South Asia 356 4 - -West Asia - 280 - - -Latin America and the Caribbean - 3 - -
Transition economies 35 - - -
Table D. Greenfield FDI projects by industry, 2010–2011(Millions of dollars)
Sector/industry LDCs as destination LDCs as investors2010 2011 2010 2011
Total 39 714 33 304 732 923Primary 11 871 11 796 - -
Mining, quarrying and petroleum 11 871 11 796 - -Manufacturing 17 838 11 848 501 424Food, beverages and tobacco 606 1 125 30 31Coke, petroleum and nuclear fuel 10 525 5 197 466 393Non-metallic mineral products 876 1 505 - -Metals and metal products 1 079 1 205 - -
Services 10 006 9 660 231 499Electricity, gas and water 3 430 4 499 - -Transport, storage and communications 1 549 1 908 11 -Finance 1 824 1 478 207 426Business services 1 297 929 7 26
Table E. Greenfield FDI projects by region/country, 2010–2011(Millions of dollars)
Partner region/economy LDCs as destination LDCs as investors2010 2011 2010 2011
World 39 714 33 304 732 923Developed economies 20 910 16 729 98 122
European Union 14 615 9 367 98 33United States 906 3 597 - 89Japan 243 896 - -Other developed countries 5 146 2 869 - -
Developing economies 16 305 15 859 635 802Africa 7 059 3 703 141 572East and South-East Asia 3 543 5 691 4 151South Asia 2 729 4 219 9 70West Asia 2 174 558 15 8Latin America and the Caribbean 800 1 637 466 -
Transition economies 2 500 716 - -
Table A. Distribution of FDI flows among economies, by range,a 2011
Range Inflows Outflows
Above $1.0 billion
Mozambique, Zambia, Sudan, Chad, Democratic Republic of the Congo, Guinea, Bangladesh, United Republic of Tanzania, Niger
Angola, Zambia
$0.5 to $0.9 billion
Madagascar, Cambodia, Myanmar, Uganda, Equatorial Guinea, Liberia
..
$0.1 to $0.4 billion
Lao People's Democratic Republic, Senegal, Ethiopia, Haiti, Mali, Solomon Islands, Benin, Central African Republic, Rwanda, Somalia
Liberia
Below $0.1 billion
Nepal, Afghanistan, Djibouti, Malawi, Vanuatu, Togo, Lesotho, Sierra Leone, Mauritania, Gambia, Timor-Leste, Guinea-Bissau, Eritrea, São Tomé and Principe, Bhutan, Samoa, Burkina Faso, Comoros, Kiribati, Tuvalu, Burundi, Yemen, Angola
Democratic Republic of the Congo, Sudan, Yemen, Senegal, Niger, Cambodia, Togo, Bangladesh, Lao People's Democratic Republic, Guinea, Mauritania, Burkina Faso, Solomon Islands, Benin, Mali, Guinea-Bissau, Vanuatu, Kiribati, São Tomé and Principe, Samoa, Mozambique
a Economies are listed according to the magnitude of their FDI flows.Fig. B - LDCsFDI in�ows
Fig. C - LDCsFDI out�ows
0
5
10
15
20
25
2005 2006 2007 2008 2009 2010 2011 0
0.5
1.0
1.5
2.0
2.5
3.0
3.5
2005 2006 2007 2008 2009 2010 2011
Oceania Asia Latin America and the Caribbean Africa
Oceania Asia Latin America and the Caribbean Africa
Share in world total
0.7 0.8 0.8 1.0 1.5 1.3 1.0 0.1 0.0 0.1 0.2 0.1 0.2 0.2
Figure C. FDI outflows, 2005–2011(Billions of dollars)
Figure B. FDI inflows, 2005–2011(Billions of dollars)
Fig. FID �ows - LDCs
(Host) (Home)
0.0 0.5 1.0 1.5 2.0 2.5 3.0 3.5
Congo, Dem. Rep. of
Chad
Sudan
Zambia
Mozambique
0.0 0.2 0.4 0.6 0.8 1.0 1.2 1.4 1.6
Liberia
Sudan
Congo, Dem. Rep. of
Zambia
Angola
2011 2010 2011 2010
Figure A. FDI flows, top 5 host and home economies, 2010–2011(Billions of dollars)

CHAPTER II Regional Trends in FDI 65
Further marginalization of LDCs36 as a group. FDI inflows to LDCs remained small (figure B). With the continuous fall of FDI to Angola – by far the largest recipient country among 48 LDCs for a decade – 2011 inflows slid further, by 11 per cent, to $15 billion, the lowest level in five years (figure B). Even measured among the overall inflows to developing and transition economies, the share of inflows to LDCs has kept falling from 3.1 per cent in 2009, to 2.4 per cent in 2010 and to 1.9 per cent in 2011. These disappointing results reflected a 16 per cent decline in greenfield investments and a 77 per cent fall in cross-border M&A sales (tables B–E).
Although FDI inflows declined, the number of greenfield projects held steady. The bulk of invest-ment in LDCs is in greenfield projects. Although the value of such projects dropped by 16 per cent, from $39.7 billion to $33.3 billion, the number of projects rose from 310 in 2010 to 338 in 2011. The total value of investments in LDCs depends largely on a few large-scale projects (table II.4). (These values exceed FDI flow data because they include total project values and different accounting methods.)
Greenfield investments in mining, quarrying and petroleum accounted for 35 per cent (table D). The overall share of manufacturing fell from 45 per cent to 36 per cent. In contrast, the increasing share of the services sector (from 25 per cent to 29 per cent) was supported by a 31 per cent rise in electric, gas
and water and a 23 percent increase in transport, storage and communication.
Two large-scale greenfield projects in fossil fuel and electric power went to Mozambique and the United Republic of Tanzania. The largest project announced in 2011 (table II.4), a power plant to be built by Jindal, is the largest greenfield electricity investment for Mozambique since 2003.37 If it materializes, this will be that company’s second large-scale investment in the country, following the $1.6 billion project in manufacturing coal, oil and gas announced in 2008, for which Jindal received a 25-year mining concession. Two other TNCs –Vale (Brazil), which invested $1.2 billion in coal extraction in 2007 and $0.7 billion in electricity in 2009, and Riversdale (Australia), which invested $0.5 billion in coal extraction in 2008 – are also developing plans for coal-fired plants in the country.
The United Republic of Tanzania attracted a $0.8 billion investment in fossil fuel and electric power (table II.4), which accounted for more than 20 per cent of its total value of greenfield projects in 2011. This is the second electricity investment in the country, after the $0.7 billion investment by Globeleg (United States), recorded in 2004 (UNCTAD, 2011b: 215).
Alternative/renewable energy projects in the Lao People’s Democratic Republic and Rwanda. Thai Biogas Energy in the Lao People’s Democratic
Table II.4. The 10 largest greenfield projects in LDCs, 2011
Host economy Industry Investing company Home economy
Estimated investment ($ million)
Estimated jobs
created
Mozambique Fossil fuel electric power Jindal Steel & Power India 3 000 368
Uganda Oil and gas extraction Tullow Oil United Kingdom 2 000 783
Mozambique Natural, liquefied and compressed gas Eni SpA Italy 1 819 161
Mozambique Natural, liquefied and compressed gas Sasol Petroleum International South Africa 1 819 161
Equatorial Guinea Oil and gas extraction Noble Energy United States 1 600 626
Democratic Republic of the Congo Copper, nickel, lead and zinc mining Freeport McMoRan United States 850 1 459
United Republic of Tanzania Fossil fuel electric power Castletown Enterprises United Kingdom 799 118
Zambia Copper, nickel, lead and zinc mining Non-Ferrous China Africa (NFCA) China 700 1 201
Democratic Republic of the Congo Iron ore mining Sundance Resources Australia 620 1 063
Lao People's Democratic Republic Biomass power Thai Biogas Energy Thailand 558 700
Source: UNCTAD, based on information from the Financial Times Ltd, fDi Markets (www.fDimarkets.com).

World Investment Report 2012: Towards a New Generation of Investment Policies66
Republic was the 10th largest investment in 2011 among this group of countries (table II.4). The company, which is owned by Private Energy Market Fund (Finland) and Al Tayyar Energy (United Arab Emirates), creates biogas projects for heat and electricity generation, using wastewater discharged from agricultural industries. This project is supported by the Finnish Fund for Industrial Cooperation and the Energy and Environment Partnership Program, and is expected to generate employment for 700 factory workers and support 5,000 families in farming.38 Before this investment, the Lao People’s Democratic Republic had already reported six projects in alternative/renewable energy totalling $1.7 billion, of which $0.8 billion (for two electricity projects) came from Malaysia in 2007 and 2008 (UNCTAD, 2011b: 135).
On a smaller scale, Rwanda attracted $142 million in an alternative/renewable energy project from ContourGlobal (United States), which represented 18 per cent of Rwanda’s total green-field investments in 2011. Part of this investment is
financed by the Emerging Africa Infrastructure Fund, the Netherlands Development Finance Company, the African Development Bank and the Belgian Investment Company for Developing Countries.39
Developing and transition economies accounted for half of greenfield investments. About half of greenfield investments in LDCs came from developing (48 per cent) and transition economies (2 per cent) (table E). Although such sources are increasingly important, neither the share nor the value ($16.6 billion) of their 2011 investments quite recovered to the levels recorded in 2008–2009.
Among developing economies, India remained the largest investor in LDCs, contributing $4.2 billion in 39 projects, followed by China ($2.8 billion in 20 projects) and South Africa ($2.3 billion in 27 projects). Although the numbers of projects reported by these three countries are the highest since data collection started in 2003, in value terms more than 70 per cent of investment from India and more than 80 per cent from South Africa were directed to the two projects in Mozambique (table II.4).

CHAPTER II Regional Trends in FDI 67
2. Landlocked developing countries
Table B. Cross-border M&As by industry, 2010–2011(Millions of dollars)
Sector/industry Sales Purchases2010 2011 2010 2011
Total 621 716 1 727 8 083Primary 45 357 123 7 921
Mining, quarrying and petroleum 45 312 123 7 921Manufacturing 44 189 - -
Food, beverages and tobacco - 163 - -Textiles, clothing and leather - - - -Chemicals and chemical products 42 10 - -Metals and metal products - 33 - -
Services 532 170 1 603 162Trade - 1 - -Transport, storage and communications 371 77 - -Finance 69 66 1 604 162Health and social services - 27 - -
Table C. Cross-border M&As by region/country, 2010–2011(Millions of dollars)
Region/country Sales Purchases2010 2011 2010 2011
World 621 716 1 727 8 083Developed economies 69 - 111 1 471 159
European Union 71 268 1 469 159United States - 17 - 4 - -Japan - 3 - - -Other developed countries 19 - 375 2 -
Developing economies 550 895 257 5Africa 303 3 257 -East and South-East Asia 166 783 - -South Asia 80 32 - -West Asia - 77 - 5Latin America and the Caribbean - - - -
Transition economies - - 69 - 1 7 919
Table D. Greenfield FDI projects by industry, 2010–2011(Millions of dollars)
Sector/industry LLDCs as destination LLDCs as investors2010 2011 2010 2011
Total 29 217 39 360 1 394 1 137Primary 3 126 13 062 - -
Mining, quarrying and petroleum 3 126 13 062 - -Manufacturing 18 575 18 692 551 192
Coke, petroleum and nuclear fuel 9 906 9 786 358 30Rubber and plastic products 34 1 479 - -Non-metallic mineral products 293 1 661 - -Motor vehicles and other transport equipment 736 2 010 - 3
Services 7 517 7 606 842 945Electricity, gas and water 1 311 1 315 - 100Transport, storage and communications 1 893 2 248 198 5Finance 1 208 1 424 329 366Business services 1 358 2 004 - 39
Table E. Greenfield FDI projects by region/country, 2010–2011(Millions of dollars)
Partner region/economy LLDCs as destination LLDCs as investors2010 2011 2010 2011
World 29 217 39 360 1 394 1 137Developed economies 15 387 15 745 366 231
European Union 11 836 11 873 359 221United States 1 146 1 116 7 10Japan 184 97 - -Other developed countries 2 221 2 661 - -
Developing economies 11 962 16 136 227 205Africa 5 664 2 638 198 143East and South-East Asia 2 066 7 022 2 -South Asia 1 301 5 367 4 31West Asia 2 287 711 23 31Latin America and the Caribbean 644 398 - -
Transition economies 1 868 7 479 801 701
Table A. Distribution of FDI flows among economies, by range,a 2011
Range Inflows Outflows
Above $1 billion
Kazakhstan, Mongolia, Turkmenistan, Zambia, Chad, Azerbaijan, Uzbekistan, Niger
Kazakhstan, Zambia
$500 to $999 million
Plurinational State of Bolivia, Uganda, Kyrgyzstan, Botswana, Armenia
Azerbaijan
$100 to $499 million
Lao People's Democratic Republic, the former Yugoslav Republic of Macedonia, Zimbabwe, Paraguay, Republic of Moldova, Ethiopia, Mali, Central African Republic, Rwanda
..
$10 to $99 million
Nepal, Swaziland, Afghanistan, Malawi, Lesotho, Bhutan, Tajikistan
Mongolia, Armenia, Niger, Republic of Moldova, Zimbabwe
Below $10 million
Burkina Faso, Burundi
Lao People's Democratic Republic, Swaziland, Burkina Faso, Botswana, Mali, the former Yugoslav Republic of Macedonia, Kyrgyzstan
a Economies are listed according to the magnitude of their FDI flows.
Fig. B - LLCsFDI in�ows
Fig. C - LLCsFDI out�ows
0
5
10
15
20
25
30
35
2005 2006 2007 2008 2009 2010 2011 0
2
4
6
8
10
2005 2006 2007 2008 2009 2010 2011
Transition economies Asia and Oceania Latin America and the Caribbean Africa
Transition economies Asia and Oceania Latin America and the Caribbean Africa
Share in world total
0.7 0.8 0.8 1.4 2.3 2.2 2.3 0.1 0.0 0.2 0.1 0.3 0.6 0.4
Figure C. FDI outflows, 2005–2011(Billions of dollars)
Figure B. FDI inflows, 2005–2011(Billions of dollars)
Fig. FID �ows - LLCs
(Host) (Home)
0.0 2.0 4.0 6.0 8.0 10.0 12.0 14.0
Chad
Zambia
Turkmenistan
Mongolia
Kazakhstan
0.0 1.0 2.0 3.0 4.0 5.0 6.0 7.0 8.0 9.0
Armenia
Mongolia
Azerbaijan
Zambia
Kazakhstan
2011 2010 2011 2010
Figure A. FDI flows, top 5 host and home economies, 2010–2011(Billions of dollars)
World Investment Report 2012: Towards a New Generation of Investment Policies68
Inflows to landlocked developing countries (LLDCs) reached a record high. In 2011, FDI inflows to 31 LLDCs40 grew by 24 per cent to $35 billion (figure B), a record high. In relation to the total inflows to all developing and transition economies, the share of LLDCs increased marginally (from 4.1 per cent in 2010 to 4.5 per cent). The largest recipient of inflows was again Kazakhstan (37 per cent), followed by Mongolia (14 per cent) and Turkmenistan (9 per cent) (figure A).
Inflows to 15 African LLDCs represented 21 per cent, compared with 25 per cent in 2010. Inflows to Kazakhstan rose by 20 per cent, led by strong investment in hydrocarbons.41 In Mongolia, inflows more than doubled from 2010 to 2011 because of large-scale projects in extractive industries (section A.2), allowing this county to surpass Turkmenistan in FDI. Nevertheless, 12 of 31 LLDCs (39 per cent) recorded declines, of which 5 – Armenia, Bhutan, Burkina Faso, Mali and Turkmenistan – experienced falls for the second year in a row. For example, although Turkmenistan attracted $3.2 billion of FDI inflows (figure A), these inflows have followed a downward trajectory since 2009.
Strong growth in extractive industries, but some diversification in manufacturing. The vast majority of inward investments in this group continued to be in the form of greenfield investments, which increased by 35 per cent to $39 billion (table D). The value of greenfield investments in the primary sector grew four-fold over 2010, reaching the highest level in eight years. In the manufacturing sector, growth was strong in three industries: rubber and plastic products (from $34 million in 3 projects in 2010 to $1.5 billion in 6 projects), non-metallic mineral products (from $0.3 billion in 7 projects to $1.7 billion in 11 projects), and motor vehicles and other transport equipment (from $0.7 billion in 8 projects to $2.0 billion in 22 projects).
The recipients of the largest investments were Kazakhstan ($8.0 billion, compared with $2.5 billion in 2010), and Uzbekistan ($7.6 billion, compared with $2.4 billion in 2010), reflecting the destinations of large-scale projects (table II.5). The receipts of these two countries represent 40 per cent of all greenfield investments in LLDCs, greater than the share of combined greenfield investments in the 15 African LLDCs (38 per cent).
Investments in the extractive industry accounted for almost 80 per cent of greenfield investments in Uzbekistan. Following the previous $1.3 billion investment from the United Arab Emirates in chemicals (WIR11: 81), in 2011 the country attracted another large-scale investment in the manufacturing sector (table II.3). Indorama (Singapore), a petrochemicals group, announced a joint-venture project with the Uzbek national gas company, Uzbekneftegaz, and the Uzbekistan Fund for Reconstruction and Development to build a polyethylene production plant under a government programme to enhance and develop polymers production.42
Indorama also has a stake in Uzbekistan’s textile industry. The Kokand Textile joint venture, established in 2010 by Indorama and the country’s National Bank of Foreign Economic Activity,43 is one of 100 projects intended to triple the export potential of the textile industry; Indorama announced an additional $54 million investment in 2011. A similar investment in textiles ($60 million) was reported by Textile Technologies Group (Republic of Korea).
More investments from Asia and the Russian Federation. By source, the share of transition economies in inflows to LLDCs increased from 6 per cent in 2010 to 19 per cent in 2011 (table E). This was due to the $7.2 billion in investments (27 projects) from the Russian Federation, in which the $5 billion investment in Uzbekistan (table II.5) accounted for 70 per cent.
Greenfield investments from developing economies reached the highest level in three years, but their share in the total greenfield investments in LLDCs remained the same as in 2010 (41 per cent). Investments from South, East and South-East Asia jumped substantially, from $3.4 billion in 2010 to $12.4 billion in 2011. India was the largest investor among developing economies ($4.9 billion in 27 projects – record highs in both value and number – compared with $1.2 billion in 21 projects in 2010), followed by China ($2.9 billion in 14 projects), Singapore ($1.3 billion in 3 projects) and the Republic of Korea ($1.3 billion in 8 projects).
The high level of investments from India, however, was mostly attributed to the single project in Zimbabwe (table II.5), which accounted for more

CHAPTER II Regional Trends in FDI 69
than 80 per cent of the $4.9 billion. Similarly, the two projects from China in table II.5 represented 56 per cent of its greenfield investments in LLDCs, and the Indorama project in Uzbekistan (table II.5) accounted for 89 per cent of Singapore’s greenfield investments in LLDCs.
In Africa, Zimbabwe attracted the largest greenfield investment. The $4 billion investment from the Essar Group (India) (table II.5) contributed the bulk of the rise in Zimbabwe’s greenfield investments from $0.8 billion in 2010 to $5.8 billion in 2011, making this country the largest recipient among African
LLDCs. The Essar Group expected to implement this investment for the construction of a steel plant to process domestic iron ore through two newly established joint ventures with the Government.44 Their establishment concluded the transaction process that began in August 2010 for the revival of the operational assets of the Zimbabwe Iron and Steel Company.45 Although the amount thus far committed by Essar Africa Holdings was reported at $750 million, the country counts on additional investments in related infrastructure to ensure sustainable operations at one of the joint ventures.
Table II.5. The 10 largest greenfield projects in LLDCs, 2011
Host economy Industry Investing company Home economy
Estimated investment ($ million)
Estimated jobs
created
Uzbekistan Natural, liquefied and compressed gas LUKOIL Russian Federation 5 000 3 000
Zimbabwe Iron ore mining Essar Group India 4 000 3 000
Kazakhstan Iron ore mining Eurasian Natural Resources Corporation (ENRC) United Kingdom 2 100 3 000
Uganda Oil and gas extraction Tullow Oil United Kingdom 2 000 783
Uzbekistan Urethane, foam products and other compounds Indorama Singapore 1 190 3 000
Kazakhstan Basic chemicals Nitol Group United Kingdom 1 000 1 200
Turkmenistan Natural, liquefied and compressed gas Thermo Design Engineering Canada 923 356
Kazakhstan Other petroleum and coal products Tethys Petroleum United Kingdom 923 356
Turkmenistan Natural, liquefied and compressed gas China National Petroleum Corp (CNPC) China 923 356
Zambia Copper, nickel, lead and zinc mining Non-Ferrous China Africa (NFCA) China 700 1 201
Source: UNCTAD, based on information from the Financial Times Ltd, fDi Markets (www.fDimarkets.com).
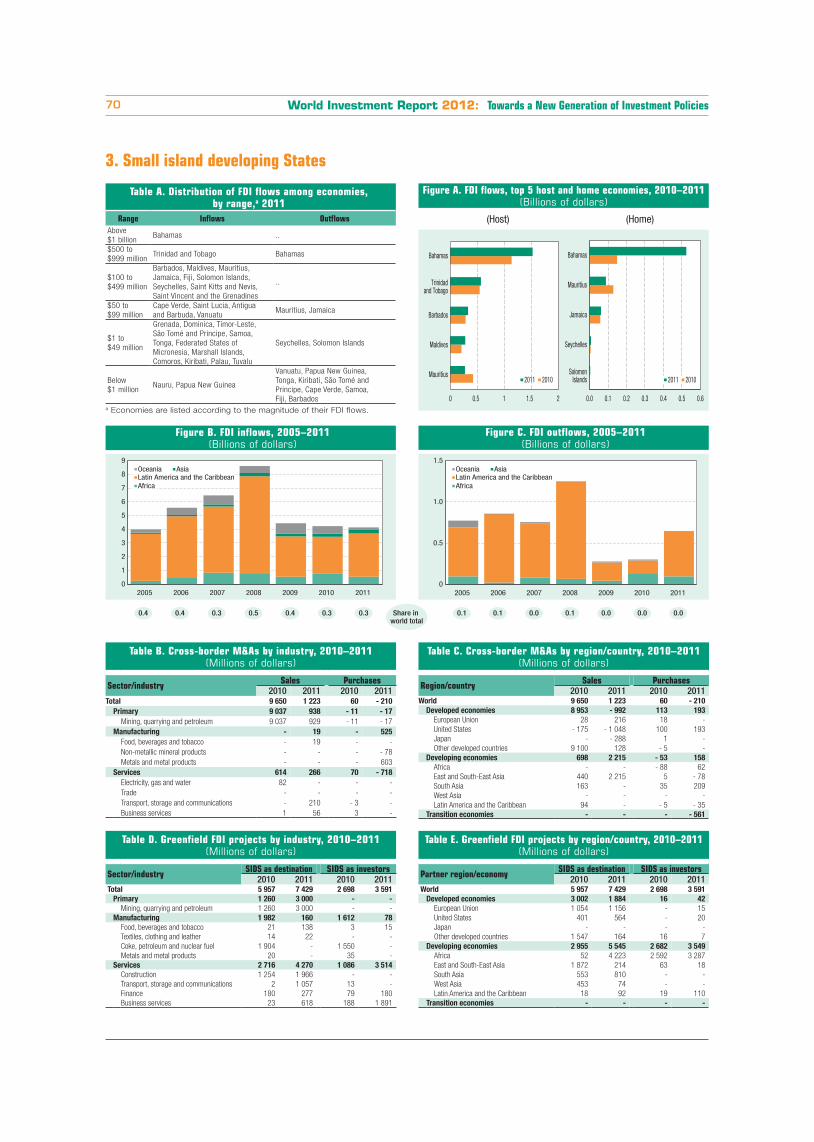
World Investment Report 2012: Towards a New Generation of Investment Policies70
3. Small island developing States
Table B. Cross-border M&As by industry, 2010–2011(Millions of dollars)
Sector/industry Sales Purchases2010 2011 2010 2011
Total 9 650 1 223 60 - 210Primary 9 037 938 - 11 - 17
Mining, quarrying and petroleum 9 037 929 - 11 - 17Manufacturing - 19 - 525
Food, beverages and tobacco - 19 - -Non-metallic mineral products - - - - 78Metals and metal products - - - 603
Services 614 266 70 - 718Electricity, gas and water 82 - - -Trade - - - -Transport, storage and communications - 210 - 3 -Business services 1 56 3 -
Table C. Cross-border M&As by region/country, 2010–2011(Millions of dollars)
Region/country Sales Purchases2010 2011 2010 2011
World 9 650 1 223 60 - 210Developed economies 8 953 - 992 113 193
European Union 28 216 18 -United States - 175 - 1 048 100 193Japan - - 288 1 -Other developed countries 9 100 128 - 5 -
Developing economies 698 2 215 - 53 158Africa - - - 88 62East and South-East Asia 440 2 215 5 - 78South Asia 163 - 35 209West Asia - - - -Latin America and the Caribbean 94 - - 5 - 35
Transition economies - - - - 561
Table D. Greenfield FDI projects by industry, 2010–2011(Millions of dollars)
Sector/industry SIDS as destination SIDS as investors2010 2011 2010 2011
Total 5 957 7 429 2 698 3 591Primary 1 260 3 000 - -
Mining, quarrying and petroleum 1 260 3 000 - -Manufacturing 1 982 160 1 612 78
Food, beverages and tobacco 21 138 3 15Textiles, clothing and leather 14 22 - -Coke, petroleum and nuclear fuel 1 904 - 1 550 -Metals and metal products 20 - 35 -
Services 2 716 4 270 1 086 3 514Construction 1 254 1 966 - -Transport, storage and communications 2 1 057 13 -Finance 180 277 79 180Business services 23 618 188 1 891
Table E. Greenfield FDI projects by region/country, 2010–2011(Millions of dollars)
Partner region/economy SIDS as destination SIDS as investors2010 2011 2010 2011
World 5 957 7 429 2 698 3 591Developed economies 3 002 1 884 16 42
European Union 1 054 1 156 - 15United States 401 564 - 20Japan - - - -Other developed countries 1 547 164 16 7
Developing economies 2 955 5 545 2 682 3 549Africa 52 4 223 2 592 3 287East and South-East Asia 1 872 214 63 18South Asia 553 810 - -West Asia 453 74 - -Latin America and the Caribbean 18 92 19 110
Transition economies - - - -
Table A. Distribution of FDI flows among economies, by range,a 2011
Range Inflows OutflowsAbove $1 billion
Bahamas ..
$500 to $999 million
Trinidad and Tobago Bahamas
$100 to $499 million
Barbados, Maldives, Mauritius, Jamaica, Fiji, Solomon Islands, Seychelles, Saint Kitts and Nevis, Saint Vincent and the Grenadines
..
$50 to $99 million
Cape Verde, Saint Lucia, Antigua and Barbuda, Vanuatu
Mauritius, Jamaica
$1 to $49 million
Grenada, Dominica, Timor-Leste, São Tomé and Principe, Samoa, Tonga, Federated States of Micronesia, Marshall Islands, Comoros, Kiribati, Palau, Tuvalu
Seychelles, Solomon Islands
Below $1 million
Nauru, Papua New Guinea
Vanuatu, Papua New Guinea, Tonga, Kiribati, São Tomé and Principe, Cape Verde, Samoa, Fiji, Barbados
a Economies are listed according to the magnitude of their FDI flows.Fig. B - SIDsFDI in�ows
Fig. C - SIDsFDI out�ows
0
0.5
1.0
1.5
2005 2006 2007 2008 2009 2010 2011 0
1
2
3
4
5
6
7
8
9
2005 2006 2007 2008 2009 2010 2011
Oceania AsiaLatin America and the Caribbean Africa
Oceania AsiaLatin America and the Caribbean Africa
Share in world total
0.4 0.4 0.3 0.5 0.4 0.3 0.3 0.1 0.1 0.0 0.1 0.0 0.0 0.0
Figure C. FDI outflows, 2005–2011(Billions of dollars)
Figure B. FDI inflows, 2005–2011(Billions of dollars)
Fig. FID �ows - SIDs
(Host) (Home)
Mauritius
Maldives
Barbados
Trinidad and Tobago
Bahamas
0.0 0.1 0.2 0.3 0.4 0.5 0.6
Solomon Islands
Seychelles
Jamaica
Mauritius
Bahamas
2011 2010 2011 2010
0 0.5 1 1.5 2
Figure A. FDI flows, top 5 host and home economies, 2010–2011(Billions of dollars)

CHAPTER II Regional Trends in FDI 71
Inflows fell for the third year in a row and dipped to their lowest level in six years. Compared with 2010, FDI inflows to SIDS46 fell by 2 per cent in 2011. Although FDI has been a major contributor to capital formation in SIDS (23 per cent in 2011), this group’s position in global FDI remained miniscule (figure B). The marginal share of its inflows in relation to those to developing and transition economies also dropped, from 0.6 per cent in 2010 to 0.5 per cent in 2011. The distribution of FDI remains highly skewed, with two economies (the Bahamas and Trinidad and Tobago) (figure A) receiving 51 per cent of the total.
Greenfield investments to SIDS more important than M&As. Unlike in LDCs and LLDCs, the dominance of greenfield investments over cross-border M&As in value has not always been evident in SIDS. Depending on small numbers of larger investments, the relative importance of M&As and greenfield investments shifts from one year to another. In 2011, in the absence of megadeals in mining, quarrying and petroleum, the total values of cross-border M&A sales in SIDS dropped significantly (tables B and C). The total net sales value of $1.2 billion is much smaller than the gross sum of the transaction values recorded by the six largest deals in table II.6 (i.e. $4.4 billion).47
In contrast, total greenfield investments in SIDS increased by 25 per cent and reached a record high of $7.4 billion (tables D and E). The largest project recorded for the year in Papua New Guinea (table II.7) represented 40 per cent of all greenfield
investments in SIDS, and three construction projects in Mauritius and the Maldives, amounting to almost $2 billion, accounted for 30 per cent of such investments. Furthermore, transport, storage and communications attracted record high greenfield investments ($1.1 billion in 8 projects) (table D), which accounted for 14 per cent of such investments.
China was the most active in M&A sales, while South Africa was the largest source of greenfield investments in SIDS. Unlike in many regions and other groups of economies, the increasing importance of investments from the South had not been a clear trend in SIDS until 2011. Total sales to developed economies were negative, while developing economies accounted for inflows of $2.2 billion (table C), of which more than $1.9 billion was generated by M&A sales to China in three deals. In addition to the two deals presented in table II.6, China spent $9 million to purchase sugar-cane plantations in Jamaica.
In greenfield investments in SIDS, the share of developing economies advanced from 50 per cent in 2010 to 75 per cent in 2011 (table E). Investments from South Africa jumped from less than $0.1 billion in 2010 to $4.2 billion. The $3 billion investment from Harmony Gold Mining (South Africa) (table II.7) contributed to a 57 per cent growth in greenfield investments in Papua New Guinea. Among other investors from developing economies, India continued to hold the key position by investing $0.8 billion in five projects in Jamaica and Maldives.
Table II.6. Selected largest M&A sales in SIDS, 2011
Target country Industry of target company
Acquiring company
Home economy
Value ($ million)
Shares acquired (%)
Ultimate target country
Bahamas Special warehousing and storage Buckeye Partners LP United States 1 641 80 United States
Barbados Deep sea transportation of freight Investor Group China 1 048 100 United States
Trinidad and Tobago Natural gas liquids China Investment Corp China 850 10 Trinidad and Tobago
Bahamas Special warehousing and storage Buckeye Partners LP United States 340 20 United States
Jamaica Electric services Korea East-West Power Co Ltd Korea, Republic of 288 40 Japan
Bahamas Radiotelephone communications
Cable & Wireless Communications Plc United Kingdom 210 51 Bahamas
Source: UNCTAD, cross-border M&A database.

World Investment Report 2012: Towards a New Generation of Investment Policies72
A series of large-scale investments announced in Papua New Guinea. Thanks to the recent investment boom in metals and LNG, during 2008–2011 Papua New Guinea attracted 11 greenfield projects, including related education and training, and business services, with reported investment values exceeding $9 billion. Among them, the Exxon-led LNG project has been reported as the largest public-private partnership in the country.48 Despite this activity, FDI inflows to Papua New Guinea fell from the peak of $0.4 billion in 2009 to $29 million in 2010 and, owing to the equity purchase by the Government from a Canadian mining TNC, became -$0.3 billion in 2011.
For many SIDS, attracting more or larger-scale investments does not guarantee more positive development outcomes. In Papua New Guinea, for example, efforts are under way to ensure that revenue flows expected from the recent investment boom will materialize and be used effectively to achieve development goals. In addition to the LNG projects, the prospects of large-scale investments in metals remain high, because of newfound gold, silver and other mineral deposits. These investments lead to increasing concerns about the environmental impacts of mining and to domestic pressures, calling for legislative reforms to increase
State control over mining projects and tax revenues from foreign investments.49 A Government initiative, reported in the first quarter of 2012, to set up a sovereign wealth fund to ensure that LNG project revenues will be used for infrastructure development and education, is an important step towards making better use of FDI for development.50
Notes1 In the United Nations’ terminology, sub-Saharan Africa refers to
the countries of East, West, Southern and Central Africa plus the Sudan and South Sudan in North Africa.
2 For instance, Oclaro (United States) announced in March 2012 that it would relocate its production and testing businesses in Shenzhen, China, to Malaysia within the next three years.
3 JETRO, based on Ben Bland, “Japanese companies make big move into Vietnam”, Financial Times, 9 February 2012.
4 For instance, Master Lock and Whirlpool (both United States) have relocated part of their production from Asia to the United States, though the scale of the relocation is small.
5 For instance, Ford (United States) is to build five new assembly plants in China, with a total investment of $5 billion.
6 During the visit of Vice President Xi Jinping to the United States in February 2012, China announced the opening of the automotive insurance market to investors from the United States.
7 For instance, Citigroup (United States) expects to double the number of its branches in China to 100 by 2014 or 2015. The bank has bought stakes in a number of Chinese financial institutions, such as Shanghai Pudong Development Bank. In early 2012, Citigroup was granted a licence for credit card business, the first time a foreign bank has obtained such a licence in China.
Table II.7. The 10 largest greenfield projects in SIDS, 2011
Host economy Industry Investing company Home economy
Estimated investment ($ million)
Estimated jobs
created
Papua New Guinea Gold ore and silver ore mining Harmony Gold Mining Co Ltd South Africa 3 000 3 000
Mauritius Commercial and institutional building construction Atterbury Property Developments South Africa 1 223 1 102
Mauritius Computer facilities management services Cybernet Software Systems United States 500 3 000
Maldives Residential building construction Tata Housing India 372 2 297
Maldives Residential building construction Tata Housing India 372 2 297
Jamaica Wireless telecommunication carriers LIME United Kingdom 282 97
Bahamas Wireless telecommunication carriers Bahamas Telecommunications Company United Kingdom 282 97
Barbados Wireless telecommunication carriers LIME United Kingdom 282 97
Maldives Accommodation Six Senses Thailand 206 232
Jamaica Water transportation CMA CGM France 100 1 000
Source: UNCTAD, based on information from the Financial Times Ltd, fDi Markets (www.fDimarkets.com).Note: According to the data source, Tata Housing had two identical projects in Maldives.
CHAPTER II Regional Trends in FDI 73
8 See “Outlook hazy for MENA project financing”, Middle East Economic Survey, LIV(52), 26 December 2011.
9 Citigroup, MENA Construction Projects Tracker, November 2011, cited in press articles. See, for example, Construction Week Online, “$133bn worth of KSA projects on hold”, 2 April 2012, www.constructionweekonline.com/article-16262-133bn-worth-of-ksa-projects-on-hold--report. Examples in Dubai include up to 500 property projects that were to be cancelled and about 90,000 units under review, according to the Real Estate Regulatory Agency. There has also been a slowdown in Abu Dhabi’s construction market, as companies cut jobs and postpone projects. Delays have occurred on beachfront apartments, the first office building that will make more energy than it uses and branches of the Louvre and Guggenheim museums.
10 BBVA (Spain) acquired 24.89 per cent of Turkiye Garanti Bankasi for $5.9 billion, and Vallares (United Kingdom) acquired Genel Enerji for $2.1 billion.
11 “Turkey’s policies to draw foreign investments to the country are shifting towards a more sector-specific approach”, 13 January 2012. www.balkans.com.
12 UNCTAD FDI/TNC database.13 UNCTAD estimations based on central banks’ data.14 The rate of return is the ratio of income from FDI to the average
inward FDI stock (average of the inward FDI stock at the ends of the year and the previous year).
15 Based on data from the respective central banks in Argentina and Chile. See: www.bcra.gov.ar/pdfs/estadistica/Anexo%20Estadístico%20IED%2020101231.xls, and www.bcentral.cl/estadisticas-economicas/series-indicadores/xls/IED_sector_pais.xls.
16 The Central Bank of Brazil does not collect data on reinvested earnings.
17 See Economist Intelligence Unit, “Mexico components; second thought”, 13 March 2012, and Investment Properties Mexico, “Mexico’s automotive industry receives billions in foreign investment dollars”, 18 April 2012.
18 Santander, Press Release, “Santander vende su negocio en Colombia al grupo chileno CorpBanca por 1.225 millones de dólares”, 6 December 2011; and El País, “El Santander vende el 7,8 per cent de su filial chilena por 710 millones de euros”, 8 December 2011.
19 See Economist Intelligence Unit, “Latin America finance: Banco Santander retreats”, 7 December 2011.
20 Although some governments maintained certain sectoral policies, in particular for the automotive industry.
21 In 2003 Brazil announced its Guidelines for an Industrial, Technology and Foreign Trade Policy, then in 2008 launched its Productive Development Policy: Innovate and Invest to Sustain Growth. In 2001, Argentina selected nine sectors to support. In 2002, Mexico launched its Economic Policy for Competitiveness, which defined 12 branches to be promoted through sectoral programmes.
22 Other countries focused on the extractive industry, taking a more regulatory approach in order to benefit from soaring global commodity prices and to foster State control over natural resources (see chapter III). Among the latter, some choose to exclusively increase – to different degrees – taxes and royalties in extractive industries (such as Chile, Colombia, Guatemala, Honduras and Peru), others have chosen the paths of contract renegotiations (such as Ecuador and the Bolivarian Republic of Venezuela) and nationalization (such as the Plurinational State of Bolivia, Ecuador and the Bolivarian Republic of Venezuela), extending nationalization in some cases to other sectors of the economy (Bolivarian Republic of Venezuela).
23 In Brazil, the appreciation was taking place in both nominal and real terms, whereas in Argentina, there has been a depreciation
in nominal terms but an appreciation in real terms, owing to a higher level of inflation.
24 In Argentina, the law increasing this margin (law 25.551) has been adopted by the Senate but not yet approved by the Parliament.
25 In other requirements, the automotive manufacturing company must invest at least 0.5 per cent of its gross revenues in innovation and research and development activities within Brazil and must carry out at least 6 of 11 activities in Brazil for at least 80 per cent of its production. This new tax regime is valid for one year, up to December 2012.
26 See Other News, “South American Trade Group Raises Import Tariffs”, 21 December 2011, www.other-news.info.
27 Financial Times, “Peugeot Citroën plans drive on Brazil”, 27 October 2011; Economist Intelligence Unit, “China has become Brazil’s biggest economic partner – and its most difficult one”, 16 January 2012, and “Brazil industry: Cars at any cost”, 26 October 2011, www.eiu.com.
28 Brazil’s Interministerial Ordinance No. 34 provides benefits for a reduction in, or elimination of, taxes relating to production of touch-screen devices that do not have a physical keyboard and weigh less than 750 grams. See AppleInsider, “Foxconn to build 5 new Brazilian factories to help make Apple products”, 31 January 2012, www.appleinsider.com.
29 Volkswagen announced investments of $138 million to boost production of gearboxes for export, while Renault and PSA Peugeot Citroën agreed to boost exports and use more locally made auto parts to reduce their imports. Agriculture machinery makers also announced investment plans: Deere & Co. (United States) said it will start making tractors, combines and parts in Argentina; Fiat (Italy) said it will invest $100 million in a factory to make combines and tractors; and AGCO (United States) has agreed to invest $140 million in a new factory that will produce tractors and motors. (See Farm Equipment, “AGCO to Invest $140 Million in New Argentina Factory”, 21 October 2011, www.farm-equipment.com; Bloomberg, “Porsche Sells Malbec to Keep Autos Coming into Argentina: Cars”, 3 November 2011, www.bloomberg.com).
30 Ministry of Economy and Public Finance, Argentina.31 Georgia ceased to be member of the CIS in 2009. 32 Examples of large transactions include the €835 million
acquisition of a 43 per cent stake in the Russian retail hypermarket chain OOO Lenta by the buyout group TPG Capital (United States), and the €604 million that Unilever (United Kingdom) spent on the Russian cosmetics manufacturer Concern Kalina.
33 Bosnia and Herzegovina, Croatia, Serbia and Ukraine.34 The Czech Republic, Hungary, Slovakia and Slovenia.35 The primary objective of this measure was to contain the rapid
appreciation of the yen.
36 Afghanistan, Angola, Bangladesh, Benin, Bhutan, Burkina Faso, Burundi, Cambodia, the Central African Republic, Chad, the Comoros, the Democratic Republic of the Congo, Djibouti, Equatorial Guinea, Eritrea, Ethiopia, the Gambia, Guinea, Guinea-Bissau, Haiti, Kiribati, the Lao People’s Democratic Republic, Lesotho, Liberia, Madagascar, Malawi, Maldives, Mali, Mauritania, Mozambique, Myanmar, Nepal, the Niger, Rwanda, Samoa, São Tomé and Principe, Senegal, Sierra Leone, the Solomon Islands, Somalia, the Sudan, Timor-Leste, Togo, Tuvalu, Uganda, the United Republic of Tanzania, Vanuatu, Yemen and Zambia.
37 See the table on p. 162 in UNCTAD (2011b).38 Thai Biogas, Press Release, “DPS-TBEC Contract Signing
Ceremony on May 26, 2011, Lao PDR”. Available at: www.tbec.co.th/e_news15.htm (accessed 16 May 2012).
39 “Rwanda: Contourglobal Wins Award for Kivuwatt Project”, 17 February 2012. Available at: www.allAfrica.com.

World Investment Report 2012: Towards a New Generation of Investment Policies74
40 The countries in this group are Afghanistan, Armenia, Azerbaijan, Bhutan, the Plurinational State of Bolivia, Botswana, Burkina Faso, Burundi, the Central African Republic, Chad, Ethiopia, Kazakhstan, Kyrgyzstan, the Lao People’s Democratic Republic, Lesotho, the former Yugoslav Republic of Macedonia, Malawi, Mali, the Republic of Moldova, Mongolia, Nepal, the Niger, Paraguay, Rwanda, Swaziland, Tajikistan, Turkmenistan, Uganda, Uzbekistan, Zambia and Zimbabwe. Sixteen LLDCs are LDCs, and nine are economies in transition.
41 “Country Report: Kazakhstan”, April 2012. Available at: www.eiu.com.
42 “US$1.2 bln upgrade of a PE gas-chemical complex in Uzbekistan”, 2 February 2011. Available at: www.plastemart.com; “Singapore’s Indorama signs Uzbek polyethylene deal”, 10 February 2011. Available at: www.PRW.com.
43 “Indorama launches $30 million textile mill in Kokand”, 27 November 2011. Available at: www.timesca.com.
44 “Govt of Zimbabwe confirms agreement with Essar for revival of Zisco”, 16 December 2011. Available at: www.essar.com.
45 “Government of Zimbabwe and Essar Africa Holdings announce new steel and mining entity”, 3 August 2011. Available at: www.essar.com.
46 Twenty-nine countries (of which eight are LDCs) are included in this group: Antigua and Barbuda, the Bahamas, Barbados, Cape Verde, the Comoros, Dominica, Fiji, Grenada, Jamaica, Kiribati, Maldives, the Marshall Islands, Mauritius, the Federated States of Micronesia, Nauru, Palau, Papua New Guinea, Saint Kitts and Nevis, Saint Lucia, Saint Vincent and the Grenadines, Samoa, São Tomé and Principe, Seychelles, the Solomon Islands, Timor-Leste, Tonga, Trinidad and Tobago, Tuvalu and Vanuatu.
47 The ownership of targeted companies in SIDS often rests outside SIDS, as explained in chapter I (see box I.1). Consequently, reported M&A deals in SIDS often reflect a change in ownership of existing foreign assets in SIDS from one foreign investor to another. Among the six deals in table II.6, four worth $3.3 billion are linked to the United States and Japan as the home economies of targeted companies. The two deals by the United States in the Bahamas involved the same targeted company, Vopak Terminal Bahamas, and the same acquiring company, Buckeye Partners LP. The ultimate ownership of the 100 per cent interest of Vopak Terminal Bahamas belonged to First Reserve Corp. (United States). The second largest deal, by China, was the acquisition of the assets of a Barbados affiliate of GE (United States). Thus, the inflow to Barbados in relation to this transaction was most likely not recorded at all. A similar explanation applies to the fifth deal, by the Republic of Korea, in which KEPCO acquired a 40 per cent interest in Jamaica Public Service Co. Ltd. from Marubeni Corp. (Japan).
48 A joint-venture project between ExxonMobil, including Esso Highlands as operator (33.2 per cent), Oil Search Limited (29 per cent), the Government of Papua New Guinea (16.6 per cent), Santos Limited (13.5 per cent), JX Nippon Oil Exploration (4.7 per cent), Papua New Guinea landowners (2.8 per cent) and Petromin PNG Holdings Limited (0.2 per cent) (www.pnglng.com).
49 Based on personal communication with the Lead Media and Communications Adviser of Esso Highlands, 31 May 2012, in reference to ExxonMobil’s “Financial and Operating Review 2011”, p. 41, www.exxonmobil.com.
50 “Papua New Guinea. Brighter metals prospects”, 8 May 2012.Available at: www.oxfordbusinessgroup.com/economic_updates; Economist Intelligence Unit, “Country Report: Papua New Guinea”, April 2012. Available at: www.eiu.com.