uncovering gems in an undervalued market - … dotcom ... hub at kuala lumpur international airport...
TRANSCRIPT

Brought to you by
UncoveringGems In AnUndervalued
Market
CONTENT PAGE
Introduction ................................................05
AirAsia ........................................................... 06
Berjaya Food ...............................................09
British American Tobacco ......................11
Bursa Malaysia ...........................................13
CAB Cakaran ...............................................15
Carlsberg Brewery Malaysia ..................18
CB Industrial Product ...............................20
Century Logistics .......................................23
Cypark Resources .....................................25
Dutch Lady Milk .........................................28
Econpile ........................................................ 31
Gadang Holdings .......................................34
GD Express Carrier ...................................36
Genting Berhad .........................................39
Hartalega .....................................................41
Heineken Malaysia ...................................44
Hock Seng Lee ............................................47
Homeritz Corporation .............................49
IHH Healthcare ..........................................52
CONTENT
CONTENT PAGE
IQ Group Holdings ....................................55
Karex .............................................................58
Kawan Food ................................................60
Kimlun Corporation ..................................62
Kossan Rubber Industries ................65/68
LBS Bina .......................................................70
London Biscuits Berhad ..........................73
MMC Corporation .....................................75
Malaysia Airport Holdings ......................78
Nestle (Malaysia) .......................................80
OCK Group ..................................................82
OKA Corporation .......................................84
Press Metal .................................................87
Signature International ...........................90
Sime Darby ..................................................93
Spritzer .........................................................95
Tek Seng Holdings ....................................97
Telekom Malaysia .....................................99
TIME dotCom ...........................................102
Top Glove..........................................104/106
Tune Protect Group ................................108

Bursa Malaysia Berhad (“Bursa Malaysia”) has engaged Shares Investment to produce this report. The research in this report was conducted independently by Shares Investment and the views and opinions expressed in this report are Shares Investment’s own and do not represent the views and opinions of Bursa Malaysia. Bursa Malaysia does not warrant or represent, expressly or impliedly as to the accuracy, completeness and currency of the information in this article. In no event shall Bursa Malaysia be liable to the reader or any other third party for any claim howsoever arising out of or in relation to this article.
This is not a recommendation to purchase or sell any of the mentioned securities. The infor-mation contained herein are the opinions and ideas of the authors and is strictly for educational purposes only. This information should not be construed as and does not constitute financial, in-vestment or any other form of advice. Any investment involves substantial risks, including complete loss of capital. Every investor has different strategies, risk tolerances and time frames. You are advised to perform your own independent research or to contact a licensed professional before making any investment decisions.
There are no warranties, expressed or implied, as to the accuracy, completeness, or results obtained from any information set forth herein. Shares Investment and Bursa Malaysia, its related and affiliate companies and/or their employees shall in no event be held liable to any party for any direct, indirect, punitive, special, incidental, or consequential damages arising directly or indirectly from the use of any of this material.
All content and materials on this report are the exclusive property of Shares Investment or its content suppliers, and may be downloaded or printed for your own personal and non-commercial use only. Any content may not be copied, reproduced, distributed, republished, reposted, modified, transmitted, made available to the public, adapted, created into a derivative work or otherwise used or exploited for any purpose.
Disclaimer
Uncertainty appears to be the new norm these days and you should really get used to expecting the unexpected. Surely, most of you did not foresee the shocking Brexit vote or the surprise win by Donald Trump at the US presidential elections.
If you had been looking at the stock markets in the past year, you would likely agree that it has been a pretty bumpy ride. With all the noises in the market, where should you be seeking out investments?
To help you make better-informed decisions, this report features a wide range of companies listed on the Bursa Malaysia. We handpicked 42 companies, did extensive research on their core businesses and wrote each article to help you quickly understand them through a series of brief intros and financial insights.
Amongst these featured companies, you are likely to find some hidden gems that would make a good addition to your portfolio. So read on to find out more.
• Shares Investment Equities Research Team
• Shares Investment Translation Team
[email protected] Visit Shares Investment for more investment research material at : http://www.sharesinv.com
1 December 2016
Introduction
5
Stock Short Name:
Code:
YTD Return (as at 3 Nov):
Year-To-Date Gains
BY: JOEY HO
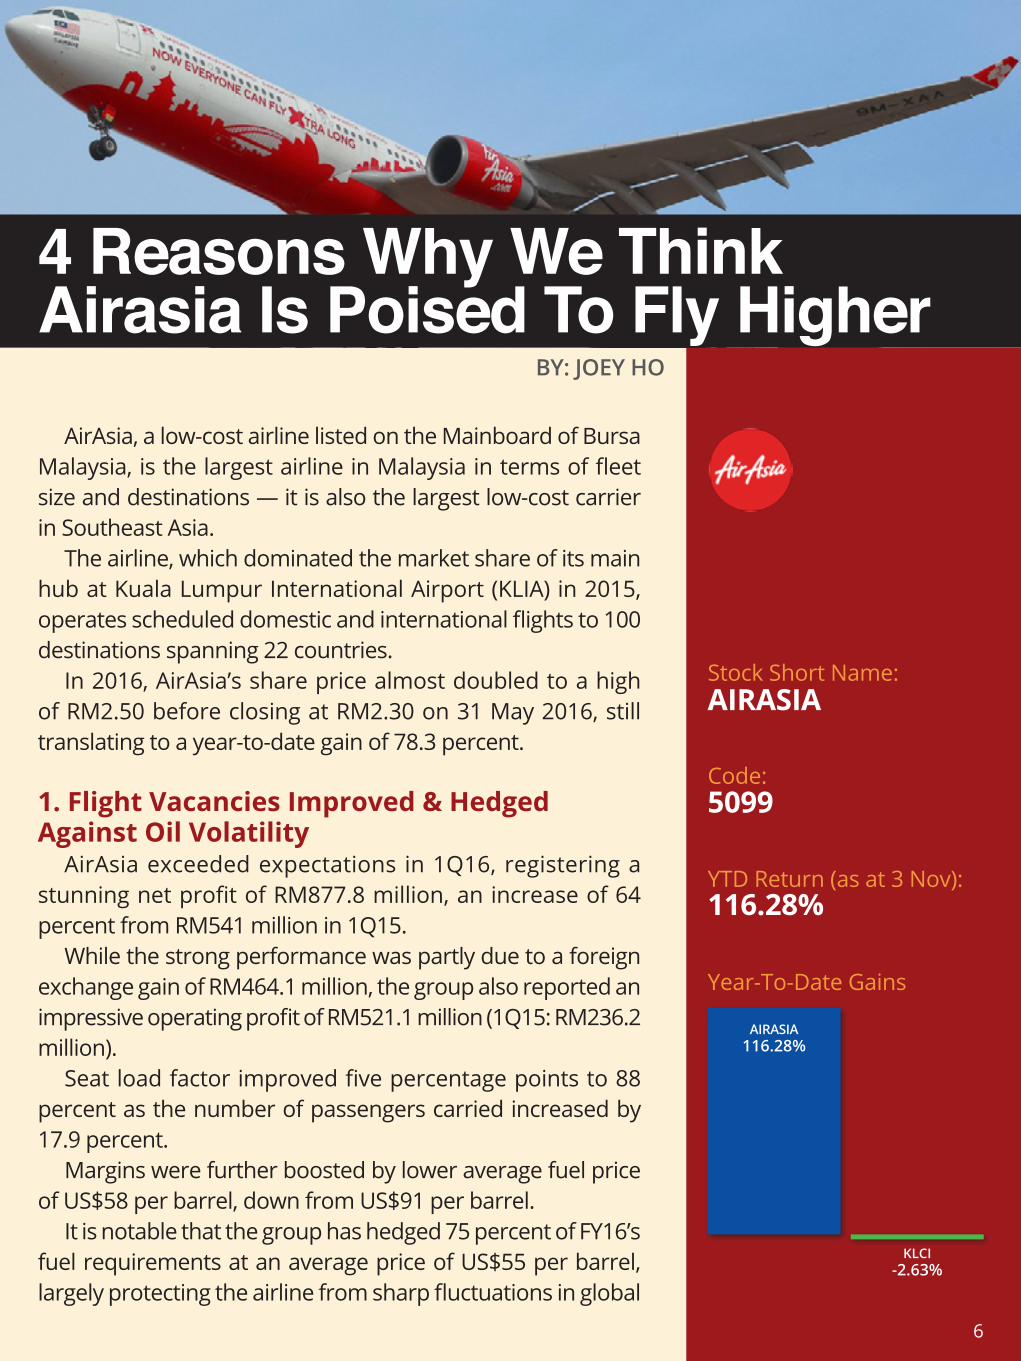
AirAsia, a low-cost airline listed on the Mainboard of Bursa Malaysia, is the largest airline in Malaysia in terms of fleet size and destinations — it is also the largest low-cost carrier in Southeast Asia.
The airline, which dominated the market share of its main hub at Kuala Lumpur International Airport (KLIA) in 2015, operates scheduled domestic and international flights to 100 destinations spanning 22 countries.
In 2016, AirAsia’s share price almost doubled to a high of RM2.50 before closing at RM2.30 on 31 May 2016, still translating to a year-to-date gain of 78.3 percent.
1. Flight Vacancies Improved & Hedged Against Oil Volatility
AirAsia exceeded expectations in 1Q16, registering a stunning net profit of RM877.8 million, an increase of 64 percent from RM541 million in 1Q15.
While the strong performance was partly due to a foreign exchange gain of RM464.1 million, the group also reported an impressive operating profit of RM521.1 million (1Q15: RM236.2 million).
Seat load factor improved five percentage points to 88 percent as the number of passengers carried increased by 17.9 percent.
Margins were further boosted by lower average fuel price of US$58 per barrel, down from US$91 per barrel.
It is notable that the group has hedged 75 percent of FY16’s fuel requirements at an average price of US$55 per barrel, largely protecting the airline from sharp fluctuations in global
4 Reasons Why We Think Airasia Is Poised To Fly Higher
AIRASIA
5099
116.28%
AIRASIA116.28%
KLCI-2.63%
6
CONTENT PAGE
oil prices.Crude oil price is hovering slightly below
US$50 per barrel as at 2 June 2016.
2. Aircraft Leasing UnitFollowing the strong performance in 1Q16,
AirAsia had another piece of good news to share.
While the airline intends to divest the unit, which had 43 A320s in its fleet as of the end of March, at some point, the offer needs to be discussed further with the board.
In recent years, as airlines serving the Asia-Pacific region seek to triple their fleet, many are finding that it could be cheaper to lease instead of buying them.
This has led to the rise of leasing businesses which could be more profitable than operating an airline, prompting conglomerates to enter the industry.
The announcement after BOC Aviation, Asia’s biggest aircraft lessor with more than 100 planes leased out to airlines around the world, is slated to start trading in Hong Kong after a US$1.1 billion initial public offering.
3. 35.7% Market Share at Malaysia’s Largest and Busiest KLIA
KLIA, which is operated by Malaysia Airports Holdings (MAH), is currently the largest and busiest airport in Malaysia, and also the world’s 23rd busiest airport by total passenger traffic.
In May 2016, MAH launched the KLIA Aeropolis as part of its five-year business plan, Runway to Success 2020.
The plan is aimed at transforming an area of roughly 100 square kilometres around KLIA into an airport city which is expected to contribute RM30 billion to the nation’s gross domestic product over a 15 year period,
excluding airport terminal operations.Key projects that would be set up in the
airport city include a theme park, hotel, and cargo and logistics park.
MAH has already signed agreements with well-known names such as German logistics company DHL, Malaysian manufacturing and distribution firm DRB-Hicom and AirAsia to develop cargo facilities.
AirAsia currently holds 35.7 percent of the market share at KLIA, carrying 17.5 million passengers in 2015.
Including its subsidiaries, the group holds a strong lead with close to 50 percent of the total number of passengers carried and is set to benefit strongly from the development, which is expected to drive more business investments and tourist traffic to Malaysia.
4. Senai International Airport Expansion Boosted Tourism
In 2015, Senai International Airport (Senai Airport) served 2.6 million passengers.
While the numbers pale in comparison against KLIA, it is notable that this figure almost doubled the total volume in five years ago.
On 29 May 2016, AirAsia will launch services to Guangzhou, making it the first direct flight to China from Senai Airport.
The airline, which already flies to Hat Yai and Bangkok from Senai Airport, has its sights on more direct flights to India, Myanmar, and the Philippines.
With the introduction of the new direct route to Southern China, the Johor government aims to achieve one million tourist arrivals from China in 2016.
Last year, tourist arrivals from China grew to 797,862 from 628,087 in 2014 after the government waived visas.
Previously, without direct flights from China,
7
CONTENT PAGE
Chinese tourists visited Johor Bahru via KLIA or Changi Airport in Singapore.
AirAsia’s plans to boost connectivity at Senai Airport holds great potential as Malaysians travelling on available routes would not need to cross over to Singapore.
Given the strength of the Singapore dollar, the move is also likely to attract more Singaporeans to use the Senai Airport as their gateway to popular holiday destinations in Southeast Asia.
ValuationBased on the last closing price on 31 May
2016, AirAsia shares currently trade at a price-to-earnings ratio (P/E) of 11.8 times.
A peer in the low-cost carrier industry, Tiger Airways Holdings, last closed at S$0.46 on 4 March 2016 equivalent to a P/E of 143.8 times, before it was taken private by Singapore’s flag carrier, Singapore Airlines.
The flag carrier’s shares are currently trading at a PER of 15.5 times based on the last closing price of S$10.68 on 31 May 2016.
Given the low valuations and strong earnings potential ahead, we believe that AirAsia’s shares should be trading at higher valuations. Currently, the average street target price stands at RM3.06, presenting the potential for an approximate 33 percent upside.
8
Stock Short Name:
Code:
YTD Return (as at 3 Nov):
Year-To-Date Gains
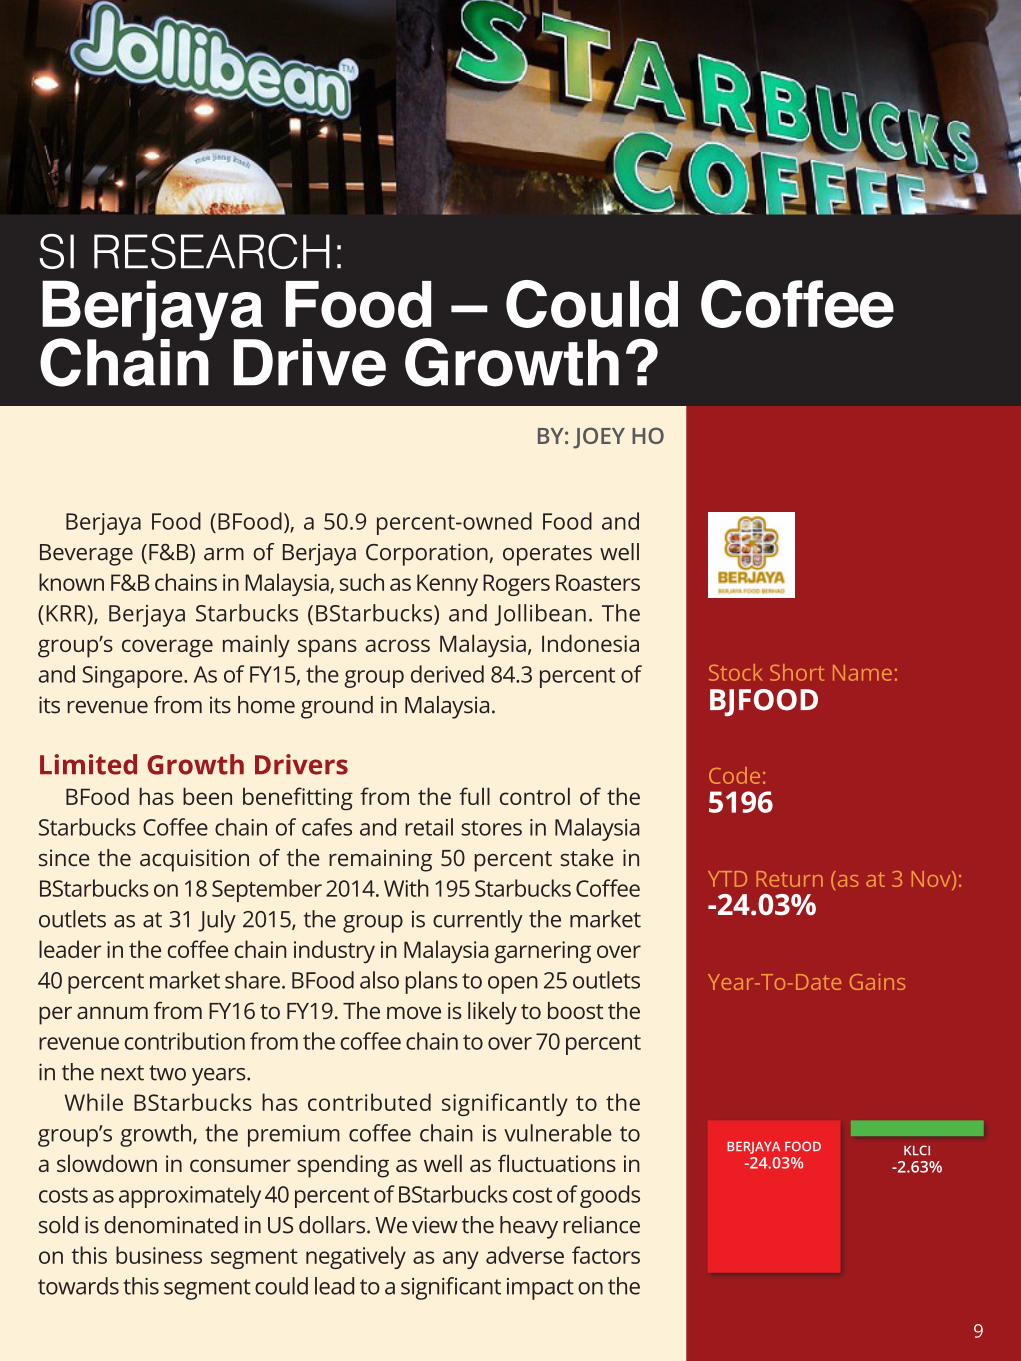
SI RESEARCH:Berjaya Food – Could Coffee Chain Drive Growth?
BY: JOEY HO
Berjaya Food (BFood), a 50.9 percent-owned Food and Beverage (F&B) arm of Berjaya Corporation, operates well known F&B chains in Malaysia, such as Kenny Rogers Roasters (KRR), Berjaya Starbucks (BStarbucks) and Jollibean. The group’s coverage mainly spans across Malaysia, Indonesia and Singapore. As of FY15, the group derived 84.3 percent of its revenue from its home ground in Malaysia.
Limited Growth DriversBFood has been benefitting from the full control of the
Starbucks Coffee chain of cafes and retail stores in Malaysia since the acquisition of the remaining 50 percent stake in BStarbucks on 18 September 2014. With 195 Starbucks Coffee outlets as at 31 July 2015, the group is currently the market leader in the coffee chain industry in Malaysia garnering over 40 percent market share. BFood also plans to open 25 outlets per annum from FY16 to FY19. The move is likely to boost the revenue contribution from the coffee chain to over 70 percent in the next two years.
While BStarbucks has contributed significantly to the group’s growth, the premium coffee chain is vulnerable to a slowdown in consumer spending as well as fluctuations in costs as approximately 40 percent of BStarbucks cost of goods sold is denominated in US dollars. We view the heavy reliance on this business segment negatively as any adverse factors towards this segment could lead to a significant impact on the
BJFOOD
5196
-24.03%
BERJAYA FOOD-24.03%
KLCI-2.63%
9
CONTENT PAGE
group’s overall earnings.
Dragged Down By Supplementary Segments
Despite a top line growth of 67.1 percent or RM166.7million in 9M16, the latest results fell short of expectations given that an approximate six months contribution from BStarbucks boosted FY15 top line by RM226.4 million. The disappointment was attributed to the group’s supplementary segments.
KRR chain of restaurants in Malaysia recorded negative same store sales growth (SSSG) of 19.4 percent in Malaysia as consumer spending softened following the introduction of goods and services tax as well as the steep depreciation of the Malaysian ringgit. While the group’s Jollibean business in Singapore experienced a negative SSSG of 5.5 percent year-on-year. Operations in both Indonesia and Singapore ended in the red for 9M16 with losses of RM4.2 million and RM0.5 million respectively.
Given the lack of growth catalysts in the two struggling overseas segments, we do not expect a significant recovery in the near term.
Risky Financial PositionThe group’s aggressive expansion has
weakened its financial position. Based on 9M16’s balance sheet, the group’s current ratio stood at 0.6 times. Of the group’s current assets, cash and bank balances of RM36.2 million made up only 30.8 percent. While the debt to total asset ratio stood at 0.47 as of 9M16, it is notable that intangible assets made up 60.7 percent of the group’s total assets.
In addition, net cash inflows from operations in recent years have been insufficient in covering the required capital expenditure, resulting in negative free cash flows since
FY13. Consequently, BFood’s finance costs rose rapidly from a clean slate in FY13 to RM8.9 million in FY15 and tallying with an interest coverage of 4 times as of 9M16.
Demanding ValuationsAs of 18 April 2016, Berjaya Food’s shares
closed at RM1.92, down 34.2 percent from its 52 week high of RM 2.92. Based on the latest FY15 results, the group’s shares are currently valued at a price-to-earnings ratio (P/E) of 3.9 times, including significant re-measurement gains of RM160.5 million. Excluding the one-off gains, the shares would be trading at a P/E of 42.3 times, while the consumer sector P/E is currently pegged at approximately 25 times.
In view of the heavy reliance on a single business segment, loss making supplementary segments as well as the deteriorating financial position, we prefer to stay on the sidelines for now. It is likely that BFood will need to reverse the supplementary segments into the black and show strong growth in its coffee chains before it regains its attractiveness.
10

Stock Short Name:
Code:
YTD Return (as at 3 Nov):
Year-To-Date Gains
SI RESEARCH:British American Tobacco (Malaysia) – Headwinds Blowing On An Expensive Puff
BY: SUA XIU KAI
British American Tobacco (Malaysia) (BAT), the leading manufacturer and distributor of cigarettes in Malaysia which is principally engaged in the manufacture, importation and sale of cigarettes, pipe tobaccos and cigars, should be no stranger to investors. BAT distributes its products under a portfolio of different popular cigarette brands such as Lucky Strike, Kent, Dunhill and Pall Mall and holds more than 60 percent legal market share in Malaysia.
In recent times, we have seen BAT at the receiving end of some policies by the Malaysian government to curb the consumption of cigarettes. Due to the negative nature of the products sold by the group, the industry is getting more challenging by the day, and we look at how BAT is coping in such uncertain times.
Unfavorable Government Policies, Illegal Cigarettes On The Rise
In November 2014, the tobacco industry was hit by a 12 percent increase in cigarette excise tax and shortly after in November 2015, the Malaysian government further increased cigarette taxes by more than 40 percent.
This was a move which the group described as an “unprecedented massive increase in cigarette excise”, which came after the implementation of the Goods and Services Tax at 6 percent on 1 April 2015, the group had to increase its prices of its brands after taking into consideration the sum
BAT
4162
2.40%
BRITISH AMERICAN TOBACCO
2.40%
KLCI-2.63%
11

CONTENT PAGE
mandated by the excise increase and its impact on GST and inflationary cost pressure.
The increase in cigarette excise, which ultimately led to the increase in prices, also gave rise to another problem, the expansion of the already large number of illegal cigarettes in the market. According to the Illicit Cigarette Study 2012 by the Confederation of Malaysian Tobacco Manufacturers, every 1 out of every 3 packs of cigarettes sold in Malaysia are smuggled, for which taxes/duties are evaded.
With the rise in excise tax and illegal cigarettes, the group is bound to get affected especially in its sales volume and the impacts can already be felt from the moment the tax hike was exercised. Domestically, the group manufactured 8.2 billion sticks of cigarettes in FY14 and 7.2 billion sticks in FY15, a drop of around 12 percent.
This could imply that consumers are hanging in their habits but are substituting it with cheaper alternatives, as from June to August 2015 the volume of illegal cigarettes increased by 0.2 percentage points quarter by quarter. Do note that illegal can be purchased from RM4 to RM5, significantly cheaper than the group’s cigarettes which retail at RM15 to RM18 after the tax hike.
Ceasing Malaysian Manufacturing, Tougher Times Ahead
On 18 March 2016, the group unexpectedly announced the plans to shut down its plants in Petaling Jaya, Selangor, citing the increasingly challenging business environment. Going forward, the group will source tobacco products from its factories regionally for the Malaysian market.
Though the disposal of the manufacturing plant in Malaysia can be seen as a positive
move to protect the company’s interest in an increasingly challenging industry, it indirectly affirms the pessimistic view of the outlook of the tobacco sector which has already been heavily battered by high excise tax and significant trading of illegal cigarettes.
With volume growth anticipated to decline, the increasingly challenging environment requires the company to restructure and transforms its business, which apart from the winding of factory operations; include the sharpening of its commercial capabilities whilst optimizing the supply chain and transactional activities to ensure that the group remains competitive as a market leader.
Historically, the group has been consistently issuing dividends with dividend yield ranging from 4.4 percent to 5.7 percent in the past 6 years. However, in view of the pessimistic market outlook and future earnings expected to contract, investors should keep a lookout for signs of whether BAT is able to maintain its dividend policy.
With a mean street price of RM59.55, it provides little upside to its current price of RM55.30 as of 23 March 2016. With the market split between “Hold” calls and “Sell” calls, we feel that it is best that investors stay clear of this expensive puff of smoke for now, as it will not just be harmful to your health, it might be detrimental to your portfolio too.
12
Stock Short Name:
Code:
YTD Return (as at 3 Nov):
Year-To-Date Gains
SI RESEARCH:Bursa Malaysia – Holding Up In Challenging Times
BY: SUA XIU KAI
Bursa Malaysia (Bursa), is the stock exchange operator of Malaysia and just like any stock exchanges around the world such as the New York Stock Exchange, Tokyo Stock Exchange and Singapore Stock Exchange, Bursa is in an industry where it possesses a strong economic moat in the form of strict regulations, and it being the only stock exchange in the country.
Economic moat, a term coined and popularized by billionaire investor Warren Buffett, refers to a business’s competitive advantage that it has over its competitors and new entrants and can be derived in the form of branding, regulation, technological capabilities and economies of scale.
Having established the fact that Bursa practically holds a monopoly position in Malaysia, where strong regulations has made it very tough for new entrants to challenge its position in the market, we look at its recent performance to see if it has lived up to expectations.
Past Growth Tapers To Flattish ResultsFrom FY09 to FY13, Bursa has enjoyed relatively strong gains
in its operating revenue with a Compound Annual Growth Rate (CAGR) of 10.24 percent. At FY09, its operating revenue stood at RM297.8 million and by FY13 it has risen substantially to RM439.8 million.
The same trend for operating revenue was also reflected on Bursa’s net earnings. FY10 recorded a net profit of RM113 million and has risen significantly to RM198.2 million in FY14.
BURSA
1818
2.40%
BURSA MALAYSIA2.40%
KLCI-2.63%
13
CONTENT PAGE
However, the upward trend seems to be a thing of the past when Bursa released its FY15 results earlier this month.
For FY15, Bursa’s operating revenue increased just 3.4 percent to reach RM487.7 million and net profits had a meagre increment of just 0.19 percent to RM198.6 million.
Investors may be wondering what could have happened to bring such a powerhouse with relatively strong performances and strong economic moats to report such flattish results. We found some possible explanations in a part of its financial statements, where it commented about seasonal or cyclical factors:
“The Group’s performance is not affected by any seasonal or cyclical factors but is affected by the activities in the Securities and Derivatives Markets”
Just like all stock exchanges, Bursa has a non-cyclical business model which makes money when companies get listed and when traders perform transactions, regardless of buy or sell. Therefore the flattish results in recent years were actually due to the slowdown in growth of capital market activities.
Lacklustre Results All ExpectedThe lacklustre growth in revenue and net
earnings of Bursa due to the softening of trading activities were actually within the expectations of many brokerage houses in view of many factors in the Malaysian economy.
In recent years, the Malaysian economy has been dealt several blows from plunging commodities prices, weaker Malaysian ringgit, and market sentiments have been depressed by broad macro uncertainties such as the slowdown of China and further potential outflow in foreign funds.
IPO Pipeline Running DryOther than the softening of trading activities,
the weak sentiments of the Malaysian economy has also impacted another source of Bursa’s income, which is from the listing of companies, which allows Bursa to collect listing fees and also benefit from the trading of share of the new listed counters.
In 2015, Bursa had 11 initial public offerings (IPO) as compared to 15 in 2014, and this is of no surprise with investors’ sentiment at a low. Bursa also saw 5 notable IPOs which were planned but ultimately did not materialise – Sime Darby Motors, Edra Global Energy, Weststar Aviation Services, Qualitas Healthcare Corporation and Asian Healthcare Group.
In the beginning of 2016, the delay in the RM637.5 million IPO of energy and water group Ranhill Holdings did no favours in curbing the jitters for investors in what was once the most popular destination in the region.
All in all, Bursa has been hit in recent years mainly due to the slowdown in the growth in trading activities as well as the decrement and delays in IPOs. Moving forward, investors should remain cautious and continue keeping track of the political and economic stability in Malaysia, which will directly translate to investors’ sentiments to the market and affect their trading volume. However on a positive note, the management of Bursa has stated that they expect more active trading of the derivatives market, spurred by volatility in commodity prices.
As of 23 February 2016, Bursa is trading at a P/E of 22.97x and is already trading near its average target price of RM8.66. We believe that any upside will only come in tandem with market optimism affected by the global economy outlook as well as local stability.
14
Stock Short Name:
Code:
YTD Return (as at 3 Nov):
Year-To-Date Gains
BY: JOEY HO
CAB Cakaran Corporation (CAB), a leading integrated poul-try producer based in Malaysia, also engages in businesses such as supermarkets, food products manufacturing and fast food outlets. As of FY15, the group’s largest segment was the integrated poultry farming and processing division, making up 78.7 percent of total revenue and 97.1 percent of the group’s consolidated segment profit.
Strong Double-Digit Growth and Improved Sales
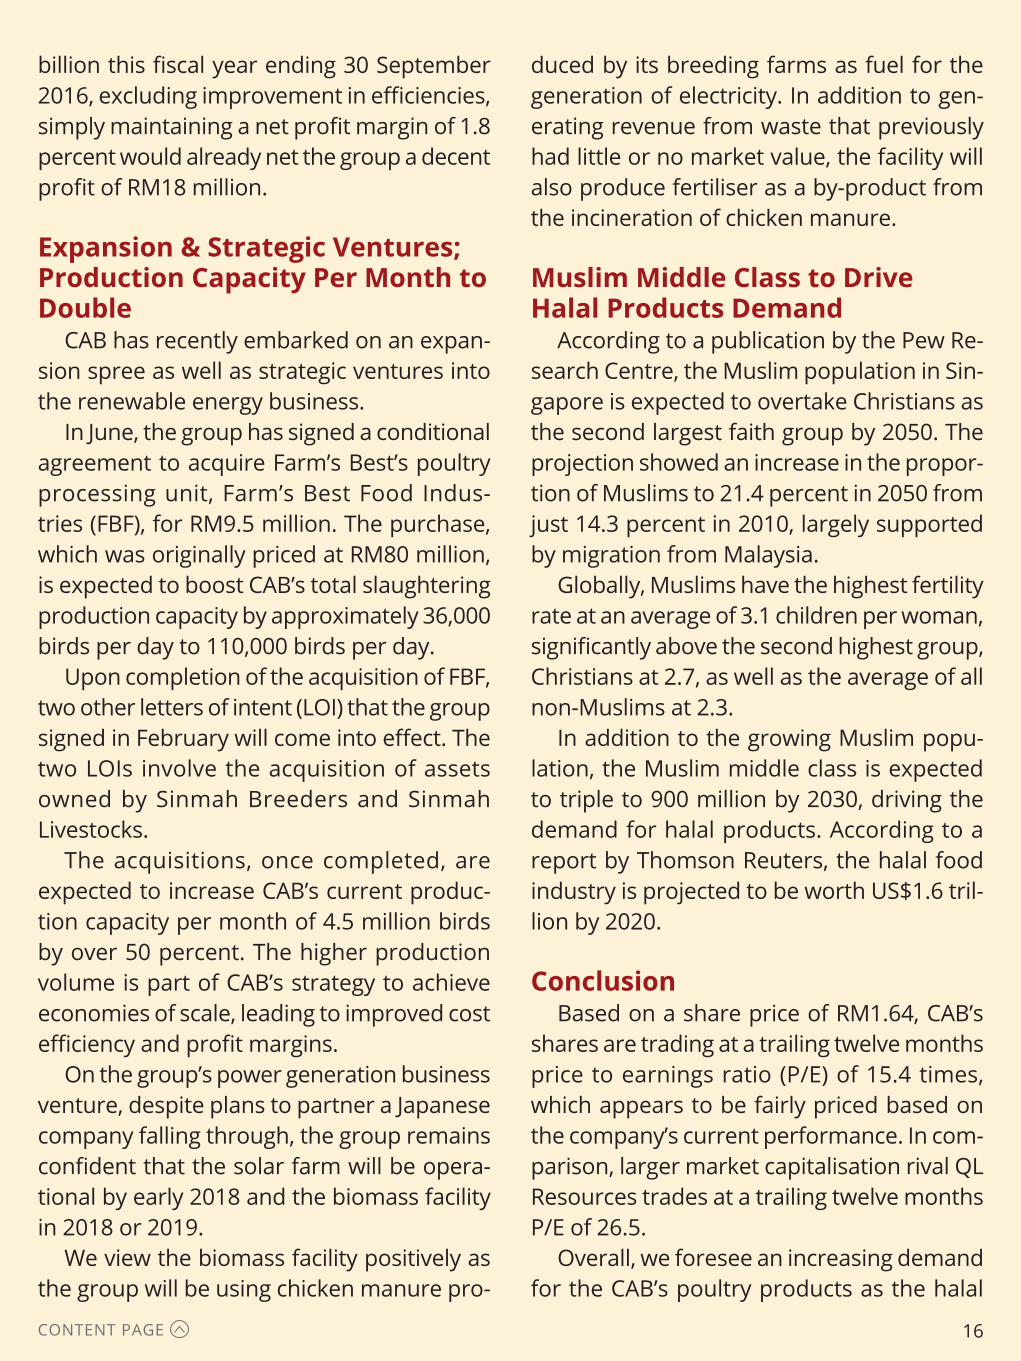
CAB has registered strong double-digit growth in its revenue while net profit experienced some fluctuations from FY11 to FY15. Despite the poorer bottom line in FY12, the compounded annual growth rate for its revenue and net profit registered a decent 16.1 percent and 6.2 percent respectively. For 9M16, the group reported revenue of RM793.4 million, placing it on track to achieve a record revenue of RM1 billion for FY16.
CAB Cakaran Corporation – Future Muslim Middle Class To Drive Growth
CAB Cakaran 9M16 FY15 FY14 FY13 FY12 FY11Revenue (RM’m) 793.4 891.7 672.4 609 534.6 491
Net Profit (RM’m) 7.2 16 11.2 11.9 -3 12.6
Net Profit Margin (%) - 1.8 1.7 2 - 2.6
Return On Equity (%) - 10.4 6.9 8.6 1.1 13.7
While CAB’s net profit margin levels have not been too impressive, the group expects to see an improvement in net profit for FY16 supported by better sales of broiler meat and improved efficiency in the management of breeder and broiler farms.
Should the group be able to achieve revenue of RM1
CAB
7174
2.55%
CAB CAKARAN CORPORATION
2.55%
KLCI-2.63%
15
CONTENT PAGE
billion this fiscal year ending 30 September 2016, excluding improvement in efficiencies, simply maintaining a net profit margin of 1.8 percent would already net the group a decent profit of RM18 million.
Expansion & Strategic Ventures; Production Capacity Per Month to Double
CAB has recently embarked on an expan-sion spree as well as strategic ventures into the renewable energy business.
In June, the group has signed a conditional agreement to acquire Farm’s Best’s poultry processing unit, Farm’s Best Food Indus-tries (FBF), for RM9.5 million. The purchase, which was originally priced at RM80 million, is expected to boost CAB’s total slaughtering production capacity by approximately 36,000 birds per day to 110,000 birds per day.
Upon completion of the acquisition of FBF, two other letters of intent (LOI) that the group signed in February will come into effect. The two LOIs involve the acquisition of assets owned by Sinmah Breeders and Sinmah Livestocks.
The acquisitions, once completed, are expected to increase CAB’s current produc-tion capacity per month of 4.5 million birds by over 50 percent. The higher production volume is part of CAB’s strategy to achieve economies of scale, leading to improved cost efficiency and profit margins.
On the group’s power generation business venture, despite plans to partner a Japanese company falling through, the group remains confident that the solar farm will be opera-tional by early 2018 and the biomass facility in 2018 or 2019.
We view the biomass facility positively as the group will be using chicken manure pro-
duced by its breeding farms as fuel for the generation of electricity. In addition to gen-erating revenue from waste that previously had little or no market value, the facility will also produce fertiliser as a by-product from the incineration of chicken manure.
Muslim Middle Class to Drive Halal Products Demand
According to a publication by the Pew Re-search Centre, the Muslim population in Sin-gapore is expected to overtake Christians as the second largest faith group by 2050. The projection showed an increase in the propor-tion of Muslims to 21.4 percent in 2050 from just 14.3 percent in 2010, largely supported by migration from Malaysia.
Globally, Muslims have the highest fertility rate at an average of 3.1 children per woman, significantly above the second highest group, Christians at 2.7, as well as the average of all non-Muslims at 2.3.
In addition to the growing Muslim popu-lation, the Muslim middle class is expected to triple to 900 million by 2030, driving the demand for halal products. According to a report by Thomson Reuters, the halal food industry is projected to be worth US$1.6 tril-lion by 2020.
ConclusionBased on a share price of RM1.64, CAB’s
shares are trading at a trailing twelve months price to earnings ratio (P/E) of 15.4 times, which appears to be fairly priced based on the company’s current performance. In com-parison, larger market capitalisation rival QL Resources trades at a trailing twelve months P/E of 26.5.
Overall, we foresee an increasing demand for the CAB’s poultry products as the halal
16

CONTENT PAGE
market maintains its rapid expansion. In ad-dition, the group’s effort to improve efficien-cies, as well as the venture into the renewable energy business, is likely to improve margins in the medium term. Given the strong earn-ings potential ahead, investors could see more value in CAB should the group’s plan to announce an official dividend policy by the end of September materialise.
17
Stock Short Name:
Code:
YTD Return (as at 3 Nov):
Year-To-Date Gains
SI RESEARCH:Carlsberg Brewery Malaysia – Still Brewing Steadily
BY: JOEY HO
Carlsberg Brewery Malaysia (Carlsberg) was founded in 1969 as part of the Carlsberg Group’s venture into the Southeast Asian market. To-date, the group has been brewing the Carlsberg Green Label Beer for over 40 years. Over the years, the group has also diversified its brands from a single flagship beer brand to a dynamic portfolio of international premium brews and strong local power brands. As of FY15, the group depended heavily on Malaysia, which contributed 64.1 percent of the total revenue.
Weakened Local CurrencyIn FY15, revenue from Singapore grew by 31.8 percent,
offsetting an RM143.3 million decrease in revenue from Malaysia. The lion city’s share of revenue contribution also climbed to 32.9 percent from just 25.3 percent in FY14.
During the same period, the Malaysian ringgit plunged sharply against the Singapore dollar to as low as over three ringgit per Singapore dollar from around RM2.65 in January 2015. While the decline in the local currency benefits export gains, the strongest momentum only began in August. It is likely that such foreign exchange movements only contributed to approximately 10 percent of the revenue growth and the remaining 21.8 percent is likely to be demand driven growth.
Main Markets Hit By HeadwindsCarlsberg boasts a strong market share in the two main
CARLSBG
2836
21.88%
CARLSBERG BREWERY MALAYSIA
21.88%
KLCI-2.63%
18
CONTENT PAGE
geographical segments, Malaysia and Singapore, which contributed a combined 97 percent of total revenue in FY15. The group claims to be the market leader in Malaysia with a share of the Malaysian beer market in excess of 50 percent, while holding second place in market position in Singapore with a market share of 18 percent.
The group has faced a series of headwinds in Malaysia. In March 2016, the Malaysian government revised the existing tax structure for alcoholic beverages which led to a hike in the price of beer by approximately 10 percent. The move comes close to a year after the government implemented a six percent Goods and Services Tax in April 2015. Breweries are likely to report thinner margins in the coming year as they absorb part of the taxes. In addition, breweries are likely to face a stronger competition from contraband beer following the increase in price of beer.
The largest export market, Singapore, saw a Liquor Control (Supply and Consumption) Act which came into force in April 2015 in a bid to minimise public disorder. Under the law, drinking in public places as well as retail sales of alcoholic beverages have been regulated, with stricter rules implemented for popular drinking zones such as Geylang and Little India.
Stable Financial RatiosDespite the headwinds in FY15, the group’s
return on equity (ROE) dipped just 3.9 percentage points to 65.6 percent maintaining an impressive ROE of over 60 percent since FY12.
In FY15, the group paid out a dividend of RM217.1 million, up RM30.6 million from RM186.5 million in FY14. The group also spent RM29.9 million more on the acquisition of property, plant and equipment as part of its investing activities. Due to the higher dividend and capital expenditure, cash and cash
equivalents fell by 53.4 percent to just RM41 million. However, it is notable that despite the lower cash balance, the group still maintains a current ratio of 1.3 times.
In FY15, the group generated an operating profit of RM267.5 million against finance costs of just RM6.8 million, equating to a high interest coverage ratio of over 39 times. Carlsberg’s debt ratio stood strong at 0.48 times, with total assets of RM661.7 million against total liabilities of RM319.2 million. In addition, current assets of RM410.7 million made up a significant 62.1 percent of the group’s total assets.
We view the group’s healthy ratios positively as it will provide much resilience in difficult times.
RisksWhile the weakened Malaysian Ringgit
has been favorable to the group’s exports which currently makes up approximately 35.9 percent of its total revenue, unforeseen foreign exchange movements could lead to volatility in the group’s earnings.
New laws such as the Liquor Control (Supply and Consumption) Act in Singapore could potentially affect the demand and availability of alcoholic drinks. The group’s performance could be negatively affected in the unlikely event that new rules come into force.
Going forward into FY16, domestic consumption in Malaysia is expected to weaken following the price hike, while Singapore operations and exports sales would be the growth driver to support weaker domestic sales. Export sales will also benefit from the new contract starting FY16 with the group’s Hong Kong affiliate.
Carlsberg’s shares closed at RM13.98 on 31 March 2016. Currently, the average street target price stands at RM13.80.
19
Stock Short Name:
Code:
YTD Return (as at 3 Nov):
Year-To-Date Gains
BY: SUA XIU KAI
As the strongest El Nino phenomenon in almost two de-cades ravaged agricultural production and squeezed inven-tories throughout growers across the globe, we have seen unprecedented fluctuations in commodity prices.
With the recent uptrend in crude palm oil price, brought by the contraction in supply due to unfavourable weather condi-tions and spurring new investments by plantation companies to boost palm oil production, we have identified one Malaysian firm associated with the palm oil business which will fare well.
Today, we zoom in on CB Industrial Product Holding (CBIP) to have a closer look at how this palm oil construction and engineering firm is expected to be able to excel in the highly volatile crude palm oil industry.
What Is CBIP?Established in the 1980s, CBIP is primarily involved in three
main business segments: Palm oil engineering; special pur-pose vehicle retrofitting; and oil palm plantation and milling. It is also the first publicly-listed player in the palm oil engineering sector globally.
The group’s main markets are centralised in Indonesia, Ma-laysia and the African/Central American region. CBIP is also the joint-holders of the Modipalm Continuous Sterilization (MCS) milling system through its wholly-owned subsidiary, Modipalm Engineering, together with the Malaysian Palm Oil Board.
With the MCS milling system patent in hand, CBIP is able
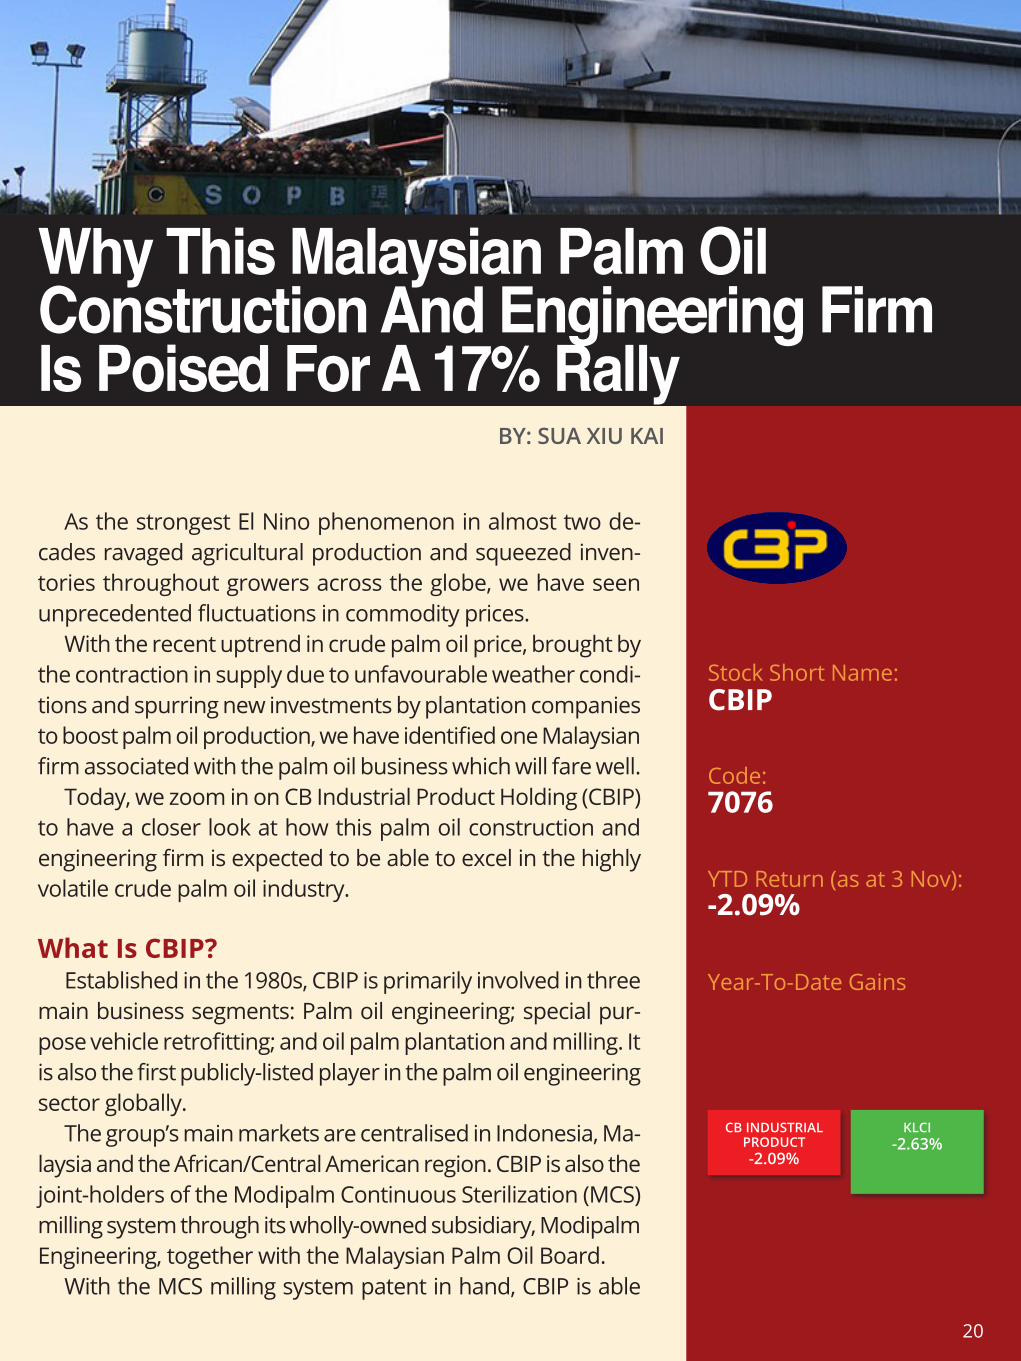
Why This Malaysian Palm Oil Construction And Engineering Firm Is Poised For A 17% Rally
CBIP
7076
-2.09%
CB INDUSTRIAL PRODUCT-2.09%
KLCI-2.63%
20
CONTENT PAGE
to be a one-stop centre for the design, sup-ply, construction and installation of palm oil mills with the capacity to undertake turnkey projects of various sizes, both MCS mills and conventional mills, ranging from capacities of five-tonnes per hour to 120-tonnes per hour.
Backed by the various benefits brought by its patented technology, which ranges from automation of palm oil mills and cost savings in the form of less labour usage to higher oil extraction rate through oil-loss recovery, the group has built more than 80 MCS mills to date globally.
In its special purpose vehicle business, the group focuses on the designing, fabrication, manufacturing, retrofitting and maintenance works of special purpose vehicles. The group’s special purpose vehicles ranges from fire fight-ing and rescue vehicles, utility vehicles, air ground vehicles and even military and infantry vehicles.
Banking on the success of its engineering and equipment segment and special purpose vehicle business, the group has also gradually diversified into the upstream business of oil palm plantation through a series of strategic acquisitions over the years.
For its FY15 revenue breakdown, the palm oil engineering segment contributed 77.4 percent, the special vehicle purpose vehicle business contributed 22.3 percent, and the remaining 0.3 percent was contributed by the relatively new plantation segment.
Uninspiring 1Q16, But Expect Better Quarters Ahead
In its most recent 1Q16 results released in May 2016, the group posted a relatively uninspiring results with revenue for the quar-ter falling 3.8 percent to RM113.2 million, as compared to RM117.6 million from a year ago,
mainly due to lower billing special purpose vehicles division.
Net profits for the quarter took an even big-ger hit with a 57.7 percent plunge, standing at RM9.3 million as compared to RM22 million for 1Q15. Management cited that the poor perfor-mance for the quarter was mainly due to lower margin in the palm oil engineering division. The investment in asset management as well as unrealised foreign exchange translation losses from its palm oil plantation division were the main reasons for lower margins.
Despite mediocre results for the quarter, looking at the group’s past results from FY11 should bring comfort to investors as CBIP has been able to consistently maintain its revenue and profits amidst volatility in the market.
For the past five years, the group’s revenue has been hovering around the range of RM454 million in FY11, and RM554.1 million for FY15. Net profit in the same period also ranged be-tween RM103.9 million in FY11 to RM93.6 mil-lion for FY15 (FY12 net profit was particularly higher at RM240 million due to a one off gain of RM139.6 million from the disposal of its Sarawak palm oil operations).
Although the group had a weak start to the year, we still expect its financial performance to improve in the upcoming quarters, sup-ported mainly by its strong order book in both the palm oil engineering segment as well as its special purpose vehicle segment.
As of the release of its 1Q16 results, man-agement has also shared that for its palm oil engineering segment, order book stood strong at RM495 million. As such, it is expected to keep the group busy for the year, which bodes well for the performance of the segment for FY16 and FY17. Order book for the special purpose vehicles as at 1Q16 stood at approximately RM242 million.
21
CONTENT PAGE
With its healthy order book, the group is poised to improve – if not at least maintain – its performance in time to come. Although no sizeable contract was announced on a year-to-date basis, management is confident of secur-ing about RM400 million worth of contracts in FY16 for its palm oil engineering segment.
Modipalm And Plantations Expected To Take A Hit
As the plantation industry is all about economies of scale and in the palm oil milling process, every drop of oil is expected to be squeezed from the palm fruits. A key measure of the efficiency of palm oil mills is the amount of oil that can be extracted from a fruit bunch.
The higher the extraction rate, the higher the profitability – assuming production costs can be maintained or kept low. And for this particular reason, big plantation companies like Sime Darby, United Plantations and PT Astra Agro Lestari have turned to CBIP for its patented MCS technology to improve their milling process efficiency.
With huge players in the industry using its patented technology, it poses as a great source of recurring income through the replacement of parts and upgrading works of palm oil mills.
However, one important factor investors should note is the expiry of the pioneer tax status for its MCS process this year, which will dent net profit contribution from the division.
Furthermore, higher operating losses from its plantation segment is to be expected. CBIP owns approximately 83,000 hectares of plan-tation land bank in Kalimantan Tengah, Indo-nesia, with about 7,400 hectares planted area (8 percent) as at end-2015 and average age profile of three years.
Upon planting 1,290 hectares in 2015, the group is expected to accelerate its planting
exercise to 3,000 hectares in 2016. The higher operating expenses from the planting exercise are expected to widen the segment’s losses to RM10 million.
As of 9 August, CPIB’s shares closed at RM2.00, representing a stagnant year-to-date (YTD) performance. However CBIP’s shares reached a YTD peak of RM2.30 in April 2016 and has been on the decline since then. At its current share price, it represents a price to earnings ratio (P/E) of 13.2 times.
With its healthy order book in both palm oil engineering and special purpose vehicle divi-sions, investors should be able to see better numbers in time to come, assuming produc-tion costs can be maintained. With a street price of RM2.34, it represents a potential up-side of 17 percent. Looking at the operations of the group, it certainly does not look like a difficult target to hit.
22
Stock Short Name:
Code:
YTD Return (as at 3 Nov):
Year-To-Date Gains
BY: JOEY HO
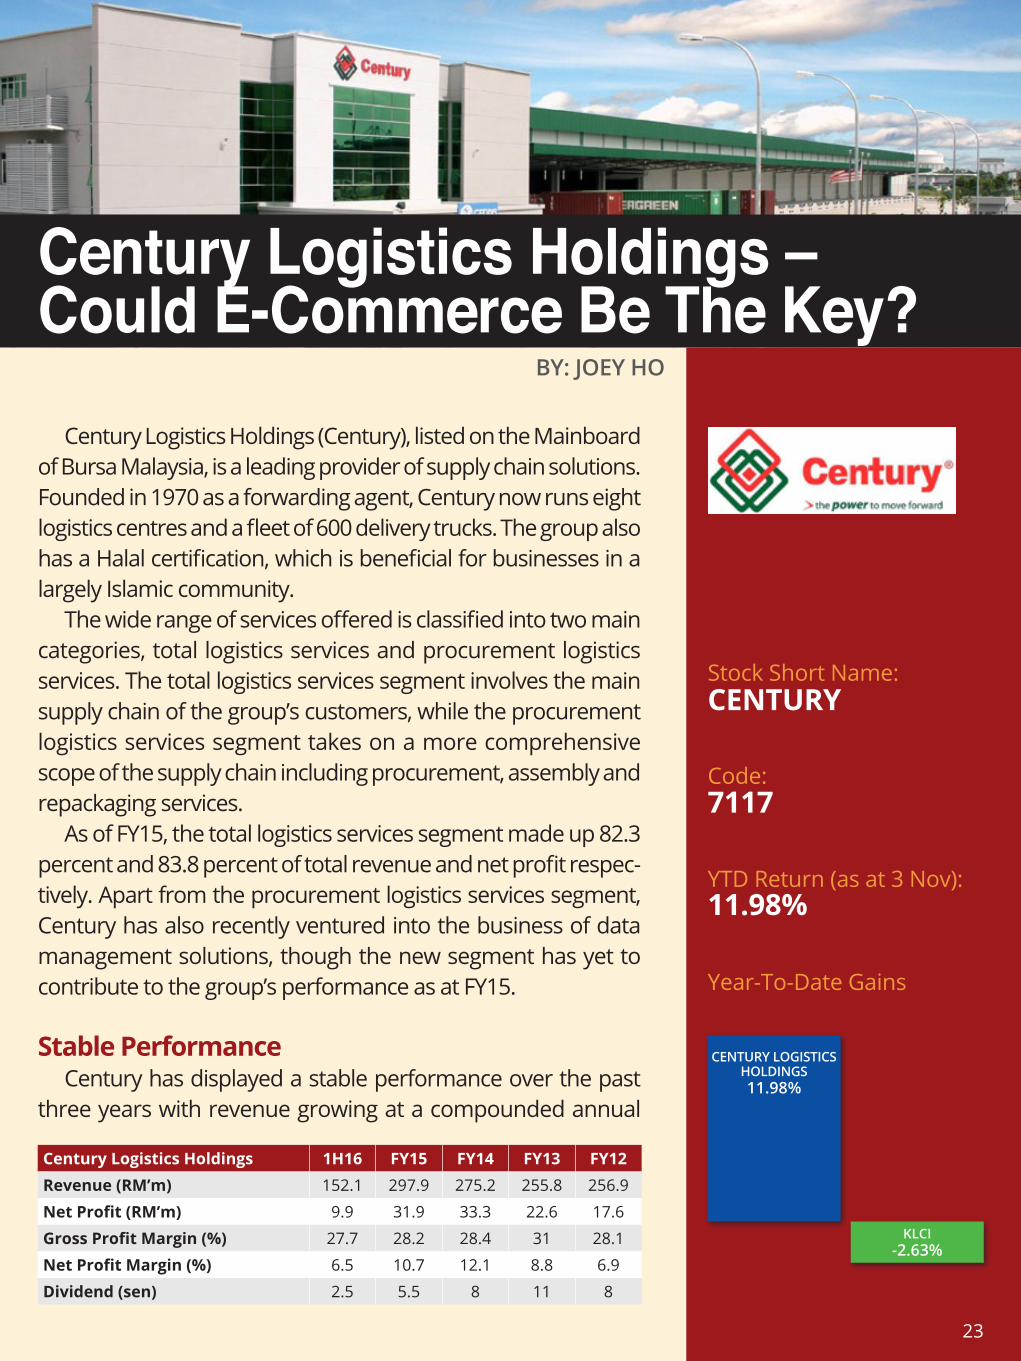
Century Logistics Holdings (Century), listed on the Mainboard of Bursa Malaysia, is a leading provider of supply chain solutions. Founded in 1970 as a forwarding agent, Century now runs eight logistics centres and a fleet of 600 delivery trucks. The group also has a Halal certification, which is beneficial for businesses in a largely Islamic community.
The wide range of services offered is classified into two main categories, total logistics services and procurement logistics services. The total logistics services segment involves the main supply chain of the group’s customers, while the procurement logistics services segment takes on a more comprehensive scope of the supply chain including procurement, assembly and repackaging services.
As of FY15, the total logistics services segment made up 82.3 percent and 83.8 percent of total revenue and net profit respec-tively. Apart from the procurement logistics services segment, Century has also recently ventured into the business of data management solutions, though the new segment has yet to contribute to the group’s performance as at FY15.
Stable PerformanceCentury has displayed a stable performance over the past
three years with revenue growing at a compounded annual
Century Logistics Holdings – Could E-Commerce Be The Key?
Century Logistics Holdings 1H16 FY15 FY14 FY13 FY12Revenue (RM’m) 152.1 297.9 275.2 255.8 256.9
Net Profit (RM’m) 9.9 31.9 33.3 22.6 17.6
Gross Profit Margin (%) 27.7 28.2 28.4 31 28.1
Net Profit Margin (%) 6.5 10.7 12.1 8.8 6.9
Dividend (sen) 2.5 5.5 8 11 8
CENTURY
7117
11.98%
CENTURY LOGISTICS HOLDINGS11.98%
KLCI-2.63%
23
CONTENT PAGE
growth rate of 5.1 percent to RM297.9 million in FY15, while net profit almost doubled to RM31.9 million. In addition, the group is also able to maintain its gross profit margin level at around 28 percent.
While there certainly have been some fluctua-tions in the group’s net profit margin, we have noted that these were due to gain on sale of assets of RM11.1 million and RM14.6 million in FY15 and FY14 respectively.
Despite the lower dividends, Century’s shares are commanding a dividend yield of 6 per-cent based on the latest full year dividends of RM0.055 and the latest closing price of RM0.915 as of 3 October 2016.
South Korean PartnershipCJ Korea Express Corporation (CJ Korea),
South Korea’s largest courier service company, has recently acquired a 31.4 percent stake in Century through its Singapore-based subsid-iary, CJ Korea Asia. The deal, valued at RM174.8 million, has made the Korean firm the largest shareholder in Century. The deal is part of CJ Korea’s strategy to achieve its goal of becom-ing a dominant player in the Malaysian logistics sector.
Through the new partnership, Century will be able to leverage on CJ Korea’s strengths such as its technology systems and solutions, while the latter plans to leverage on Century’s strong local customer base.
The Korean firm also anticipates continued e-commerce growth and plans to equip Century for the e-commerce and parcel delivery busi-ness through the introduction of its advanced technology, engineering, system and solution.
Going forward, both firms will also integrate their logistics and administrative activities, result-ing in a larger network and more cost-efficient operation through the sharing of key logistics
hubs and networks, cross-selling and new busi-ness opportunities.
While there have not been any immediate visible benefits, given that CJ Korea paid a 39.4 percent premium, it is likely that the Korean firm has some well thought-out plans in store.
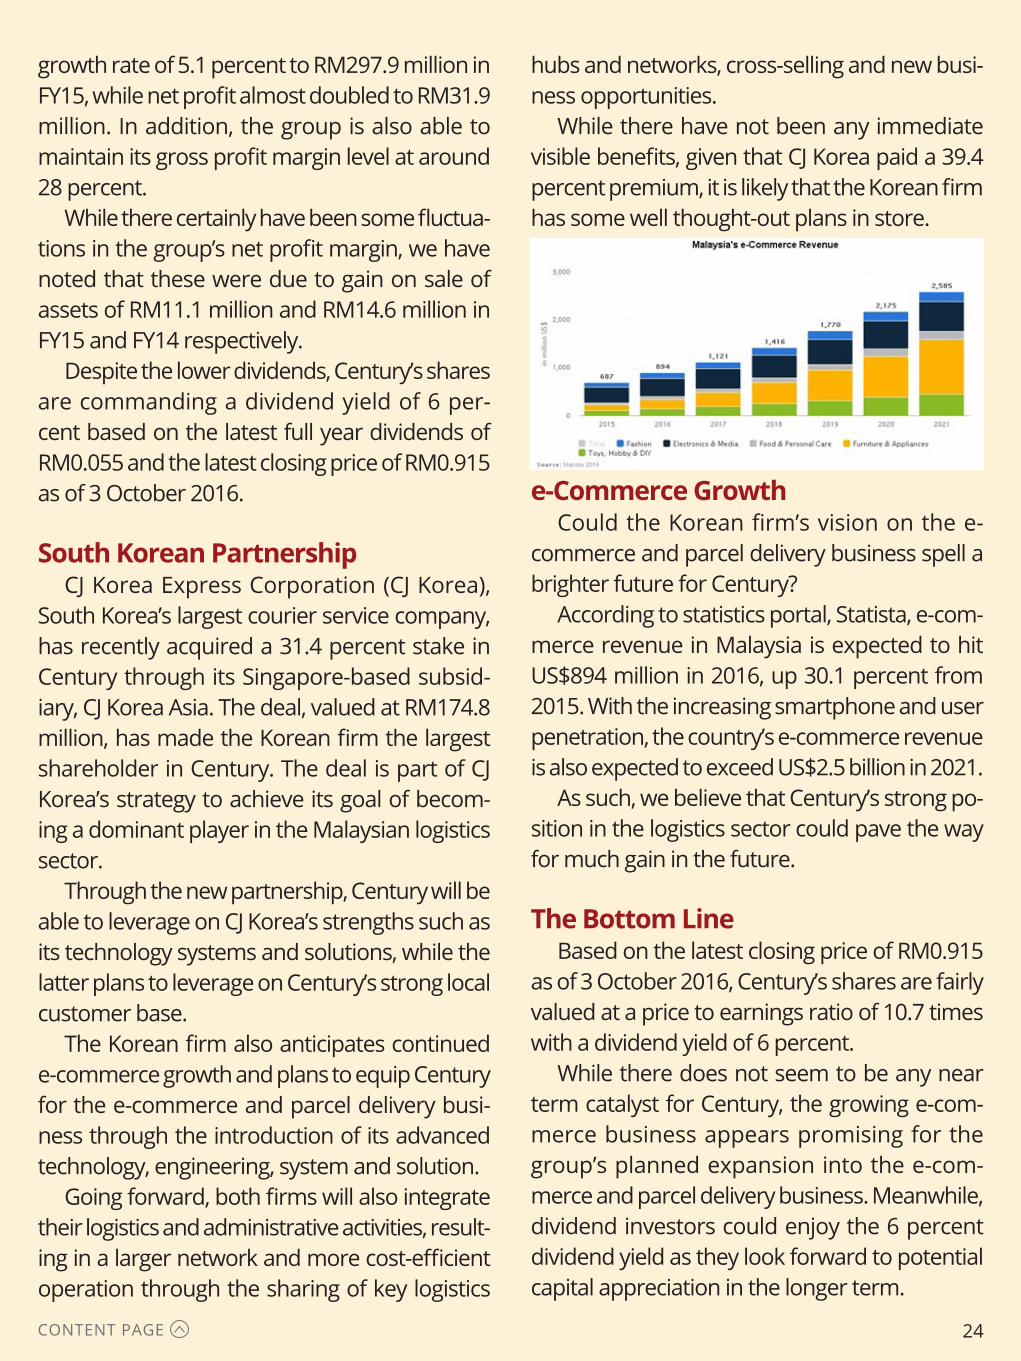
e-Commerce GrowthCould the Korean firm’s vision on the e-
commerce and parcel delivery business spell a brighter future for Century?
According to statistics portal, Statista, e-com-merce revenue in Malaysia is expected to hit US$894 million in 2016, up 30.1 percent from 2015. With the increasing smartphone and user penetration, the country’s e-commerce revenue is also expected to exceed US$2.5 billion in 2021.
As such, we believe that Century’s strong po-sition in the logistics sector could pave the way for much gain in the future.
The Bottom LineBased on the latest closing price of RM0.915
as of 3 October 2016, Century’s shares are fairly valued at a price to earnings ratio of 10.7 times with a dividend yield of 6 percent.
While there does not seem to be any near term catalyst for Century, the growing e-com-merce business appears promising for the group’s planned expansion into the e-com-merce and parcel delivery business. Meanwhile, dividend investors could enjoy the 6 percent dividend yield as they look forward to potential capital appreciation in the longer term.
24
Stock Short Name:
Code:
YTD Return (as at 3 Nov):
Year-To-Date Gains
BY: JOEY HO
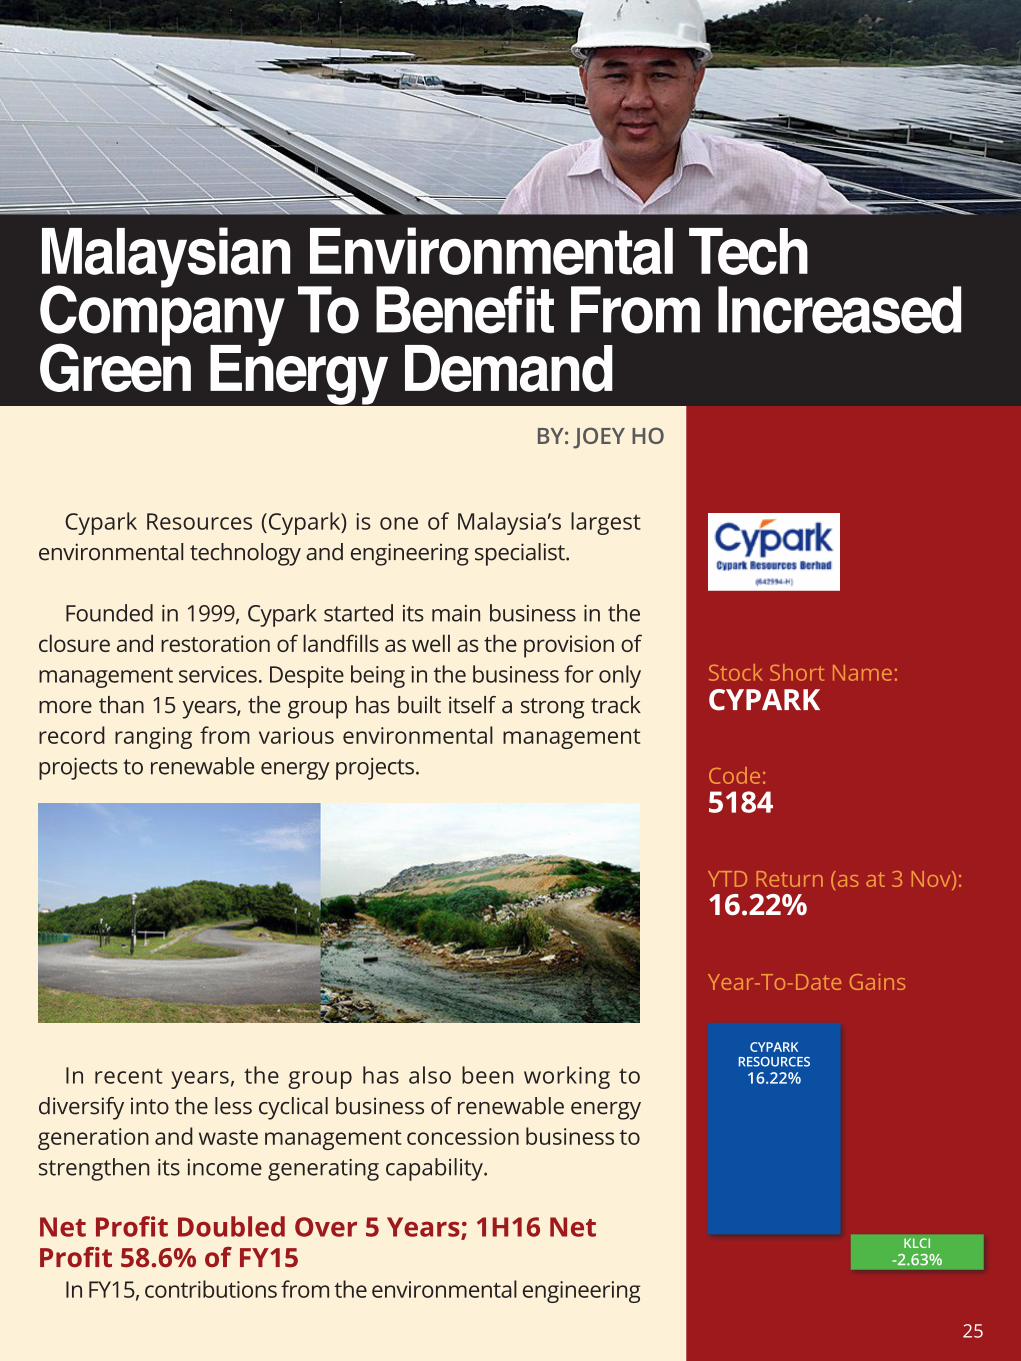
Cypark Resources (Cypark) is one of Malaysia’s largest environmental technology and engineering specialist.
Founded in 1999, Cypark started its main business in the closure and restoration of landfills as well as the provision of management services. Despite being in the business for only more than 15 years, the group has built itself a strong track record ranging from various environmental management projects to renewable energy projects.
Malaysian Environmental Tech Company To Benefit From Increased Green Energy Demand
In recent years, the group has also been working to diversify into the less cyclical business of renewable energy generation and waste management concession business to strengthen its income generating capability.
Net Profit Doubled Over 5 Years; 1H16 Net Profit 58.6% of FY15
In FY15, contributions from the environmental engineering
CYPARK
5184
16.22%
CYPARK RESOURCES
16.22%
KLCI-2.63%
25
CONTENT PAGE
segment made up 53.9 percent of total revenue, down from 63.4 percent in FY14, as the segment registered a decline of 10.3 percent. However, the renewable energy segment accelerated 13.5 percent, to make up 15.7 percent of total revenue, offsetting the decline in the environmental engineering segment.
The group boasts a strong track record with a consistent improvement in revenue, net profit, dividend as well as net income margin over the past four years. Net profit more than doubled from FY11 to FY15 while revenue increased by 56 percent as the group’s business continues to grow.
Although dividends remained flat at RM0.05 for the last two years, the payout has in fact increased at a compounded annual growth rate of 17.4 percent to RM0.05 in FY15 from just RM0.0263 in FY11. The group also managed to add a modest 4.9 percentage points to its net income margin during the same period.
In the latest 1H16 financial results release, the group’s net profit of RM25.5 million already made up 58.6 percent of the previous full year net profit, positioning it to soar through FY16.
Cypark’s management is currently bullish about its dividend policy due to the stronger cash flow and shareholders could expect a dividend payout of 30 percent to 40 percent, up from the current 25 percent should the group see a strong end to the year.
Apart from the overall performance, the group maintains a stable balance sheet
Cypark Resources 1H16 FY15 FY14 FY13 FY12 FY11Revenue (RM’m) 145.2 251.9 238.8 220.7 195.8 161.5
Net Profit (RM’m) 25.5 43.5 39.9 35.9 25.6 20.1
Dividend (sen) - 5 5 4 3.75 2.63
Net Income Margin (%) 17.6 17.3 16.7 16.3 13.1 12.4
position with a current ratio of 1.2 times as of 1H16, with cash and equivalents of RM114.6 million making up 36.8 percent of total current assets.
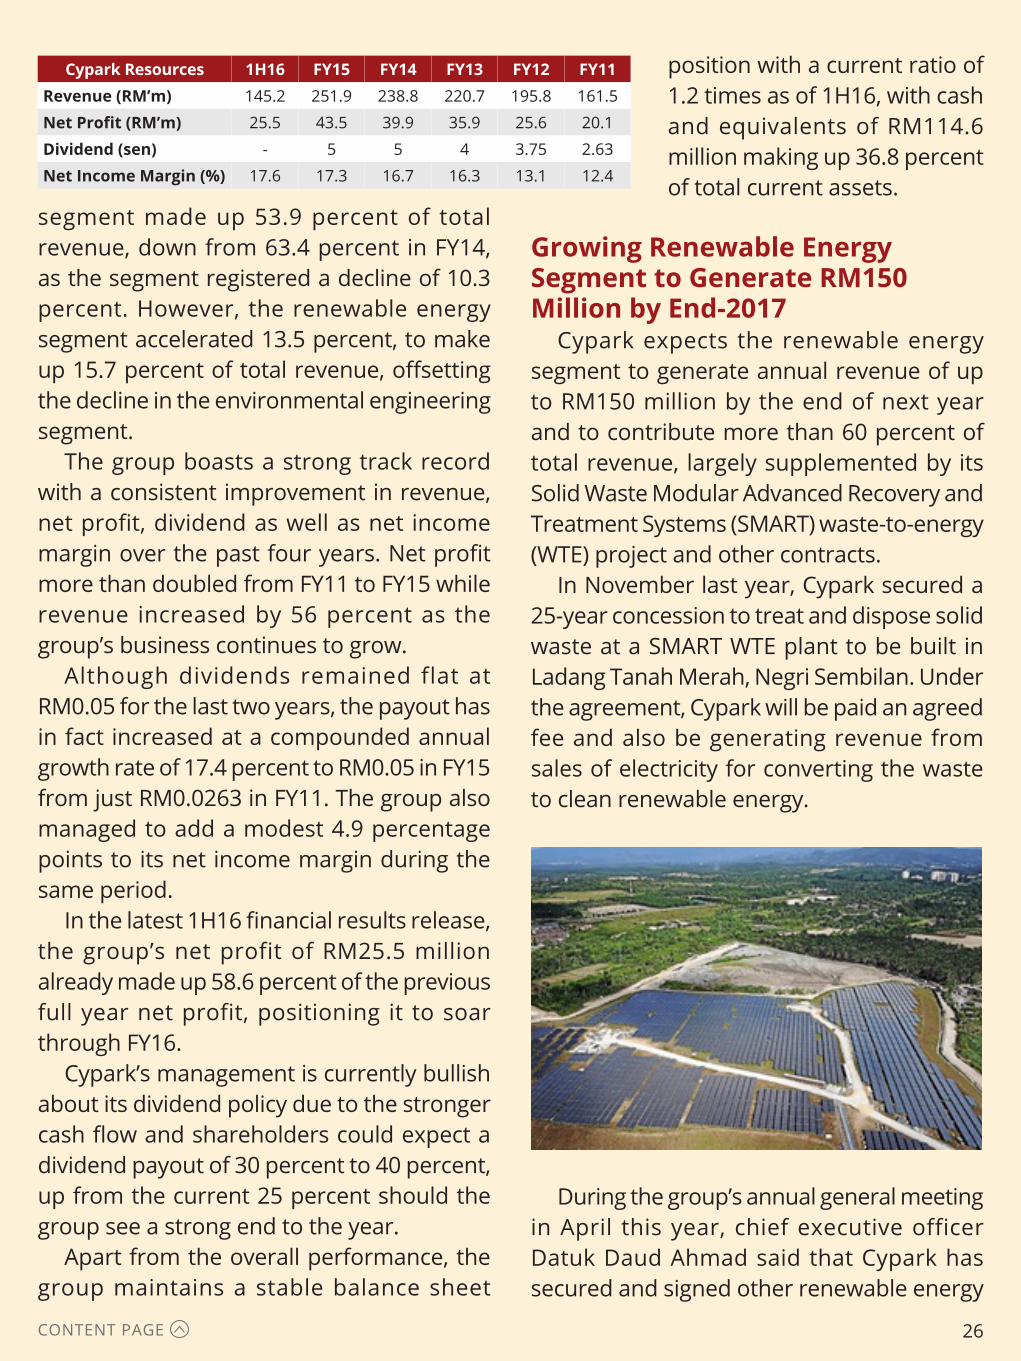
Growing Renewable Energy Segment to Generate RM150 Million by End-2017
Cypark expects the renewable energy segment to generate annual revenue of up to RM150 million by the end of next year and to contribute more than 60 percent of total revenue, largely supplemented by its Solid Waste Modular Advanced Recovery and Treatment Systems (SMART) waste-to-energy (WTE) project and other contracts.
In November last year, Cypark secured a 25-year concession to treat and dispose solid waste at a SMART WTE plant to be built in Ladang Tanah Merah, Negri Sembilan. Under the agreement, Cypark will be paid an agreed fee and also be generating revenue from sales of electricity for converting the waste to clean renewable energy.
During the group’s annual general meeting in April this year, chief executive officer Datuk Daud Ahmad said that Cypark has secured and signed other renewable energy
26
CONTENT PAGE
deals, including participation in the recent prequalification process by the Energy Commission to bid for the development of a 1,000-megawatt solar power plant.
The abovementioned indicates the growing demand for renewable energy in Malaysia, which is likely to benefit the group. We view the expected increase in annual revenue from the renewable energy segment positively as the segment provides Cypark with a stable income and commands a higher margin, which is likely to contribute significantly to the group’s bottom line.
ValuationAs at 26 July 2016, Cyparks’s shares closed
at RM2.01, representing a year-to-date gain of 8.1 percent and valued at a price-to-earnings ratio (P/E) of 9.4 times. Similar participant in Malaysia’s waste management industry, Tex Cycle Technology, last closed at RM1.35 on 26 July 2016 equivalent to a P/E of 29.8 times while Singapore-based Sembcorp Industries last closed at $2.91, representing a P/E of 10 times.
Given the relatively lower valuations and strong earnings potential ahead, we believe that Cypark’s shares could be trading at higher valuations.
27

Stock Short Name:
Code:
YTD Return (as at 3 Nov):
Year-To-Date Gains
BY: SUA XIU KAI
Dutch Lady Milk Industries (Dutch Lady) – a company no stranger to consumers – manufactures and distributes a wide range of dairy products, such as specialised powders for infant and children, liquid milk in different packaging formats and yoghurts.
The company has been offering its products to generations of Malaysians and Singaporeans under a wide range of brand names such as Dutch Lady, Dutch Baby, Frisolac, Frisco and Dutch Lady PureFarm.
With its 1Q16 financial results released in February 2016, we take a look at why this dairy giant may not just be healthy to your bones and teeth; it may prove valuable to portfolio as well.
Increasing Market Presence And ShareDespite its established market presence, Dutch Lady has
been active in heightening the awareness of the benefits of consuming dairy products. The firm has launched several initiatives targeted at children in cooperation with Malaysian government bodies.
Over the years, Dutch Lady has been working with the Malaysian Ministry of Education in the Program Susu 1Malaysia in order to spread the goodness and benefits of milk to school children. Through the programme, the group has provided milk to more than 238,000 selected school children from primary schools with a series of educational road shows. Through a specially designed project in 2014, Dutch Lady put forth its Drink.Move.BeStrong proposition that encourages school children to get proper nutrition and to lead a healthier
Why Dutch Lady Milk Industries Is Good For Your Bones And Portfolio
DLADY
3026
24.09%
DUTCH LADY MILK24.09%
KLCI-2.63%
28
CONTENT PAGE
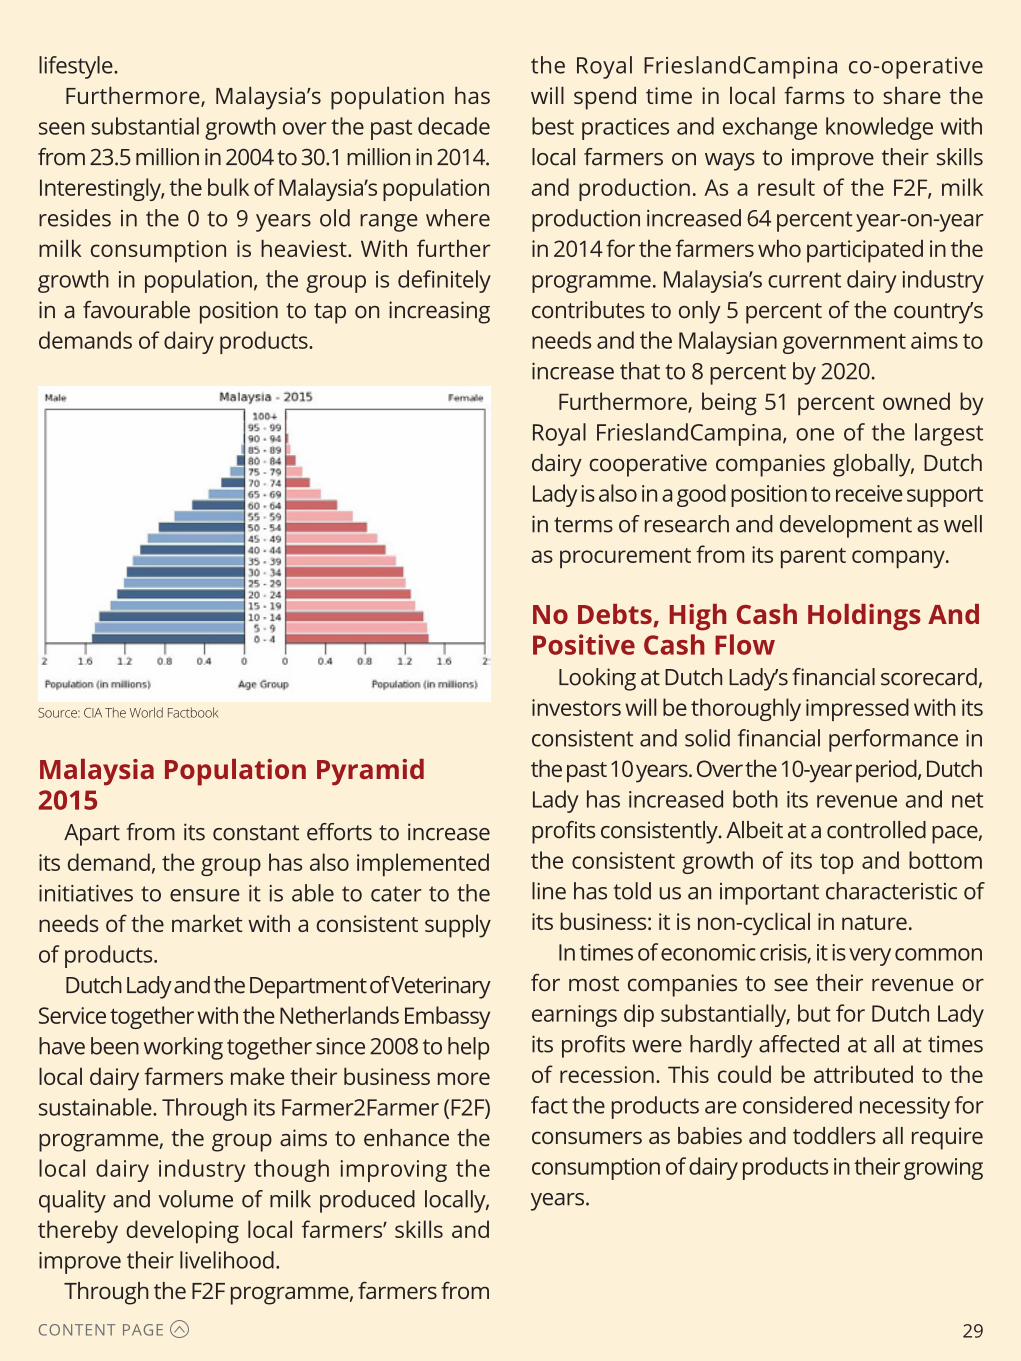
lifestyle.Furthermore, Malaysia’s population has
seen substantial growth over the past decade from 23.5 million in 2004 to 30.1 million in 2014. Interestingly, the bulk of Malaysia’s population resides in the 0 to 9 years old range where milk consumption is heaviest. With further growth in population, the group is definitely in a favourable position to tap on increasing demands of dairy products.
Source: CIA The World Factbook
Malaysia Population Pyramid 2015
Apart from its constant efforts to increase its demand, the group has also implemented initiatives to ensure it is able to cater to the needs of the market with a consistent supply of products.
Dutch Lady and the Department of Veterinary Service together with the Netherlands Embassy have been working together since 2008 to help local dairy farmers make their business more sustainable. Through its Farmer2Farmer (F2F) programme, the group aims to enhance the local dairy industry though improving the quality and volume of milk produced locally, thereby developing local farmers’ skills and improve their livelihood.
Through the F2F programme, farmers from
the Royal FrieslandCampina co-operative will spend time in local farms to share the best practices and exchange knowledge with local farmers on ways to improve their skills and production. As a result of the F2F, milk production increased 64 percent year-on-year in 2014 for the farmers who participated in the programme. Malaysia’s current dairy industry contributes to only 5 percent of the country’s needs and the Malaysian government aims to increase that to 8 percent by 2020.
Furthermore, being 51 percent owned by Royal FrieslandCampina, one of the largest dairy cooperative companies globally, Dutch Lady is also in a good position to receive support in terms of research and development as well as procurement from its parent company.
No Debts, High Cash Holdings And Positive Cash Flow
Looking at Dutch Lady’s financial scorecard, investors will be thoroughly impressed with its consistent and solid financial performance in the past 10 years. Over the 10-year period, Dutch Lady has increased both its revenue and net profits consistently. Albeit at a controlled pace, the consistent growth of its top and bottom line has told us an important characteristic of its business: it is non-cyclical in nature.
In times of economic crisis, it is very common for most companies to see their revenue or earnings dip substantially, but for Dutch Lady its profits were hardly affected at all at times of recession. This could be attributed to the fact the products are considered necessity for consumers as babies and toddlers all require consumption of dairy products in their growing years.
29

CONTENT PAGE
Revenue & Net Profits (RM ‘millions)
Source: Company
Looking at its balance sheet, Dutch Lady also has an exceptional ability to retain a substantial amount of cash holdings. From their 1Q16 results, Dutch Lady currently holds RM169.6 million in cash and equivalents and although it represents a mere 4.7 percent of its towering market capitalization of RM3.6 billion, it is definitely helps to provide some sort of buffer during crisis periods, given the fact that this behemoth of a company currently holds zero debt as well.
Moving down the checklist of things investors love, Dutch Lady also boasts 10 consecutive years of increasing operating cash flow and free cash flow. As of FY15, its operating cash flow stood at a record high of RM200.6 million, and with a capital expenditure of RM24.5 million, the group ended the year with a remarkable free cash flow of RM176.4 million.
Final TakeawayAs of 17 May’s close, Dutch Lady’s shares
closed at RM55.80; with an average street price of RM58.15 it represents an upside potential of approximately 4.2 percent.
Although investors may argue that growth for this giant may be slightly limited due to the lack of any short term catalyst, Dutch lady has proven itself with a resilient business model that is able to generate profits and cash even
during recessions, which is further cemented from its return on equity of 75.3 percent and return on asset of 31.2 percent.
Given its strong cash generation ability, as well as the more than sufficient residual cash even after setting aside the money required to maintain or expand its asset base, Dutch Lady has been paying out dividends consistently to shareholders. For FY15, the group distributed dividends of RM2.20 per share, inclusive of two RM0.60 special dividends, bringing the total amount distributed to RM140.8 million, representing a payout ratio of approximately 100 percent.
With a price of RM55.80 per share, Dutch Lady has a price to earnings ratio (P/E) of 22.6 times. In comparison, the consumer sector P/E is pegged at 25 times and its closest competitor, Nestle (Malaysia) trades at a P/E of 30.2 times. In short, Dutch Lady is an extremely stable company with strong fundamentals which would definitely suit the palette of investors who prefer less volatility and looking for steady investments.
30
Stock Short Name:
Code:
YTD Return (as at 3 Nov):
Year-To-Date Gains
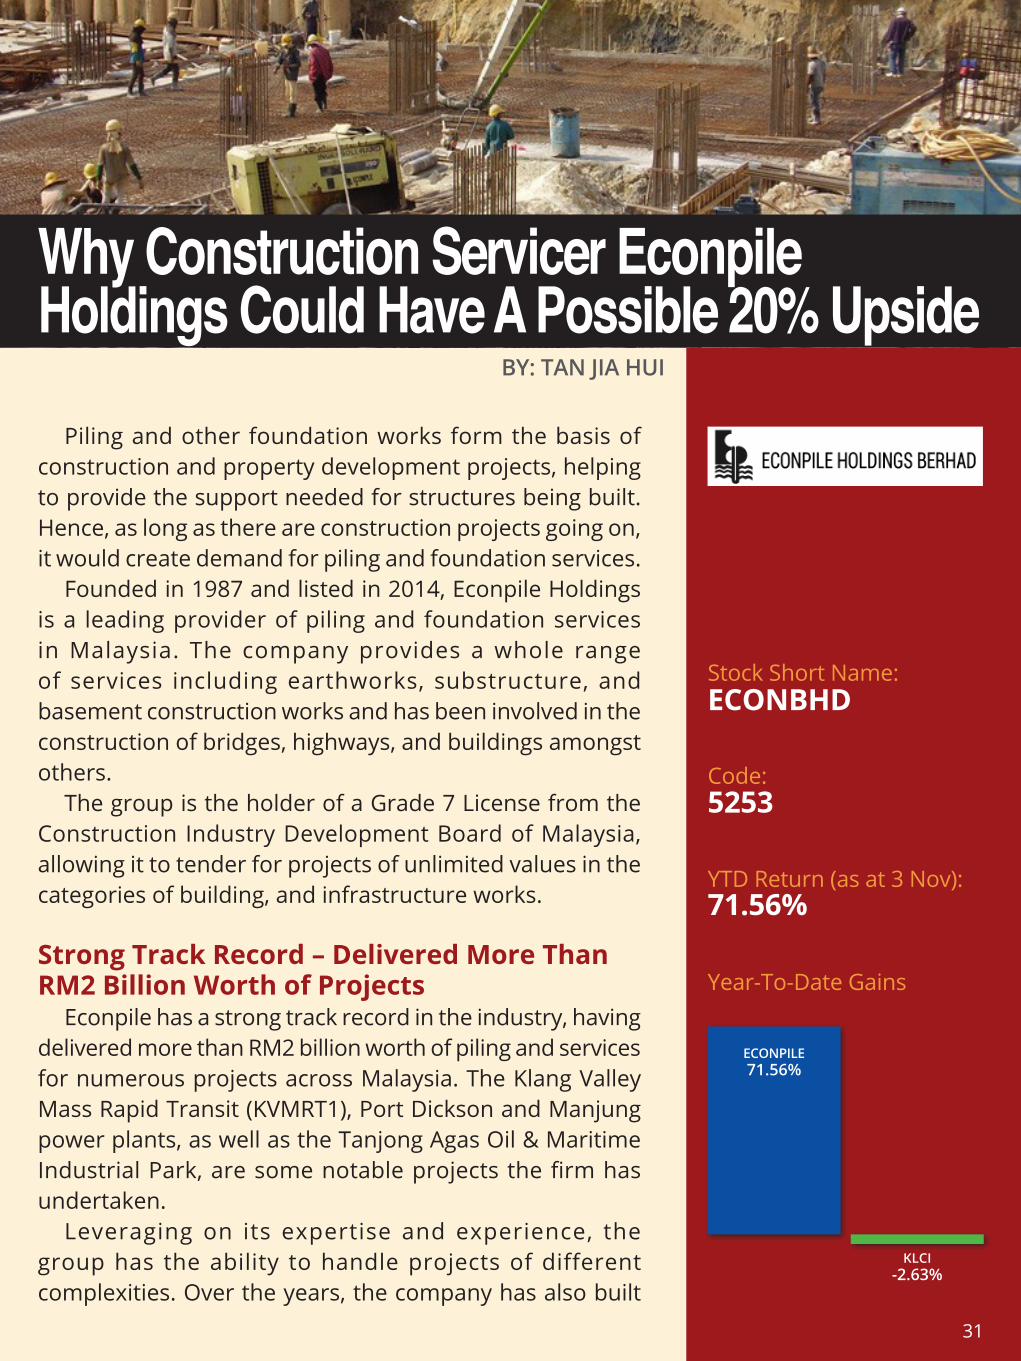
BY: TAN JIA HUI
Piling and other foundation works form the basis of construction and property development projects, helping to provide the support needed for structures being built. Hence, as long as there are construction projects going on, it would create demand for piling and foundation services.
Founded in 1987 and listed in 2014, Econpile Holdings is a leading provider of piling and foundation services in Malaysia. The company provides a whole range of services including earthworks, substructure, and basement construction works and has been involved in the construction of bridges, highways, and buildings amongst others.
The group is the holder of a Grade 7 License from the Construction Industry Development Board of Malaysia, allowing it to tender for projects of unlimited values in the categories of building, and infrastructure works.
Strong Track Record – Delivered More Than RM2 Billion Worth of Projects
Econpile has a strong track record in the industry, having delivered more than RM2 billion worth of piling and services for numerous projects across Malaysia. The Klang Valley Mass Rapid Transit (KVMRT1), Port Dickson and Manjung power plants, as well as the Tanjong Agas Oil & Maritime Industrial Park, are some notable projects the firm has undertaken.
Leveraging on its expertise and experience, the group has the ability to handle projects of different complexities. Over the years, the company has also built
Why Construction Servicer Econpile Holdings Could Have A Possible 20% Upside
ECONBHD
5253
71.56%
ECONPILE71.56%
KLCI-2.63%
31
CONTENT PAGE
up good relationships with big names in the construction and property sector including Tropicana Corporation, IOI Properties, Glomac and Putrajaya Perdana.
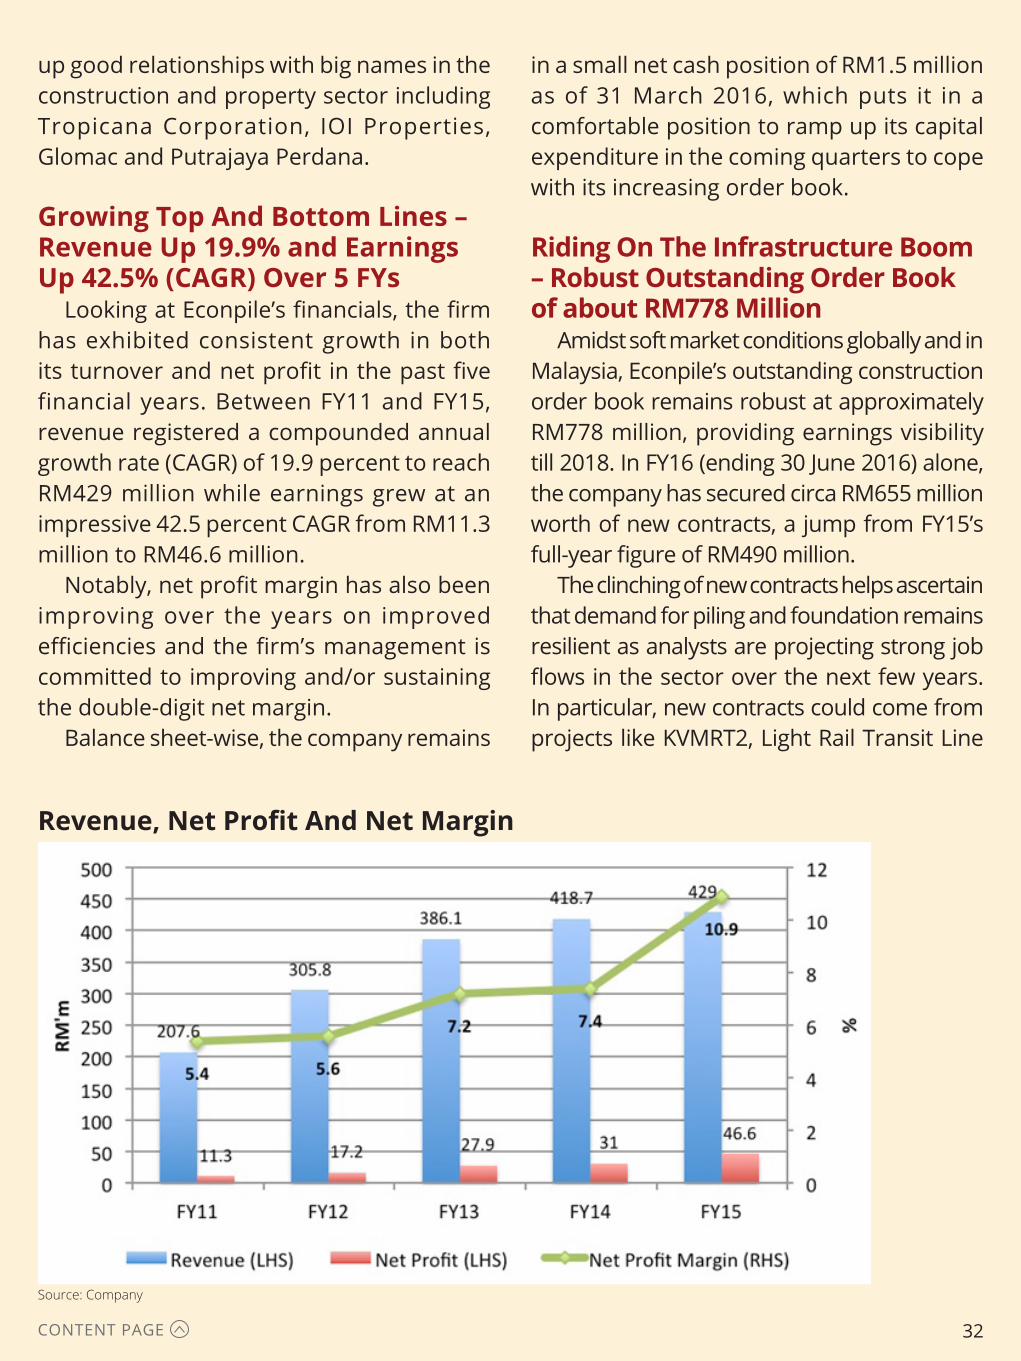
Growing Top And Bottom Lines – Revenue Up 19.9% and Earnings Up 42.5% (CAGR) Over 5 FYs
Looking at Econpile’s financials, the firm has exhibited consistent growth in both its turnover and net profit in the past five financial years. Between FY11 and FY15, revenue registered a compounded annual growth rate (CAGR) of 19.9 percent to reach RM429 million while earnings grew at an impressive 42.5 percent CAGR from RM11.3 million to RM46.6 million.
Notably, net profit margin has also been improving over the years on improved efficiencies and the firm’s management is committed to improving and/or sustaining the double-digit net margin.
Balance sheet-wise, the company remains
Source: Company
in a small net cash position of RM1.5 million as of 31 March 2016, which puts it in a comfortable position to ramp up its capital expenditure in the coming quarters to cope with its increasing order book.
Riding On The Infrastructure Boom – Robust Outstanding Order Book of about RM778 Million
Amidst soft market conditions globally and in Malaysia, Econpile’s outstanding construction order book remains robust at approximately RM778 million, providing earnings visibility till 2018. In FY16 (ending 30 June 2016) alone, the company has secured circa RM655 million worth of new contracts, a jump from FY15’s full-year figure of RM490 million.
The clinching of new contracts helps ascertain that demand for piling and foundation remains resilient as analysts are projecting strong job flows in the sector over the next few years. In particular, new contracts could come from projects like KVMRT2, Light Rail Transit Line
Revenue, Net Profit And Net Margin
32

CONTENT PAGE
Market Capitalisation*(RM’m) TTM Gross Margin TTM Net Margin TTM P/E
Ikhmas Jaya Grp 364.0 26.4% 8.6% 16.0x
Pintaras Jaya 564.2 20.8% 16.8% 23.5x
Econpile Hldgs 771.6 24.2% 14.4% 11.3x
Mean 566.6 23.8% 13.3% 16.9x*Based on close price as at 15 June 2016
3, expressways and the Bukit Bintang City Centre development. The group is in a good position to capture this rising demand, given its experience from KVMRT1 and expertise in executing projects that are over RM100 million in value.
ValuationsFor comparison, we look to Pintaras Jaya
and Ikhmas Jaya Group, listed peers of Econpile who are also mainly involved in the provision of piling and foundation services.
On a relative valuation basis, Econpile is trading at the lowest trailing twelve months (TTM) price-to-earnings ratio (P/E) of 11.3 times. We think the fact that the group has a much higher net margin but still trades at a lower P/E as compared to Ikhmas Jaya (who happens to have a net debt position) is not justified.
Analysts on the streets appear to concur that Econpile deserves a higher valuation than what it is currently trading at, with an average ‘Buy’ rating and a target price of RM1.64, which represents a 23.6 percent upside potential to the stock’s close price of RM1.33 as at 15 June. Risks to the street ratings include a lower than expected job flows, delay in projects and rise in raw material prices.
33
Stock Short Name:
Code:
YTD Return (as at 3 Nov):
Year-To-Date Gains
BY: SUA XIU KAI
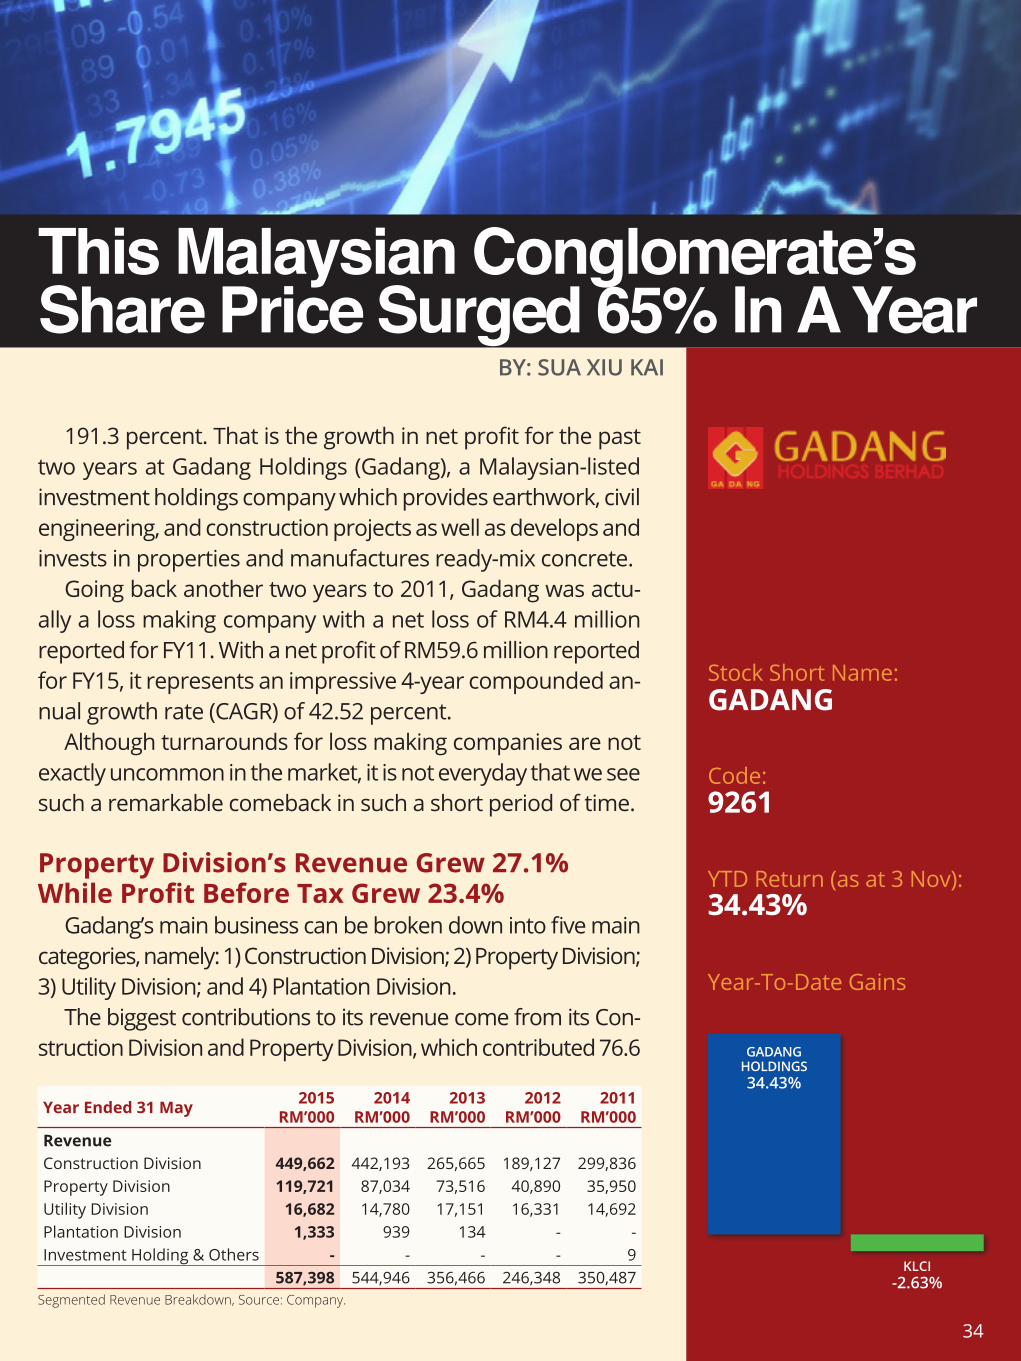
191.3 percent. That is the growth in net profit for the past two years at Gadang Holdings (Gadang), a Malaysian-listed investment holdings company which provides earthwork, civil engineering, and construction projects as well as develops and invests in properties and manufactures ready-mix concrete.
Going back another two years to 2011, Gadang was actu-ally a loss making company with a net loss of RM4.4 million reported for FY11. With a net profit of RM59.6 million reported for FY15, it represents an impressive 4-year compounded an-nual growth rate (CAGR) of 42.52 percent.
Although turnarounds for loss making companies are not exactly uncommon in the market, it is not everyday that we see such a remarkable comeback in such a short period of time.
Property Division’s Revenue Grew 27.1% While Profit Before Tax Grew 23.4%
Gadang’s main business can be broken down into five main categories, namely: 1) Construction Division; 2) Property Division; 3) Utility Division; and 4) Plantation Division.
The biggest contributions to its revenue come from its Con-struction Division and Property Division, which contributed 76.6
This Malaysian Conglomerate’s Share Price Surged 65% In A Year
Year Ended 31 May 2015RM’000
2014RM’000
2013RM’000
2012RM’000
2011RM’000
RevenueConstruction Division 449,662 442,193 265,665 189,127 299,836Property Division 119,721 87,034 73,516 40,890 35,950Utility Division 16,682 14,780 17,151 16,331 14,692Plantation Division 1,333 939 134 - -Investment Holding & Others - - - - 9
587,398 544,946 356,466 246,348 350,487Segmented Revenue Breakdown, Source: Company.
GADANG
9261
34.43%
GADANG HOLDINGS34.43%
KLCI-2.63%
34
CONTENT PAGE
percent and 20.4 percent respectively for FY15.Historically, the two divisions have consistent-
ly contributed to the bulk of Gadang’s revenue and have experienced the most growth, with a 5-year revenue CAGR of 8.44 percent for Con-struction and 27.2 percent for Property.
In its recent release of its 3Q16 financial results, its construction segment reported RM122.7million in revenue and profit before tax of RM22 million, which represented a 70.2-per-cent jump quarter-on-quarter given the lower base last quarter and better construction prog-ress in 3Q16.
For its property division, it recording a rev-enue of RM47.4 million and RM13.3 million of profit before tax for 3Q16, a 98.1 percent and 133.9 percent surge quarter-on-quarter respec-tively in view of the low base in 2Q16.
Gadang has shared that the property divi-sion’s earnings will be underpinned by its un-billed sales of some RM189 million as at end of FY15, located at several strategic locations, namely the Vyne project in Salak South
From the cumulative perspective for 9M16, property division’s revenue achieved growth of 27.1 percent and 23.4 percent in profit before tax year-on-year respectively.
Ongoing RM800 Million Order Book; Profit Before Tax In Utility Division Surged 60.3%
In its construction division, the group has shared with media that it has tendered for over RM10 billion worth of projects, mainly for Petronas’ Refinery and Petrochemical Integrated Development (RAPID), Package V2 of Klang Val-ley Mass Rapid Transit (KVMRT2), as well as the proposed Damansara-Shah Alam (DASH) and Sungai Besi-Ulu Kelang (SUKE) elevated express-way projects.
Given its experience in both KVMRT1 and
RAPID projects, it is highly probable that Gadang can further replenish its order book.
Moreover, the group currently has a balance of construction jobs worth RM800 million which are ongoing. Although management has not elaborated on its margins, the group stated that its construction industry division will be kept busy at least for the new couple of years, with job glows coming in.
Another segment which cannot be missed is its utility segment. Although its performance in revenue received over the past five years has fluctuated, the utility division is expected to pro-duce steady earnings moving forward.
In 3Q16, the utility division contributed RM5.5 million to the top line, same as previous quarters, whereas profit before tax surged 60.3 percent to RM1.6 million, attributed to PT Dewata Ban-gun Tirta, a water supplier and water treatment services provider based in Indonesia.
In time to come, the utility segment is expect-ed to continue contributing steady earnings to Gadang before the construction of the 9 mega-watt mini-hydro power concession PT Ikhwan to be completed mid 2019. Upon full commission-ing, it is expected to contribute positively to the utility division.
Valuation: 2.1% Yield; Payout Ratio 20%; P/E Ratio 6.04
Gadang’s share price closed at RM2.37 on 20 July 2016, and with total dividends of five sen per share for FY15, it represents a dividend yield of 2.1 percent and payout ratio of 20 percent.
Although its dividend yield is nothing to shout about, and despite the fact that it has been on a 65 percent rally for the past year, we are op-timistic on its future earnings outlook. And at a price-to-earning (PE) ratio of 6.04, Gadang most certainly is at an undervalued position on track to achieve another good year for FY16.
35
Stock Short Name:
Code:
YTD Return (as at 3 Nov):
Year-To-Date Gains
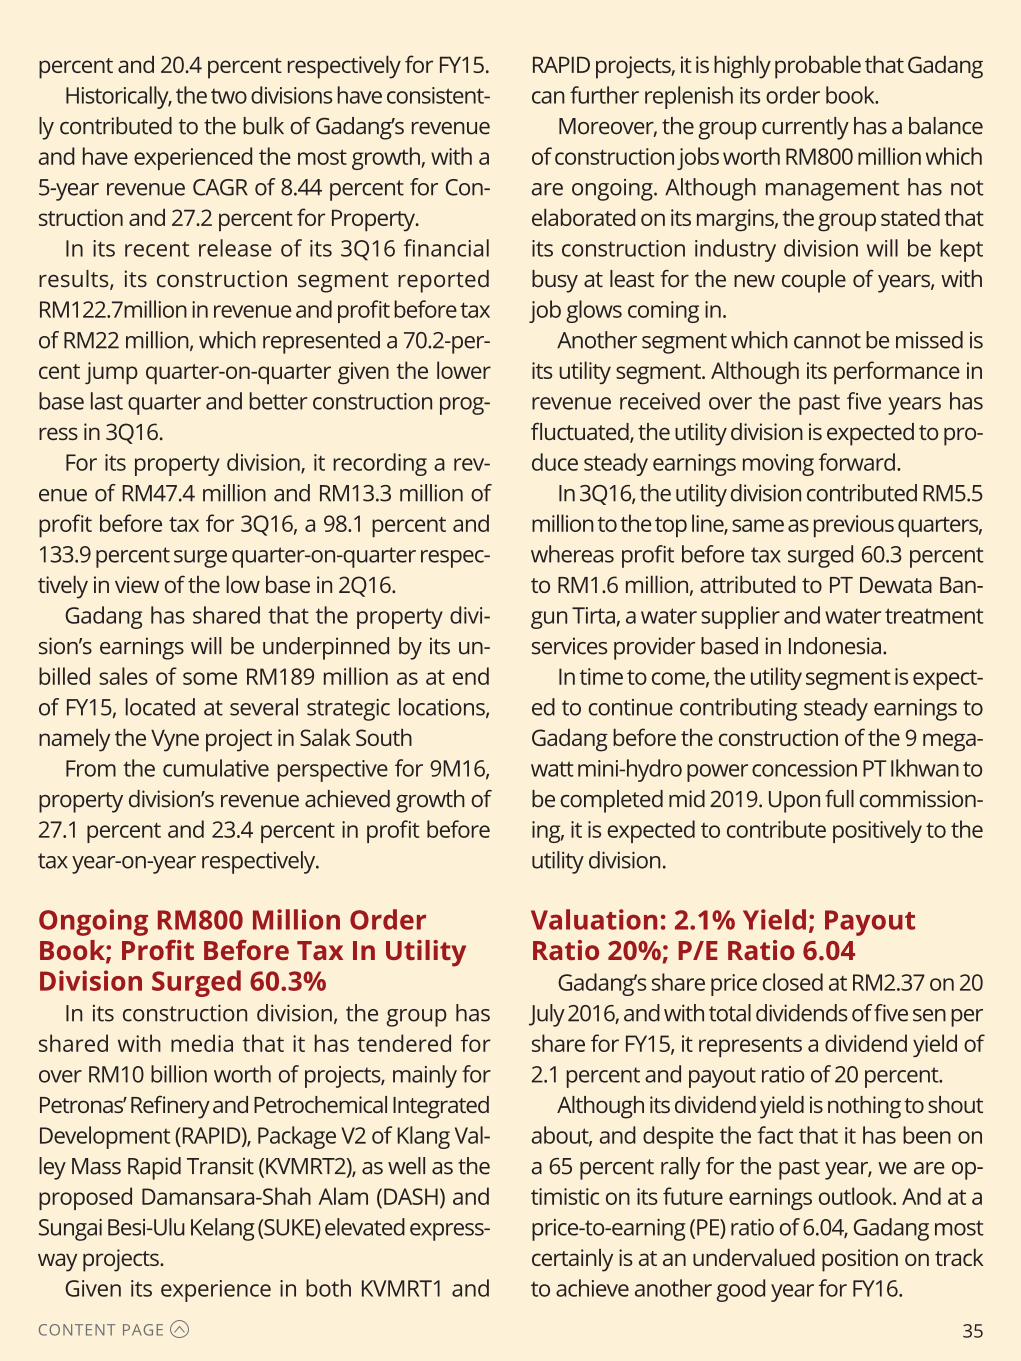
BY: TAN JIA HUI
With the widespread of e-commerce today, people can purchase groceries, clothes or even vehicles with just a click of the mouse. Consumers are increasingly turning to making purchases online, given the convenience, variety and value.
While companies like Amazon and Alibaba are at the forefront, logistics and delivery services providers who have benefitted from the rise of e-commerce also play an important role in the value chain.
Here on the little red dot, national postal service provider Singapore Post (SingPost) is one of the first choices for investors when it comes to riding the e-commerce wave.
However, we cast our sights further this time round to across the causeway and see GD Express Carrier (GDEX) standing out as a good proxy to Malaysia’s e-commerce growth.
Below are three things that you need to know about this counter.
1. Net Profit Quadrupled from RM7 Million to RM28.3 Million Over 5 Years
GDEX is an express delivery and logistics solution provider that operates predominantly in Malaysia and Singapore.
The express delivery segment is the group’s largest revenue contributor, making up 95 percent of FY15 turnover.
The rising popularity of e-commerce, as well as the increasing trend of outsourcing of inter-company parcel deliveries has benefitted the company.
3 Things To Know About GD Express Carrier – Proxy To Malaysia’s E-Commerce Growth
GDEX
0078
-0.58%
GD EXPRESS CARRIER-0.58%
KLCI-2.63%
36
CONTENT PAGE
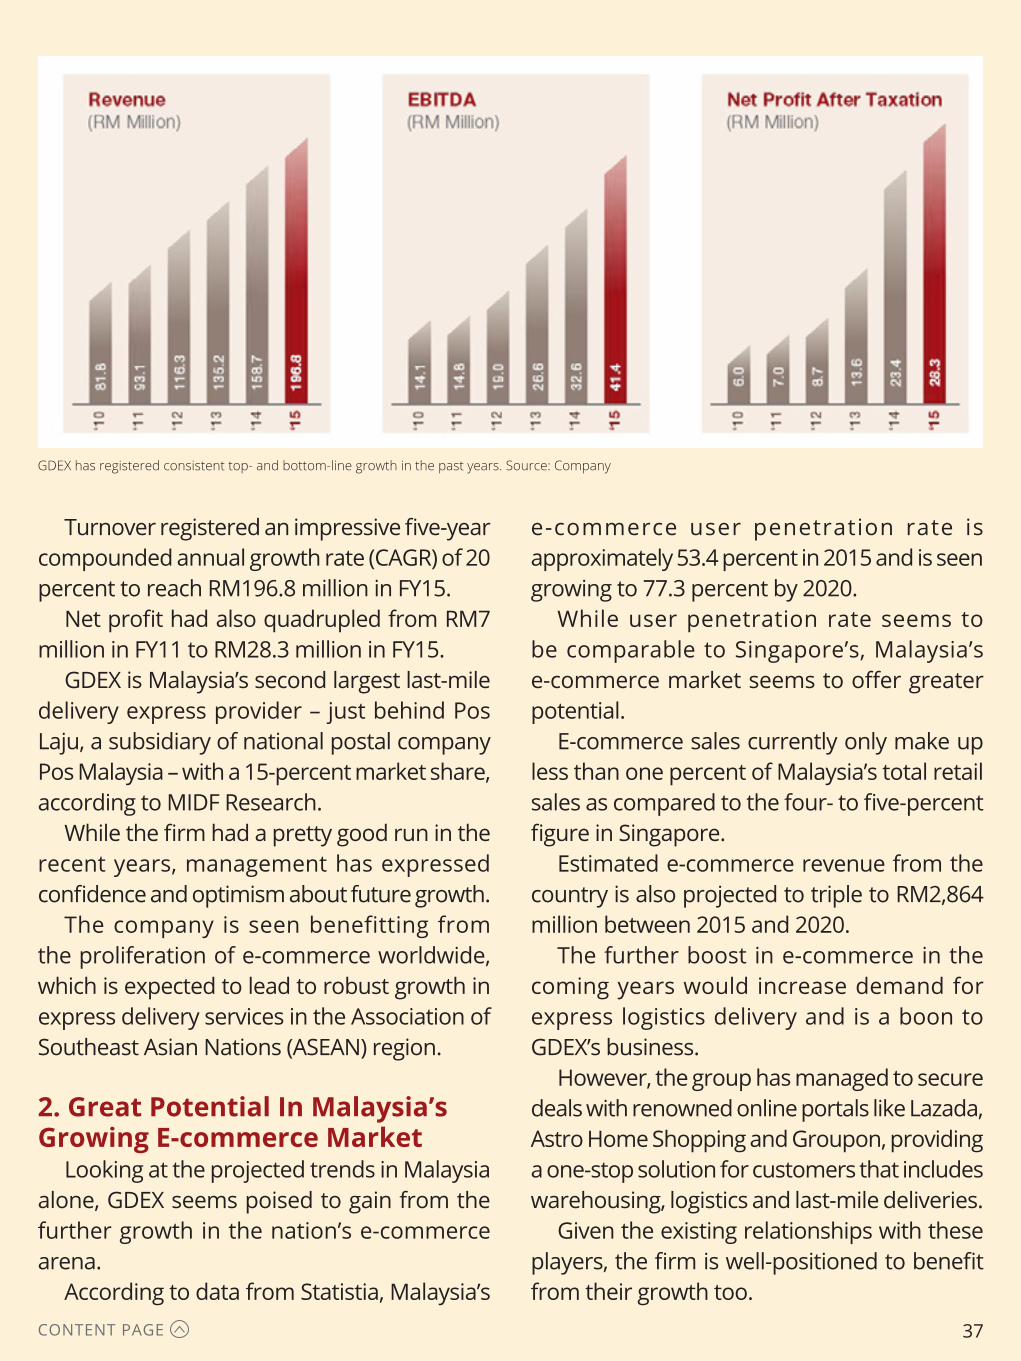
Turnover registered an impressive five-year compounded annual growth rate (CAGR) of 20 percent to reach RM196.8 million in FY15.
Net profit had also quadrupled from RM7 million in FY11 to RM28.3 million in FY15.
GDEX is Malaysia’s second largest last-mile delivery express provider – just behind Pos Laju, a subsidiary of national postal company Pos Malaysia – with a 15-percent market share, according to MIDF Research.
While the firm had a pretty good run in the recent years, management has expressed confidence and optimism about future growth.
The company is seen benefitting from the proliferation of e-commerce worldwide, which is expected to lead to robust growth in express delivery services in the Association of Southeast Asian Nations (ASEAN) region.
2. Great Potential In Malaysia’s Growing E-commerce Market
Looking at the projected trends in Malaysia alone, GDEX seems poised to gain from the further growth in the nation’s e-commerce arena.
According to data from Statistia, Malaysia’s
e-commerce user penetration rate is approximately 53.4 percent in 2015 and is seen growing to 77.3 percent by 2020.
While user penetration rate seems to be comparable to Singapore’s, Malaysia’s e-commerce market seems to offer greater potential.
E-commerce sales currently only make up less than one percent of Malaysia’s total retail sales as compared to the four- to five-percent figure in Singapore.
Estimated e-commerce revenue from the country is also projected to triple to RM2,864 million between 2015 and 2020.
The further boost in e-commerce in the coming years would increase demand for express logistics delivery and is a boon to GDEX’s business.
However, the group has managed to secure deals with renowned online portals like Lazada, Astro Home Shopping and Groupon, providing a one-stop solution for customers that includes warehousing, logistics and last-mile deliveries.
Given the existing relationships with these players, the firm is well-positioned to benefit from their growth too.
GDEX has registered consistent top- and bottom-line growth in the past years. Source: Company
37

CONTENT PAGE
3. Strategic Partnerships With Other Industry Players
Over the years, the company has established partnerships with other international courier players including UPS, FedEx, SingPost, SF Express and TNT.
These tie-ups are beneficial to the firm as apart from providing last-mile delivery services for its partners, the firm also benefits from leveraging on them to provide international delivery services for its own clients.
Notably, SingPost has been one of the largest shareholders of GDEX since 2011 and currently holds an 11.2 percent stake in the latter (after a recent sale of part of its stake).
At the start of 2016, Yamato Holdings – Japan’s top parcel delivery company – took a direct stake in the group, buying up a total 22.8 percent stake in GDEX.
The two parties will have a tie-up on their line haul businesses between major centres to further improve efficiencies and also collaborate to leverage on the opportunities in the growing ASEAN region.
Yamato’s entry as a shareholder is a boost to GDEX’s status as it can be seen as validation of the group’s service level and ability to integrate with other players to extract possible synergies.
ValuationGiven the expectations that growth would
be high at GDEX in the next few years as it rides on the burgeoning e-commerce market in Malaysia and other ASEAN countries, the firm’s stock valuations are rather lofty at the moment.
Based on the close price of RM1.53 as at 27 May, the company’s shares are trading at a trailing twelve-month price-to-earnings ratio (P/E) of 62.2 times, even after share price corrected 15 percent from a high of RM1.80.
In comparison, the group’s Malaysia-listed peer Pos Malaysia trades at 22.6 times P/E while Singapore-listed SingPost has a P/E of 14.6 times.
It is worth pointing out though that Yamato’s acquisition of GDEX shares in early 2016 works out to approximately RM1.68 per share at an even higher valuation of close to 68.3 times P/E.
However, from the former’s perspective, the purchase could be part of a strategic move to gain access to the region and hence the willingness to pay a higher price.
For the average investors though, while GDEX serves as a good proxy to Malaysia’s and the region’s growing e-commerce market, expectations of growth are high as reflected by the share price, something investors have to consider carefully before jumping on the bandwagon.
38
Stock Short Name:
Code:
YTD Return (as at 3 Nov):
Year-To-Date Gains
In 2015, we saw the gaming sector revealing a string of disappointments in results releases.
However, with players have got various expansion plans that will only contribute to earnings in the next few years, will we see optimism in the sea of gloominess for the sector?
Genting Berhad (Genting) saw its share price tumbling from a high of RM9.30 a share on 9 April 2015 to a low of RM6.60 per share on 24 August 2015. This represented a 29 percent fall in less than 6 months.
As of 19 January 2016, Genting seems to be trading in a consolidation region, with prices trading within a contained band between RM7 to RM7.50.
Inconsistent Earnings From Overseas Operations’ Drag
Although Genting’s Leisure and Hospitality operations in Malaysia have been relatively stable and increasing slowly on a consistent basis from FY09 to FY14, its Leisure and Hospitality operations in Singapore, which makes up its largest revenue segment has been inconsistent.
Record bad debts at Genting Singapore have been one of the key reasons why Genting missed on its earnings estimates.
Additionally, VIP gaming volume for its Singapore operations have contracted 50 percent year on year and this has effectively reduced Genting Singapore’s market share of VIP gaming volume to 40 percent, while rival Las Vegas Sands’ Marina
BY: LOUIS KENT LEE
SI RESEARCH:Genting Berhad Continues Search For Optimism In 2016
GENTING
3182
3.13%
GENTING3.13%
KLCI-2.63%
39
CONTENT PAGE
Numbers Run-throughGenting’s current gross margin of 34.6
percent as of FY14 is relatively high for its size, however it is notable that this figure has dropped from 43.8 percent in FY10 to that of 34.6 percent in FY14.
Net income margin has also been declining over the years, at 9.9 percent for FY14. This is probably attributable to a myriad of higher operating expenses.
On the liquidity front, Genting boasts a strong current ratio of 3.7x, and low solvency possibility with total debt/total equity of some 23.7 percent, which has been pared down significantly compared to that of 45.6 percent in FY10.
Genting’s high interest cover ratio of 12x is also more than sufficient to meet any short term interest payment obligations.
Genting’s strong cash vault of RM23.7 billion is also sufficient to cover its total long term debt of RM17.4 billion.
ConclusionAlbeit the gaming market is a matured one
in nature, and that 2015 has been less than pleasant for peers in this sector, we think the current scene has already factored in most of the negativity.
Genting could possibly see benefits materialising from its ventures overseas, e.g. Jeju, Las Vegas, and it is still backed by a strong balance sheet.
Although Genting Singapore’s prospects will still remain challenging given the decline of visitor arrivals from the high-roller segment from China, we expect Genting to enjoy stable earnings on Resorts World Group’s (Msia) earnings while the North American operations, especially Resorts World New York City should be able to drive US based earnings higher.
Bay Sands continues to snag the larger pie of market share of 60 percent.
Part of the negative catalysts creating the overhang on VIP gaming volume is also attributable to the sharp decline in Chinese VIP arrivals in Singapore.
Ventures Overseas, Normalisation, And Focus Strategy
Although Genting Singapore’s operations and share price have seen its fair share of punishments, it seems that negativity for Genting Singapore should have already bottomed out.
With the various expansion plans set forth by Genting Singapore; South Korea and Japan, we think the new focused strategy should be driven by these overseas’ initiatives.
The construction of Resorts World Jeju is on track to open progressively from 2017 and to complete by 2019. We think earnings accretion should come in with better impact from FY17 onwards for Genting Singapore.
Revamping Program Set To Be Major Catalyst
As Phase one of Genting Integrated Tourism Plan goes into the final leg of completion in 2H16, the RM5 billion revamping program of Genting is likely to be the major catalyst to Resorts World Genting.
Primed with the first full-scale 20th Century Theme Park, stipulated to be ready by end 2016/early 2017, the revamp should help bring in more footfalls that could help drive casino traffic. At the time of writing, it is unclear if Genting is allowed to expand its casino floor, but if it does, it will be an even more powerful push.
40
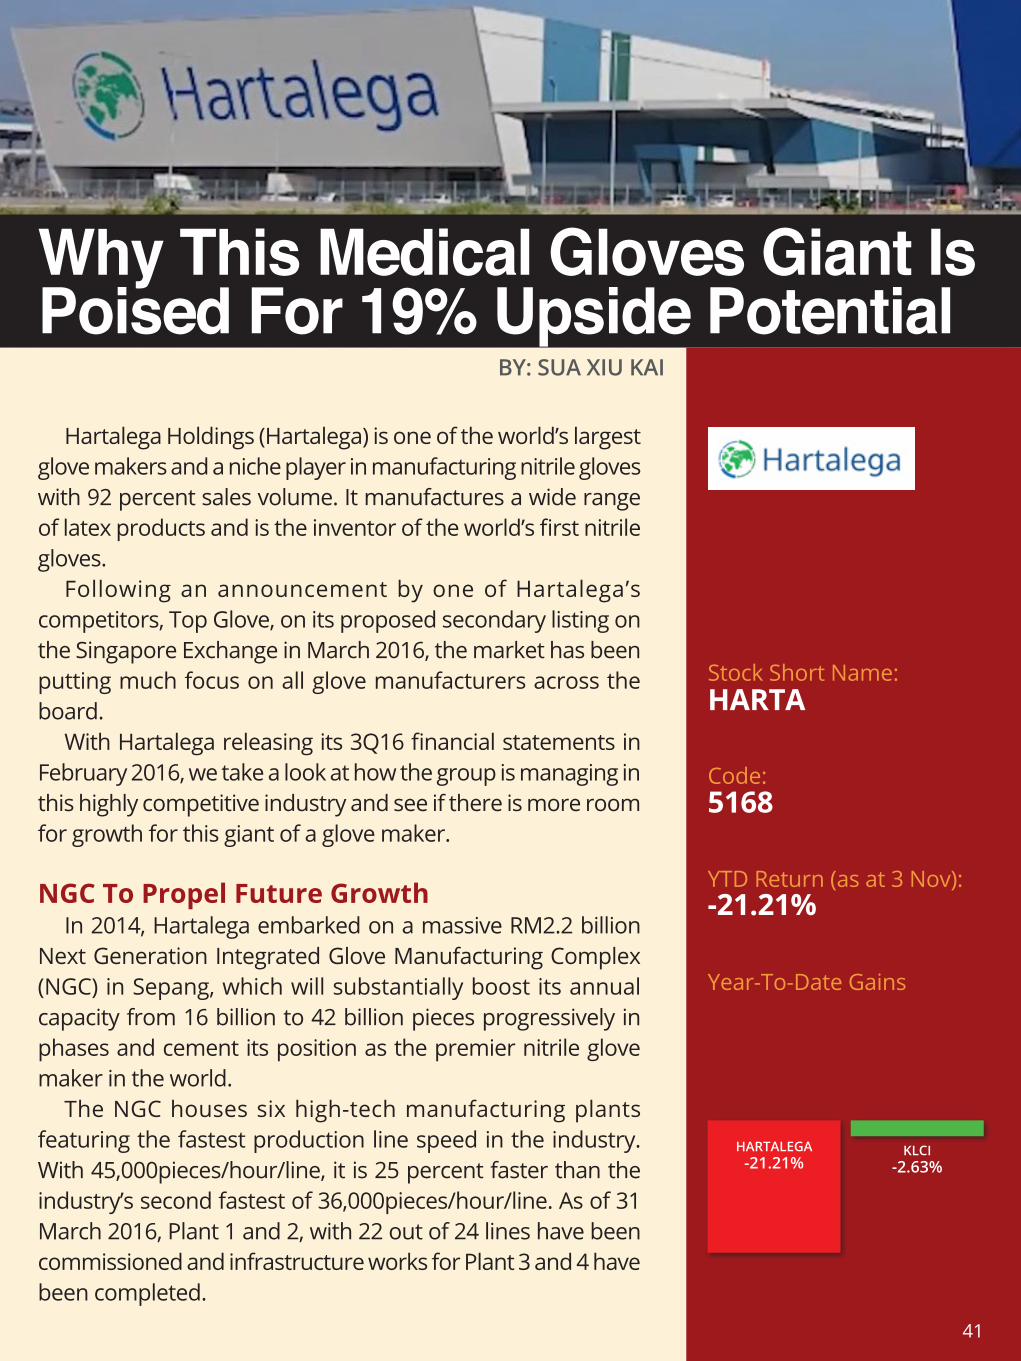
Stock Short Name:
Code:
YTD Return (as at 3 Nov):
Year-To-Date Gains
BY: SUA XIU KAI
Hartalega Holdings (Hartalega) is one of the world’s largest glove makers and a niche player in manufacturing nitrile gloves with 92 percent sales volume. It manufactures a wide range of latex products and is the inventor of the world’s first nitrile gloves.
Following an announcement by one of Hartalega’s competitors, Top Glove, on its proposed secondary listing on the Singapore Exchange in March 2016, the market has been putting much focus on all glove manufacturers across the board.
With Hartalega releasing its 3Q16 financial statements in February 2016, we take a look at how the group is managing in this highly competitive industry and see if there is more room for growth for this giant of a glove maker.
NGC To Propel Future GrowthIn 2014, Hartalega embarked on a massive RM2.2 billion
Next Generation Integrated Glove Manufacturing Complex (NGC) in Sepang, which will substantially boost its annual capacity from 16 billion to 42 billion pieces progressively in phases and cement its position as the premier nitrile glove maker in the world.
The NGC houses six high-tech manufacturing plants featuring the fastest production line speed in the industry. With 45,000pieces/hour/line, it is 25 percent faster than the industry’s second fastest of 36,000pieces/hour/line. As of 31 March 2016, Plant 1 and 2, with 22 out of 24 lines have been commissioned and infrastructure works for Plant 3 and 4 have been completed.
Why This Medical Gloves Giant Is Poised For 19% Upside Potential
HARTA
5168
-21.21%
HARTALEGA-21.21%
KLCI-2.63%
41
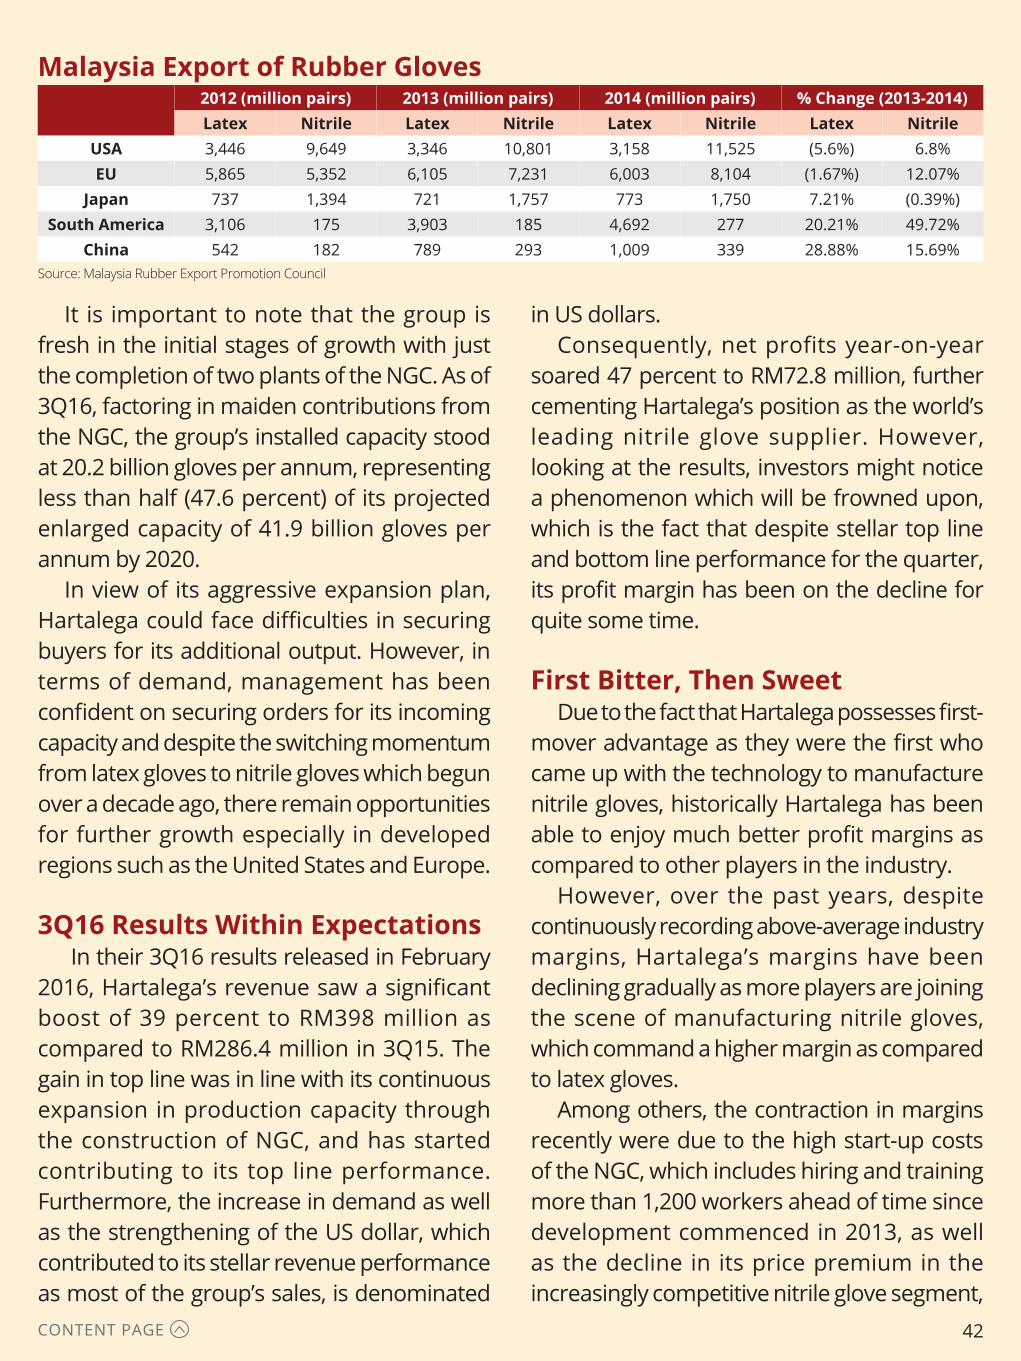
CONTENT PAGE
It is important to note that the group is fresh in the initial stages of growth with just the completion of two plants of the NGC. As of 3Q16, factoring in maiden contributions from the NGC, the group’s installed capacity stood at 20.2 billion gloves per annum, representing less than half (47.6 percent) of its projected enlarged capacity of 41.9 billion gloves per annum by 2020.
In view of its aggressive expansion plan, Hartalega could face difficulties in securing buyers for its additional output. However, in terms of demand, management has been confident on securing orders for its incoming capacity and despite the switching momentum from latex gloves to nitrile gloves which begun over a decade ago, there remain opportunities for further growth especially in developed regions such as the United States and Europe.
3Q16 Results Within Expectations In their 3Q16 results released in February
2016, Hartalega’s revenue saw a significant boost of 39 percent to RM398 million as compared to RM286.4 million in 3Q15. The gain in top line was in line with its continuous expansion in production capacity through the construction of NGC, and has started contributing to its top line performance. Furthermore, the increase in demand as well as the strengthening of the US dollar, which contributed to its stellar revenue performance as most of the group’s sales, is denominated
2012 (million pairs) 2013 (million pairs) 2014 (million pairs) % Change (2013-2014)Latex Nitrile Latex Nitrile Latex Nitrile Latex Nitrile
USA 3,446 9,649 3,346 10,801 3,158 11,525 (5.6%) 6.8%EU 5,865 5,352 6,105 7,231 6,003 8,104 (1.67%) 12.07%
Japan 737 1,394 721 1,757 773 1,750 7.21% (0.39%)South America 3,106 175 3,903 185 4,692 277 20.21% 49.72%
China 542 182 789 293 1,009 339 28.88% 15.69%Source: Malaysia Rubber Export Promotion Council
Malaysia Export of Rubber Gloves
in US dollars.Consequently, net profits year-on-year
soared 47 percent to RM72.8 million, further cementing Hartalega’s position as the world’s leading nitrile glove supplier. However, looking at the results, investors might notice a phenomenon which will be frowned upon, which is the fact that despite stellar top line and bottom line performance for the quarter, its profit margin has been on the decline for quite some time.
First Bitter, Then SweetDue to the fact that Hartalega possesses first-
mover advantage as they were the first who came up with the technology to manufacture nitrile gloves, historically Hartalega has been able to enjoy much better profit margins as compared to other players in the industry.
However, over the past years, despite continuously recording above-average industry margins, Hartalega’s margins have been declining gradually as more players are joining the scene of manufacturing nitrile gloves, which command a higher margin as compared to latex gloves.
Among others, the contraction in margins recently were due to the high start-up costs of the NGC, which includes hiring and training more than 1,200 workers ahead of time since development commenced in 2013, as well as the decline in its price premium in the increasingly competitive nitrile glove segment,
42
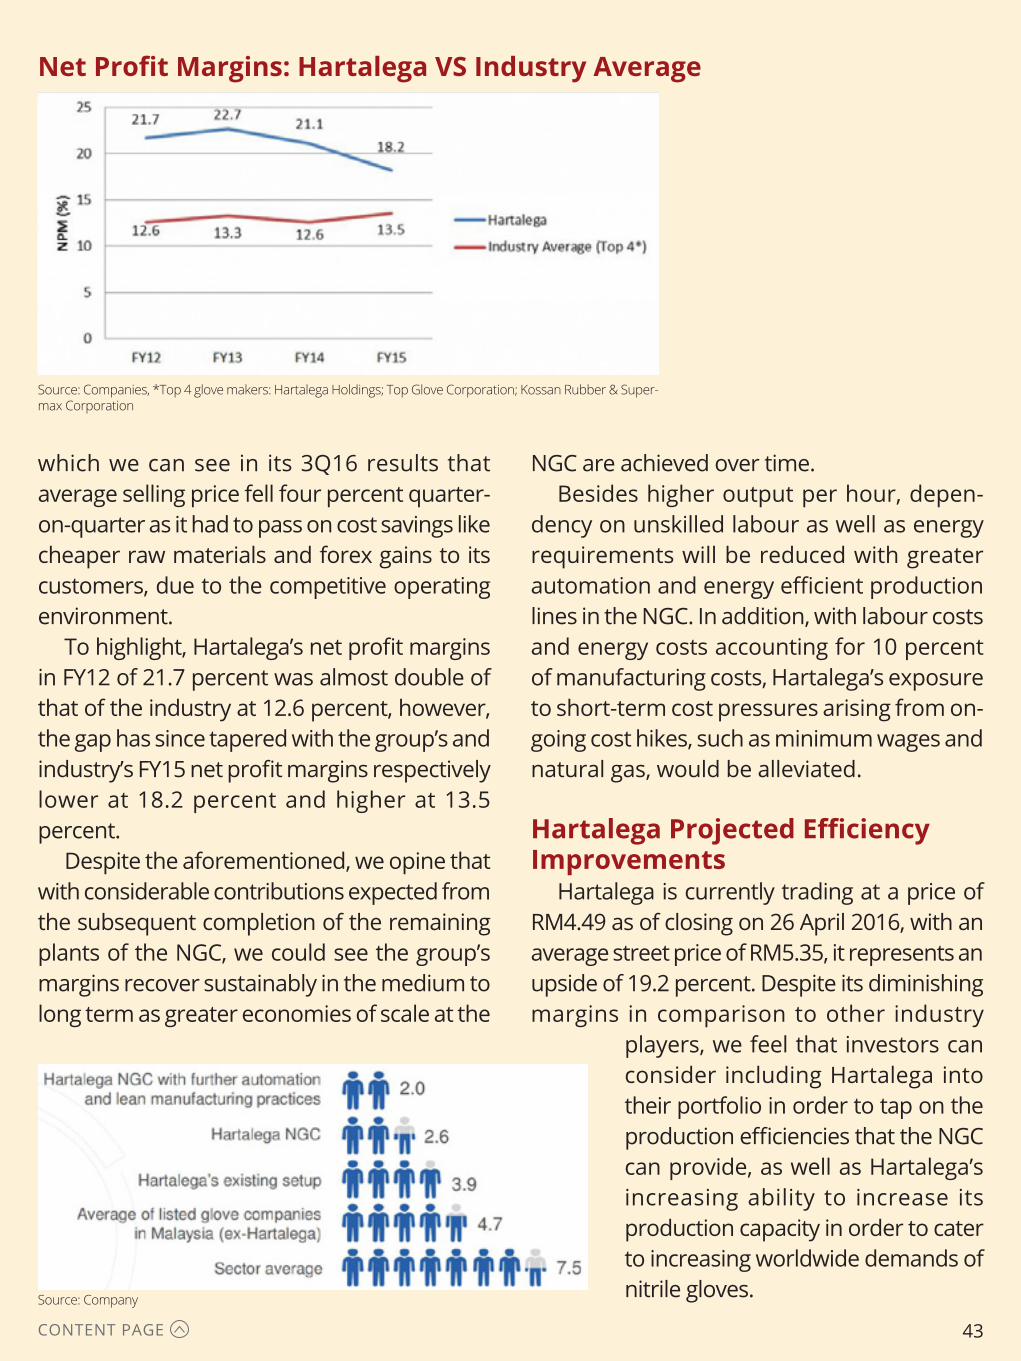
CONTENT PAGE
which we can see in its 3Q16 results that average selling price fell four percent quarter-on-quarter as it had to pass on cost savings like cheaper raw materials and forex gains to its customers, due to the competitive operating environment.
To highlight, Hartalega’s net profit margins in FY12 of 21.7 percent was almost double of that of the industry at 12.6 percent, however, the gap has since tapered with the group’s and industry’s FY15 net profit margins respectively lower at 18.2 percent and higher at 13.5 percent.
Despite the aforementioned, we opine that with considerable contributions expected from the subsequent completion of the remaining plants of the NGC, we could see the group’s margins recover sustainably in the medium to long term as greater economies of scale at the
Source: Companies, *Top 4 glove makers: Hartalega Holdings; Top Glove Corporation; Kossan Rubber & Super-max Corporation
Net Profit Margins: Hartalega VS Industry Average
NGC are achieved over time.Besides higher output per hour, depen-
dency on unskilled labour as well as energy requirements will be reduced with greater automation and energy efficient production lines in the NGC. In addition, with labour costs and energy costs accounting for 10 percent of manufacturing costs, Hartalega’s exposure to short-term cost pressures arising from on-going cost hikes, such as minimum wages and natural gas, would be alleviated.
Hartalega Projected Efficiency Improvements
Hartalega is currently trading at a price of RM4.49 as of closing on 26 April 2016, with an average street price of RM5.35, it represents an upside of 19.2 percent. Despite its diminishing margins in comparison to other industry
players, we feel that investors can consider including Hartalega into their portfolio in order to tap on the production efficiencies that the NGC can provide, as well as Hartalega’s increasing ability to increase its production capacity in order to cater to increasing worldwide demands of nitrile gloves.Source: Company
43
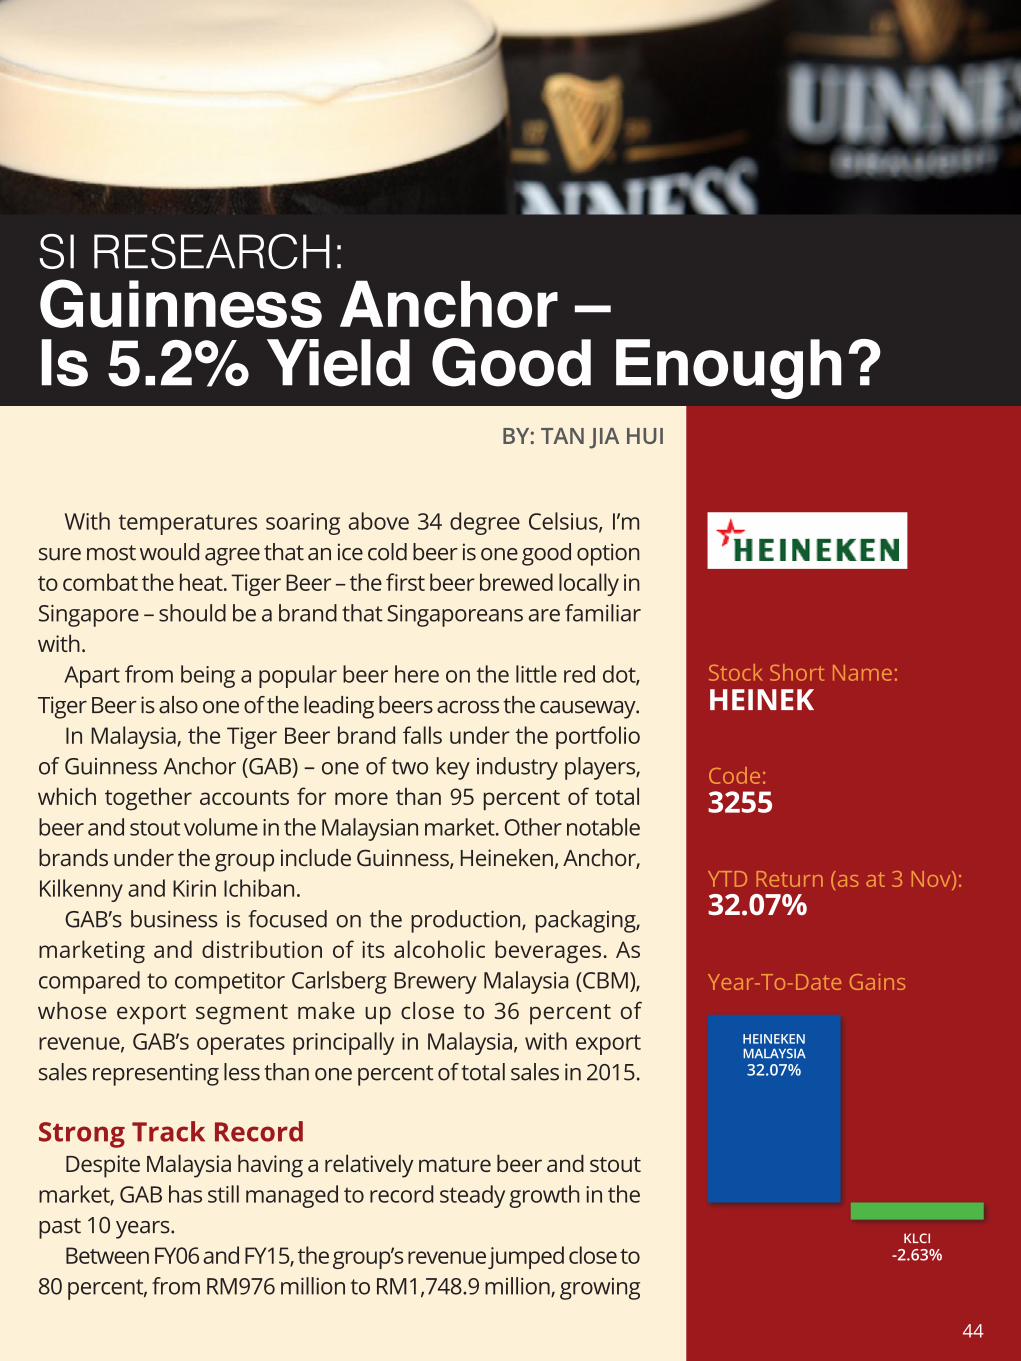
Stock Short Name:
Code:
YTD Return (as at 3 Nov):
Year-To-Date Gains
SI RESEARCH:Guinness Anchor – Is 5.2% Yield Good Enough?
BY: TAN JIA HUI
With temperatures soaring above 34 degree Celsius, I’m sure most would agree that an ice cold beer is one good option to combat the heat. Tiger Beer – the first beer brewed locally in Singapore – should be a brand that Singaporeans are familiar with.
Apart from being a popular beer here on the little red dot, Tiger Beer is also one of the leading beers across the causeway.
In Malaysia, the Tiger Beer brand falls under the portfolio of Guinness Anchor (GAB) – one of two key industry players, which together accounts for more than 95 percent of total beer and stout volume in the Malaysian market. Other notable brands under the group include Guinness, Heineken, Anchor, Kilkenny and Kirin Ichiban.
GAB’s business is focused on the production, packaging, marketing and distribution of its alcoholic beverages. As compared to competitor Carlsberg Brewery Malaysia (CBM), whose export segment make up close to 36 percent of revenue, GAB’s operates principally in Malaysia, with export sales representing less than one percent of total sales in 2015.
Strong Track RecordDespite Malaysia having a relatively mature beer and stout
market, GAB has still managed to record steady growth in the past 10 years.
Between FY06 and FY15, the group’s revenue jumped close to 80 percent, from RM976 million to RM1,748.9 million, growing
HEINEK
3255
32.07%
HEINEKEN MALAYSIA32.07%
KLCI-2.63%
44

CONTENT PAGE
at a compounded annual growth rate (CAGR) of 6.7 percent. In fact, top line growth has almost been uninterrupted over the period, declining only in FY14, which the firm attributed to overall weaker domestic consumption in Malaysia and the rise in competition from contraband beers. Earnings have also increased 67.1 percent from RM128.2 million in FY06 to RM214.2 million in FY15 (5.9 percent CAGR).
Over the years, the company has managed to maintain or even improve its gross and earnings before interest and tax (EBIT) margins, as seen from the chart below. This is achieved on the back of successful costs controls, improvements in efficiency, better sales mix (with the introduction of premium beers) and its procurement strategy that leverages its ultimate holding company GAPL (owned by Dutch-listed Heineken) with a global procurement network.
Looking ahead, GAB has started FY16 on a good note. 1H16 revenue was up marginally 1.7 percent to RM929.5million, boosted Chinese New Year sales and new launches of products. Net profit rose 17.8 percent to RM153.9 million, on the back of improved cost efficiency.
Cash Generating Machine That Pays Decent Dividends
Apart from steady top and bottom line performances, what is more impressive about the group is its cash generating abilities. There is no doubt that GAB, as an established beer brewer, has a business that is profitable and can consistently generate cash.
As far as we can trace, the company’s operating cash flow has been positive since at least FY00. Remarkably, GAB has also been generating positive free cash flow at the same time – given that capital expenditure is relatively stable for such a mature business.
With the cash, the group has rewarded shareholders over the years, having paid out dividends without fail – as far as record shows – since FY1996.
Between FY11 and FY15, the group’s dividends grew at 7.1 percent CAGR, from RM0.54 per share to RM0.71 per share. The close price of RM13.78 as at 6 April, translates to a 5.2 percent dividend yield for FY15.
Source: Company Annual Reports
45
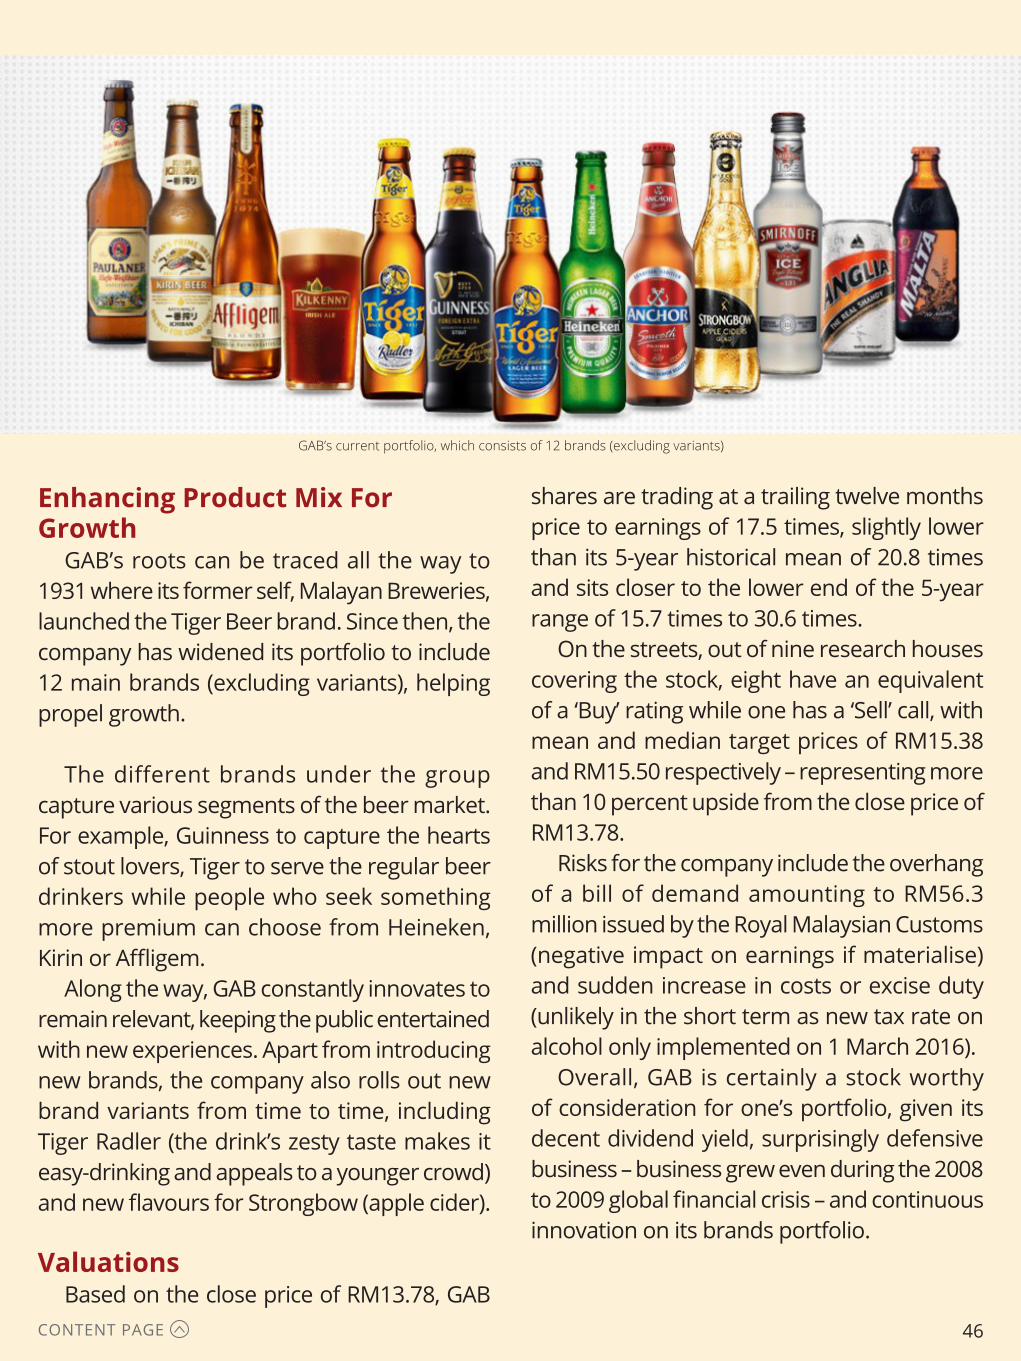
CONTENT PAGE
Enhancing Product Mix For Growth
GAB’s roots can be traced all the way to 1931 where its former self, Malayan Breweries, launched the Tiger Beer brand. Since then, the company has widened its portfolio to include 12 main brands (excluding variants), helping propel growth.
The different brands under the group capture various segments of the beer market. For example, Guinness to capture the hearts of stout lovers, Tiger to serve the regular beer drinkers while people who seek something more premium can choose from Heineken, Kirin or Affligem.
Along the way, GAB constantly innovates to remain relevant, keeping the public entertained with new experiences. Apart from introducing new brands, the company also rolls out new brand variants from time to time, including Tiger Radler (the drink’s zesty taste makes it easy-drinking and appeals to a younger crowd) and new flavours for Strongbow (apple cider).
ValuationsBased on the close price of RM13.78, GAB
GAB’s current portfolio, which consists of 12 brands (excluding variants)
shares are trading at a trailing twelve months price to earnings of 17.5 times, slightly lower than its 5-year historical mean of 20.8 times and sits closer to the lower end of the 5-year range of 15.7 times to 30.6 times.
On the streets, out of nine research houses covering the stock, eight have an equivalent of a ‘Buy’ rating while one has a ‘Sell’ call, with mean and median target prices of RM15.38 and RM15.50 respectively – representing more than 10 percent upside from the close price of RM13.78.
Risks for the company include the overhang of a bill of demand amounting to RM56.3 million issued by the Royal Malaysian Customs (negative impact on earnings if materialise) and sudden increase in costs or excise duty (unlikely in the short term as new tax rate on alcohol only implemented on 1 March 2016).
Overall, GAB is certainly a stock worthy of consideration for one’s portfolio, given its decent dividend yield, surprisingly defensive business – business grew even during the 2008 to 2009 global financial crisis – and continuous innovation on its brands portfolio.
46
Stock Short Name:
Code:
YTD Return (as at 3 Nov):
Year-To-Date Gains
BY: TAN JIA HUI
Singapore’s land size has grown by approximately 22 per-cent since its British colonial times, all made possible with land reclamation. The process, which usually involves filling up areas of wetlands or sea with a mixture of sand, cement and other materials to create new land, actually falls under the civil engineering segment of the broader construction industry.
To be more precise, land reclamation, dredging and other specialised water-related engineering projects falls under a niche segment called marine engineering (or marine civil en-gineering).
This time round, we take a closer look at Sarawak-based infrastructure firm Hock Seng Lee (HSL), who is seen as a beneficiary of the increased infrastructure spending in the region. Given Sarawak’s swampy terrain, reclamation usually needs to be carried out before most construction activity can take place and HSL with its marine engineering expertise has an edge in this area.
BusinessHSL started as a company principally engaged in dredg-
ing and land fill operations. As the firm grew in size, it began undertaking land reclamation projects of larger size and com-plexity, establishing itself as the Sarawak’s market leader in land reclamation.
Along the way, the group also acquired complementary ex-pertise in soil improvement works, shore protection, drainage and water reticulation activities. Consequently, the firm diver-sified into a wide range of civil engineering and constructions works, which includes road works, township developments,
Hock Seng Lee – Robust Order Book Of Rm2.3 Billion, Possible 30% Upside?
HSL
6238
-8.99%
HOCK SENG LEE-8.99%
KLCI-2.63%
47

CONTENT PAGE
tunnel boring as well as other infrastructure projects.
While the company has also dabbled in property development, its construction busi-ness is still the largest revenue contributor, accounting for 95.1 percent of FY15 turnover.
Since its listing in 1996, revenue has been on a general uptrend, albeit lumpy at times due to the nature of its project-based business. Simi-larly, net profit has also been fluctuating over the years, underpinned by the lumpy revenue recognition and cost pressures faced. That said, HSL has remained profitable each year since its listing, a commendable record.
Promising Outlook Underpinned By RM2.3b Order Book
Based on the close price of RM1.75 per share as of 28 September, HSL’s shares have slid approximately 18.2 percent from a high of RM2.14 per share in March. Apart from market volatility, the lacklustre 1H16 results was prob-ably a main contributor to the poor share price performance.
For 1H16, top line fell 25.8 percent to RM249.3 million while earnings declined 22.9 percent to RM28.3 million. The weaker results were mainly attributable to lower revenue con-tribution for newer projects and the comple-tion of older projects.
However, turnover and net profit are ex-pected to pick up in 2H16, on the back of suc-cessive job wins for two major projects worth RM1.9 billion in 1Q16. The two contracts se-cured were for the RM750 million Kuching City Central Wastewater Management System (Package 2) project (HSL’s stake: 70 percent) and the RM1.7 billion Pan-Borneo Highway package 7 (HSL’s stake: 75 percent).
With the latest contract wins, HSL’s order book was boosted to RM2.3 billion as of 30
June 2016, which should keep the firm busy and provide earnings visibility for the next four to five years. As the new projects were only se-cured in March, revenue recognition was neg-ligible for 1H16 though the pace is projected to pick up going forward.
Healthy Balance Sheet With Zero Debt
Apart from the outstanding order book, HSL also boasts a strong balance sheet with no debt and RM113.8 million in cash and equivalent and short-term investments as of 30 June 2016.
While the current dividend yield of around 1.4 percent is nothing to shout out about, we like that the firm has been consistently reward-ing shareholders with dividend payouts in each year since its listing.
Despite being optimistic about HSL’s earn-ings going forward, supported by its RM2.3 billion construction order book and ongoing property development projects, we also note some of the risks that the firm could face.
Firstly, given the huge order book, execution risks exist and delay in the projects could nega-tively impact its performance. Additionally, a sudden spike in costs (labour, raw material etc.) could also hurt the company’s margins. Lastly, a reduction in government infrastruc-ture spending is also a threat to the group as its construction division relies rather heavily on public projects.
Overall though, analysts on the streets ap-pear to be rather optimistic on HSL, with the consensus rating equivalent to a ‘Buy’ call and an average target price of RM2.26, which im-plies a possible 29.1 percent upside from the close price of RM1.75 on 28 September.
48
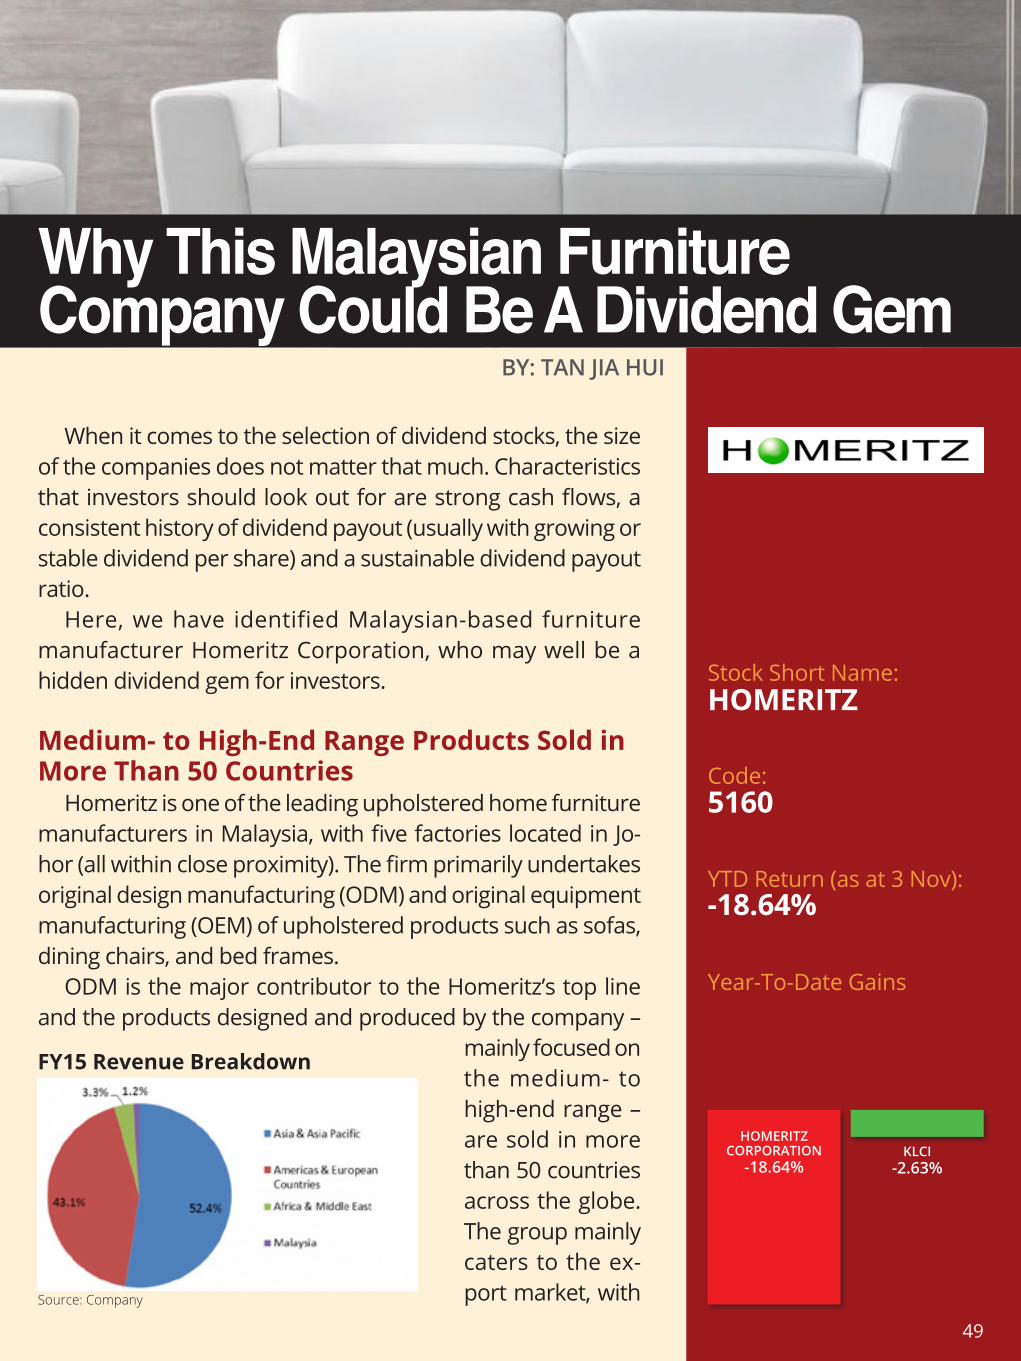
Stock Short Name:
Code:
YTD Return (as at 3 Nov):
Year-To-Date Gains
BY: TAN JIA HUI
When it comes to the selection of dividend stocks, the size of the companies does not matter that much. Characteristics that investors should look out for are strong cash flows, a consistent history of dividend payout (usually with growing or stable dividend per share) and a sustainable dividend payout ratio.
Here, we have identified Malaysian-based furniture manufacturer Homeritz Corporation, who may well be a hidden dividend gem for investors.
Medium- to High-End Range Products Sold in More Than 50 Countries
Homeritz is one of the leading upholstered home furniture manufacturers in Malaysia, with five factories located in Jo-hor (all within close proximity). The firm primarily undertakes original design manufacturing (ODM) and original equipment manufacturing (OEM) of upholstered products such as sofas, dining chairs, and bed frames.
ODM is the major contributor to the Homeritz’s top line and the products designed and produced by the company –
mainly focused on the medium- to high-end range – are sold in more than 50 countries across the globe. The group mainly caters to the ex-port market, with
Why This Malaysian Furniture Company Could Be A Dividend Gem
Source: Company
FY15 Revenue Breakdown
HOMERITZ
5160
-18.64%
HOMERITZ CORPORATION
-18.64%KLCI
-2.63%
49
CONTENT PAGE
revenue derived from overseas customers making up 98.9 percent of FY15 turnover.
Strong Earnings Growth – 21.5% CAGR Over 5 Years to RM23.6 Million
Zooming in on Homeritz’s financials, rev-enue grew at a compounded annual growth rate (CAGR) of 13.5 percent between FY11 and FY15 to reach RM149.6 million while earnings grew at an impressive 21.5 percent CAGR to RM23.6 million in the same period.
Despite tepid economic conditions in past year or so, the group’s turnover and net profit still recorded increases of a 14.2 percent and 38.6 percent year-on-year to RM123.6 million and RM23.4 million respectively, for the nine months ended 31 May.
The better top and bottom lines were achieved on the back of higher sales vol-ume, and boosted by a strengthening US dollar against the Malaysian ringgit (since September 2014). Hong Leong Investment Bank pointed out that about 99 percent of the firm’s sales are made in US dollar while approximately 30 percent of costs are de-nominated in ringgit, making it a beneficiary of the strengthening greenback.
Homeritz’s earnings growth is also sup-ported by stable margins. The company’s gross margin has been kept at above 40 per-cent in the past five financial years while net margin has averaged 14.2 percent. The ability to sustain its margins partly comes from the fact that the group adopts a short-term order book and cost-plus strategy, which serves as a
natural hedge to fluctuation in raw materials cost as well as foreign exchange rates.
Catalyst From Capacity Expansion? Possible 20% Boost in Production Capacity
With its factories running at an average 80 percent to 85 percent utilisation rate, Homer-itz is also considering further expansion of its production capacity if market conditions are suitable.
At the moment, the company is focused on increasing its productivity through increased investment in advanced machinery, with the aim of automating some of its work process-es. The company has earmarked RM10 mil-lion to be spent from FY15 to FY17 on plant and machinery with the aim of increasing its capacity.
The group also has available land bank – a vacant plot near to its existing factories – for a new factory that could possibly boost total production capacity by close to 20 percent.
Consistent History Of Dividend Payout; At Least 40% Net Profit
The group has a dividend policy of paying out at least 40 percent of its net profit and has been rewarding shareholders with dividend payout each year since its listing in 2010.
The firm was able to double dividend per share (DPS) from RM0.0225 in FY11 to RM0.051 in FY14 on the back of increasing net profit. While DPS dipped to RM0.04 in FY15, investors should not be overly alarmed as it was mainly due to a bonus issue in July 2015
FY11 FY12 FY13 FY14 FY15
Gross Margin 42.7% 45.1% 42.8% 45.0% 46.8%
Net Margin 12.0% 14.2% 13.4% 15.9% 15.7%
50
CONTENT PAGE
which increased the number of shares from 200 million to 300 million. Total dividend pay-out still grew from RM10.2 million in FY14 to RM12 million in FY15.
Apart from the actual DPS, two other met-rics investors should look out for in a possible dividend stock are payout ratio and free cash flow (FCF) payout ratio. Both metrics give us an idea whether the firm is paying out divi-dends within and hence allow us to judge if the dividend payout is sustainable.
A payout ratio between 30 percent and 60 percent is usually seen as comfortable, and Homeritz’s payout ratio of between 40 per-cent and 51 percent for the past five financial years falls into the range. FCF payout ratio also looks decent at below 55 percent.
ValuationHomeritz’s shares closed at RM0.93 per
share as at 2 August. The share price trans-lates to a trailing twelve months price to earn-ings ratio (P/E) of 9.4 times, which is quite close to the firm’s three-year mean P/E of 9.9 times. That said, analysts on the street are on average having the equivalent of a ‘Buy’ rating on the stock with a target price of RM1.18.
While FY15 dividend yield of 4.3 percent might not be high enough for some investors out there, the growth trend in earnings and dividend payout is something we like about
the stock. Furthermore, the group also boasts a strong balance sheet with a net cash posi-tion of RM50.8 million as of 31 May.
On the other hand, possible risks for the stock include a weakening of the US dollar, spike in raw material prices and a further slowdown in the global economy that could reduce demand for mid- to high-end furni-ture.
FY11 FY12 FY13 FY14 FY15
Dividend Per Share (RM) 0.0225 0.03 0.0375 0.051 0.04
Total Payout (RM’m) 4.5 6.0 7.5 10.2 12.0
Payout Ratio 41.6% 40.8% 49.6% 50.4% 51.0%
Free Cash Flow (FCF) (RM’m) -3.7 18.9 17.7 27.9 22.6
FCF Payout Ratio NA 31.7% 42.4% 36.6% 53.1%
51
Stock Short Name:
Code:
YTD Return (as at 3 Nov):
Year-To-Date Gains
BY: JOEY HO
SI RESEARCH:Will IHH Healthcare Be Able To Meet Market Expectations?
IHH Healthcare (IHH) has gained much popularity amid the current market turbulence. However, while the healthcare is considered as a defensive sector, the private healthcare sector is likely to take a hit from a slowdown in the economy.
Based on the closing price of RM6.56 as of 29 January 2016, IHH’s price-to-earnings ratio has swelled up to 71 times. In comparison, Raffles Medical Group currently trades at a PE of 33.6 times. The current valuations reflect investors’ high expectations of its growth strategy.
Singapore – High Concentration RiskAs of FY14, contributions from the group’s operations
in Singapore made up 37.3 percent of the total revenue, down from 49 percent in FY12.
Over the past three years, revenue from operations in Singapore fell by 19.8 percent. The poorer performance is also likely to have been played-down by a stronger Singapore dollar which has appreciated approximately 20 percent against the Malaysian ringgit during the same period.
In recent years, healthcare standards in neighboring countries have improved, threatening the lion city’s competitive advantage. The stronger Singapore dollar also puts further tests on the price premiums. While IHH has put in motion several plans for expansion in Hong Kong,
IHH
5225
-3.50%
IHH HEALTHCARE-3.50%
KLCI-2.63%
52
CONTENT PAGE
India and China, these new facilities would not be able to contribute to the near term performance.
The group has also reduced its capital expenditure in Singapore by 74.2 percent from FY12 to FY14, indicating a lower level of confidence in the growth of private healthcare services. Medical tourism receipts in FY14 only grew 19.5 percent to $994 million from FY13, still down 10.5 percent from the peak of $1.1 billion in FY12.
Seeking Greener PasturesIn March 2015, IHH announced the
acquisition of a 51 percent stake in Continental Hospitals in India. The facility has a capacity of 750 beds with 250 beds currently operational.
In August 2015, the group continued its acquisition spree in India with an agreement to buy a 73.4 percent stake in an India’s Ravindranath GE Medical Associates which owns and operates hospitals under the brand name Global Hospitals. The 12.84 billion Indian rupees acquisition is aimed at expanding its presence in the world’s second most populous nation by consolidating all of Global Hospitals’ facilities under the Gleneagles brand.
Gleneagles Hong Kong Hospital, which is on track to open in early 2017, will be the group’s first hospital in Hong Kong. The facility is a 500-bed hospital which provides a comprehensive range of clinical services spanning more than 15 specialties. The hospital will be Hong Kong’s first private hospital in three decades and a quick ramp-up is expected, based on HK’s demand/supply dynamics and superior pricing. While the development is expected to beneficial to IHH, it is worthy to note that the group
only contributed 60 percent of the total investment cost under the collaboration.
Over at mainland China, the group’s 350-bed ParkwayHealth Chengdu Hospital is scheduled to open in the second half of 2017 and will be Chengdu’s first foreign tertiary hospital and IHH’s first hospital in Western China. The facility is expected to benefit from a total population catchment of 148 million residents in the region.
Though IHH’s investment into the potential of economic heavyweights China and India which will eventually become its core markets is seen as a positive move, it is unlikely that the benefits will be able to support current valuations in the near term.
Myanmar VentureParkway Yangon, the group’s first 250-bed
hospital in Myanmar, is scheduled to open in 2020. The joint venture, of which IHH holds a 52 percent share, is aimed at bringing high-quality healthcare to the people of Myanmar. The move is in line with the view that Singapore is losing its competitive advantage in the private healthcare sector as competition grows strong in nearby developing countries.
While the foray into Myanmar would not add much value to the group until 2020, it is likely to provide the group with much geographical diversification benefits as well as a platform for further expansion following the commencement of operations.
RisksStaff costs account for 38.4 percent of
the group’s revenue in FY14, up from 37.6 percent in FY13. In a publication by the World Health Organization, the world will be short of 12.9 million health-care workers by 2035.
53
CONTENT PAGE
The occurrence of such a scenario could result in higher wages needed to retain or attract talent.
While the weakened Malaysian Ringgit, which is the group’s reporting currency, has been favorable so far. Any unforeseen depreciation of the Singapore dollar and the Turkish Lira against the Malaysian Ringgit is likely to affect results.
In our view, at current valuation levels, IHH commands a high level of risk as even a slight deviation from the current growth trend or adverse effect from the slowing economy could result in a massive downward revaluation. Based on the price-to-earnings ratio of 71 times, we believe that IHH is currently overvalued as it does not appear to be doing well enough to justify the current valuation.
54
Stock Short Name:
Code:
YTD Return (as at 3 Nov):
Year-To-Date Gains
BY: TAN JIA HUI
Remember the first time you walked into a room that auto-matically lights up? While rare in the past, many buildings are now equipped with smart lighting systems, which uses sensors to detect and control lighting to achieve energy efficiency.
Today, sensors are also commonly used in numerous ap-plications including car park space monitoring, central heating and air-conditioning systems (using thermostats) and speed cameras. As the world move towards the vision of the Internet of Things (IoT), sensors which can collect and transmit data back to cloud servers play an important role.
With potential seen in the market for sensor-based prod-ucts, we zoom in on IQ Group Holdings (IQ Group), a motion sensor lighting producer listed in Malaysia.
Business – Most Revenue from Europe, Japan, and the US
IQ Group, founded in Penang, Malaysia in 1989, is principally engaged in the design and manufacturing of sensor products which includes passive infrared detectors, motion sensor light controllers, wireless video communication devices, door bells and home security system products.
Subsequently, the group formed a joint venture with Tai-wan-based SemiLEDs Optoelectronics Co to diversify into the development, design and manufacture of light-emitting diode (LED) luminaires, hoping to ride on the growing LED market.
The company operates under both the original equipment manufacturer (OEM) and original design manufacturer (ODM) business models, with manufacturing facilities located in Penang and Dongguan, China. The group derives most of its
Can Global LED Market Growth Light Up IQ Group Holdings’ Prospects?
IQGROUP
5107
10.58%
IQ GROUP HOLDINGS10.58%
KLCI-2.63%
55
CONTENT PAGE
revenue from customers in Europe, Japan and the US, and main customers of the firm are said to include big names like OSRAM, OPTEX Co and Hager.
The core technologies of the firm focus on passive infrared (PIR) sensors which operate by monitoring the background ‘temperature’), and wire-free door chimes and video intercom systems.
Turnaround Story – Recovered from GFC; Revenue and Net Profit Growing
Looking at IQ Group’s past operating per-formance, things were not all smooth for the firm. The company fell into losses for three consecutive financial years from FY09 to FY11 before making a turnaround in FY12.
The group’s performance in those periods was dragged down by poor economic condi-tions during the global financial crisis, cou-pled with a rise in manufacturing costs, par-ticularly in China. IQ Group then underwent a successful restructuring exercise (completed in FY11) and streamlined its processes to improve efficiency and reduce costs, which helped return it to profitability.
In the past five financial years from FY12 to FY16, the firm’s top and bottom lines have been on a general uptrend. Revenue and net
IQ Group’s core technologies, Source: Company
Source: Company
profit grew at compounded annual growth rate of 6.3 percent and 35 percent over the period to reach RM190.9 million and RM20.9 million respectively.
While there was a dip in earnings in FY13, we note that it was due to foreign exchange loss of RM1.6 million and the absence of disposal gains amounting to RM4.2 million recorded in FY12. Net margin has also been improving and held steady at 10.8 percent and 10.9 percent for FY15 and FY16 respec-tively.
Strong Balance Sheet And Cash Flows – 30% of Market Cap
In terms of financial strength, IQ Group boasts a cash-rich balance sheet that is free of debts. As of 30 June 2016, the firm’s net cash stood at approximately RM56.8 million (in-cluding short-term deposits), which translates
56

CONTENT PAGE
to roughly 30.8 percent of its market capitali-sation of RM184.4 million as of 5 September.
On the cash flows front, the group has posted positive operating cash flows in all of the past years except for FY11. We like that the company’s free cash flows have also been positive in the latest four financial years from FY13 to FY16. The strong cash generating ca-pabilities have, in turn, allowed IQ Group to build up its cash reserves.
As business recovered and cash pile grew, the firm rewarded shareholders with the re-sumption of dividend payout in FY15. Based on the share price of RM2.09 as at 5 Sep-tember’s close, IQ Group’s FY16 dividend per share of RM0.10 translated to a decent yield of 4.8 percent.
Management: In-house Brand LED Lighting Expected To Drive Growth
In the past few years, IQ Group has de-veloped its own intelligent lighting solutions, which was launched in early 2015 under the Lumiqs brand. Lumiqs LED products are equipped with wireless transceivers and can be programmed to grow dimmer or brighter according to movement of people in an area, allowing up to 90 percent energy saving.
Currently, the Lumiqs range of products are mainly targeted at the industrial and com-mercial markets but the firm is developing and designing a new sensor lighting offering (projected to be released by 2018) to be used in small commercial premises and residential households. According to the firm, orders for the Lumiqs lighting solutions have already started coming in from South-East Asian countries, Japan, Australia, and Switzerland.
The group expects its in-house brand name LED products to be its driver of growth
in the next five years. Riding on a forecast that the global LED market will hit US$42.7 billion by 2020, the company targets for the Lumiqs brand to generate 10 percent of its total rev-enue by 2018, and 30 percent by 2020.
ConclusionBased on a share price of RM2.09, the
company’s shares are trading at a trailing twelve months price to earnings ratio (P/E) of 8.7 times, which seems reasonable given the company’s performance and growth prospect. In contrast, Taiwan-listed peer Everspring Industry Co (Everspring) trades at a P/E of 25.3 times. While Everspring’s mar-ket capitalisation is about three times that of IQ Group, we note that the former’s latest full year net profit is only about 10 percent higher.
Overall, we foresee the demand for the IQ group’s products to rise as people become more conscious about the environment and saving energy. Additionally, with the increas-ing popularity of the IoT, the company is in a good position to capitalise on the trend using its innovation and expertise.
57
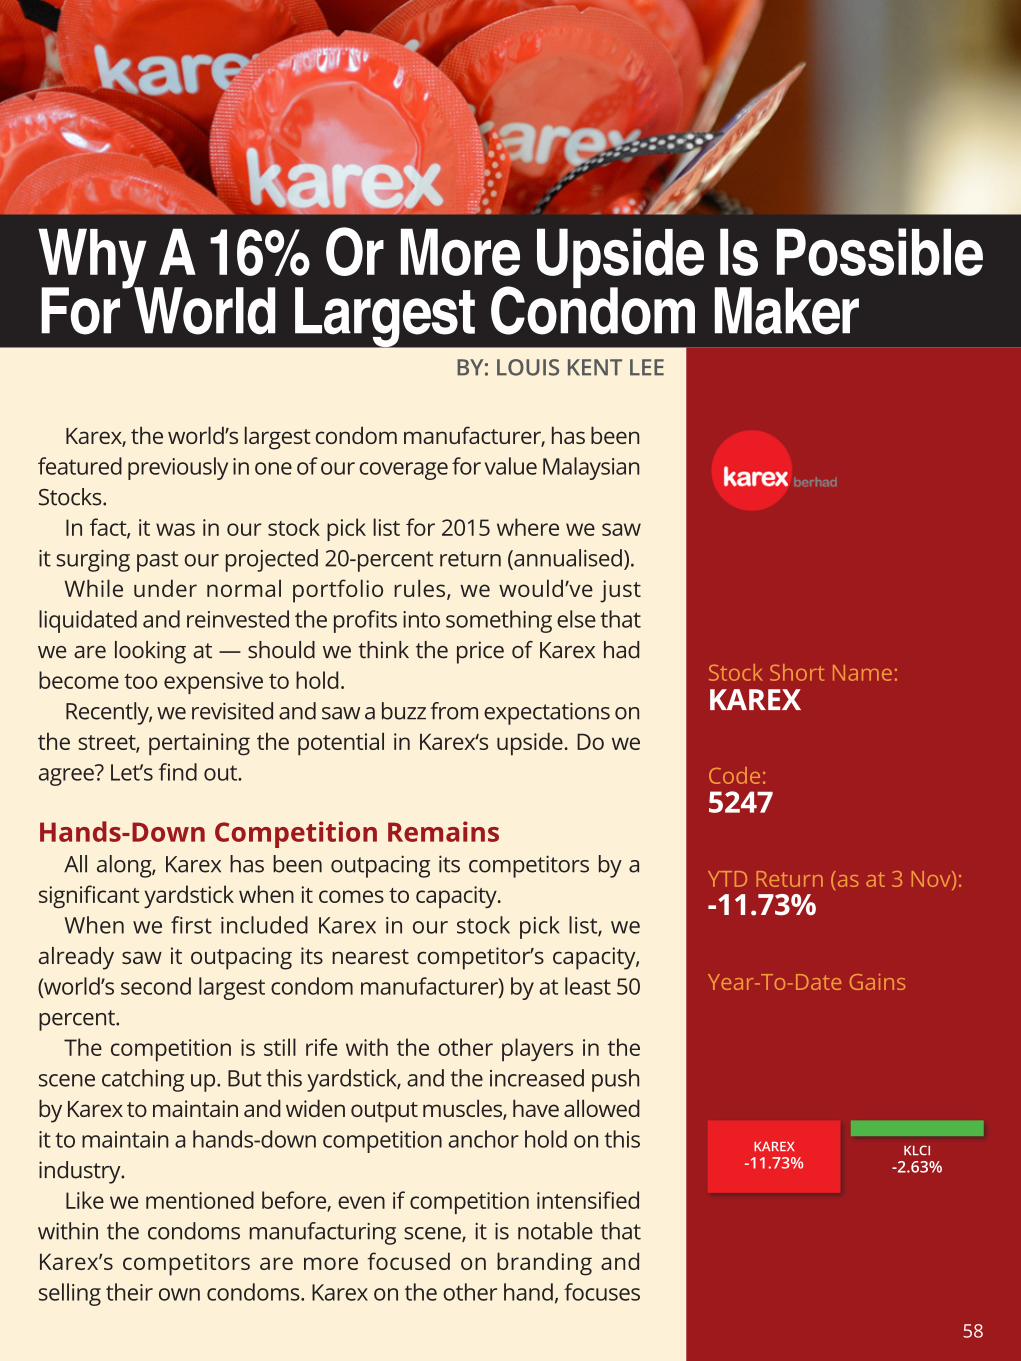
Stock Short Name:
Code:
YTD Return (as at 3 Nov):
Year-To-Date Gains
BY: LOUIS KENT LEE
Karex, the world’s largest condom manufacturer, has been featured previously in one of our coverage for value Malaysian Stocks.
In fact, it was in our stock pick list for 2015 where we saw it surging past our projected 20-percent return (annualised).
While under normal portfolio rules, we would’ve just liquidated and reinvested the profits into something else that we are looking at — should we think the price of Karex had become too expensive to hold.
Recently, we revisited and saw a buzz from expectations on the street, pertaining the potential in Karex‘s upside. Do we agree? Let’s find out.
Hands-Down Competition RemainsAll along, Karex has been outpacing its competitors by a
significant yardstick when it comes to capacity.When we first included Karex in our stock pick list, we
already saw it outpacing its nearest competitor’s capacity, (world’s second largest condom manufacturer) by at least 50 percent.
The competition is still rife with the other players in the scene catching up. But this yardstick, and the increased push by Karex to maintain and widen output muscles, have allowed it to maintain a hands-down competition anchor hold on this industry.
Like we mentioned before, even if competition intensified within the condoms manufacturing scene, it is notable that Karex’s competitors are more focused on branding and selling their own condoms. Karex on the other hand, focuses
Why A 16% Or More Upside Is Possible For World Largest Condom Maker
KAREX
5247
-11.73%
KAREX-11.73%
KLCI-2.63%
58
CONTENT PAGE
on manufacturing and supplying condoms to brand owners such as Durex, Trustex and ONE.
Better Product Mix Increases Gross Margin
It was observed that as a result of better product mix, we’ve successfully seen six quarters of successful gross profit margin improvement.
We think that the favourable raw material movements seen, complemented with its huge economies of scale, have also aided to bring up the gross profit margin.
On an overview in terms of timeline, we think 2H16 could be great for Karex, especially with a measured full earnings impact from the additional one billion of new capacity.
Additional annual capacity contributions from Medical Latex Dua SB and that of its own brand manufacturers’ distribution would also give weight to 2H16 earnings.
Street Valuation: Possible 16% Upside
Most analysts are pricing in rich valuations for Karex. As of 20th April, its closing price of RM2.59 versus median prices of analysts’ on the street of RM3.01. This essentially translates to an upside of a little more than 16 percent.
We’ve seen it doing more than 50 percent gains in our stock pick list before. But we are currently still reviewing risks that we now ought to look at that might be the stopping forces for such meteoric upside.
Margin pressure from the removal of government subsidies (gas tariff increase) and labour cost increase (minimum wage plus foreign labour levy hike) could be experienced by Karex.
Higher prices for raw materials like latex and nitrile will also be key components that can
mess up margins.That said, we might be able to see an uplift
that should warrant a re-rating of this sector, especially with Top Glove’s planned Singapore listing.
Karex’s diversification into own brand manufacturing while maintaining its dominant position in the original equipment manufacturing market cannot be ignored, and we like Karex for that.
Though its Forward Price Earnings Ratio of 30.7 times seems expensive, its forward Price Earnings Growth Ratio of 1.04 times is essentially almost half of the PEG of its international peers.
We think this suggests a reasonable upside range by the street, and that it will not be a surprise for us to see further outperformance — if any.
59
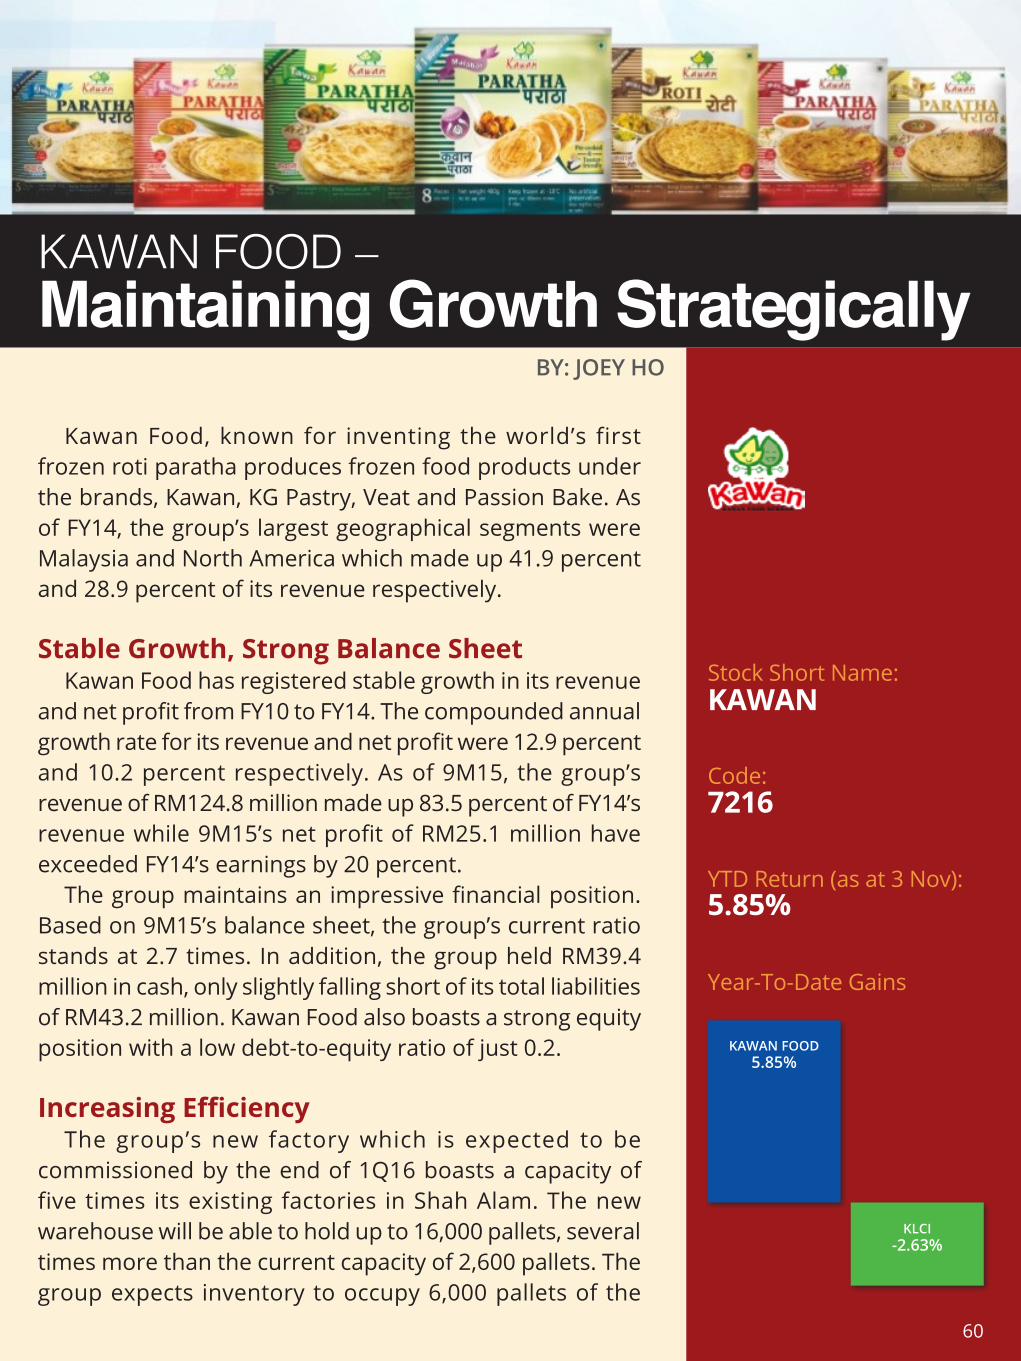
Stock Short Name:
Code:
YTD Return (as at 3 Nov):
Year-To-Date Gains
Kawan Food, known for inventing the world’s first frozen roti paratha produces frozen food products under the brands, Kawan, KG Pastry, Veat and Passion Bake. As of FY14, the group’s largest geographical segments were Malaysia and North America which made up 41.9 percent and 28.9 percent of its revenue respectively.
Stable Growth, Strong Balance SheetKawan Food has registered stable growth in its revenue
and net profit from FY10 to FY14. The compounded annual growth rate for its revenue and net profit were 12.9 percent and 10.2 percent respectively. As of 9M15, the group’s revenue of RM124.8 million made up 83.5 percent of FY14’s revenue while 9M15’s net profit of RM25.1 million have exceeded FY14’s earnings by 20 percent.
The group maintains an impressive financial position. Based on 9M15’s balance sheet, the group’s current ratio stands at 2.7 times. In addition, the group held RM39.4 million in cash, only slightly falling short of its total liabilities of RM43.2 million. Kawan Food also boasts a strong equity position with a low debt-to-equity ratio of just 0.2.
Increasing EfficiencyThe group’s new factory which is expected to be
commissioned by the end of 1Q16 boasts a capacity of five times its existing factories in Shah Alam. The new warehouse will be able to hold up to 16,000 pallets, several times more than the current capacity of 2,600 pallets. The group expects inventory to occupy 6,000 pallets of the
BY: JOEY HO
KAWAN FOOD – Maintaining Growth Strategically
KAWAN
7216
5.85%
KAWAN FOOD5.85%
KLCI-2.63%
60
CONTENT PAGE
freezer space and the remaining storage space will be rented out.
This strategic move is likely to boost operating margins once operations from the other facilities have been consolidated under its new plant.
Innovation To Drive GrowthKawan Food’s indirect wholly owned
subsidiary, Kawan Food (Nantong), recently entered into a joint venture to participate in the business of halal meat dumplings and other frozen food products to the Chinese and international markets.
In FY14, the group launched tortillas which have seen a strong increase in demand due to its flexibility and also ease of use. The group also highlighted that there will also be renewed focus and investment on all fronts to develop the European market, which we believe is a move in line with the new product launch.
The strategic approach towards the European market appears to have been successful thus far, with revenue from the Europe segment increasing 23.8 percent for 9M15.
Foreign Exchange RiskWhile the weakened Malaysian Ringgit
has been favorable to the group’s exports, it also highlights the group’s exposure to foreign exchange risk as approximately 60 percent of revenue is derived from exports.
The group faces the uncertainty of monetary policy changes by central banks in struggling economies, such unforeseen circumstances could affect foreign exchange conditions and lead to volatility in the group’s earnings.
The sector price to earnings ratio (PER) is
currently pegged at 25 times, while Kawan Food’s shares are trading at a PER of 34.5 as of 5 January 2016.
61
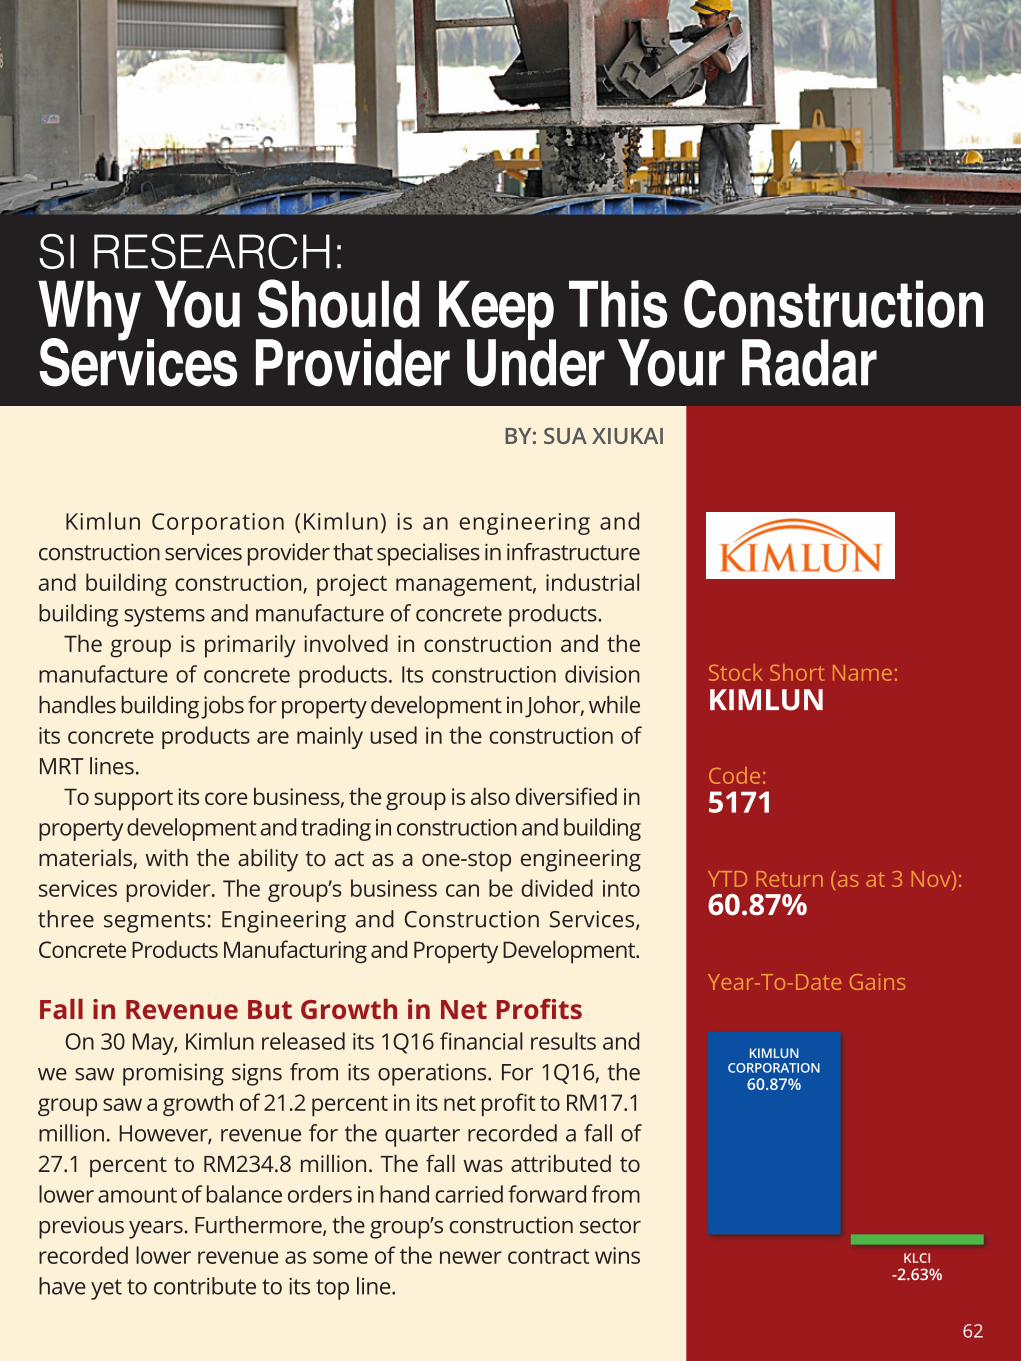
Stock Short Name:
Code:
YTD Return (as at 3 Nov):
Year-To-Date Gains
SI RESEARCH:Why You Should Keep This Construction Services Provider Under Your Radar
BY: SUA XIUKAI
Kimlun Corporation (Kimlun) is an engineering and construction services provider that specialises in infrastructure and building construction, project management, industrial building systems and manufacture of concrete products.
The group is primarily involved in construction and the manufacture of concrete products. Its construction division handles building jobs for property development in Johor, while its concrete products are mainly used in the construction of MRT lines.
To support its core business, the group is also diversified in property development and trading in construction and building materials, with the ability to act as a one-stop engineering services provider. The group’s business can be divided into three segments: Engineering and Construction Services, Concrete Products Manufacturing and Property Development.
Fall in Revenue But Growth in Net ProfitsOn 30 May, Kimlun released its 1Q16 financial results and
we saw promising signs from its operations. For 1Q16, the group saw a growth of 21.2 percent in its net profit to RM17.1 million. However, revenue for the quarter recorded a fall of 27.1 percent to RM234.8 million. The fall was attributed to lower amount of balance orders in hand carried forward from previous years. Furthermore, the group’s construction sector recorded lower revenue as some of the newer contract wins have yet to contribute to its top line.
KIMLUN
5171
60.87%
KIMLUN CORPORATION
60.87%
KLCI-2.63%
62
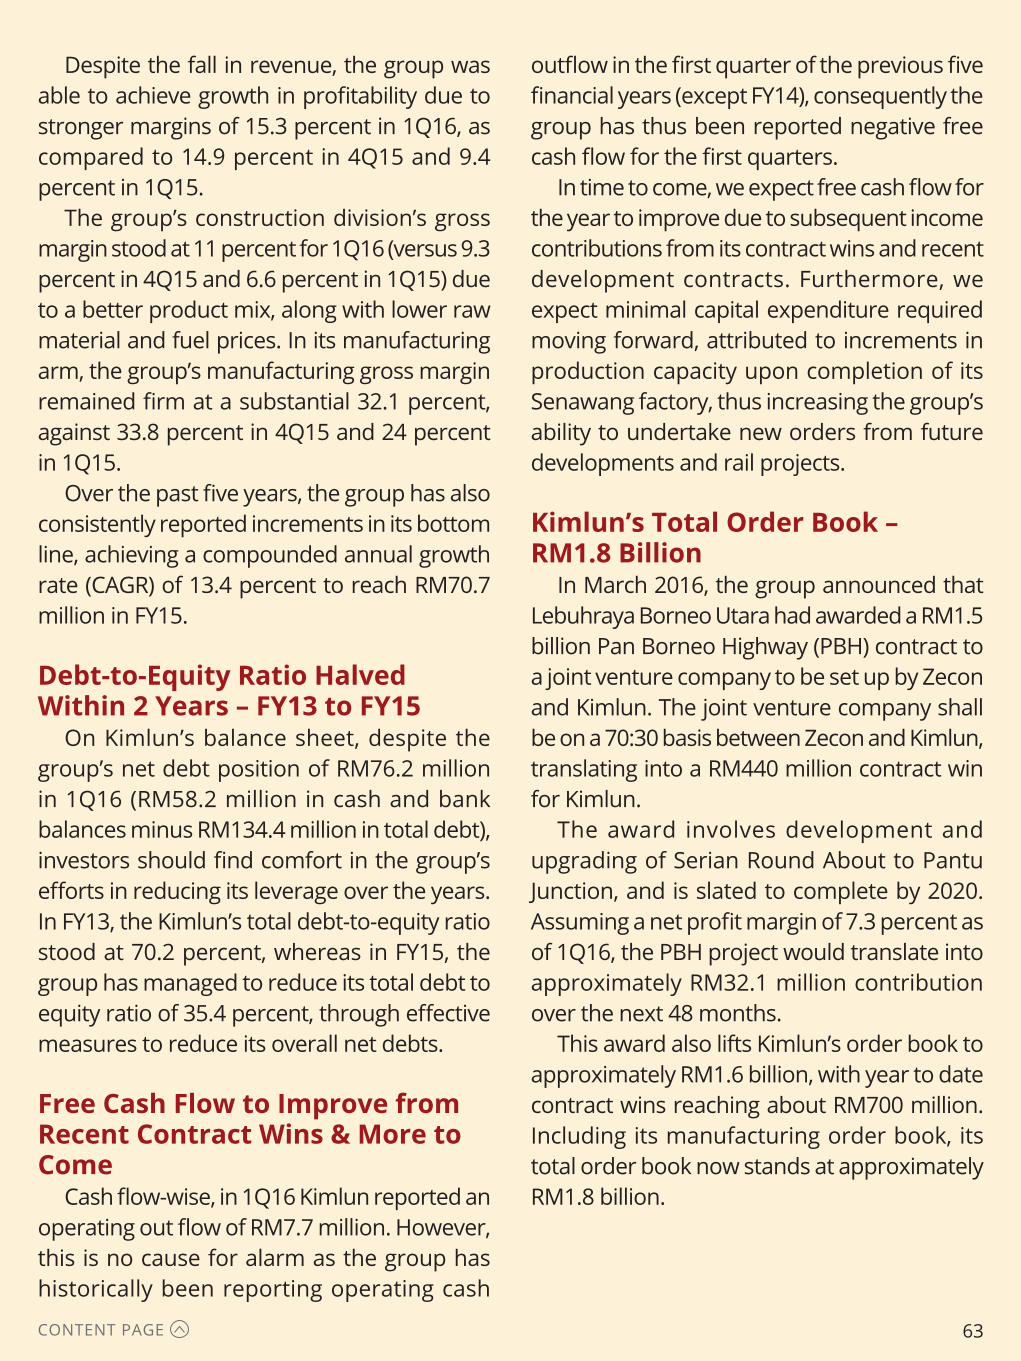
CONTENT PAGE
Despite the fall in revenue, the group was able to achieve growth in profitability due to stronger margins of 15.3 percent in 1Q16, as compared to 14.9 percent in 4Q15 and 9.4 percent in 1Q15.
The group’s construction division’s gross margin stood at 11 percent for 1Q16 (versus 9.3 percent in 4Q15 and 6.6 percent in 1Q15) due to a better product mix, along with lower raw material and fuel prices. In its manufacturing arm, the group’s manufacturing gross margin remained firm at a substantial 32.1 percent, against 33.8 percent in 4Q15 and 24 percent in 1Q15.
Over the past five years, the group has also consistently reported increments in its bottom line, achieving a compounded annual growth rate (CAGR) of 13.4 percent to reach RM70.7 million in FY15.
Debt-to-Equity Ratio Halved Within 2 Years – FY13 to FY15
On Kimlun’s balance sheet, despite the group’s net debt position of RM76.2 million in 1Q16 (RM58.2 million in cash and bank balances minus RM134.4 million in total debt), investors should find comfort in the group’s efforts in reducing its leverage over the years. In FY13, the Kimlun’s total debt-to-equity ratio stood at 70.2 percent, whereas in FY15, the group has managed to reduce its total debt to equity ratio of 35.4 percent, through effective measures to reduce its overall net debts.
Free Cash Flow to Improve from Recent Contract Wins & More to Come
Cash flow-wise, in 1Q16 Kimlun reported an operating out flow of RM7.7 million. However, this is no cause for alarm as the group has historically been reporting operating cash
outflow in the first quarter of the previous five financial years (except FY14), consequently the group has thus been reported negative free cash flow for the first quarters.
In time to come, we expect free cash flow for the year to improve due to subsequent income contributions from its contract wins and recent development contracts. Furthermore, we expect minimal capital expenditure required moving forward, attributed to increments in production capacity upon completion of its Senawang factory, thus increasing the group’s ability to undertake new orders from future developments and rail projects.
Kimlun’s Total Order Book – RM1.8 Billion
In March 2016, the group announced that Lebuhraya Borneo Utara had awarded a RM1.5 billion Pan Borneo Highway (PBH) contract to a joint venture company to be set up by Zecon and Kimlun. The joint venture company shall be on a 70:30 basis between Zecon and Kimlun, translating into a RM440 million contract win for Kimlun.
The award involves development and upgrading of Serian Round About to Pantu Junction, and is slated to complete by 2020. Assuming a net profit margin of 7.3 percent as of 1Q16, the PBH project would translate into approximately RM32.1 million contribution over the next 48 months.
This award also lifts Kimlun’s order book to approximately RM1.6 billion, with year to date contract wins reaching about RM700 million. Including its manufacturing order book, its total order book now stands at approximately RM1.8 billion.
63

CONTENT PAGE
Outlook – More Contracts to Come in
Apart from its year-to-date contract wins, Kimlun’s management has also shared its strategy to diversify the group’s strategy construction focus into non-residential projects in Johor given the current property slowdown in the southern state. It has secured its first hospital construction project to build the Gleneagle Medini Hospital, in addition to constructing the Johor Bahru Southkey Megamall (a retail mall), Pagoh Education student hostel as well as a religious building.
Given a surplus in high-rise developments in Johor, the group will be more selective on jobs in order to raise its exposure to the non-residential projects and will be bidding aggressively for more infrastructure projects. Given that it has a strong niche in the Tunnel Lining Segment (TLS) and Segmental Box Girder (SBG) works in MRT projects, the group has won the SBG works for MRT Line 2 in Malaysia, and should win its portion of the TLS in time to come. Previously, for MRT Line 1, the group secured approximately 50 percent market share based on overall contracts of RM272 million.
The group’s ability to win the PBH contract further validates its potential to clinch more infrastructure projects going forward. To date, the group has submitted the tender bid for Central Spine Road, both as a main contractor and sub-contractor. Apart from that, the group is also raising its exposure to bid for non-residential projects, potentially venturing into affordable residential job segments to ride on government initiatives to construct 1 million units of affordable houses in the next five years.
With its healthy fundamentals, good track record in securing contracts as well as immense
potential for more contract wins in the future, we think that investors can consider including Kimlun in their portfolios.
ValuationAs of 8 June, Kimlun’s shares closed at
RM1.83. In FY15, the group distributed a final single dividend of RM0.058 per share, representing a dividend yield of 3.2 percent. With an average street price of RM2.11, it represents a potential upside of 15.3 percent.
With a 33.6 percent year-to-date rise in its share price, Kimlun currently trades at a price-to-earnings ratio (PER) of 7.5 times. Compared to some of its peers like Sunway Construction Group which is trading at PER of 16.3 times, and Ahmad Zaki Resources which trades at PER of 13.9 times, Kimlun seems to be in a relatively inexpensive position and is well-poised for future growth.
64
Stock Short Name:
Code:
YTD Return (as at 3 Nov):
Year-To-Date Gains
SI RESEARCH:Kossan Rubber Industries – What’s Next After A 32% Price Correction?
BY: TAN JIA HUI
Amidst volatility in the global markets and sinking oil prices in 2015, Malaysia’s top four rubber glove producers have managed to return an impressive performance.
The top four players, namely Hartalega Holdings, Supermax Corporation, Top Glove Corporation and Kossan Rubber Industries, closed 2015 with an average gain of 115.3 percent (share price) in contrast to the 3.4 percent decline for the FTSE Bursa Malaysia KLCI Index.
However, we have seen a correction in the share prices of the above-mentioned firms, after having hit their respective 52-week high.
In particular, Kossan Rubber Industries (Kossan) has seen the sharpest decline (by percentage points) of 31.7 percent from its high of RM9.50 per share on 22 December 2015 to close at RM6.49 per share on 5 February 2016.
After the huge price correction, it is perhaps time to take a closer look at Kossan to see if there is value to be uncovered.
Steady GrowthKossan has three major business divisions – gloves, technical
rubber products and cleanroom products – with the gloves business (our main discussion for this article) being the largest revenue contributor (FY14: 84.3 percent).
Financials wise, the firm’s top line has risen at a compounded annual growth rate (CAGR) of 5.6 percent in the past five years (FY10 to FY14) to reach RM1.3 billion. Likewise, bottom line
KOSSAN
7153
-29.35%
KOSSAN RUBBER INDUSTRIES-29.35%
KLCI-2.63%
65
CONTENT PAGE
grew at 6.4 percent CAGR in the same period to reach a record RM145.6 million in FY14.
Dividend per share (DPS) is also on a general increasing trend in the past five years. Comparing FY10 and FY14, DPS has doubled from RM0.04 to RM0.08.
Capacity ExpansionAccording to data from the Malaysia Rubber
Gloves Manufacturer Association (MRGMA), global demand for rubber gloves has risen steadily from 103 billion pieces in 2005 to 180 billion pieces in 2015, which translates to a 5.7 percent CAGR.
Global demand for rubber gloves is projected to grow at 6 percent to 8 percent per annum, buoyed by increasing hygiene standards and healthcare awareness, a growing ageing population, progressively stringent health regulations and the emergence of new health threats.
On the back of growing demand, players in Malaysia’s rubber glove segments have embarked on capacity expansion, raising output and at the same time reduce reliance on manual labour through automation at new production plants.
Likewise, Kossan is also targeting capacity expansion, and has laid out its five-year expansion plan in 2015. The group’s plan include spending approximately RM600 million in capital expenditure to more than double its annual production output from 22 billion pieces of glove currently – by 2021.
Manufacturing plants would be built on land that the firm owns in Meru, Klang and Batang Berjuntai, Selangor. Construction is underway for the first phase of expansion in Batang Berjuntai (five phases in total; two plants per phase) as well as for the three plants planned in Meru – both with tentative completion by
2H17.Apart from increasing capacity, automation
is also an important Kossan’s expansion plans. The company hopes to reduce downtime for its processes, improve product quality and reduce the need for foreign labour through its efforts.
Benefitting From Industry Tailwinds
In the past year, Malaysian glove makers have been riding on positive industry tailwinds.
Apart from the resilient growth in demand, glove makers have emerged as one of the beneficiaries of a weaker Malaysian ringgit against the US dollar. Between 9 January 2015 and 9 January 2016, the ringgit has weakened approximately 17.2 percent against the greenback. While sales are largely denominated in the dollar most costs are calculated in ringgit.
Additionally, the fall in key raw materials prices have also been a boon to players in the industry. Natural rubber prices have been on a decline and downward pressure is expected to persist, given a supply glut as well as a slowdown in China’s growth (slower demand growth for natural rubber in the Chinese automotive industry).
Based on prices on Malaysian Rubber Board, the average price of bulk latex in 2015 was RM4.13 per kilogram (kg), compared to RM4.37 per kg and RM5.60 per kg in 2014 and 2013 respectively. Butadiene, a key material in nitrile gloves, has also seen its price fall from approximately US$1.50 per kg at end-2013 to below US$0.90 per kg at end-2015.
ConclusionOverall, Kossan’s growth in the coming
quarters is expected to be driven by capacity expansion, backed by a resilient demand.
That said, we note the possible downside
66
CONTENT PAGE
risks that the firm could face, which includes negative foreign exchange movement, sudden spike in raw material prices and an overcapacity in the industry resulting in price competitions.
While Kossan’s share price has experienced a sharp correction in recent days, based on a share price of RM6.49 (5 February’s close), Kossan’s trailing 12-month price to earnings ratio (P/E) stands at 22.1 times, still higher than its 5-year average P/E of 16.8 times.
The valuation also sits close to the middle range for the stock’s 5-year historical P/E data that is between 7.6 times and 34 times. However, if 2105 data was excluded – given the huge run-up in share prices – the P/E range would have narrowed to 7.6 times to 25 times, and current valuations would sit on the high end.
67
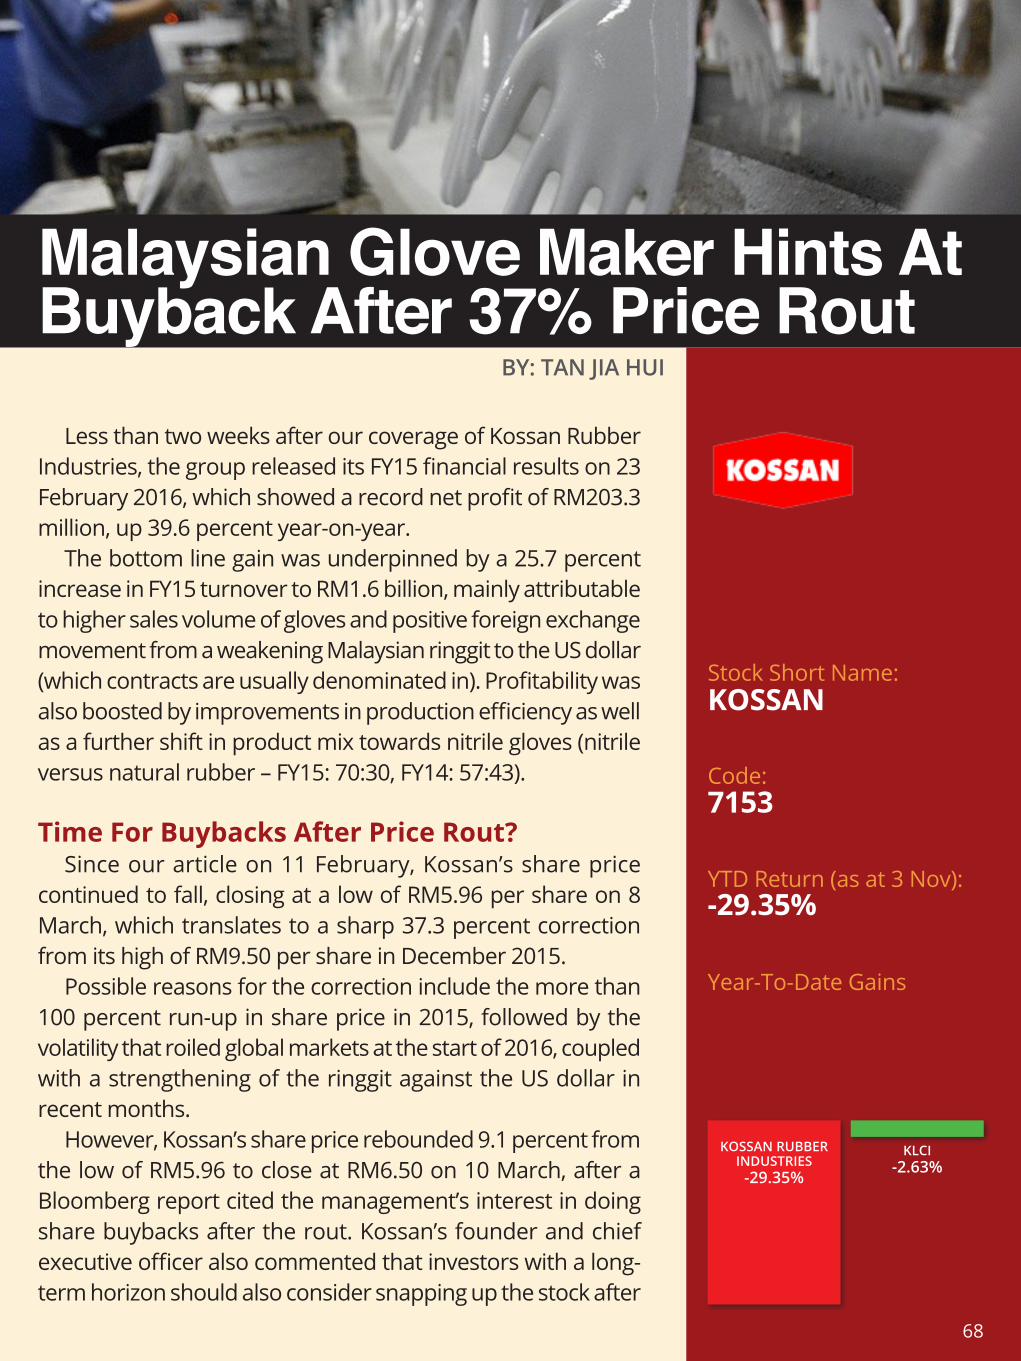
Stock Short Name:
Code:
YTD Return (as at 3 Nov):
Year-To-Date Gains
BY: TAN JIA HUI
Less than two weeks after our coverage of Kossan Rubber Industries, the group released its FY15 financial results on 23 February 2016, which showed a record net profit of RM203.3 million, up 39.6 percent year-on-year.
The bottom line gain was underpinned by a 25.7 percent increase in FY15 turnover to RM1.6 billion, mainly attributable to higher sales volume of gloves and positive foreign exchange movement from a weakening Malaysian ringgit to the US dollar (which contracts are usually denominated in). Profitability was also boosted by improvements in production efficiency as well as a further shift in product mix towards nitrile gloves (nitrile versus natural rubber – FY15: 70:30, FY14: 57:43).
Time For Buybacks After Price Rout?Since our article on 11 February, Kossan’s share price
continued to fall, closing at a low of RM5.96 per share on 8 March, which translates to a sharp 37.3 percent correction from its high of RM9.50 per share in December 2015.
Possible reasons for the correction include the more than 100 percent run-up in share price in 2015, followed by the volatility that roiled global markets at the start of 2016, coupled with a strengthening of the ringgit against the US dollar in recent months.
However, Kossan’s share price rebounded 9.1 percent from the low of RM5.96 to close at RM6.50 on 10 March, after a Bloomberg report cited the management’s interest in doing share buybacks after the rout. Kossan’s founder and chief executive officer also commented that investors with a long-term horizon should also consider snapping up the stock after
Malaysian Glove Maker Hints At Buyback After 37% Price Rout
KOSSAN
7153
-29.35%
KOSSAN RUBBER INDUSTRIES-29.35%
KLCI-2.63%
68
CONTENT PAGE
the correction.According to the Bloomberg article, the
drop in stock price has dragged the group’s valuations to 16.2 times its 12-month projected earnings (forward looking), the lowest in 14 months and we note that it is slightly lower that its five-year historical price to earnings of 16.8 times.
That said, investors should note the downside risks to earnings, which includes lower margins and average selling prices due to increased competition, a sudden hike in key raw material prices and significant strengthening of the ringgit.
Additional Capacity To Underpin Growth In FY16
At end-2015, Kossan’s installed capacity stood at 22 billion pieces per annum. Of the 22 billion pieces, some were added by two new plants commissioned in mid-2015. Thus, looking ahead, the company expects full-year contribution from these two plants (clients have already taken up the extra capacity) to support its growth in FY16.
The group notes that despite adding new plants in 2015, its production facilities are running almost at full capacity while there are still pending orders from customers. Hence, the company has announced yet another expansion exercise (mentioned in the previous article), though these are only expected to come onboard from 2H17 onwards.
Apart from capacity expansion, the firm is also said to be on the lookout for acquisitions to complement its rubber-glove manufacturing business. While management shared that possible targets have been identified, it noted that prices remain high for such deals at the moment.
ConclusionAccording to the research houses tracked by
Bloomberg, 10 out of 16 have the equivalent of a ‘Buy’ rating on Kossan’s stock as of 10 March, with a 12-month consensus target price of RM8.46. The price target represents a 30.2 percent upside from 10 March’s close of RM6.50 per share.
That said, based on the stock’s 5-year historical P/E range that is between 7.6 times and 34 times, we note that the forward P/E sits somewhere close to the middle of the range – which makes it hard to have a clear investment decision in our opinion. For investors who are willing to take the plunge now, a little advice would be to not throw in all your money at once so that you can average down if prices continue to dip.
Another point to look out for would be the price that the company executes its buyback – if it materialises – as it should form some sort of support for Kossan’s share price.
69
Stock Short Name:
Code:
YTD Return (as at 3 Nov):
Year-To-Date Gains
BY: SUA XIU KAI
LBS Bina Group (LBS), an investment holding company, engages in property development activities primarily in Ma-laysia and the People’s Republic of China; it develops and sells residential, industrial, and commercial properties.
The group also provides general construction, turfing and landscape contracting. Apart from these, business involve-ments cover insurance agency services, building, project planning, implementation contract services, civil engineering services and trading in building materials. In addition, the group also sells membership cards covering personal insur-ance developing and managing of motor racing circuit, as well as engaging in tourism development.
On 15 September 2016, LBS’s share price hit a new 52-week high of RM1.81 and closed at RM1.80. Having dug deeper into the recent developments of the group, here is why we think LBS still possess the potential to fly even higher.
Targeted RM1.2b Sales For FY16 Well Underway
At the start of 2016, LBS announced that it aims to rake in RM1.2 billion in sales for 2016 after achieving record sales of RM1 billion last year, representing a 20 percent year-on-year sales target growth. The group’s unbilled sales of RM993 mil-lion at end-2015 is expected to contribute to the group’s turn-over this year as well.
It is also noteworthy that in 2015, most developers saw
How LBS Bina Is Still Poised For An 11% Upside Despite Trading At 52-Week High
LBS
5789
26.74%
LBS BINA GROUP26.74%
KLCI-2.63%
70

CONTENT PAGE
sales decline but LBS was an outperformer with sales slightly more than RM1 billion, rep-resenting a 55 percent growth from 2014.
Forwarding nine months to today, investors will be pleased to know that LBS is well on its way to achieve this 20 percent sales target growth. As of 13 September 2016, the group reported total sales of RM873 million and its unbilled sales as of 31 August 2016 amounted to RM1.4 billion.
For the most recently released 1H16 finan-cial results, the group boasted a 20.4 percent growth in turnover to RM426.1 million, as well as an 18 percent growth in net profit to RM35.7 million.
The impressive growth for 1H16 following the stellar performance in 2015 was mainly due to the increase in property revenue mainly driven by its flagship Bandar Saujana Putra township and the D’Island development in Puchong, as well as contributions from other projects.
Team Up With Selangor Government
In September 2016, the group announced that it has entered into a Development Rights Agreement and teamed up with the Selangor government to jointly undertake a mixed de-velopment township in Ijok, Selangor, with an estimated gross development of RM3.4 billion.
The development rights value has been set at RM293.3 million, with about half paid with-in a year and the remainder over seven years (from year five of development onwards).
We are highly optimistic of this mixed development township as it enhances LBS’s earnings base and solidify its position as a key player in the affordable housing segment. The deal also makes financial sense as pay-
ment terms are structured in a way which is not burdensome on the company while the transaction value is fair.
The development land sits in the north-west-ern area of the Klang Valley, about 45 kilome-tres from the Kuala Lumpur City Centre, and is currently connected by major highways like the LATAR Expressway, North-South Expressway, Guthrie Expressway, and soon-to-be DASH Highway and the West Coast Expressway.
Currently overgrown with shrubs and bush-es, the site will be turned into a mixed develop-ment housing with mostly landed residential properties priced at an affordable range, and Rumah SelangorKu would also be included in the development plan. As planning is only in the development stages, costs cannot be as-certained as yet.
On the rationale for the project, the group said that the agreement fits into its property development strategy to enlarge its land bank, particularly in the Klang Valley for its future de-velopment project, and expected to generate future revenue stream and enhance profit-ability.
Streamlining Business, Unlocking Value
On the very next day after the announce-ment of the township agreement with the Selangor government, LBS released another ground breaking announcement in relations to streamlining its construction business.
LBS announced that it will be streamlining its construction business under its 51.2 percent-owned subsidiary ML Global (MGB) via the dis-posal of its indirect 75 percent equity interest in MITC Engineering to MGB for a consideration of RM225 million.
The consideration sum will be settled via the issuance of 20.8 million MGB shares and 135
71
CONTENT PAGE
million irredeemable convertible preference shares, both at RM0.67 each.
We opine that this exercise makes economic sense as it enables the group to streamline its business focus under separate entities while also enabling it to benefit from any upsides MGB may provide on successfully executing its own construction-based business plan.
LBS’s placement of 45 million MGB shares as part of the entire exercise could also help it raise some RM30 million for working capital purposes.
On the rationale of the exercise, LBS man-agement added that “the combined construc-tion businesses of LBS under MGB, with their combined resources, will have better access to larger scale business opportunities and provide MGB with the ability and platform to tender for larger scale external construction works, which in turn is anticipated to improve its order book and earnings.”
Furthermore, LBS has also expressed its confidence in MITC Engineering on clinching more government-linked jobs. Currently it is bidding for RM639 million worth of jobs, includ-ing parcels of the country’s mega infrastructure projects.
With a wide range of projects which MITC Engineering has the capabilities and license to tender for, as well as an abundance of upcom-ing government projects in Malaysia, the group is optimistic of MITC Engineering’s chances at securing the projects.
“I cannot say what jobs they are as they are not in hand yet. But it’s very firm that we have got them. Wait for another one to two months to see how things go, then we can make the announcement.” said the group’s Managing Di-rector Tan Sri Lim Hock San at a media briefing.
Though one may argue that the share price of LBS has been pushed up quite substantially
due to the recent announcements, we still think that it is justified. We foresee the impacts of the recent announcement to be ground breaking.
Though the announcements may not bring about an immediate impact to the group’s performance, in time to come, investors are bound to see the impacts of the group’s con-tinued efforts in improving sales and clinching government-linked projects, as well as the ex-ercise to streamline its construction business which will bring about immense synergy with the operations of MGB.
With an average street price of RM1.99, it represents an 11.2 percent potential upside from the closing price of RM1.79 as of 20 Sep-tember 2016, a target which will not be too difficult for LBS to achieve.
72
Stock Short Name:
Code:
YTD Return (as at 3 Nov):
Year-To-Date Gains
London Biscuits Berhad and its subsidiaries are the largest domestic Malaysian manufacturer of assorted cake confectionery, candy confectionery, wafers and an assortment of snack confectionery. The group has extensive distribution networks and currently exports 50 percent of its products to with the majority of sales being derived from the South East Asian, Asia Pacific and Middle East Regions.
However with the slowdown in the Malaysia economy and several financial details, investors have been raising their eyebrows with regards to its future operations and performance. Here are several reasons why London Biscuits has caught our attention:
1) Consistent Revenue Growth, But Not Profits11.82 percent, that’s what the group recorded for revenue
growth for FY15, with revenue hitting RM402.5 million. Looking at the past 5 years, the group recorded a CAGR of 9.49 percent in revenue, very close to an impressive double-digit growth rate that all investors love and are always on the lookout for. However, looking at the group’s net profits growth, there is a pretty big contrast with revenue growth.
FY15 net profits recorded a growth of a mere 0.05 percent to RM14.3 million, and for the past 5 years, net profits CAGR is just 1.48 percent. This large discrepancy between revenue and net profit growth is mainly due to its high cost of revenue in the manufacturing process and more importantly, the cost of operations for the manufacturing of the group’s products.
The increase in cost of operations were mainly due
BY: SUA XIU KAI
SI RESEARCH: London Biscuits : Good or Nay?
LONBISC
7126
-12.05%
LONDON BISCUITS-12.05% KLCI
-2.63%
73

CONTENT PAGE
Furthermore, in the group’s FY15 annual report, it has been mentioned that the group is taking advantage of the current fad for durian, and will launch new products of durian flavour. These new products were introduced at HOFEX 2015 at Hong Kong and were found to be very popular with the Chinese customers, prompting the group to push for mass promotion into China.
Given the spread of the population in China, the group has adopted several approaches to cover the market. Working with partners has provided the group the capability to penetrate deeper into the market and cater to a wider scope of consumers.
With the group constantly improving its existing product lines by developing new flavours and expanding operations out of their home market, the group’s performance is anticipated to continue its upward trend to achieve its goal of doubling its revenue in the next 3 years. However, it is advisable for investors to keep a close watch on food prices and the group’s ingredient costs, as well as their market penetration in China.
The consumer goods sector Price to earnings ratio (PER) is currently pegged at 26.88 while London Biscuits’ PER is at 10.14 as of 30 December 2015.
to fluctuating prices of sugar, flour and packaging materials, three of the major cost components of operations. And based on market trends, sugar prices are expected to be on a rising trend due to poor harvest caused by poor weather conditions, net profit margins may be dealt a heavy blow, despite it being at a mere 3.6 percent in FY15.
2) Heavy Capital ExpenditureFor FY15, the group reported a free cash
flow of negative RM30.8 million, an instant red flag for many investors. In contrast, the free cash flow for FY14 was RM11.6 million. The vast difference was due to massive capital expenditure in both FY15 and FY14, clocking at RM20.8 million and RM41.4 million respectively.
The group is continuously spending the expansion of the scope of operations as well as acquiring companies with complementary business, such as Kinos who specializes in the manufacture of cakes and chocolate, and Khee San who specializes in sweets and confectionary. The efforts in increasing the group’s product range, as well as increasing its manufacturing capacity over the years, may be seen as a preparation for the group’s future plans, which is to expand their operations outside Malaysia.
3) Expanding Outside MalaysiaHaving achieved success in its home
market, London Biscuits is looking forward to expand its scope and establish a global export network. To date, Hong Kong is the largest export destination for the company, with many of their products available in major supermarkets in Hong Kong, such as Wellcome.
74
Stock Short Name:
Code:
YTD Return (as at 3 Nov):
Year-To-Date Gains
BY: SUA XIU KAI
With global markets in total disarray after the unprecedented move by the UK to leave the European Union on 23 June (dubbed “Brexit”), which caused markets to go plunging across the globe, we are sure some investors would have had their fingers burnt in the chaos that ensued.
During times when investors are in panic-selling mode trying to do damage control, companies with solid fundamentals and earnings prospects are more able to withstand the selloff hence stand tall among the many listed companies competing for investor dollars.
One such company which we feel that investors can turn to in such times is MMC Corporation (MMC), which is listed on Malaysia’s mainboard. MMC is one of the major conglomerates in Malaysia that had its roots in tin mining – once a major economic driver of the country – and the “reincarnation” of Malaysia Mining Corporation.
Corporate Restructuring And Undertaking RM80 Billion Project
Over the years, MMC has undergone various corporate restructuring exercises, which has led to its current operations being segmented into three divisions, namely: 1) Ports & Logistics; 2) Energy & Utilities; as well as 3) Engineering & Construction.
In its ports operations, MMC is the single and largest port operator in Malaysia, through the ownership of two ports in Johor, namely Pelabuhan Tanjung Pelepas (PTP), Malaysia’s largest container terminal, as well as Johor Port, Malaysia’s leading multi-purpose port. In 2015, MCC also acquired NCB
Why You Should Park Your Money In MMC Corporation In Times Of Volatility
MMCCORP
2194
22.96%
MMC CORPORATION
22.96%
KLCI-2.63%
75

CONTENT PAGE
Holdings, which operates Northport and Southpoint in Port Klang, Selangor.
The combined container capacity of these ports total to 17.5 million twenty-foot equivalent units (TEUs), and 14 kilometres of berth with water draft of 6 to 19 metres. MMC also holds a 20 percent stake in Red Sea Gateway Terminal, the flagship container terminal in Jeddah, Saudi Arabia, which operates three berths with annual capacity of 1.5 million TEUs.
Most of MMC’s Energy and Utilities earnings are derived from two associate companies: 1) a 30.9-percent stake in Gas Malaysia, the sole supplier of reticulated natural gas to the non-power sector in West Malaysia; and 2) a 37.6-percent stake in Malakoff, which is the single-largest independent power producer in Southeast Asia with an effective capacity of close to 6,000 megawatts.
Additionally, the group also has direct exposure in the water treatment industry through its wholly-owned unit, Aliran Ihsan Resources, which operates two water treatment plants in Perak, It used to operate 14 more such plants in Johor before the concession lapsed in June 2014.
SMART Tunnel and Electric Double Tracking Project from Ipoh to Padang Besar. Both of these projects were undertaken with Gamuda, another major player in the sector.
The division is currently undertaking two projects: 1) the Klang Valley Mass Rapid Transport (KVMRT) project with Gamuda, estimated to be worth RM80 billion and would be executed over three phases; and 2) Langat 2-related projects, where the group has been awarded the contract to construct the Langat Centralised Sewage Project and Langat 2 Water Treatment Plant.
Strong Earnings Growth – RM6 Billion To Be Added To Current RM2 Billion Orderbook
Growth in the group’s earnings is expected to be driven by its ports division, engineering & construction business and stable energy & utilities wing.
In 2015, Maersk and Mediterranean Shipping Company formed a 10-year alliance, the 2M Alliance, which allowed for better container space optimisation between the two liners and involves a capacity of 2.3 million TEUS, 193 vessels for a period of 10 years from 2015 to 2025.
We opine that the alliance is advantageous to MMC’s port operations, particularly for PTP. Back in 2000, Maersk Group acquired a 30 percent stake in PTP and made the port its transhipment hub for the Southeast Asia region. By 2014, Maersk contributed 74 percent of PTP’s revenue and with higher port activities in the region given the alliance, MMC will be able to benefit directly.
In its engineering and construction business, the group’s outstanding orderbook is estimated to be just over RM2 billion as of March 2016. The group’s MMC-Gamuda joint venture is also
Source: Company
In its Engineering and Construction segment, the group has been involved in several noteworthy projects including the
76

CONTENT PAGE
expected to secure the tunnelling job for the second phase of the KVMRT, assumed to be worth RM12 billion. This would add another RM6 billion into MMC’s orderbook.
Furthermore, the Malaysian government’s decision under the revised Budget 2016 to sustain all major infrastructure projects such as the KVMRT, LRT3, Pan Borneo Highway and the high-speed rail link, is believed to be able to provide MMC with the opportunity to replenish its orderbook.
According to several news reports, MMC and UEM Group were reported to be partnering to take the lead for the construction of the Pan Borneo Highway relating to the Sabah portion. This would be for the 727 kilometer-long stretch and is expected to also involve local contractors in Sabah.
Growth is also expected to be further fuelled by land sales from MMC’s Senai Airport City development. Being the sole international airport in South Malaysia, Senai Airport is expected to see continued growth in passenger traffic in tandem with Iskandar Malaysia’s maturity as well as growing demand for regional connectivity, especially those that are underpinned by the low-cost carriers.
RM18.2 Billion Debt Removed; Stronger Balance Sheet
In FY15, MMC’s revenue from its ongoing businesses (excluding top line from the energy & utilities division) eased 5.1 percent to RM3 billion. This was on weaker earnings from the engineering & construction business and the absence of lands sales.
For FY16, the group’s revenue growth is expected to be driven by a full-year consolidation of NCB Holdings in its ports division, which benefits from higher tariffs, while topline growth in PTP and Johor Port
are mainly due to higher cargo volume and favourable rates achieved.
In May 2015, the listing of Malakoff also had a major impact on strengthening MMC’s balance sheet, removing RM18.2 billion worth of debt because its 51 percent stake has been reduced to the current 37.6 percent and it no longer needs to consolidate the debt.
Let’s Talk NumbersWith stable business operations, a visible
earnings growth and a stronger balance sheet to support its operations, we opine that MMC is a company where investors can find refuge in highly volatile market conditions.
MMC’s shares closed at RM2.00 at 29 June, and with an average street price of RM3.15, it represents a potential upside of 57.5 percent. It is also worthy to note that in the chaos that ensued after the Brexit vote, MMC’s shares dipped 3 percent from RM2.07 on 23 June, to RM1.94 on 27 June, implying a relatively marginal drop as compared to the slump in the overall markets. Since then, it has rebounded back to RM 2.00 at 29 June.
77
Stock Short Name:
Code:
YTD Return (as at 3 Nov):
Year-To-Date Gains
SI RESEARCH:Malaysia Airport Holdings To Continue Passengers’ Growth Capacity
BY: LOUIS KENT LEE
Malaysia Airport Holdings is a leading airport company operating 5 international airports, 16 domestic airports and 18 stolports in Malaysia. It also has three overseas airports investments; two airports in India and one in Turkey.
Its business is made up of five business segments; Airport Services, Duty-Free & Non-Duty Free, Hotel, Repair & Maintenance, and Agriculture & Horticulture. Its major revenue contributor that weighs more than 70 percent of total revenue for the past five years comes from the Airport Services segment.
Increased Passenger Traffic For Malaysia Airports
In January 2016, passenger traffic at Malaysian airports increased 3.2 percent y-o-y, marking the first increase since September 2015 when Malaysia Airlines (MA) started cutting capacity.
The cut capacity (double-digit reduction) by MA was well absorbed by local and foreign carriers, where AirAsia and Malindo saw a 10 and 15 percent growth in traffic respectively. AirAsia, which had expanded its fleet aggressively in 2013-2014 was more than able to fill the gaps left by MA.
The traffic growth was mainly driven by international passengers. Traffic growth was sustained from Mainland Chinese passengers, which saw the continued growth of more than 20 percent. This brought the passenger numbers tracked
AIRPORT
5014
15.86%
MALAYSIA AIRPORT HOLDINGS15.86%
KLCI-2.63%
78
CONTENT PAGE
back to levels before the MH370 incident. It was observed that the rise was mostly attributable to the introduction of E-visa coupled with a weaker Ringgit.
Also, this trend is expected to continue moving forward as a result of waived visa requirements for Chinese tourists.
Despite some terror-related incidents and bad weather, Istanbul SGIA’s growth is still holding up. Istanbul Sabiha Gokcen’s (ISG) growth was contributed by new daily flights to Dubai from Emirates and Turkish Airlines. Including ISG, Malaysia Airport’s total passenger traffic growth rose 6.8 percent y-o-y for January 2016.
Istanbul Sabiha Gokcen Airport Acquisition Helped Lift Overall Traffic Growth
The timely acquisition done by MAB of ISG airport has helped lift MAB’s overall group passenger growth.
The current utilisation rate for ISG airport is at 85 percent with some 28 million passenger traffic count against a capacity of some 33 million passenger traffic per annum.
It was revealed that upon the completion of the second runway in 2018, the passenger traffic capacity count is expected to double to 60 million per annum.
It was also understood that MAB does not discount the possibility of monetising ISG when the business matures through divestments or share swaps for other profitable ventures.
Numbers OverviewMAB currently enjoys a high gross margin at
52.6 percent as of FY14. In fact, gross margins have consistently been high and easily over 40 percent over the past four years.
Net income margin stands at 22.4 percent
for FY14, with trailing 12 months net income margin at 21 percent.
Compounded annual growth rate for revenue, gross profit, and net income have all grown relatively well over the past three years respectively at 6.7 percent, 10.5 percent, and 23.1 percent.
Although the profitability metrics seem to be relatively good for MAB, MAB appears to be highly leveraged, with long term debt to equity ratio at 79.8 percent.
In addition, the cash at bank as of 30 September 2015 stands at RM1.08 billion, more than enough to cover short term obligations but not enough to cover long term debt of some RM5.66 billion.
This means that for initiatives that MAB wants to take on especially on the mergers and acquisitions front, these acquisitions will need to be funded by additional debt, and it will still depend on credit ratings imposed on the company.
Immediate catalysts for MAB are better than expected capacity growth from MAS-Emirates tie-up, deeper and more proactive cost-cutting measures to reduce operating costs, and potential M&A activities.
Currently, MAB is already trading near its mean target price of RM6.15. We think further upside might only be reached when the catalysts show traction in execution.
79

Stock Short Name:
Code:
YTD Return (as at 3 Nov):
Year-To-Date Gains
BY: JOEY HO
Nestle (Malaysia), a company with a rich history of over a century, currently manufactures and markets more than 300 products in Malaysia. Nestle’s products include widely consumed brands such as Milo, Nescafe, Maggi, Kit Kat as well as a wide range of ice cream. As of FY15, the group has depends heavily on the domestic market which made up 79.1 percent of its total sales.
Nestle’s shares which are listed on Bursa Malaysia closed at RM75.52 as of 11 May 2016, edging up 2.9 percent since the beginning of 2016.
1. Impressive Growth; EPS CAGR at 8.5%
Nestle (Malaysia) – 3 Reasons To Like This F&B Giant
Nestle FY15 FY14 FY13 FY12 FY11Turnover (m) 4,838 4,809 4,788 4,556 4,247
Net Profit (m) 591 550 562 505 456
Earnings Per Share (Sen) 251.9 234.7 239.5 215.5 182.1
Nestle has displayed an impressive financial performance from FY11 to FY15. The group’s turnover and net profit grew at a compounded annual growth rate (CAGR) of 3.3 percent and 6.7 percent respectively. Earnings per share registered the most notable CAGR at 8.5 percent.
The group reported a revenue of RM1,313.5 million for 1Q16, equivalent to 27.1 percent of FY15 revenue. The top line gain was underpinned by positive growth in domestic sales, driven by strong marketing and promotional supports as well as new successful product launches in 2015.
Apart from improved efficiency, lower raw material prices and the timing of market expenses gave net profit a
NESTLE
4707
6.96%
NESTLE (MALAYSIA)
6.96%
KLCI-2.63%
80

CONTENT PAGE
boost. Ending the quarter with a 17.5 percent growth in net profit to RM220.7 million, Nestle displayed a good head start for FY16.
2. Improved Operating Efficiency & Growing Market Share
Nestle appears to have much room for improvement in its production lines. In FY15, the group saw its gross profit margin improve by 3.3 percentage points to 38.6 percent. The improvement comes after a capital expenditure intensive year in FY14, during which the group spent RM361 million on acquisitions of property, plants, and equipment.
For FY16, Nestle has allocated RM130 million of capital expenditure for product innovation, expansion, and automation in its plants. The strategy is aimed at protecting margins from a possible rebound in commodity prices through the improvement in operating efficiency.
The group has ruled out the possibility of a price hike in a bid to provide consumers the best value for money as domestic consumers continue to face pressure on widespread price increases. Nestle maintained its product prices since last year and saw an improvement in market share from 14.5 percent in FY14 to 15.8 percent in FY15.
We view the focus on operating efficiency positively as maintaining prices in the current economic situation is likely to boost popularity with consumers, which is in line with the group’s aim to gain a higher market share in FY16.
3. Growing Demand for Nestle’s Halal Products Overseas
The group enjoys an increasing demand for its halal products, which are currently exported to over 50 countries including the Middle East, Europe, and Oceania. In 1Q16, export sales, which made up about 20 percent of the group’s
revenue, grew by 12 percent driven by strong demand from the Philippines and Indonesia.
As the biggest halal producer among the Nestle group, the Malaysian F&B giant is well positioned to benefit from strong prospects for the global halal food and beverage industry.
The segment is likely to grow further as the awareness on halal products increases. While it is unlikely for exports to make up a more significant share of the group’s revenue, it would provide much room to fall back on in the event of damped domestic consumer spending.
Financial Position; 3.4% Dividend Yield
As of 1Q16, Nestle’s current ratio stood at 0.74, with cash and cash equivalents making up only 2.4 percent of its current assets. Although companies in the consumer sector are likely to have a higher level of trade and other receivables as well as inventories, the group’s current financial position indicates a relatively higher level of reliance on its future earnings.
Despite the less than desirable current ratio, it is notable that the group manages to hold inventory for 48 days plus 41 days to collect receivables and pays accounts payable in 151 days thus achieving a cash conversion cycle of negative 62 days.
With a dividend yield of 3.4 percent, Nestle has been maintaining its reputation as a resilient dividend stock. The group’s dividends have grown at a decent CAGR of 7.4 percent over the past three years.
The consumer sector price to earnings ratio (PER) is pegged at 25 times, while Nestle’s shares are trading at a PER of 30.2 times. Currently, an assigned street target price of RM81.36 presents an opportunity for 7.7 percent upside.
81
Stock Short Name:
Code:
YTD Return (as at 3 Nov):
Year-To-Date Gains
BY: JOEY HO
OCK Group (OCK), listed on the Mainboard of Bursa Malaysia, is principally involved in the provision of telecommunication services equipped with the ability to provide full turnkey services. The group has expanded into in four major business segments, namely telecommunication network services (TNS), trading of telco and network products, green energy and power solutions, as well as mechanical and electrical engineering services.
As of FY15, the TNS segment made up 81.8 percent and 94.7 percent of the group’s total revenue and profit before tax respectively. Malaysia remains the largest geographical revenue contributor making up 83.3 percent while the remaining segments, which include Cambodia, China, Myanmar and Indonesia, registered strong triple-digit growth.
Revenue Grew 69.9%; Net Profit grew 59% in FY15
Why Malaysian Telco Tower Builder OCK Group Might Be Poised For 16% Upside
OCK Group 1Q16 FY15 FY14 FY13 FY12Revenue (RM’m) 78.4 315.9 185.9 152.2 138.6
Net Profit (RM’m) 3.7 24.8 15.6 13.6 13.1
Dividend (sen) 0.6 - - - 1.0
OCK reported an impressive surge in revenue of 69.9 percent to RM315.9 million in FY15, while net profit grew by 59 percent, as the group’s venture into neighboring Southeast Asian countries bore fruit.
The group’s track record displayed a consistent improvement in revenue and net profit over the past three years. Net profit
OCK
0172
20.00%
OCK GROUP20.00%
KLCI-2.63%
82
CONTENT PAGE
almost doubled from FY12 to FY15 while revenue grew at a compounded annual growth rate of 31.6 percent.
However, the component which caught our attention was the dividends declared in 1Q16, following a gap of three years from the last dividends paid in FY12. According to the group’s managing director Ooi Chin Koon, who held an indirect interest of 40.2 percent in OCK as at 30 March 2016, the group hopes to give out about 20 percent of its net profit as dividends.
While the latest dividend of RM0.006 does not seem too impressive against the current share price of RM0.825, it does bode well for shareholders given the strong tailwinds to come.
Recurring Income from Multiple Teleco Service Contracts with Emerging Markets
Emerging markets in the Southeast Asia region have presented many opportunities for OCK as demand for mobile telecommunications services surge amid the rising affluence.
In December 2015, OCK signed a master services agreement with Telenor Myanmar to build up to 3,000 telecommunications towers over a five-year period. The group plans to invest RM323.6 million and build 920 telecommunications towers. This project will be delivered in 2016 under a long-term build-and-lease business model. The business model provides many benefits for OCK in the form of recurring income, which made up about 18 percent of total revenue in FY15 from just 1.4 percent in FY13.
On top of the significant development in Myanmar, the group plans to extend its presence into countries such as Vietnam, Laos, and Thailand. The group is currently in talks
for another business opportunity in Vietnam.
Sufficient Cash Holdings; Low Debt-to-Equity Ratio
The group maintains a strong financial position. Based on 1Q16’s balance sheet, the group’s current ratio stands at 3.7 times. In addition, the group held RM125.5 million in cash and short-term investments, which is more than sufficient to cover its current liabilities of RM114.1 million. OCK also boasts a strong equity position with a low debt-to-equity ratio of just 0.6 times.
In preparation of the tower constructions in Myanmar, OCK has also secured sufficient financing of US$40.2 million in syndicated term loan over a period of seven years. The management has further guided that there is no cost overrun, based on its current operations.
It is also notable that the group has a large amount of accounts receivable which built up to RM207.4 million in 1Q16 from RM164.4 million in the previous quarter. This substantial amount will provide much funding to the group’s expansion plans going into FY17.
ValuationTaking into account the growing demand
for mobile telecommunications services in the region and a likely boost in margins following the maiden contribution from the telecommunications tower business in Myanmar, we view the future prospects of the group positively.
While OCK’s share price has grown 22.2 percent in 2016 to close at RM0.825 as of 12 July 2016, it still falls 12.2 percent short of its 52-week high of RM0.94. The current street target price is RM0.96, presenting the opportunity for a 16.4 percent upside.
83
Stock Short Name:
Code:
YTD Return (as at 3 Nov):
Year-To-Date Gains
BY: TAN JIA HUI
Remember the fun you had playing with Lego when you were young? Stacking together the multi-coloured Lego bricks allowed us to create many different things we imagine like cars, ships and houses.
The concept of stacking up individual bricks to form things is actually applied to construction today, in the sense that buildings are built by stacking individual modules together. These modules refer to concrete precast components, which are produced in factories and transported to the construction site to be assembled. Using this method, lesser labour is required on the construction site, quality can be controlled more easily and installation is quicker.
In Malaysia, there are several listed companies that are involved in cement and precast concrete manufacturing. Here, we zoom in on OKA Corporation (OKA), who has been in the business for more than 30 years.
Six Plants Across Peninsula Malaysia & Partook Major Projects
OKA is primarily involved in the manufacture and sales of precast concrete products and ready-mix concrete. The group has six plants located across Peninsula Malaysia, in Perak, Johor, Negeri Sembilan, Pahang, Kedah, which allows it to capture the growth opportunities in the different areas as they arise.
Apart from manufacturing precast concrete products used in buildings, the company also specialises in products used for water-related infrastructure projects, drainage, and sewerage. The firm boasts an impressive track record, having partaken
OKA Corporation – Beneficiary Of Malaysia’s Infrastructure Boom
OKA
7140
35.14%
OKA CORPORATION
35.14%
KLCI-2.63%
84

CONTENT PAGE
in major projects including Kuala Lumpur International Airport 2, Pasir Panjang Terminal (Singapore), Putrajaya, Cyberjaya, as well as several highway/expressway and mass rapid transit (MRT) system jobs in Malaysia.
Net Profit Quadrupled Over Five Years
Looking at OKA’s past five year’s financial performance, turnover grew from RM121.1 million in FY12 to RM152.9 million in FY16, recording a decent compounded annual growth rate (CAGR) of six percent. While the top line growth is nothing to shout out about, net profit figures are certainly more remarkable, having surged more than three times from RM4.9 million to RM20.7 million in the same period.
The increased profitability has been mainly attributed to improving margins, underpinned by a change in sales mix (with higher margin products sold) coupled with the management’s focus to reduce costs and raise efficiencies. In particular, the better operational efficiency and sales of higher margin products have helped boost its bottom line by 38 percent in FY16 despite a 6.4 percent decline in revenue year-on-year.
Source: Company
Besides the better financial performance, OKA has also managed to strengthen its financial position in the past years. As of 31 March 2016 (end FY16), the group stood at a net cash position of RM28.2 million, in contrast to the net debt position of RM19.9 million at end FY12.
With improved profitability and a healthier balance sheet, it is good to note that the company rewarding shareholders with a higher dividend of RM0.05 per share in the latest FY16 (FY15: RM0.04, FY14: RM0.03).
16.3% Increased Government Spending to Boost Demand
Notwithstanding the lacklustre demand in the property market amidst economic uncertainties and post the implementation of the goods and services tax, construction and infrastructure demand are expected to be supported by government spending.
Under the 11th Malaysia Plan (11MP), a total RM260 billion has been set aside for development expenditure from 2016 to 2020. The figure translates to an average RM52 billion per annum, approximately 16.3 percent higher than in the 10MP. The higher spending is a boon for the construction as increased civil and infrastructure works are projected in the coming years.
The Malaysian government’s support for infrastructure projects can also be seen in the recalibrated Budget 2016 where Prime Minister Najib Razak announced the continued execution of major infrastructure projects including the MRT, light railway transit (LRT), Pan Borneo expressways and West Coast Expressway (WCE).
In particular, OKA’s strong position and specialisation in the supply of sewage and drainage (U-shaped drains, precast concrete
85
CONTENT PAGE
pipes, and porous pipes etc.) puts in a good position to secure contracts from key highway projects including the Duta–Ulu Klang Expressway extension, Damansara-Shah Alam Highway, WCE and Pan Borneo expressways. For some background, drainage is vital in the construction of roads and expressways as water has to be drained away fast enough to ensure safety and minimise maintenance problems.
ValuationsBased on the close price as at 7 July of
RM1.14, OKA trades at a price-to-earnings ratio (P/E) of 8.8 times after a year-to-date 26.7 percent gain in share price. The value is slightly above the group’s 5-year mean of 7.4 times but sits just slightly above the middle of its 5-year P/E range of between 4.5 times and 12 times.
While there are several listed firms in Malaysia who are also engaged in the cement and concrete business, we note that they do not serve as a useful comparison as they are mainly focused on pre-mixed concrete and cement as compared to the precast concrete products OKA is focused on.
Overall, investors should consider taking a deeper look into the group given the bright prospects that were driven by large public infrastructure projects, its unique specialisation in sewage and drainage precast products and the improving profitability at the firm. Additionally, we note that the current share price also translates to a decent 4.4 percent yield for FY16.
86
Stock Short Name:
Code:
YTD Return (as at 3 Nov):
Year-To-Date Gains
BY: TAN JIA HUI
The broad Malaysian stock market has posted a flat year-to-date performance, with the benchmark Kuala Lumpur Composite Index inching up only 0.1 percent as of 17 August’s close. That said, it is not hard to find individual stocks that have performed exceptionally well in the same period, despite all the volatility in the market.
Malaysian-based aluminium company Press Metal is one such stock; its share price has more than doubled year-to-date, closing at RM4.30 on 17 August. So, let us take a look what makes the firm stand out as an investor’s darling.
Downstream And Upstream Aluminium Operations
On its website, Press Metal prides itself as a global integrat-ed aluminium company and the largest aluminium producer in Southeast Asia. The group is involved in smelting (down-stream), a process that transforms aluminium oxide into pure aluminium, as well as in extruding (upstream), a process that shapes the aluminium into various designs via squeezing the softened metal through shaped openings.
While most people may not know, aluminium is the second-most used metal in the world after steel, given its versatility and light weight property. Apart from being made into drink cans, aluminium is mainly used in transportation (aircraft, automotive, trains etc.) and construction.
The firm has been on expansion mode in the past years, investing heavily in new smelting facilities next to its existing one in Samalaju Industrial Park, Sarawak. The latest Sama-laju Phase 2 expansion is fully operational in June 2016 and
Can Press Metal Go Higher After Surging 109% Year-To-Date?
PMETAL
8869
105.26%
PRESS METAL105.26%
KLCI-2.63%
87
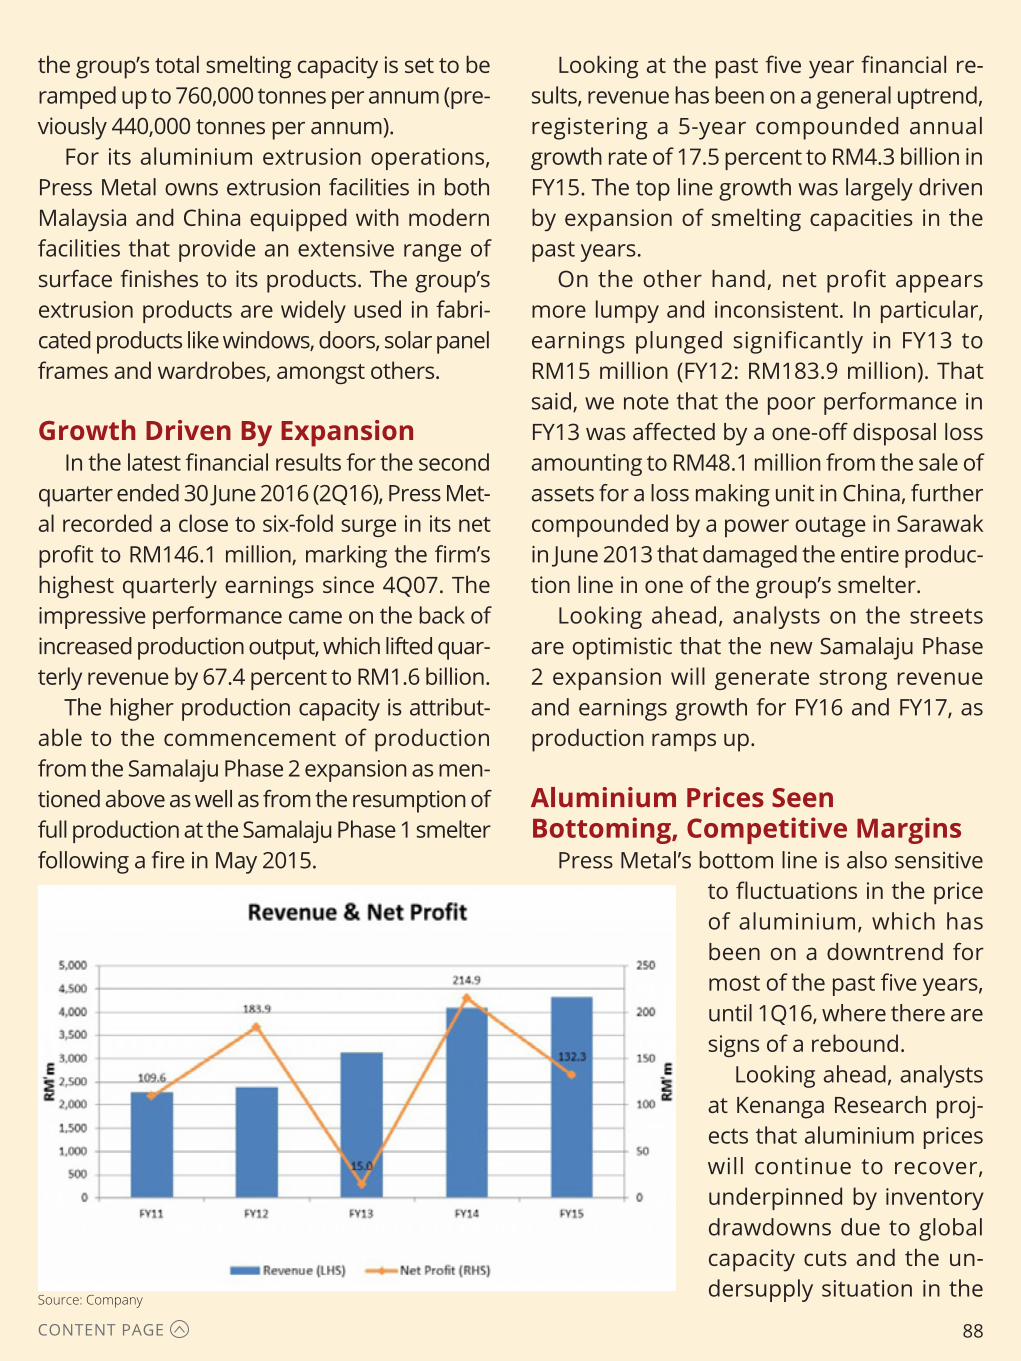
CONTENT PAGE
the group’s total smelting capacity is set to be ramped up to 760,000 tonnes per annum (pre-viously 440,000 tonnes per annum).
For its aluminium extrusion operations, Press Metal owns extrusion facilities in both Malaysia and China equipped with modern facilities that provide an extensive range of surface finishes to its products. The group’s extrusion products are widely used in fabri-cated products like windows, doors, solar panel frames and wardrobes, amongst others.
Growth Driven By ExpansionIn the latest financial results for the second
quarter ended 30 June 2016 (2Q16), Press Met-al recorded a close to six-fold surge in its net profit to RM146.1 million, marking the firm’s highest quarterly earnings since 4Q07. The impressive performance came on the back of increased production output, which lifted quar-terly revenue by 67.4 percent to RM1.6 billion.
The higher production capacity is attribut-able to the commencement of production from the Samalaju Phase 2 expansion as men-tioned above as well as from the resumption of full production at the Samalaju Phase 1 smelter following a fire in May 2015.
Looking at the past five year financial re-sults, revenue has been on a general uptrend, registering a 5-year compounded annual growth rate of 17.5 percent to RM4.3 billion in FY15. The top line growth was largely driven by expansion of smelting capacities in the past years.
On the other hand, net profit appears more lumpy and inconsistent. In particular, earnings plunged significantly in FY13 to RM15 million (FY12: RM183.9 million). That said, we note that the poor performance in FY13 was affected by a one-off disposal loss amounting to RM48.1 million from the sale of assets for a loss making unit in China, further compounded by a power outage in Sarawak in June 2013 that damaged the entire produc-tion line in one of the group’s smelter.
Looking ahead, analysts on the streets are optimistic that the new Samalaju Phase 2 expansion will generate strong revenue and earnings growth for FY16 and FY17, as production ramps up.
Aluminium Prices Seen Bottoming, Competitive Margins
Press Metal’s bottom line is also sensitive to fluctuations in the price of aluminium, which has been on a downtrend for most of the past five years, until 1Q16, where there are signs of a rebound.
Looking ahead, analysts at Kenanga Research proj-ects that aluminium prices will continue to recover, underpinned by inventory drawdowns due to global capacity cuts and the un-dersupply situation in the Source: Company
88
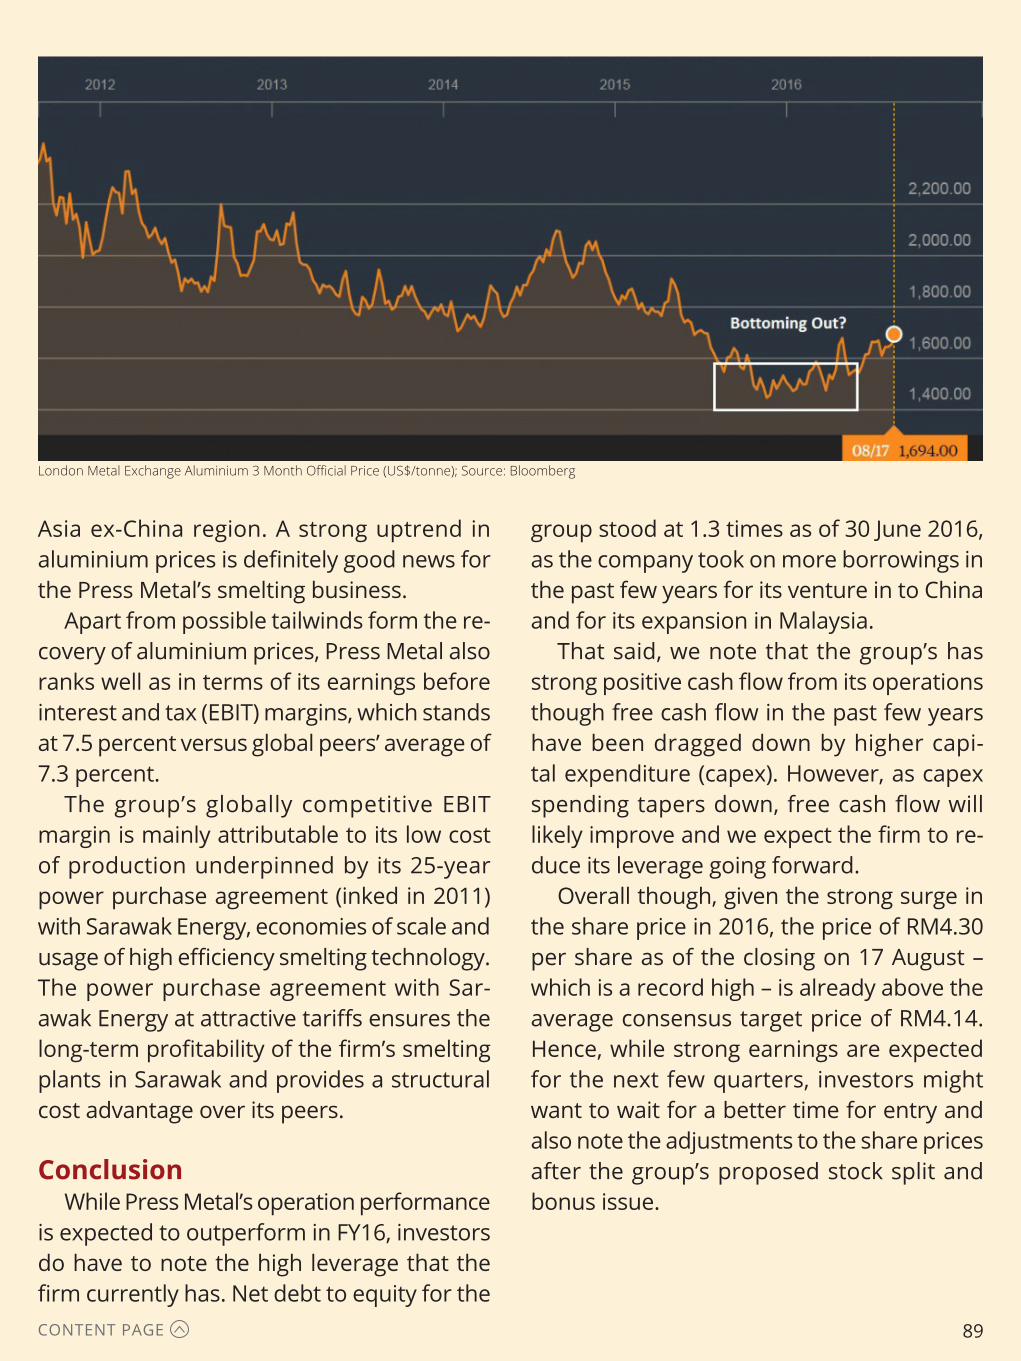
CONTENT PAGE
Asia ex-China region. A strong uptrend in aluminium prices is definitely good news for the Press Metal’s smelting business.
Apart from possible tailwinds form the re-covery of aluminium prices, Press Metal also ranks well as in terms of its earnings before interest and tax (EBIT) margins, which stands at 7.5 percent versus global peers’ average of 7.3 percent.
The group’s globally competitive EBIT margin is mainly attributable to its low cost of production underpinned by its 25-year power purchase agreement (inked in 2011) with Sarawak Energy, economies of scale and usage of high efficiency smelting technology. The power purchase agreement with Sar-awak Energy at attractive tariffs ensures the long-term profitability of the firm’s smelting plants in Sarawak and provides a structural cost advantage over its peers.
ConclusionWhile Press Metal’s operation performance
is expected to outperform in FY16, investors do have to note the high leverage that the firm currently has. Net debt to equity for the
London Metal Exchange Aluminium 3 Month Official Price (US$/tonne); Source: Bloomberg
group stood at 1.3 times as of 30 June 2016, as the company took on more borrowings in the past few years for its venture in to China and for its expansion in Malaysia.
That said, we note that the group’s has strong positive cash flow from its operations though free cash flow in the past few years have been dragged down by higher capi-tal expenditure (capex). However, as capex spending tapers down, free cash flow will likely improve and we expect the firm to re-duce its leverage going forward.
Overall though, given the strong surge in the share price in 2016, the price of RM4.30 per share as of the closing on 17 August – which is a record high – is already above the average consensus target price of RM4.14. Hence, while strong earnings are expected for the next few quarters, investors might want to wait for a better time for entry and also note the adjustments to the share prices after the group’s proposed stock split and bonus issue.
89
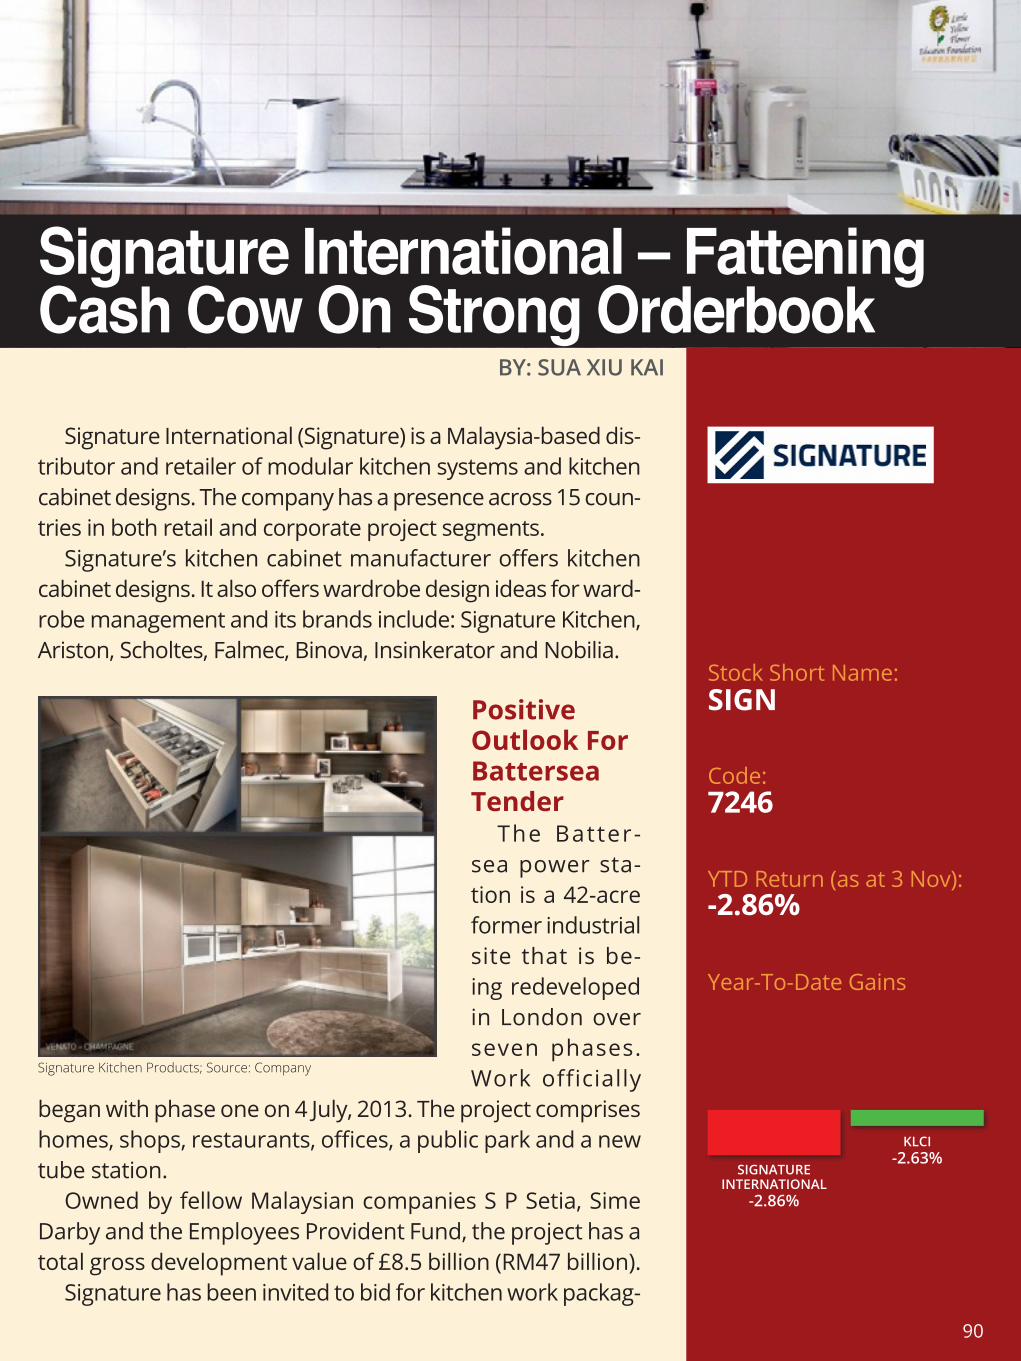
Stock Short Name:
Code:
YTD Return (as at 3 Nov):
Year-To-Date Gains
BY: SUA XIU KAI
Signature International (Signature) is a Malaysia-based dis-tributor and retailer of modular kitchen systems and kitchen cabinet designs. The company has a presence across 15 coun-tries in both retail and corporate project segments.
Signature’s kitchen cabinet manufacturer offers kitchen cabinet designs. It also offers wardrobe design ideas for ward-robe management and its brands include: Signature Kitchen, Ariston, Scholtes, Falmec, Binova, Insinkerator and Nobilia.
Positive Outlook For Battersea Tender
The Batter-sea power sta-tion is a 42-acre former industrial site that is be-ing redeveloped in London over seven phases. Work officially
began with phase one on 4 July, 2013. The project comprises homes, shops, restaurants, offices, a public park and a new tube station.
Owned by fellow Malaysian companies S P Setia, Sime Darby and the Employees Provident Fund, the project has a total gross development value of £8.5 billion (RM47 billion).
Signature has been invited to bid for kitchen work packag-
Signature International – Fattening Cash Cow On Strong Orderbook
Signature Kitchen Products; Source: Company
SIGN
7246
-2.86%
SIGNATURE INTERNATIONAL
-2.86%
KLCI-2.63%
90

CONTENT PAGE
es for the Battersea phase 3A development, which consists of 539 units of residential properties, which are targeted for completion in 2019. In a typical construction progress, kitchen jobs will usually start at the end of the construction cycle. As such, should the group successfully win the job bidding pro-cess, it will serve to enhance its performance for FY18 and FY19.
Banking on the group’s stringent quality control and design standard, as well as its close relationship with Sime Darby, we are very optimistic on the group’s chances of winning the project. Speaking to reporters after the group’s EGM in April 2016, group managing director Tan Kee Choong said “Our chances are very high, with the relationship we have and also the track record that we have with Sime Darby”.
Land Sale Boosting 4Q16 Performance
The group has recently concluded the land sale and received payment of RM80 million in cash from the state government for the disposal of a piece of land at Kota Damansara measuring 13,506 square metres for the pur-pose of construction of DASH highway. Also it had paid out RM0.10 per share as special dividend to shareholders on 4 July 2016.
The land sale, as anticipated, gave rise to a lumpy disposal gain for its 4Q16 results released on 29 August 2016. For the quarter, profit before taxation improved by RM38.7 million from RM2 million last year, to RM40.7 million mainly due to the one-off gain on dis-posal of land and building of RM28.8 million and 29.5 million arising mainly from com-pensation income of the compulsory land acquisition, interest income, rental income and bad debts written back.
As such, the group was also able to in-crease its cash holdings despite paying out the special dividend. Due to the proceeds of the land sale, the group was able to increase its cash holding for 4Q16 to RM36 million, up from the cash holding of RM22.6 million last year.
As such, net cash for FY16 stood at RM13.9 million, significantly higher as compared to the net cash holding of RM1.1 million for FY15, empowering the group’s ability to sus-tain its operations even in times of difficulty.
More importantly, the compulsory ac-quisition caused minimal disruptions to the group’s operation as it owns two pieces of adjacent land at Kota Damansara to house its headquarters, factory and warehouses. The piece of land that was acquired was used for glass and aluminium fabrication, storage of electrical appliances.
To minimize production disruptions, the group has also announced plans to tear down the existing small warehouse with built-up area of 14,000 square feet and build a new double-storey warehouse costing RM15 mil-lion, with a built-up area of 56,000 square feet for storage of electrical appliances in the future.
Construction is expected to begin in 4Q16 and targeted for completion in 1H17. During the construction period, the group will move the glass and aluminium fabrication to exist-ing plants, keeping production disruption to the minimum.
OutlookAs at july 2016, Signature’s orderbook
stood at an impressive RM205 million, from RM165 million in May-16, after securing close to RM60 million new jobs. According to Signa-ture’s management, the group has secured
91

CONTENT PAGE
a contract to supply and install kitchen and wardrobe systems for a Four Seasons de-velopment in Kuala Lumpur worth approxi-mately RM38 million.
Furthermore, it has been reported that the group sold RM15 million worth of kitchen and wardrobe cash vouchers to developers in September 2015 and the developers had given the vouchers to their home purchasers. With the amount increasing to RM30 million as of May 2016, management expects this amount to be recognised over the next two years when home purchasers purchase their kitchen systems with the cash vouchers.
However, the group has announced that the long-awaited contract from Country Gar-den’s Danga Bay development in Johor has come to an end after both companies were unable to agree on pricing and contract dura-tion. The decision was made after manage-ment conducted due diligence on the proj-ect’s viability and found extreme amount of execution risk that may lead to late-delivery compensations, leading to the halt in nego-tiations.
Nonetheless, with an impressive order book at hand to keep the group busy for some time, the high possibility of winning the Battersea contract, as well as a strength-ened war chest from the proceeds of the land sale, we are highly optimistic on Signature’s outlook for the coming quarters. As of 31 Au-gust, the group’s shares closed at RM0.985, representing a price-to-earnings ratio (P/E) of 14 times.
92
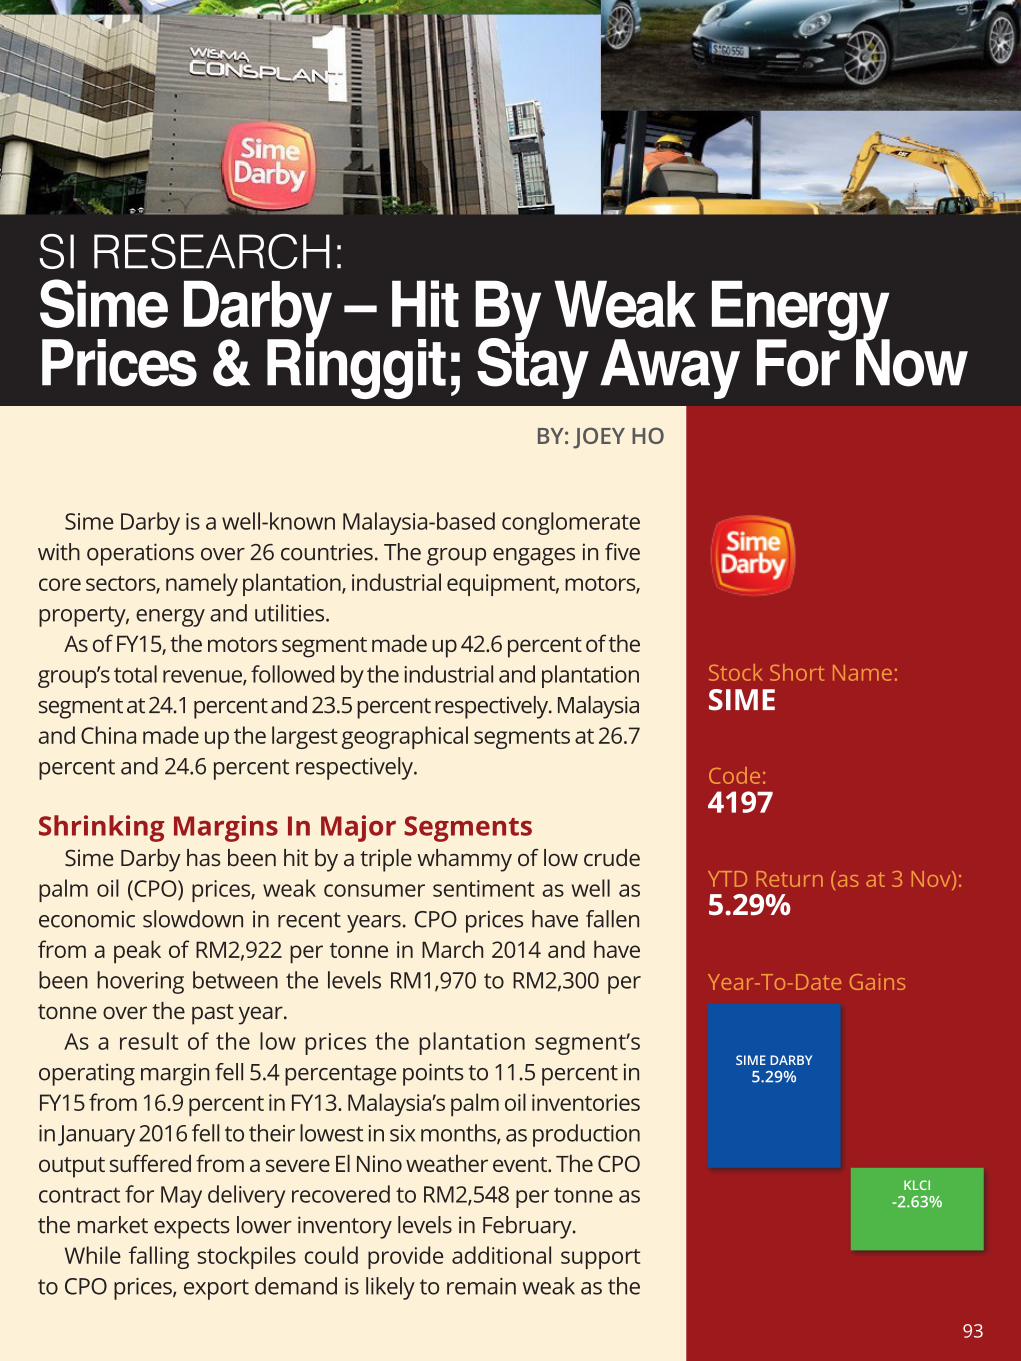
Stock Short Name:
Code:
YTD Return (as at 3 Nov):
Year-To-Date Gains
SI RESEARCH:Sime Darby – Hit By Weak Energy Prices & Ringgit; Stay Away For Now
BY: JOEY HO
Sime Darby is a well-known Malaysia-based conglomerate with operations over 26 countries. The group engages in five core sectors, namely plantation, industrial equipment, motors, property, energy and utilities.
As of FY15, the motors segment made up 42.6 percent of the group’s total revenue, followed by the industrial and plantation segment at 24.1 percent and 23.5 percent respectively. Malaysia and China made up the largest geographical segments at 26.7 percent and 24.6 percent respectively.
Shrinking Margins In Major SegmentsSime Darby has been hit by a triple whammy of low crude
palm oil (CPO) prices, weak consumer sentiment as well as economic slowdown in recent years. CPO prices have fallen from a peak of RM2,922 per tonne in March 2014 and have been hovering between the levels RM1,970 to RM2,300 per tonne over the past year.
As a result of the low prices the plantation segment’s operating margin fell 5.4 percentage points to 11.5 percent in FY15 from 16.9 percent in FY13. Malaysia’s palm oil inventories in January 2016 fell to their lowest in six months, as production output suffered from a severe El Nino weather event. The CPO contract for May delivery recovered to RM2,548 per tonne as the market expects lower inventory levels in February.
While falling stockpiles could provide additional support to CPO prices, export demand is likely to remain weak as the
SIME
4197
5.29%
SIME DARBY5.29%
KLCI-2.63%
93

CONTENT PAGE
narrowing of spread between CPO and soy oil has resulted in China, the largest export destination, favoring soybeans. Though we view the possible recovery of CPO prices favorable to Sime Darby, it is unlikely to lift overall performance significantly.
The motors segment saw operating margins dipping 1.5 percentage points to 2.5 percent in FY15 from four percent in FY13. The motors segment operations in Malaysia have been hit by softening market conditions and tighter lending policies. Austerity policies, crackdown on corruption as well as increasing competition in China continue to impact the luxury vehicle segment. While the outlook in the division’s major markets is expected to remain weak, strong hopes are pinned on the newly acquired luxury segment dealerships in Australia and Vietnam.
The industrial segment operating margin fell by close to half from 9.1 percent in FY13 to 4.9 percent in FY15 due to lower equipment and product support sales following the slump in coal prices and also the economic slowdown. The outlook for coal remains bleak due to falling consumption amid cheap oil prices.
Disappointing Results, High Debt Levels
Sime Darby’s debt-to-EBITDA ratio of 4.8 times, as of 31 December 2015, has set off alarm bells which have prompted Standard & Poor’s Ratings Services to lower the group’s long-term corporate credit rating to BBB+ from A-, citing uncertainties in the implementation of deleveraging measures. Following the lowered ratings, yields on 2018 debt and 2023 securities climbed nine basis points and six basis points to 2.59 percent and 3.75 percent respectively, increasing the group’s finance cost.
The group’s net debt soared to RM16.7
billion following the debt funded acquisition of New Britain Palm Oil for US$1.7 billion. The group risks its ratings being lowered further if it is unable to reduce the ratio to below 2.5 times as of FY17.
The group’s 1H16 net earnings of RM601.7 million made up just over a quarter of FY15 net earnings of RM2.3 billion. While performance is likely to pick up in the second half of FY16, it is unlikely that the group will be able to achieve its targeted net profit of RM2 billion.
Lower DividendsSime Darby has reduced its dividend by 30.6
percent in FY15 to RM0.25 from RM0.36 in FY14, this is the first time in five years that the group has declared an annual dividend of less than RM0.30. As such, we are unable to foresee any significant dividend growth in the future.
Foreign Exchange RiskThe weakened Malaysian ringgit has inflated
the group’s dollar denominated debt which makes up a significant portion of its total debt. Any further depreciation of the ringgit would mean that the group will need to work harder to reduce its debt.
The group has recently announced that it seeks to raise RM1.8 billion from asset sales and proposed a RM3 billion perpetual Islamic bond as part of its effort to deleverage its balance sheet.
Sime Darby’s share price has plunged 21 percent to RM7.47 as of 29 February 2016, from a 52-week high of RM9.46. The current street target price is RM7.45 with a hold recommendation. Taking into account the unlikelihood of a significant margin recovery in addition to the weak dividends, we would prefer to stay on the sidelines as the weakening economy coupled with heavy debt spells much uncertainty.
94
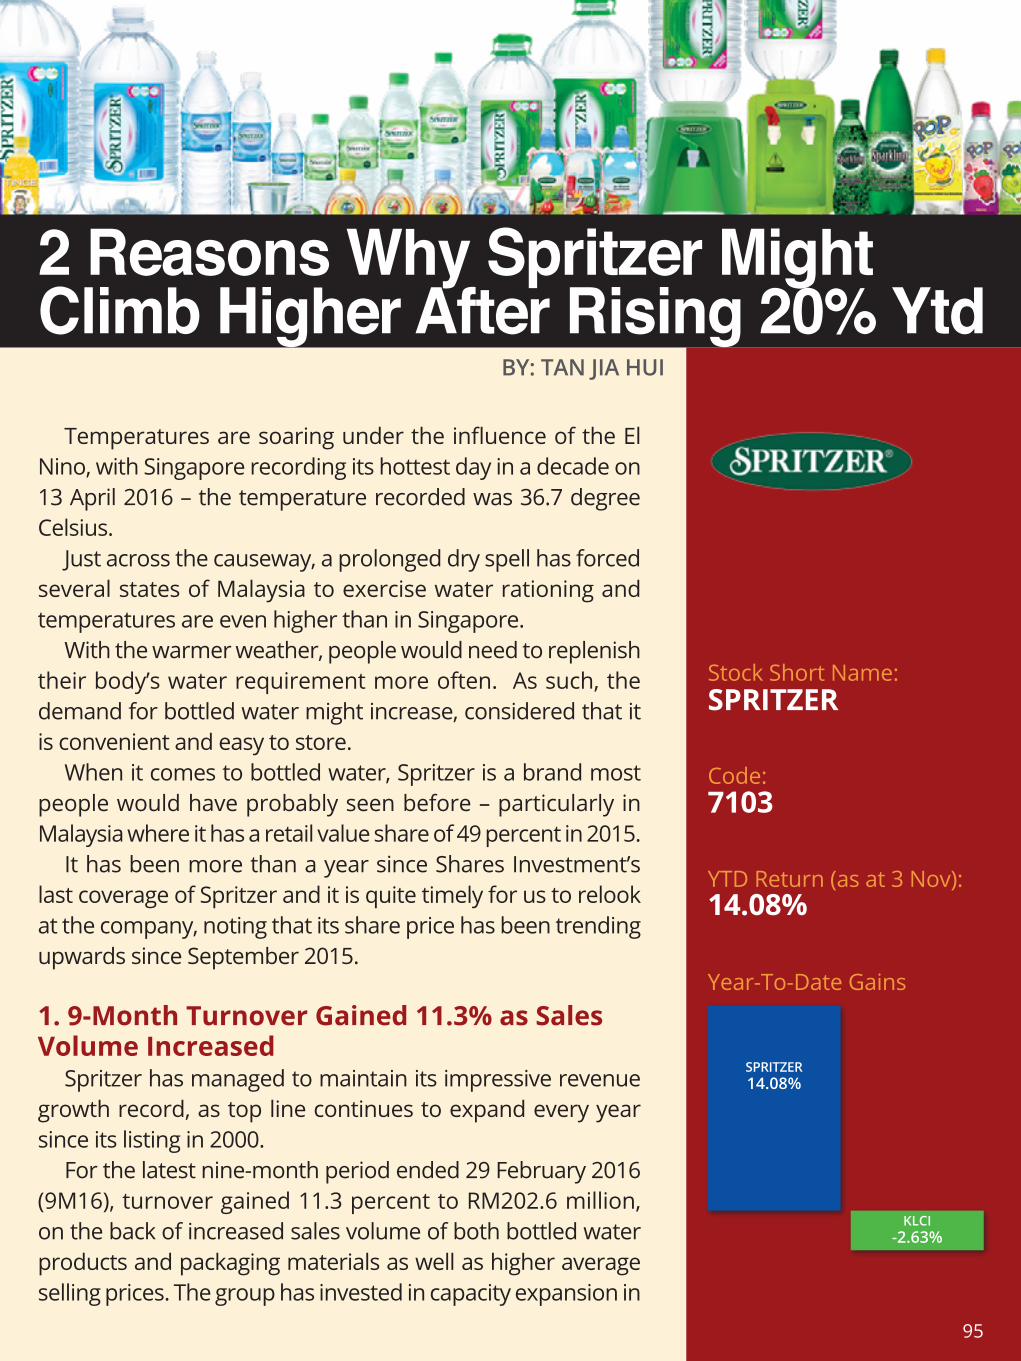
Stock Short Name:
Code:
YTD Return (as at 3 Nov):
Year-To-Date Gains
BY: TAN JIA HUI
Temperatures are soaring under the influence of the El Nino, with Singapore recording its hottest day in a decade on 13 April 2016 – the temperature recorded was 36.7 degree Celsius.
Just across the causeway, a prolonged dry spell has forced several states of Malaysia to exercise water rationing and temperatures are even higher than in Singapore.
With the warmer weather, people would need to replenish their body’s water requirement more often. As such, the demand for bottled water might increase, considered that it is convenient and easy to store.
When it comes to bottled water, Spritzer is a brand most people would have probably seen before – particularly in Malaysia where it has a retail value share of 49 percent in 2015.
It has been more than a year since Shares Investment’s last coverage of Spritzer and it is quite timely for us to relook at the company, noting that its share price has been trending upwards since September 2015.
1. 9-Month Turnover Gained 11.3% as Sales Volume Increased
Spritzer has managed to maintain its impressive revenue growth record, as top line continues to expand every year since its listing in 2000.
For the latest nine-month period ended 29 February 2016 (9M16), turnover gained 11.3 percent to RM202.6 million, on the back of increased sales volume of both bottled water products and packaging materials as well as higher average selling prices. The group has invested in capacity expansion in
2 Reasons Why Spritzer Might Climb Higher After Rising 20% Ytd
SPRITZER
7103
14.08%
SPRITZER14.08%
KLCI-2.63%
95
CONTENT PAGE
the past few years and its annual production capacity has grown from 500 million litres of bottled water at end FY14 to 550 million litres of bottled water at end FY15.
In tandem, 9M16 bottom line jumped 34.6 percent to RM20.9 million, as profitability was further boosted by better economies of scale and a reduction in plastic packaging material costs. The firm has benefitted from lower crude prices, due to a decline in prices of PET resins, which is a subset of petroleum products and a main raw material used in plastic bottles.
2. Planned Expansion Into China to Boost International Sales
In FY15, most of Spritzer’s revenue was derived in the domestic Malaysian market, with export sales making up less than 10 percent of its total revenue. However, the group plans to grow its exports segment and is eyeing to penetrate the China market.
It is not hard to see why the firm is planning a foray into the Chinese market. With a population more than 45 times greater than Malaysia, China has grown to become world’s largest bottled water consumer in the last two decades.
The company’s plan is to enter the Chinese market through Guangzhou – where a unit has already been formed and begun operations in November 2015 – and to focus on the premium segment of bottled mineral water.
Management acknowledges that the initial penetration into the Chinese market is not easy and would require substantial upfront investments, especially in the sales and marketing area to expose the Spritzer brand in China. However, the possible upside potential is huge given the market size.
Given the number of incumbents already in the market, the group’s task in China will
not be easy. That said, with China’s history of food scandals coupled with rising affluence in the nation, people might be more willing to pay extra for ‘premium’ imported products – the segment targeted by the firm – that are deemed as ‘safer’.
ValuationsBased on a close price of RM2.56 as at 5 May,
the company’s share has risen 20.8 percent year-to-date, outperforming the Malaysian benchmark Kuala Lumpur Composite Index that is down 0.5 percent over the same period.
Based on price per share of RM2.56, the group’s stocks are trading at a trailing twelve-month price-to-earnings (P/E) ratio of 14.3 times, slightly on the higher end of its 5-year P/E range of 9 times to 18.6 times and above its 5-year average of 12.9 times. After the run up in share price this year, analysts on the streets have an average ‘Hold’ rating on the stock, with a mean target price of RM2.46.
Apart from the resilient business (given that water is a necessity), Spritzer also has a long history of paying out dividends – without fail since listing – which is a plus point, though dividend yield is relatively low at 2 percent.
Notable risks include weaker demand growth, foreign exchange fluctuations (certain raw materials purchased are denominated in US dollar), increased competition and a rise in raw materials prices.
96
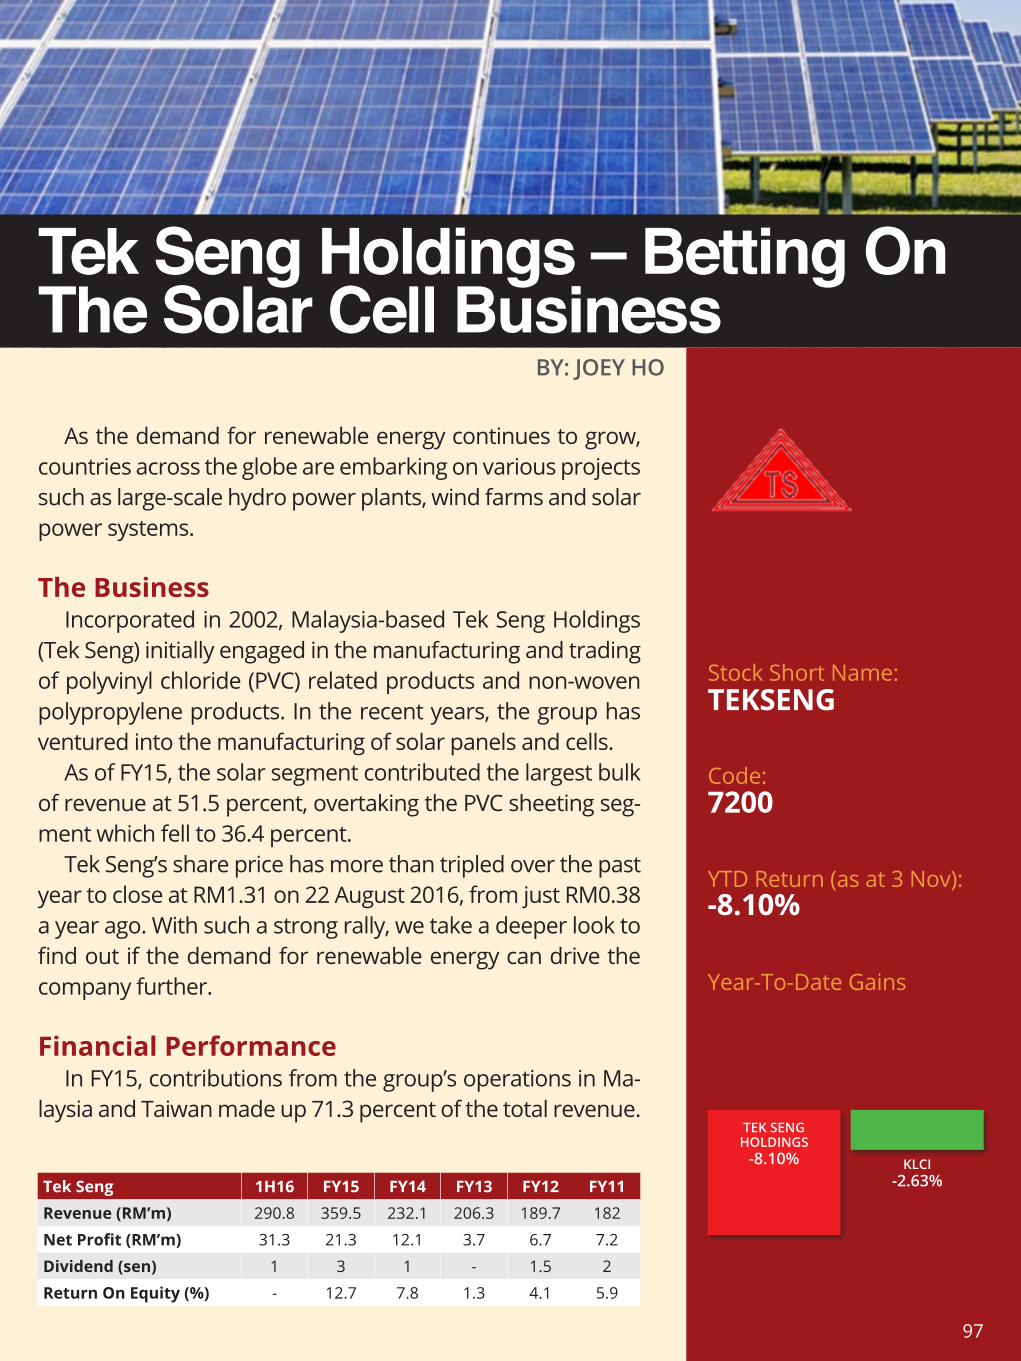
Stock Short Name:
Code:
YTD Return (as at 3 Nov):
Year-To-Date Gains
BY: JOEY HO
As the demand for renewable energy continues to grow, countries across the globe are embarking on various projects such as large-scale hydro power plants, wind farms and solar power systems.
The BusinessIncorporated in 2002, Malaysia-based Tek Seng Holdings
(Tek Seng) initially engaged in the manufacturing and trading of polyvinyl chloride (PVC) related products and non-woven polypropylene products. In the recent years, the group has ventured into the manufacturing of solar panels and cells.
As of FY15, the solar segment contributed the largest bulk of revenue at 51.5 percent, overtaking the PVC sheeting seg-ment which fell to 36.4 percent.
Tek Seng’s share price has more than tripled over the past year to close at RM1.31 on 22 August 2016, from just RM0.38 a year ago. With such a strong rally, we take a deeper look to find out if the demand for renewable energy can drive the company further.
Financial PerformanceIn FY15, contributions from the group’s operations in Ma-
laysia and Taiwan made up 71.3 percent of the total revenue.
Tek Seng Holdings – Betting On The Solar Cell Business
Tek Seng 1H16 FY15 FY14 FY13 FY12 FY11Revenue (RM’m) 290.8 359.5 232.1 206.3 189.7 182
Net Profit (RM’m) 31.3 21.3 12.1 3.7 6.7 7.2
Dividend (sen) 1 3 1 - 1.5 2
Return On Equity (%) - 12.7 7.8 1.3 4.1 5.9
TEKSENG
7200
-8.10%
TEK SENG HOLDINGS
-8.10% KLCI-2.63%
97
CONTENT PAGE
Despite a lacklustre FY13, the group’s over-all track record displayed an improvement in revenue, net profit and return on equity over the past four years. Net profit almost tripled from FY11 to FY15 while revenue came close to doubling up during the period. The most im-pressive component for Tek Seng is the return on equity, which added over 10 percentage points from FY13, indicating a profit-generating efficiency.
Tek Seng reported strong 1H16 results with a net profit of RM31.3 million, already exceed-ing the full-year net profit for FY15. In addition, the solar cell business is expected to generate about 70 percent of the company’s revenue for FY16, given that the order book has been filled till the end of this year. As such, investors could look forward to a higher dividend payout this year.
Expanding Production LinesTechnological advancement has made solar
cells and panels more efficient and less costly than before, in turn driving up the demand for such systems. In order to keep up with the strong demand, Tek Seng plans to increase its solar cell production capacity to 10 million pieces per month from the current 5.6 million pieces per month.
The group currently has seven production lines, of which three will be fully operational next month, and another two more will be added by the end of 2016, bringing the total number of production lines to nine. Tek Seng estimates that the nine production lines, once fully operational, will produce 156 million piec-es of solar panels per annum worth US$234 million, based on current market values.
Moving Towards Renewable Energy
Malaysia’s Ministry of Energy, Green Tech-nology and Water (KeTTHA) will be calling for a request for proposal to develop 250-megawatt (MW) utility-scale solar power plants this year, highlighting the growing demand for renew-able energy.
KeTTHA acknowledges that the country was still far from achieving its renewable energy tar-get and plans to scale up electricity generation from renewable energy. Apart from utility-scale solar facility, the Malaysian government has also approved a net energy metering (NEM) mechanism. The NEM allows consumers to install solar panels on the rooftop of premises enabling them to net off their electricity bills in generating more electricity during daylight hours.
While the overall move towards renewable energy is a positive sign for Tek Seng, we re-main cautious on the group’s ability to secure public projects. KeTTHA recently drew flak when it directly awarded a contract to Tadmax Resources to develop a new 1,000MW plant in Pulau Indah, Selangor. According to Malaysian media, it was the third time in the last two years that a company has been awarded a power plant project directly.
The Bottom LineBased on the last 12 months earnings per
share, Tek Seng’s shares are currently valued at a price to earnings (P/E) ratio of nine times while trading slightly below its 52-week high of RM1.43.
We remain neutral on Tek Seng despite the moderate valuations. While the order book has been filled till the end of 2016, there are some uncertainties going forward into 2017. As solar cells become cheaper due to growing competi-tion and higher production efficiency, Tek Seng’s margins could thin out in the near future.
98
Stock Short Name:
Code:
YTD Return (as at 3 Nov):
Year-To-Date Gains
The telecommunications’ industry, one which many investors have a love-hate relationship with, be it because of the high barriers of entry and domination by a few large companies with consistent earnings, or hate it because of the high fixed costs and debt levels, there is no doubt that their services are required regardless of economic outlook. Despite the risks involved, there is still a place for these companies to be in our portfolio.
Today we look across the causeway at our neighbor Malaysia, and focus in on one of its more prominent telecommunications company in the market, Telekom Malaysia, and discuss on some of the reasons why it has been beeping on our radar seeking our attention.
Broadband Champion In An Expanding Market
Telekom Malaysia has established itself as one of the big players in the market, playing in the same field with the big names such as Maxis Communications, Axiata Group and DiGi.com. One area which it has surpassed all its competitors is in the broadband services, where it has solidly maintained its position as Malaysia’s broadband champion with their customer base growing to 2.23 million, led by UniFi, as of FY14.
Statistics released by the Malaysian Communications And Multimedia Commission (MCMC) has also indicated
BY: SUA XIU KAI
SI RESEARCH:Telekom Malaysia – Game Changer Dragged By Operating Expenses
TM
4863
-4.13%
TELEKOM M’SIA-4.13%
KLCI-2.63%
99

CONTENT PAGE
that the population of Malaysia has been increasing steadily, and so is Malaysia’s broadband penetration rates. In 2Q15, the MCMC reported that broadband penetration per 100 households have reached an all-time high of 72.2, while in 2Q14 the figure stood at 67.2.
platform for the group to more efficiently roll out wireless broadband products and eventually, reach full mobility. The provision of mobility solutions is a natural progression given synergies with the group’s fixed services and is in line with the industry’s evolution towards true convergence.
At the time of acquisition, P1’s half-a-million subscriber and coverage in 9 out of 12 states in Peninsular Malaysia provides the group a meaningful base to start with into the mobile market as it was able to gain access to P1’s base stations.
However, “not all that glitter is gold” when it comes to such big acquisitions. Despite P1’s strong foothold in the mobile internet market, and plans by the group to even further expand their coverage, since acquisition, P1 has reported EBITDA losses and was unable to contribute to the group’s earnings which has been consistently dragged by pre-existing operating expenses.
Pressuring Operating ExpensesLooking at Telekom Malaysia’s financial
scorecard, the group has recorded an all-time high revenue of RM11.2 billion for FY14 and revenue has been consistently increasing for the past five years, with revenue CAGR standing at 5.03 percent. Though it is not in the double digit range that all investors love so much, but in such a highly competitive industry, any growth is greatly welcomed.
However, the performance for net profit has been a great contrast to that of revenue received. Net profit has dropped 19.9 percent and 17.82 percent for FY13 and FY14 respectively, standing at RM831.8 million for FY14. This dismal performance for net profit highlights a persistent problem of high operating expenses which erodes the
Year QuarterBroadband
Per 100 inhabitants
Per 100 households
2014 2 23.6 67.2
3 24.9 67.8
4 68.3 70.2
2015 1 77.6 70.4
2 97.7 72.2
Source: Malaysian Communications And Multimedia Commission
As the market leader in broadband services, Telekom Malaysia has established a strong foundation for the expansion in market size in tandem with the increasing population.
Game Changing AcquisitionsHaving established a strong holding in the
broadband segment, and claiming the title of “Broadband Champion” wasn’t enough to satisfy the group’s thirst for market share as it has been looking towards venturing into other areas such as mobile broadband in order to be Malaysia’s “one and only true Convergence Champion”. In March 2014, the group acquired a 57 percent stake in mobile wireless operator Packet One Networks (P1) for RM560 million, and plans to invest up to RM1 billion in P1 in 4 years.
This game changing acquisition by the group will give it a boost to expand its wireless business and move into the 4G mobile space as P1 provides an LTE-ready
100
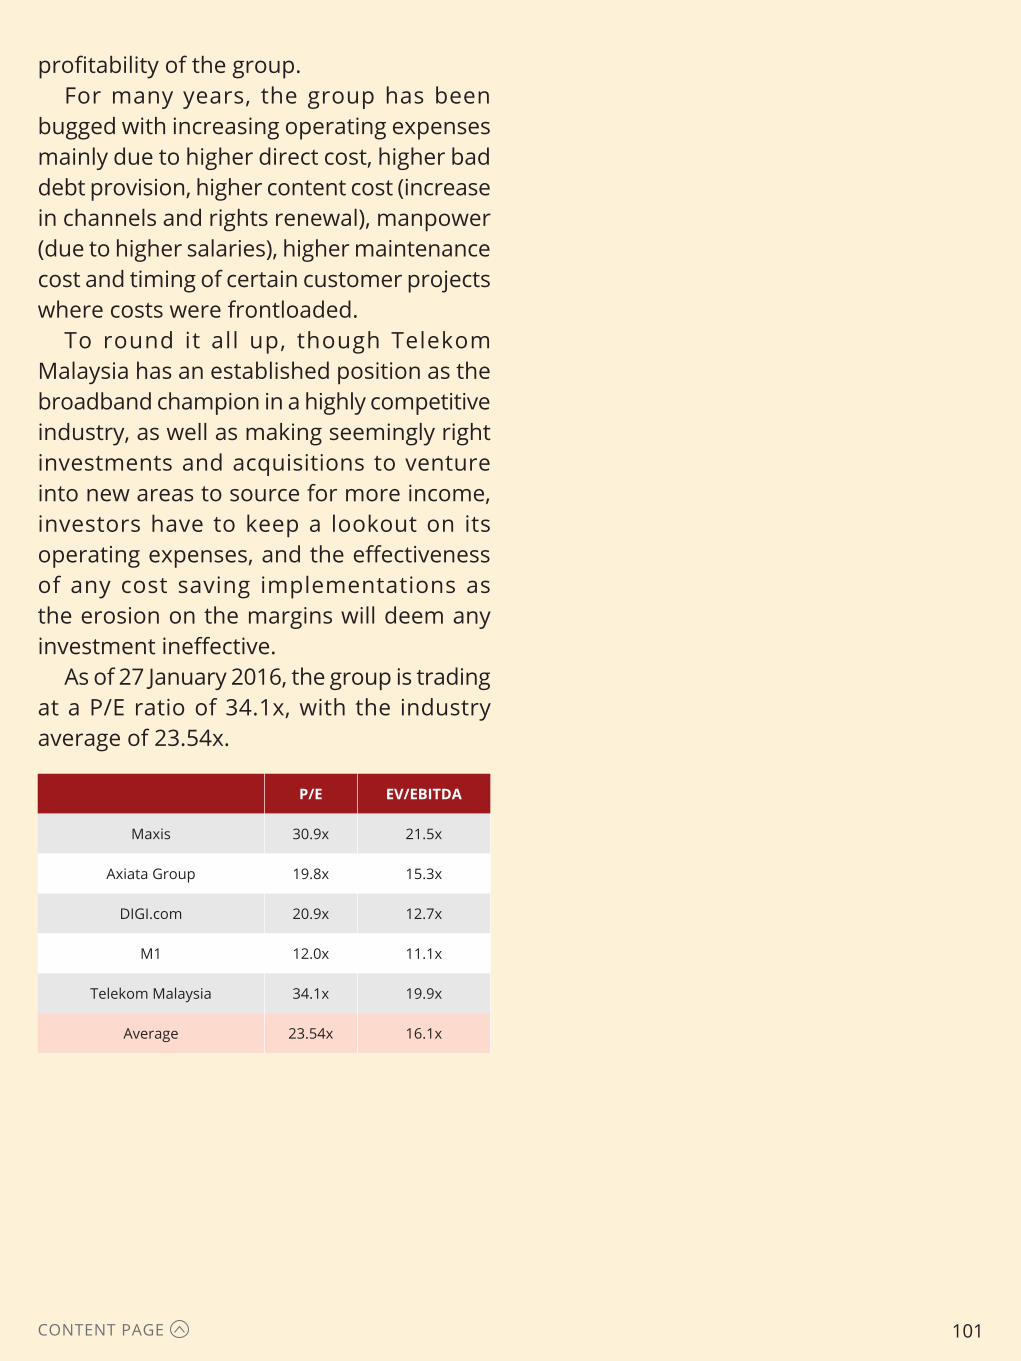
CONTENT PAGE
profitability of the group.For many years, the group has been
bugged with increasing operating expenses mainly due to higher direct cost, higher bad debt provision, higher content cost (increase in channels and rights renewal), manpower (due to higher salaries), higher maintenance cost and timing of certain customer projects where costs were frontloaded.
To round it all up, though Telekom Malaysia has an established position as the broadband champion in a highly competitive industry, as well as making seemingly right investments and acquisitions to venture into new areas to source for more income, investors have to keep a lookout on its operating expenses, and the effectiveness of any cost saving implementations as the erosion on the margins will deem any investment ineffective.
As of 27 January 2016, the group is trading at a P/E ratio of 34.1x, with the industry average of 23.54x.
P/E EV/EBITDA
Maxis 30.9x 21.5x
Axiata Group 19.8x 15.3x
DIGI.com 20.9x 12.7x
M1 12.0x 11.1x
Telekom Malaysia 34.1x 19.9x
Average 23.54x 16.1x
101
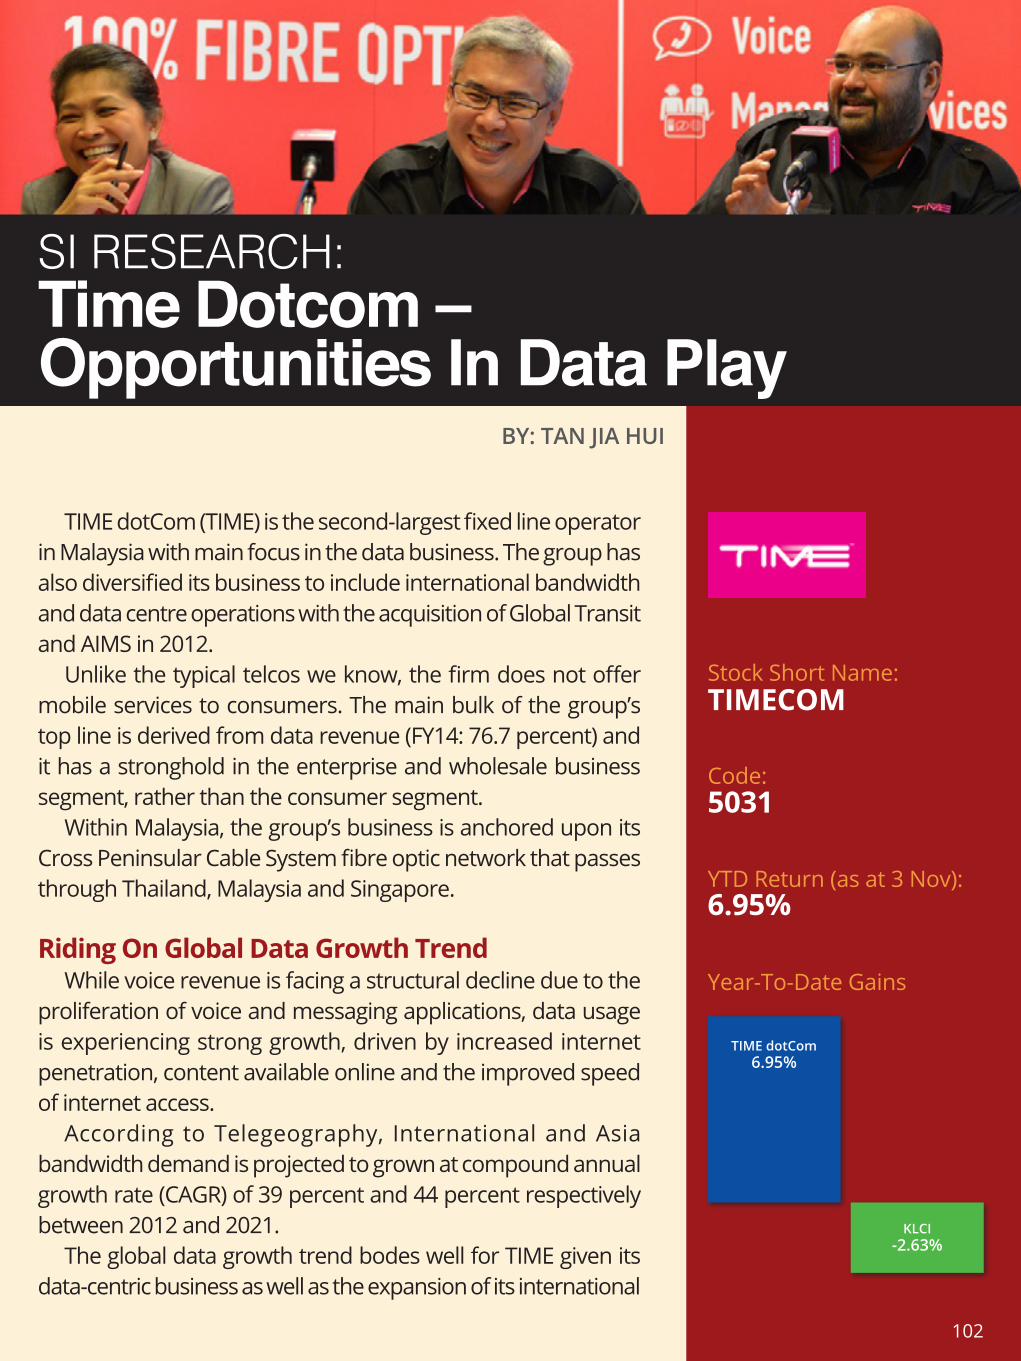
Stock Short Name:
Code:
YTD Return (as at 3 Nov):
Year-To-Date Gains
TIME dotCom (TIME) is the second-largest fixed line operator in Malaysia with main focus in the data business. The group has also diversified its business to include international bandwidth and data centre operations with the acquisition of Global Transit and AIMS in 2012.
Unlike the typical telcos we know, the firm does not offer mobile services to consumers. The main bulk of the group’s top line is derived from data revenue (FY14: 76.7 percent) and it has a stronghold in the enterprise and wholesale business segment, rather than the consumer segment.
Within Malaysia, the group’s business is anchored upon its Cross Peninsular Cable System fibre optic network that passes through Thailand, Malaysia and Singapore.
Riding On Global Data Growth TrendWhile voice revenue is facing a structural decline due to the
proliferation of voice and messaging applications, data usage is experiencing strong growth, driven by increased internet penetration, content available online and the improved speed of internet access.
According to Telegeography, International and Asia bandwidth demand is projected to grown at compound annual growth rate (CAGR) of 39 percent and 44 percent respectively between 2012 and 2021.
The global data growth trend bodes well for TIME given its data-centric business as well as the expansion of its international
BY: TAN JIA HUI
SI RESEARCH:Time Dotcom – Opportunities In Data Play
TIMECOM
5031
6.95%
TIME dotCom6.95%
KLCI-2.63%
102

CONTENT PAGE
performance is also an important aspect that investors should look at. It would be even better if the management’s interest is somewhat aligned with investors’.
In the aspect, I would view the successful turnaround of TIME’s business in FY09 – the group has in losses between FY04 and FY08 – as a testament to the abilities of chief executive officer (CEO) Afzal Abdul Rahim (appointed in 2008) and his team. Afzal was also the main proponent for the acquisition of Global Transit and AIMS, which helped expand the firm’s product offerings.
According to a report by AllianceDBS Research, Azfal had an indirect 36 percent stake in TIME as of April 2014, putting him amongst the largest shareholder of the group. Given Azfal’s stake in the firm, it seems that his interest would be rather aligned to that of shareholders, as good performance in the company would benefit him directly.
SI Research TakeawayWhile TIME provides a proxy to ride on the
growth trend of increasing data consumption, a steeper than expected decline in bandwidth prices due to expansion regional capacity could impact the firm’s performance. Foreign exchange risks also exist as most of its international bandwidth sales are denominated in US dollar (benefits the group at the moment given the strengthening US dollar).
Despite the growth potential the company exhibits, investors should know that TIME’s share price of RM7.15 (as at the close of 13 January) is a significant rise from its low of RM5.52 in August 2015, which may represent limited upside potential in the short term. Average target price on the streets (mean) stands at RM6.90 and with the equivalent average of a ‘Hold’ rating on the stock.
bandwidth business via investments in new submarine cables.
The rise in mobile data usage in recent years is also set to benefit the firm, through the increase in demand for backhaul infrastructure and capacity (which TIME is already providing to Malaysian cellular operators as well as Thailand and Indochina telcos).
Growth In Wholesale Segment From New Submarine Cables
As mentioned above, the group is a beneficiary of the increase in demand for global bandwidth through its investments in new submarine cables. Currently, TIME has a 10 percent stake in the already operational Unity Cable (connects US to Japan) and is part of the consortiums for three other submarine cables under construction – Asia-Pacific Gateway (APG), FASTER, and the Asia-Africa-Europe-1 (AAR-1) cable systems. The three submarine cable systems are set to be commissioned in FY16 and FY17; the increased connectivity of the group from the East to West should also provide an edge over other competitors in the region.
Notably, the APG cable system (set to be commissioned in mid-2016) will give the firm direct access connectivity to countries in the ASEAN including Thailand and Vietnam, which should aid in its planned expansion in the region. TIME has already taken steps to expand into the region through its investments in a small telco player in Thailand, KIRZ Holdings Co (provides platform to enter Thai fixed line market), as well as Vietnam’s CMC Telecom Infrastructure Corporation.
Strong Management; CEO Interests Aligned With Shareholders
When examining a business, apart from top and bottom line performances, management’s
103

Stock Short Name:
Code:
YTD Return (as at 3 Nov):
Year-To-Date Gains
Top Glove is the world’s largest rubber glove manufacturer that is listed on the Kuala Lumpur Stock Exchange. Despite its size, Top Glove had humble beginnings. Top Gloves’ diverse product range fulfil the demand for both the healthcare and non-healthcare segments.
Below are three main reasons why we like this company.
1. Strong Profitability FinesseOver the past 15 years, this company has leapfrogged
most market indices we’ve tracked, exhibiting superior growth prowess reflected in its revenue and profit after tax.
The compounded annual growth rate (CAGR) for its revenue and profit after tax have been at strong double digits over the past 15 years (sales 15 year CAGR: 25%, profit after tax 15 year CAGR: 29%).
As a result of a 12-14 percent decrease in raw materials needed for its products and a change in product mix, FY15’s gross margin expanded to 22.1 percent, and resulted in a 55 percent increase in net income for FY15 as well.
The strengthening USD has helped the company as it increases its presence in North America’s glove market with greater nitrile glove sales.
Company’s current glove production is split between nitrile and Latex, where the average selling prices charged for nitrile is some 15 percent higher than that of that of Latex.
Riding on the momentum of change in product mix towards that of a higher average selling price, higher efficiency in terms of utilisation rate, and the reduced
BY: LOUIS KENT LEE
SI RESEARCH: 3 Reasons To Like Top Glove
TOPGLOV
7113
-28.41%
TOP GLOVE-28.41%
KLCI-2.63%
104
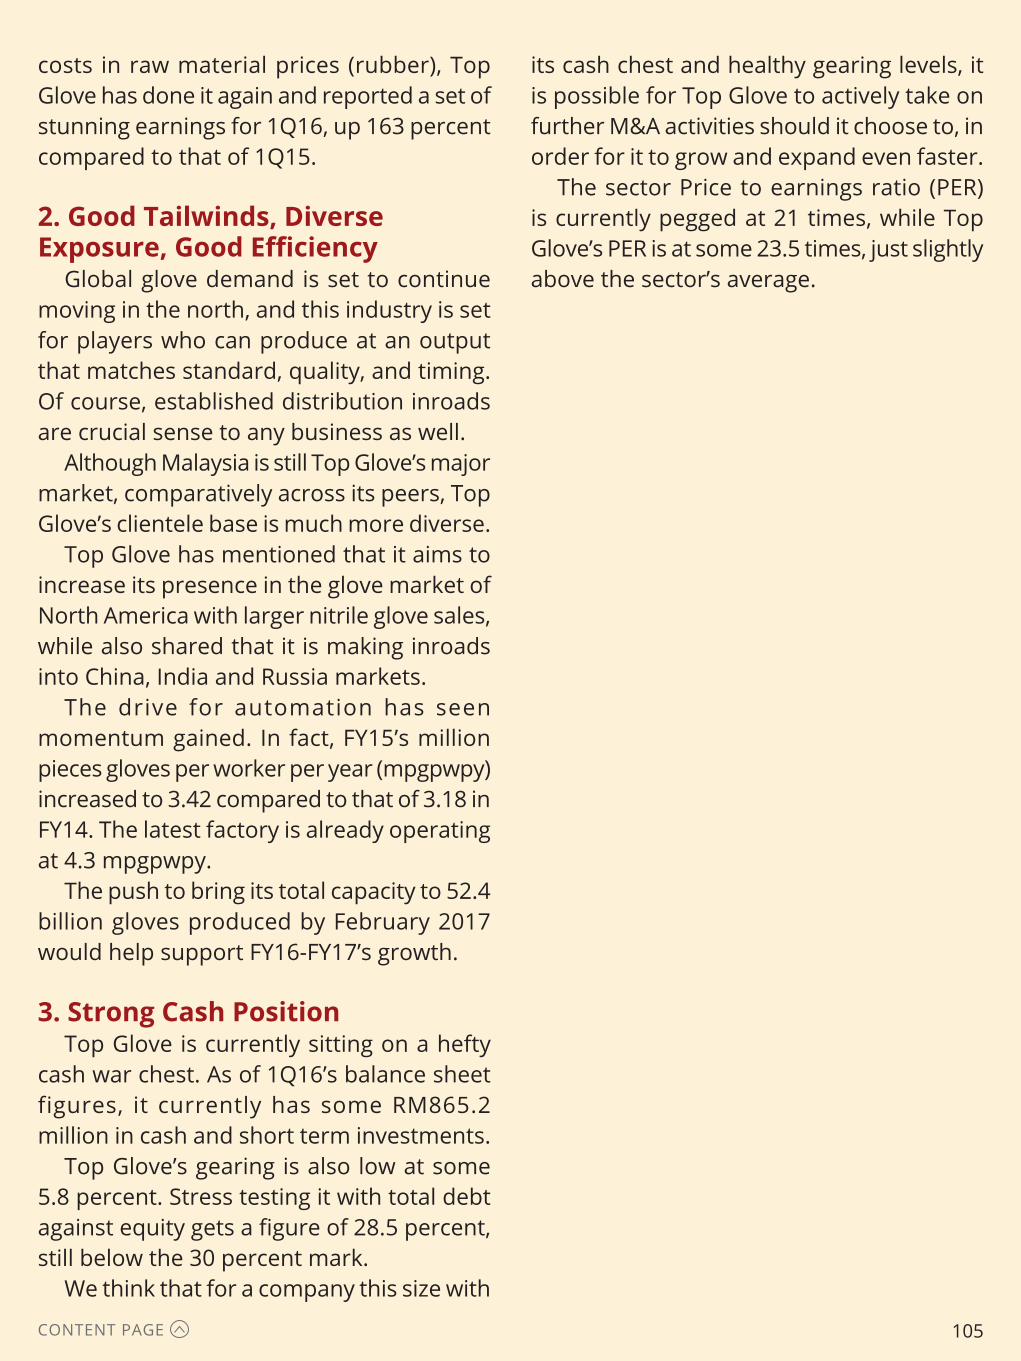
CONTENT PAGE
costs in raw material prices (rubber), Top Glove has done it again and reported a set of stunning earnings for 1Q16, up 163 percent compared to that of 1Q15.
2. Good Tailwinds, Diverse Exposure, Good Efficiency
Global glove demand is set to continue moving in the north, and this industry is set for players who can produce at an output that matches standard, quality, and timing. Of course, established distribution inroads are crucial sense to any business as well.
Although Malaysia is still Top Glove’s major market, comparatively across its peers, Top Glove’s clientele base is much more diverse.
Top Glove has mentioned that it aims to increase its presence in the glove market of North America with larger nitrile glove sales, while also shared that it is making inroads into China, India and Russia markets.
The drive for automation has seen momentum gained. In fact, FY15’s million pieces gloves per worker per year (mpgpwpy) increased to 3.42 compared to that of 3.18 in FY14. The latest factory is already operating at 4.3 mpgpwpy.
The push to bring its total capacity to 52.4 billion gloves produced by February 2017 would help support FY16-FY17’s growth.
3. Strong Cash PositionTop Glove is currently sitting on a hefty
cash war chest. As of 1Q16’s balance sheet figures, it currently has some RM865.2 million in cash and short term investments.
Top Glove’s gearing is also low at some 5.8 percent. Stress testing it with total debt against equity gets a figure of 28.5 percent, still below the 30 percent mark.
We think that for a company this size with
its cash chest and healthy gearing levels, it is possible for Top Glove to actively take on further M&A activities should it choose to, in order for it to grow and expand even faster.
The sector Price to earnings ratio (PER) is currently pegged at 21 times, while Top Glove’s PER is at some 23.5 times, just slightly above the sector’s average.
105
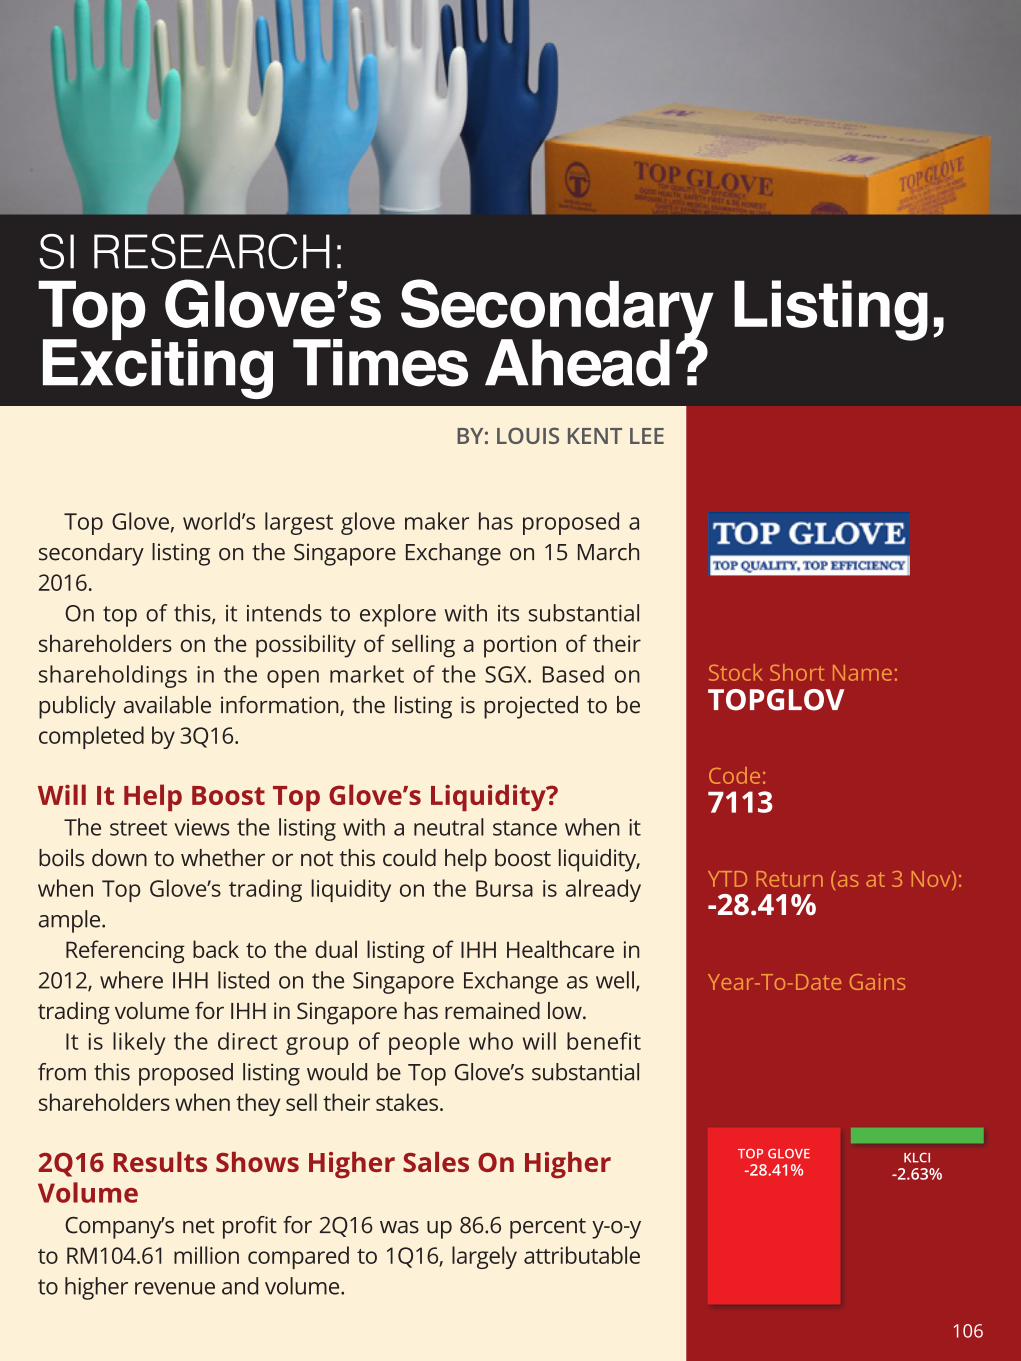
Stock Short Name:
Code:
YTD Return (as at 3 Nov):
Year-To-Date Gains
SI RESEARCH:Top Glove’s Secondary Listing, Exciting Times Ahead?
BY: LOUIS KENT LEE
Top Glove, world’s largest glove maker has proposed a secondary listing on the Singapore Exchange on 15 March 2016.
On top of this, it intends to explore with its substantial shareholders on the possibility of selling a portion of their shareholdings in the open market of the SGX. Based on publicly available information, the listing is projected to be completed by 3Q16.
Will It Help Boost Top Glove’s Liquidity?The street views the listing with a neutral stance when it
boils down to whether or not this could help boost liquidity, when Top Glove’s trading liquidity on the Bursa is already ample.
Referencing back to the dual listing of IHH Healthcare in 2012, where IHH listed on the Singapore Exchange as well, trading volume for IHH in Singapore has remained low.
It is likely the direct group of people who will benefit from this proposed listing would be Top Glove’s substantial shareholders when they sell their stakes.
2Q16 Results Shows Higher Sales On Higher Volume
Company’s net profit for 2Q16 was up 86.6 percent y-o-y to RM104.61 million compared to 1Q16, largely attributable to higher revenue and volume.
TOPGLOV
7113
-28.41%
TOP GLOVE-28.41%
KLCI-2.63%
106
CONTENT PAGE
Sales volume in 2Q16 rose 15.8 percent y-o-y, resulting in increased revenue of 21.3 percent to RM693.9 million in 2Q16.
Consolidating 1H16 numbers, 1H16 profits more than doubled to some RM233 million compared to that of RM104.75 million in 1H15, while 1H16 revenue increased 31.1 percent to some RM1.5 billion.
Sales volume for Top Glove far exceeded the 8-10 percent growth rate for global glove demand projected by the glove manufacturers association.
Benefitting From Lower Raw Materials Price
Top Glove also noted that it benefitted from lower raw material prices. Latex prices have decreased by an average of 5 percent to RM3.45 per kg for latex and 7 percent to US$0.96 per kg for nitrile compared with 2Q15.
Top Glove stressed that the strong results was a testament to its various initiatives in its improvement in quality and efficiency, which have served it well in the face of an increasingly competitive landscape.
Lifting Singapore Glove MakersThe listing of Top Glove is expected to
bring more colour and possibly even lift the valuations of glove makers listed on the SGX. At the time of writing, Top Glove is trading at RM5.20 with an implied Price to Earnings ratio of 18 times.
107
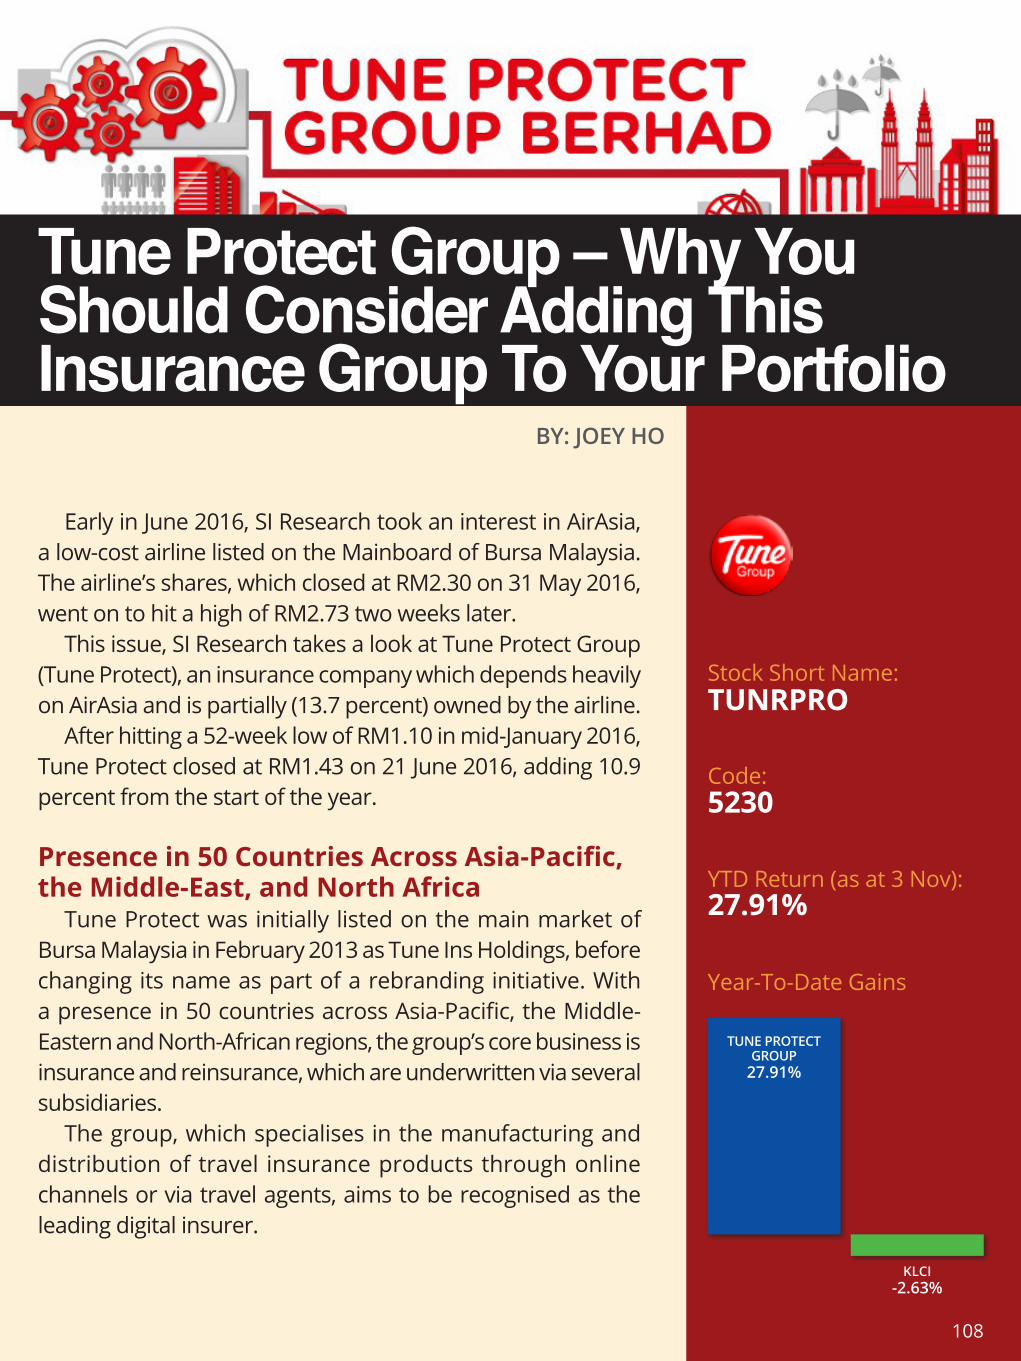
Stock Short Name:
Code:
YTD Return (as at 3 Nov):
Year-To-Date Gains
BY: JOEY HO
Early in June 2016, SI Research took an interest in AirAsia, a low-cost airline listed on the Mainboard of Bursa Malaysia. The airline’s shares, which closed at RM2.30 on 31 May 2016, went on to hit a high of RM2.73 two weeks later.
This issue, SI Research takes a look at Tune Protect Group (Tune Protect), an insurance company which depends heavily on AirAsia and is partially (13.7 percent) owned by the airline.
After hitting a 52-week low of RM1.10 in mid-January 2016, Tune Protect closed at RM1.43 on 21 June 2016, adding 10.9 percent from the start of the year.
Presence in 50 Countries Across Asia-Pacific, the Middle-East, and North Africa
Tune Protect was initially listed on the main market of Bursa Malaysia in February 2013 as Tune Ins Holdings, before changing its name as part of a rebranding initiative. With a presence in 50 countries across Asia-Pacific, the Middle-Eastern and North-African regions, the group’s core business is insurance and reinsurance, which are underwritten via several subsidiaries.
The group, which specialises in the manufacturing and distribution of travel insurance products through online channels or via travel agents, aims to be recognised as the leading digital insurer.
Tune Protect Group – Why You Should Consider Adding This Insurance Group To Your Portfolio
TUNRPRO
5230
27.91%
TUNE PROTECT GROUP
27.91%
KLCI-2.63%
108
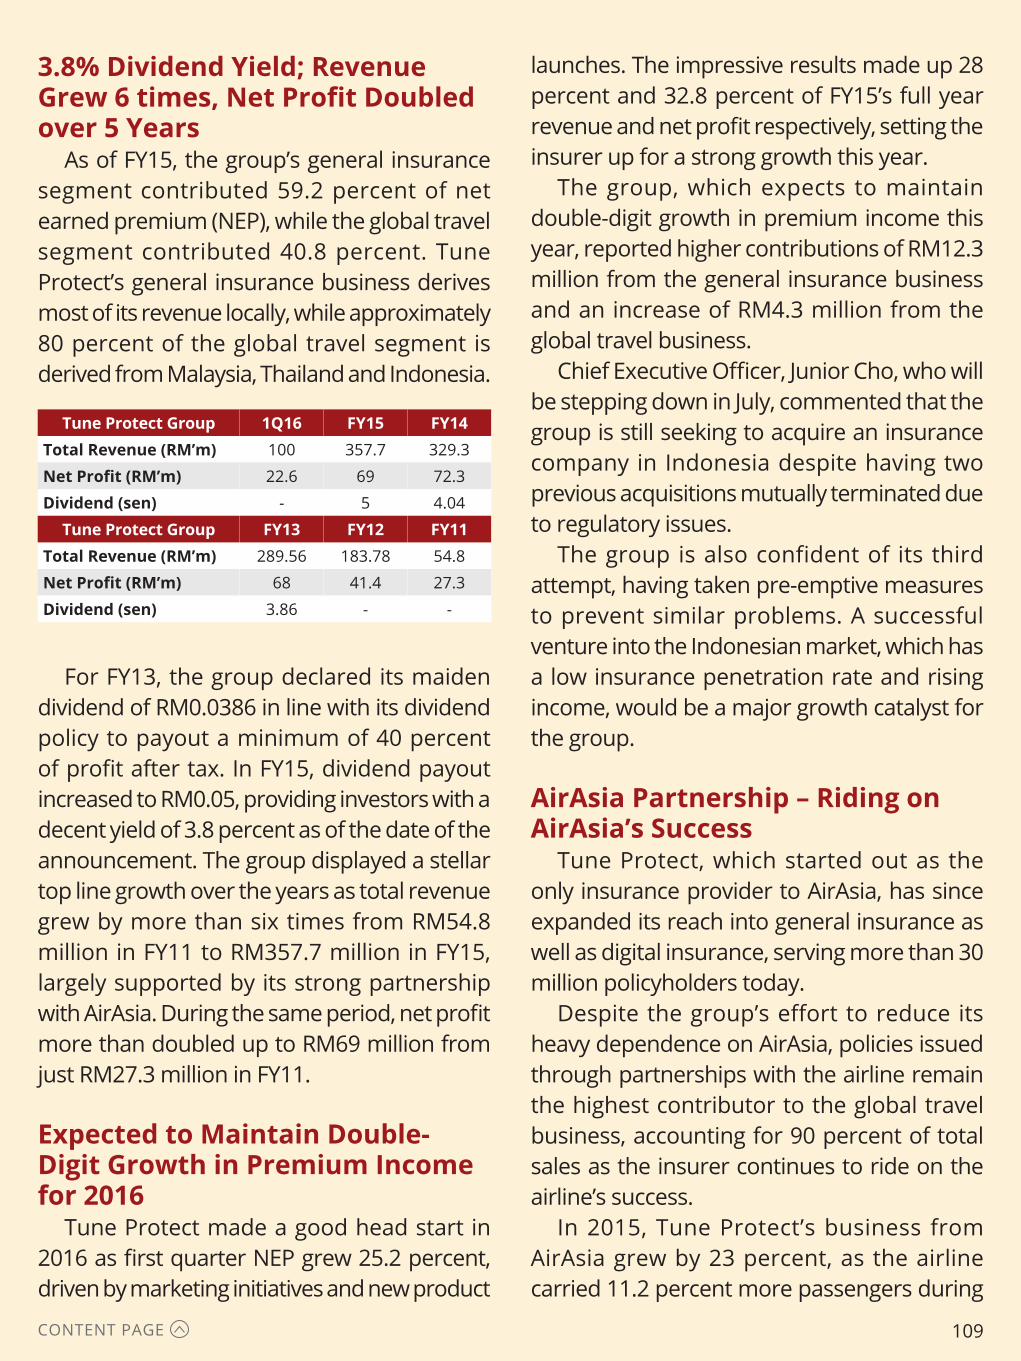
CONTENT PAGE
3.8% Dividend Yield; Revenue Grew 6 times, Net Profit Doubled over 5 Years
As of FY15, the group’s general insurance segment contributed 59.2 percent of net earned premium (NEP), while the global travel segment contributed 40.8 percent. Tune Protect’s general insurance business derives most of its revenue locally, while approximately 80 percent of the global travel segment is derived from Malaysia, Thailand and Indonesia.
launches. The impressive results made up 28 percent and 32.8 percent of FY15’s full year revenue and net profit respectively, setting the insurer up for a strong growth this year.
The group, which expects to maintain double-digit growth in premium income this year, reported higher contributions of RM12.3 million from the general insurance business and an increase of RM4.3 million from the global travel business.
Chief Executive Officer, Junior Cho, who will be stepping down in July, commented that the group is still seeking to acquire an insurance company in Indonesia despite having two previous acquisitions mutually terminated due to regulatory issues.
The group is also confident of its third attempt, having taken pre-emptive measures to prevent similar problems. A successful venture into the Indonesian market, which has a low insurance penetration rate and rising income, would be a major growth catalyst for the group.
AirAsia Partnership – Riding on AirAsia’s Success
Tune Protect, which started out as the only insurance provider to AirAsia, has since expanded its reach into general insurance as well as digital insurance, serving more than 30 million policyholders today.
Despite the group’s effort to reduce its heavy dependence on AirAsia, policies issued through partnerships with the airline remain the highest contributor to the global travel business, accounting for 90 percent of total sales as the insurer continues to ride on the airline’s success.
In 2015, Tune Protect’s business from AirAsia grew by 23 percent, as the airline carried 11.2 percent more passengers during
Tune Protect Group 1Q16 FY15 FY14Total Revenue (RM’m) 100 357.7 329.3
Net Profit (RM’m) 22.6 69 72.3
Dividend (sen) - 5 4.04
Tune Protect Group FY13 FY12 FY11Total Revenue (RM’m) 289.56 183.78 54.8
Net Profit (RM’m) 68 41.4 27.3
Dividend (sen) 3.86 - -
For FY13, the group declared its maiden dividend of RM0.0386 in line with its dividend policy to payout a minimum of 40 percent of profit after tax. In FY15, dividend payout increased to RM0.05, providing investors with a decent yield of 3.8 percent as of the date of the announcement. The group displayed a stellar top line growth over the years as total revenue grew by more than six times from RM54.8 million in FY11 to RM357.7 million in FY15, largely supported by its strong partnership with AirAsia. During the same period, net profit more than doubled up to RM69 million from just RM27.3 million in FY11.
Expected to Maintain Double-Digit Growth in Premium Income for 2016
Tune Protect made a good head start in 2016 as first quarter NEP grew 25.2 percent, driven by marketing initiatives and new product
109
CONTENT PAGE
the year. Early this month, we identified key growth factors for the airline, such as major airport developments in Malaysia as well as new routes to boost connectivity. These factors are expected to contribute positively to the insurer as well.
ValuationBased on the latest closing price, Tune
Protect’s shares are currently trading at a price-to-book ratio (P/B) of 2.3 times and price-to-earnings (P/E) ratio of 15.6 times. A close competitor in the insurance industry, Syarikat Takaful Malaysia, last closed at RM3.94 equivalent to a P/B of 4.8 times and P/E of 20.7 times.
Given Tune Protect’s lower valuations and strong tailwinds ahead, we believe that the insurer’s shares should be trading at higher valuations. Currently, the average street target price stands at RM1.95, presenting the potential for an approximate 36.4 percent upside.
110