unclassified ad number limitation changesvolume v - a method for estimating beach trafficability...
TRANSCRIPT

UNCLASSIFIED
AD NUMBER
LIMITATION CHANGESTO:
FROM:
AUTHORITY
THIS PAGE IS UNCLASSIFIED
AD038083
Approved for public release; distribution isunlimited.
Distribution authorized to U.S. Gov't. agenciesand their contractors;Administrative/Operational Use; JUN 1954. Otherrequests shall be referred to Office of NavalResearch, Washington, DC.
onr ltr, 26 oct 1977

HBIT^s
THIS REPORT HAS BEEN DELIMITED
ViD BEARED FOR PUBLIC RELEASE
IJKEER DOD DIRECTIVE 5200.20 AND
hO *E:.STRICTIONS ARE IMPOSED UPON
ITS USE AND DISCLOSURE,
DISTRIBUTION STATEMENT A
A^ROtfED FOR PUBLIC RELEASE;
DISTRIBUTION UNLIMITED,
w^iwwrtf^e *^mimb&)

I A % M 1
* 1 ervices Technical Information 'v„ you are requested to return this copy WHEN iT HAS SERVED
'**••**> available to other requesters. Your cooperation
OTHER DRAWINGS, SPECIFICATIONS OR OTHER DATA SR THAN IN CONNECTION WITH A DEFINITELY RELATED SRATION, THE U. S. GOVERNMENT THEREBY INCURS LIGATION WHATSOEVER; AND THE FACT THAT THE uATED, FURNISHED, OR IN ANY WAY SUPPLIED THE . OR OTHER DATA IS NOT TO BE REGARDED BY in ANY MANNER LICENSING THE HOLDER OR ANY OTHER ONv EYING ANY RIGHTS OR PERMISSION TO MANUFACTURE, /ENTION THATTKAY IN ANY WAY BE RELATED THERETO.
Reproduced by
U SERVICE CENTER UILDIK&, DAYTON, 2, OHIO
•*•£

ITiKI
CD
^ <£ Technical Report No. 6 GO
DETERMINATION of BEACH CONDITIONS by means of
AERIAL PHOTOGRAPHIC INTERPRETATION
Volume IV
The CONE PENETROMETER as an INDEX
of BEACH SUPPORTING CAPACITY (Moisture, Density and Grain-Size Relations)
Cornell University Office of Naval Research
mm

TECHNICAL REPORT NUMBER 6
DETERMINATION OP BEACH CONDITIONS
by means of
AERIAL PHOTOGRAPHIC INTERPRETATION
VOLUME IV
THE CONE PSNETROMETER
as an INDEX of
BEACH SUPPORTING CAPACITY
In connec t ion v?Itn a contract between:
Amphibious Branch, School of Civil Engineering Office of Naval Research Cornell University
U.S. Naval Photographic Interpretation Center, Monitor
Executed by the
Cornell Center for Integrated Aerial Photographic Studies
Beach Accessibility and Trafficability
Project No. NR 257 OC1
Contract N6onr, Task Order # 11
by
D. R. Lueder
D. J. Belcher, Director
June, 195^
Ithaca, New York

TECHNICAL REPORT NUMBER 6
DETERMINATION OP BEACH CONDITIONS
by means of
AERIAL PHOTOGRAPHIC INTERPRETATION
VOLUME IV
THE CONE PENETROMETER
as an INDEX of
BEACH SUPPORTING CAPACITY
In connection with a contract between:
Amphibious Branch, School of Civil Engineering Office of Naval Research Cornell University
U.S. Naval Photographic Interpretation Center, Monitor
Executed by the
Cornell Center for Integrated Aerial Photographic Studies
Beach Accessibility and Trafficability
Project No. NR 257 001
Contract N6onr, Task Order # 11
by
D. R. Lueder
D. J- Belcher, Director
June, 195^
Ithaca, New York

KEY TO TECHNICAL REPORT NUMBER 6
Technical Report Number 6 is divided into five Volumes.
The titles of the3e Volumes are as follows:
Volume I - Relations Between Beach Features
and Beach Conditions.
Volume II - Variation and Stability of Beach
Features (including an Appendix on
Wave Tank Tests).
Volume III - Photographic Gray Tones at an
Indication of the Size of Beach
Materials.
Volume IV - The Cone Penetrometer as an Index
of Beach Supporting Capacity
(Moisture, Density and Grain-Size
Relations).
Volume V - A Method for Estimating Beach
Trafficability from Aerial Photo-
graphs .

ACKNOWLEDGMENTS
The author expresses his appreciation for the coopera-
tion, aid and helpful opinions provided by Colonel J. P.
Stafford, U.S.M.C. and Major Carl Hill, U.S.M.C. both of the
Amphibious Branch, Office of Naval Research and by Mr. page
Truesdell of the Naval Photographic Interpretation Center. The
administration, establishment -• and continuance - of this
program is due in no small way to the efforts of these men.
Appreciation is extended to M. Tewfik, M. Malki, P..
Morris and J. Schrauth for their efforts in completing the
routine tests, computations and plots. Particular thanks are
due M. Tewfik for bringing to the author's attention the results
of his ;ioctorate thcL.ii: insofar as the^ apply to the subject
of this report.
Acknowledgment is due Professor Floyd 0. Slate, who
donated his time in helping to design the tests and in criti-
cally reviewing the entire manuscript.
Finally, credit belongs to Barbara Freeman for completion
of the tedious task cf report preparation and assembly.
SECTION I - INTRODUCTION 1
SECTION II - RELATIONS BETWEEN PENETRATION, DENSITY, MOISTURE CONTENT SATURATION AND GRAIN-SIZE 9
SECTION III - CONCLUSIONS 40
APPENDIX A - TEST, COMPUTATION AND ANALYSIS PROCEDURES 44
APPENDIX B - FORMULAS USED TO OBTAIN VARIOUS QUANTITIES 5°

LIST OF FIGURES
FIGURE 1 -
FIGURE 2 -
FIGURE 3 -
FIGURE 4 -
FIGURE 5 -
FIGURE 6 -
FIGURE 7 -
FIGURE 8 -
FIGURE 9 -
FIGURE 10 -
FIGURE 11 -
FIGURE 12 -
FIGURE 13 -
PERTINENT DESCRIPTIVE DATA FOR TESTED SANDS 15
RELATIONS BETWEEN PENETRATION, DENSITY & MOISTURE CONTENT, SAND WT-1 22
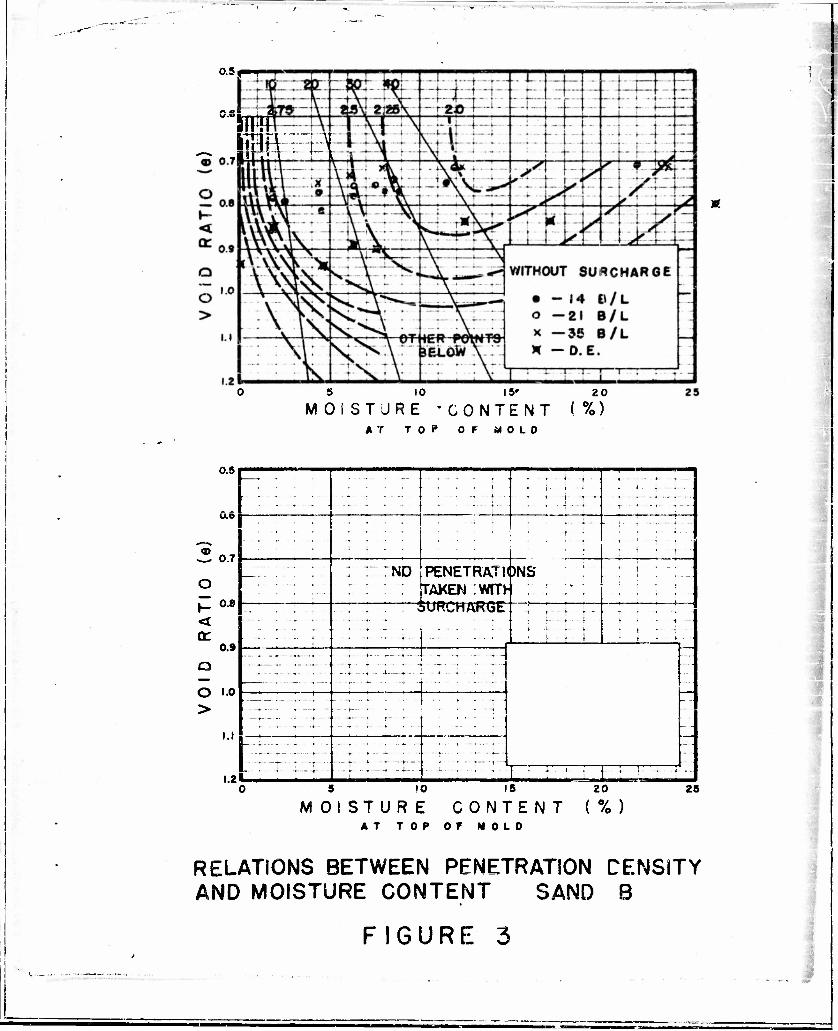
RELATIONS BETWEEN PENETRATION, DENSITY & MOISTURE CONTENT, SAND B. 23
RELATIONS BETWEEN PENETRATION, DENSITY & MOISTURE CONTENT, SAND 6. 24
RELATIONS BETWEEN PENETRATION, DENSITY & MOISTURE CONTENT, SAND WT-2 25
RELATIONS BETWEEN PENETRATION, DENSITY & MOISTURE CONTENT, SAND C. 26
RELATIONS BETWEEN PENETRATION, DENSITY & MOISTURE CONTENT, SAND F-12 2?
RELATIONS BETWEEN PENETRATION. DENSITY & MOISTURE CONTENT, SAND NJ-20 28
RELATIONS BETWEEN PENETRATION, DENSITY & MOISTURE CONTENT. SAND WT--3 29
RELATIONS BETWEEN PENETRATION, DENSITY & MOISTURE CONTENT- SAND A. 30
CURVES OF EQUAL UNCONFINED COM- PRESSIVE STRENGTH FOR DIFFERENT VALUES OF e, w and S (Taken from a Thesis by M. M. Tewfik) 31
EFFECT OF DENSITY AND GRAIN-SIZE ON PENETRATION FOR W = 7-5$ 33
EFFECT OF MOISTURE CONTENT AND GRAIN-SIZE ON PENETRATION FOR e = 0.7 36

CAUTIONARY NOTE
It is the ultimate objective of this research program to
investigate and report upon a method for estimating beach traf-
ficability by means of aerial photographic analysis. Trafflia-
bility is a tenuous term. For the purpose of this study, it has
been considered to be related to:
1. Slope of beach
2. Bearing capacity of beach
Outside factors such as vehicle types, loads and tire pressures;
driver abilities and surf conditions; and multiple pass effects
were not considered.
Two things must be emphasized. First, the trafficability
diagram appearing as Figure 2 of Volume I and mentioned there-
after, relates slope and penetration values and assigns any
given beach to one of five classes. THIS DIAGRAM IS INDICATIVE
ONLY AND SHOULD NOT BE USED WITHOUT VERIFICATION OR MODIFICATION
IN THE LIGHT OF CURRENT OPERATIONAL TECHNIQUES.
Secondly, the index of beach sand bearing capacity chosen
by the authors for use in this investigation was constant weight
penetration. The authors believe this to be a reasonable and
acceptable index.** However, THE SIGNIFICANCE OF THE INDEX WITH
R2SPECT TO ACTUAL OPERATIONS MUST BE EVALUATED BY USING AGENCIES.
These statements emphasize the necessity for studies which
will correlate penetrations with operating conditions. Only by
this means can the research results discussed in Technical Report
#6 by utilized to their fullest extent. "* See Progress Report #1, "Relations Between Beach Features
Visible on Airphotos and Beach Trafficability". ** See Volume IV (Key).
LIST OF ABBREVIATIONS
AFS - Average foreshore slope (See Appendix A)
APR - Average penetration reading
Bs - Backshore
3 - Divergence (See Figure 10)
DCQ ~ Median grain-size (See Figure 10 and Appendix A)
Deo Dc0 - Decimal median grain-size (See Figure 10)
DFs - Drying foreshore
Fs - Foreshore
Fs MSLW - Foreshore mean-sea-lcvel width (See Figure 9h
and Appendix A)
PR - Penetration readings
WFs - Wetted foreshore

SECTION I
INTRODUCTION
I
-1-

SCOPE OF VOLUME
This volume is concerned with the factual aspects of one
subdivision of a current research project conducted for the
Amphibious Branch, Office of Naval Research. It describes the
results obtained from a 3eries of laboratory tests designed to
indicate the relations between constant weight penetration,
moisture content, density and median grain-size of selected
beach sands.
A series of conclusions appears as SECTION III. The
conclusions are based on the data, analyses and discussions
included herein. Consequently, they represent the specific
conclusions of the report - not conclusions of the complete
research program.
Final conclusions of the complete research program will
be limited ir: nature. Only those factual aspects that are per
tinent to the ultimate objectives of the program will appear.
These will be included in Volume V.
SPECIFIC OBJECTIVE OF VOLUME
The primary objective of this Volume, as mentioned in
SCOPE, is the study of relations between constant weight pene-
tration, moisture content, density and median grain-size of
beach sandB. More specifically, its purpose is to show - in
general - whether constant weight penetration provides a usable
index of the supporting capacity of beach sands.
•3-

ULTIMATE OBJECTIVES OF
COMPLETE RESEARCH PROGRAM
The ultimate objectives of the complete research program
are:
1. The presentation of relations between physical
features (visible on aerial photographs) that
are associated with beache3, and the traffica- #
biiity of beaches,
2. The formulation, based upon such relations, of
a method for estimating the trafficability
conditions of beaches from aerial photographs.
* See CAUTIONARY NOTE
-4- i

1
PROBLEMS OP RESEARCH
There are numerous features associated with beaches that
may have some relation to trafficability and that can also be
seen on aerial photographs. These are:
1. Details of beach profile (width, slope, cusps,
scarps)
2. Wave and surf features (length, frequency,
shape, direction, refraction, breaker patterns)
3. Gray tones (beach sands, moisture holding cap-
acity, turbidity stain3, depth differences)
k. Environmental features (offshore and onshore
protection, river mouths, sources of Bupply,
indications of littoral current flow)
5. Miscellaneous features (current ripples, bars)
These features, as well as trafficability itself, reflect
the interaction of numerous variables. The variables are:
1. First order variablee (independent)
a. Location and variations in winds
b. Env ir onnsent
(1) Protective underwater features
(2) Protective surface features
(3) River and tidal mouths
(k) Littoral currents
(5) Geological sources and types of
materials that contribute to beach
-5-

(5) General offshore slope
c. Tides
2. Second order variables (dependent upon first
order)
a. Wave characteristics and variations
3. Third order variables (dependent upon first and
second order)
a. Variations in local offshore slopes, bars
and locaX material supplies.
None of these variables can be controlled by any normal
means. Few can be evaluated easily by instrumental devices.
Consequently, it is difficult to relate specific beach features
to the variable or combination of variables that produce them.
To satisfy the practical requirements of the project, it was
decided to subordinate the relations between beach features and
their causative variables and to emphasize direct relations
between features and trafficability conditions.
-6-

SCHEME OF COMPLETE RESEARCH PROGRAM (CURRENT)
The current program was subdivided into various separate
activities. This was done in an attempt to circumvent some of
the difficulties previously discussed by varying the direction
of attack.
The subdivisions established were as follows:*
1. Routine Beach Observations
The collection of routine observations at permanent
beach stations for a ^e'taonnble period of time.
This phaae was designed to give information con-
cerning the changes of beach features and conditions
on beaches of various types over a period of time.
This phase, since it was concerned with time, was
expected to throw some light on the relative impor-
tance of causative variables such as waves, material
characteristics, etc.
2. Empirical Beach Survey
The collection and analysis of Information concerning
the physical and penetrometer profiles and the
sand characteristics of various beaches picked at
random. This phase, since it neglected time, waves
and environment, was designed to provide relations
between visible features and trafficsbility condi-
tions regardless of any causative variable except
beach materials.
See Key at beginning of this Volume.
-7-

3. PENETRATION - COMPACTION STUDIES (SUBJECT OP THIS
REPORT)
A SMALL LABORATORY STUDY OP THE RELATIONS BETWEEN
PENETROMETER READINGS, COMPACTION AND GRAIN CHAR-
ACTERISTICS.
4. Wave Tank Investigation
A small investigation of general relations between
slope, slope variations and relative stability as
affected by changes in the characteristics of waves
acting upon materials of different grain-size.
5« Gray Tone Studies
A densitometric study of gray tones on the beach
as indicators of predominant size? of beach mater-
ials and their relative firmness.
Each of these subdivisions will be treated in subsequent reports.
-8-

SECTION II
RELATIONS BETWEEN PENETPATION, DENSITY,
MOISTURE CONTENT SATURATION AND GRAIN-SIZE
-9-
GENERAL
As emphasized in the CAUTIONARY NOTE, the primary objec-
tive of the current research program is the estimation, from
aerial photographs, of the capacity of beach sands to support
vehicle movement.
Other parts of Technical Report Number 6 relate physical
beach features that are visible on aerial photographs to an
index of this capacity. The index chosen for the study ie
penetration (taken with a constant weight penetrometsr).
It is the purpose of this section of this report to show
that, i_n general, penetration is truly an index of this capa-
city. It is not the purpose of the report to present a detailed
mathematical-empirical analysis of constant weight penetration
as an indicator of the various factors which are incorporated
in the capacity of beach sands to support vehicle movement.
Such an objective would require a separate research program of
a fairly ambitious nature.
The capacity to support vehicle movement implies the
combined effect of:
1. Bearing capacity of the beach sand
2. Tractive capacity of the beach sand
3. Rolling resistence of the beach sand
See Key at front of report See Technical Report Number 5* "The Uae of Penetration Devices on Beaehes", March 1952.
-10-

Bearing capacity may be defined as the "largest intensity
of pressure which may toe applied —(by a tire or track)— to
the soil without causing excessive settlement or danger of
•I * failure to the soil in shear .
Tractive capacity may be defined as the sum of average
horizontal passive resistance and frictional force that is
developed by the soil in reaction to the horizontal components
of tread traction - and which enables tread traction to propel
a vehicle.
Rolling resistance may be defined as the sum of complex
passive and frictional resistance to displacement, in excess
of densification, that is developed by a soil in front of a **
wheel whose treads are lower than the surrounding soil surface.
It can be shown that each of the above capacities is
related to the shearing strength of the soli. Consequently, it
is the purpose of this section to demonstrate that penetration ###
is related to the shearing strength of the soil=
The major criteria of soil strength are called "cohesion"
and "internal friction". Cohesion expresses the resistance to
shear afforded by the intrinsic pressure that exists within a
soil mass by virtue of:
* Taylor, D.W., Fundamentals oinSoll Mechanics, John Wiley & Sons, 19A8.
** The implication of these terms is described at some length in Manual of Amphibious Oceanography, Section V, ''Beach TraffieabiTity and stabilization", tfniver. of Calif., 1952.
*** Because of budget limitations, it was not feasible to correlate penetration and shear strength (by means of direct or triaxial shear tests).
-11-

1. Complex physico-chemical bond (true cohesion)
2. Capillary physico-chemical bond (apparent
cohesion)
Sands may be assumed to have no true cohesion, but may have
considerable apparent cohasion due to the capillary bond. The
capillary bond depends upon the amount of moisture within the
soil pores, i.e., it is a function of moisture content, grain-
size distribution, and grain-shape distribution.
Internal friction expresses the combined physical resis-
tance to shear that is afforded by the tendency of individual
grains of the soil mass to resist roiling and sliding and the
effect of interlocking between such individual grains. It is
largely a function of density, grain-size distribution and grain
shape distribution (plus applied load).
In view of the above discussion it may be said that the
shearing strength of beach sands mr:y be expressed in terms of
apparent cohesion and internal friction, and that these factors
may be expressed in terms of:
* In many~tioil mechanics theories, strength due to apparent " cohesion la neglected due to its transitory nature. On the drying foreshore of beaches, it may be expected to provide an amount of shearing strength which varies from a maximum at a certain moisture content to minimums at some other moisture contents. At its maximum, the apparent cohesion may be expected to provide a significant amount of shearing strength.
-12-

* 1. Density of the sand
» 2. Moisture content of the sand
3. Grain characteristics of the sand
a. Size-distribution
b. Shape-distribution
Consequently, it beooroes the purpose of this section to
show, in a general way, that penetrations reflect, to a signi-
ficant extent, significant variations in the density, moisture
content and grain characteristics of beach sands. If this can
be shown, then it can be presumed that penetrations reflect
variations in the shearing strength of beach sands — and in
consequence, that penetrations provide a usable index of the
capacity of beach sands to support wheel loads without excessive
deformation, i.e., an important element of beach "trafficability!
where
For example, Taylor's modification of Prandtl's analysis for a long strip footing:
<u -(sb + ^(v""" * -l) qu » ultimate bearing capacity c m cohesion of soil w o weight of soil (density) b " width of footing p •» angle off Internal friction of soil (a function
off "grain characteristics, "density and normally applied load)
Kp « 1 + sin 0 1 - sin 0
K,TT« constants
-13-

MOISTURE-DENSITY-PENETRATION RELATIONS
FOR VARIOUS SANDS
The following pages ar« concerned with actual relations.,
as determined by laboratory test, between the following
quantities:
1. Penetration (PR)
2. Density (in terms of void ratio, e)
3. Moisture content (w)
4. Degree of saturation (S)
5. Median grain-size of sand (D50)
These Quantities are defined bv formula in Appsndix 5=
The complete method of laboratory testing appears as Appendix A.
Nine sands (7 from actual beaches and 2 from non-beach
deposits) were tested. Pertinent descriptive data for these
sands is given in Figure 1.
The laboratory relations between the above factors, for
all of the tested sands, are presented graphically in Figures
2 to 10. The figures ere arranged in order of increasing median
grain-size, relations for the finest sand appearing in Figure 2
and the coarsest in Figure 10. The plots are designed to show
simultaneous values of PR, e, w and 1 for each sand.
Values of the moisture content (wta)» plotted along the
horizontal axis, refer to moisture contents at the top of the
mold- The values of "PR" refer to penetrations at the top of
-14-

«9. CM
UNIFORMITY COEFFiCsENT
—r i
• - m •1
—1 10 s
—T
v<i CM
—T
ire <0
—T t
EFFECTIVE SIZE mm.
10 ro •
O i in a • o
« O C\J
9
MEDIAN SIZE mm. 6
«o 10 6
5; 8 •9 3 8
3 • o
SANO < o • *
M > 1-
io
* V 1 • -» z
CO
s "o'
CO o z <
O UJ h- (0 UJ H
CC o
- <
< o UJ M CO
< QC O
I
UJ Q: z> o u.
i
o 1H9I3M *q H3NU %

the mold. The values of "e" refer to the presumed* void ratio
at the tog of the mold. The values of "S" are based upon the
moisture content at the top in relation to the presumed void
ratio at the top.
The plots for each sand consist of one involving penetra-
tions taken with no surcharge on top of the sand and one invol-
ving penetrations with an annular surcharge surrounding the
point of penetration. The reason for this double plot will be
discussed later.
The ranges of values included on each plot exceed the
field ranges. The field ranges include 9056 of the actual
moisture contents, void ratios and median grain-sizes actually
xound in the survey of Atlantic Coast beaches. The actual
values 8re given in Table I.
"* The value of ''e" depends upon the value of "w" chosen for its computation. The value of ' w" used in this study was the average moisture content in the mold computed according to Simpson's Rule for 3- While the moisture between the top and middle of the mold may vary appreciably (and not uniformly), particularly for coarse sands, there is no reason to believe that the void ratio will vary propor- tionally. Assuming no appreciable grain segregation with depth, the only two things that would tend to cause a var- iation in voids from top to bottom would be the effect of moisture drawn down or the effect of ncn-uniform compactive effort on the multiple layers in the mold. The first factor may be disregarded. The second factor may be expected to have an effect, such that the middle and top layers are slightly more dense than the top. In this study, the dif- ference was assumed negligible largely because no method of determining actual differences was available.
** Part I in Key at fvont of report.
16-

TABLE I
ACTUAL FIELD RANGES OP VARIOUS PERTINENT FACTORS
Type Sand
Arbitrary Size Limits
(mm)
D50 (ram)
r- — •
Void ratio Moisture (e) (*)
Satur- ation (*)
Fine 0.1-0.2 0.13-0.2 0.60-0.90 2-25 10-95
Medium (fine) 0.2-0.3 0.2-0.3 0.65-0,85 2-25 10-90
Medium (coarse) 0.3-0.5 0.3-0.5 0.70-0.75 2-10 5-25
Coarae L 0.5-1.0 0.5-0.66 0.50-0.75 2-8 5-25
Figures 2 to 10 show that all of the test sands tend to
have a similar characteristic plot. For any given sample, there
is an infinite number of moisture-density combinations that
will yield a given penetration, the lines of combinations fol-
lowing a generally similar geometrical pattern. Ths general
shape of this apttern apparently transcends grain-size.
It is necessary to emphasize that the lines of equal PR
represent the center of narrow zones rather than lines of mutual
exclusion.
It is interesting to note the similarity between Figures
2 to 10 and 11. This latter figure is copied from a PhD theslB
by Dr. Mohammed Mohsen Tewfik and, for a Dunkirk silty clay,
shews the coincident values of void ratio, moisture content,
degree of saturation and unconflned compreselve strength.
» The Strength of a Clay as a FuncETon of its Density Charac- teristics and^egree of"'5a"Euration, Sc~HooT~of dlvll Engine- ering, Cornell University, 195:T
-17-

The obvious similarity between Figures 2 to 10 and 11
supplies the basis for the following statements:
1. There may be a similarity between the uncon-
fined compreaeive strength of cohesive soils
and the penetration of cohesionless sands.
2. Penetration may be an index to the shearing
(unconfined compressive) strength of cohesive
soils.
3. Penetration may be an index to the shearing
strength of sands.
4. The moisture-density-shear strength relation-
ships of cohesive and cohesionless soils may
be analagous in general.
5. Lines of equal shearing strength (cohesive
soils) and penetration (cohesionless soils)
result from »n infinite number of moisture-
density combinations, not from a single
combination for any desired strength.
Considering these statements in turn:
1. The acceptance of statement 1 is based merely upon an
acceptance of Figures 2 to 11 as true representations of rela-
tions between the several factors under laboratory conditions.
Objections might be raised due to the extrapolation of some of
the curves. There is no special justification for such extra-
polation beyond the usual reasons:
-18-
i
:

a. An indicated trend in terms of other tests
and in terms of scattered points within the
same test
b. Best fit of the plotted data
c. Reasonable extension of observed experience
Some of the plots (Sands C and P-12) include a substan-
tial number of points which do not agree with the indicated
lines. In P-12, the discrepancies are confined to one compac-
tive effort (dropping on edges). In view of the other consis-
tencies in this test, this series is presumed to be in error.
The discrepancies of sand C are not easily explained. They may
have been caused by less than usual care in taking penetrations.
It is also pointed out, as before, that if the lines be consid-
ered the center of zones, the discrepancies appear less serious.
2. This statement follows from en acceptance of state-
ment 1. However, there is other supporting evidence. In a
bulletin issued in 1948 by the Corps of Engineers , the conclu-
sions include the following statement*.
"The numerical value of the cone index is roughly four times that of the uncon- fined compressive strength except for moisture contents below about the plastic limit.''
"Trafficabllity of Soils - Laboratory Tests To Determine Effects of Moisture Content and Density Variations", Technical Memorandum No. 3-240. First Supplement, Waterways Experiment Station, Corps of Engineers, March 1948.
-19-

The testa to which this statement refers were made on cohesive
soils only (unconfined compression being impossible for cone-
sionless soils) and were made with a much smaller cone
{1 in2 projected area, 2.1 inches high, versus 7.07 in2, 8.5
inches high for the constant weight instrument). Since the
unconfined compression is a measure of shearing strength
(particularly for clays), statement 2 appears acceptable.
3. This statement follows from an acceptance of 1 and 2.
It has little corroborative evidence beyond that of the simil-
arity among Figures 2 to 10 and Pigure 11. Although this sim-
ilarity is significant, the subject will be treated at greater
length in following pages by considering the relationship bet-
ween penetration and density, moisture and grain-size. The
publication referred to above showed a correlation between cone
index and CBR even for non-plastic soils. Consequently, a
correlation between cone index and shearing strength may be
inferred. It is unfortunate that the tests conducted by the
Engineers did not include any direct data on the shearing
strength cf non-plastic soils.
4. This statement follows from the preceding statements
and appears rational from an experience standpoint. The words
"in general" are important. Cohesive soils possess true co-
hesion. Cohesionless soils do not (although they may have
apparent cohesion that cannot be neglected in the usual manner).
Therefore, it may be expected that the relationships are not
-20-

Identical or even parallel. The similarity of Figures 2 to 10
and 11, as well as considerations of density and moisture
in general, indicate that chis statement is correct.
5. This statement follows from the preceding statements.
It is included to emphasize the indications that strength
results from a variable combination of density and moisture
content and not from a single combination (maximum density at
optimum moisture, for example)*.
Some authors have expressed an opinion to the effect that
penetrations might not prove to be a valid index of beach sand
supporting capacity because they measured the sand in an uncon-
flned state. They argued that a wheel, by exerting a confining
effect upon the sand, increased 5**3 shearing strength appreci-
ably.
To investigate the effect of surface confinement upon tne
penetrations obtained in beach sands, 8 series of tests was
completed using a CBR annular surcharge. The results of these
tests, included in Figures 2, 4, 5, 7 and 8 show that for any
given moisture-density combination, the penetration %fa& lower
with a surcharge than without, i^e., the sheering strength was
greater. However, the use of the surcharge had little effect
upon the general nature of the pattern and consequently, little
effect upon the use of penetrations as a valid index of sup-
porting capacity.
* For some interesting data on this subject, see "Some Rela- tionships Between Density and Stability of Subgrade Soils", Seed, H.B. and Monlsmith, C.L., Proceedings, Highway Research Board, 1953.
-21-
i

I
WITHOUT SURCHARGE • 56 B/L X 35 0/L 0 21 B/L • 14 B/L £ 2 MIN V/L A 30 SEC V/L • 8!0 E B/L
10 16 20
MOISTURE 'CONTENT (%) AT TOP 0^ MOLD
25
0.S
0.6
Jr. o.?
< a:
o.a
0.9
O i& >
S.I
l.Z
-t—1—I- -X
Ft an j T_
10 I
WITH SURCHARGE
• Zi Sy'L « 56 B/L X 35 B/L • 14 B/L A 2 V/L Q 40 SB/L
»JWV i 16 to
MOISTURE CONTENT (%) AT TOP Of MOLD
28
•j
RELATIONS BETWEEN PENETRATION DENSITY AND MOISTURE CONTENT SAND WT-1
FIGURE 2 1
;•
0.5 j—r
0 5 10 15' 2 0
MOISTURE 'CONTENT (%) AT TO? OF MOLD
0.5
9 •3 0.7
0.8
<
0.9
O io >
I.!
1.2
- -- 1 • —
f • - • t- V
' ; I ; 1 ..; _ r.,"".;
— . ; : :ND PENETRATI TAKEN :wm
ONS i • - •
^URCHARGEI
1 i i ' t • •!
• i • •
.-»...,. i -• -• .
,
-.(-... -; • • ;
— *-— - • * * -
. ... ... 1 4 _-,.-_.
. .... ! - .]_.
1 , 1 . . i. . , . . . . , . |. | ; . .i
5 !0 15 20
MOISTURE CONTENT (%) AT TOP Of MOLD
25
RELATIONS BETWEEN PENETRATION DENSITY AND MOISTURE CONTENT SAND 8
FIGURE 3 *

0.8
5 iO
MOISTURE 'CONTENT v /«, > AT TnP OF MOLD
0.5 f
0.5
<
O >
IB CO
MOISTURE CONTENT (%) AT TOP Of MOLD
*b
RELATIONS BETWEEN PENETRATION DENSITY AND MOISTURE CONTENT SAND 6
FIGURE 4

IS 20
MOISTURE "CONTENT (%) AT TOP OF WOLD
0.!
0.t
a> —.. OJ
O
< a:
t QA ttr«* o.»
O i.o >
I.I
I.Z
2.25:
20 r**— -•
\*_ • :
!.?5
-r-r--:y-
-v
*s
:• M
-3 : ,33J
-- u
. I
-I -1_ I f- tr--
->o • \
-A-
WITH SURCHARGE
D 56 B L X 35 B L i 21 BL o 14 B L A 2* V L
9 10 IS 20
MOISTURE CONTENT (%) AT TOP Cf MOLD
t i —i
25
RELATIONS BETWEEN PENETRATION DENSITY AND MOISTURE CONTENT SAND WT-2
FIGURE 5

0.5
0.6 3.5 ;3.o ;z;5 ; /as
2 0.8
<
o >
0.9
1.0
I.I
1.2
iv\'_ \ \:...: v Ay A\
V *
"S
:°r
V->v. 7 • /
SATURATIONS
-
4--I'- i-
•-r- i
34
-4-— E:
.4...
-1
WITHOUT SURCHARGE
• -14 o-2l x -35 K-D.E
B/L B/L B/L
•L T3I ft a M
3 10
OiSTURE AT TOP
•CON 0 F
18
TENT MOLD
20
(%)
25
0.5 r
as
3 0.7
0.8
< a:
o.»
>
i.i
S.2
-1 h
T*
-r—|~t- .1 • I '
IT _i—.__>_
-•—f.
-1—1—1~
:TTT r—+
r - 4-
: -1
atrr-TT -4-—I- I •
FH~H
tTl^Jip PENETRATION^ T : TAKEN ; WITH
SURCHARGE:
^.3ffi 1 +. __.., u
_,.._t_.., .___4 r-t—t- -+—r—'---\
it "Tin ±-±-r-
HE; —I—1—f..
t
EH
.»,— r-TTT 3 10 15 20
MOISTURE CONTENT {%) AT T0!» OF MOLD
25
RELATIONS BETWEEN PENETRATION DENSiT AND MOISTURE CONTENT SAND C
r 10URC. ^

0.5
9 10 IS 20
MOISTURE 'CONTENT (%) AT TOP OF MOLD
9 10 15 20
MOISTURE CONTENT (%) AT TOP OP MOLD
RELATIONS BETWEEN PENETRATION DENSITY AND MOISTURE CONTENT SAND F - 12
FIGURE 7

0.5
18 20
MOISTURE -CONTENT (%) AT TOP OF MOLD
0.5
0.6
CD 3 0.7
0.8
<
0.9
O to >
I.I
1.2
ionics £5 v 5 XX o
o
r± _i_
Tzp-T
=4-
• l»-
H- .._,. -r--T-~f
-i-i ±:
—t-
::_L". •hf t~"
.... -4 -
-i k
T~T 4-
~f
\~\-\- I i I i
=£=£
:=T -*—f
FTH
4-4 - -, -j- -l 1 .
I «o.
t ! -I—T-
+ •
-I L
t-rl-T.:t:-t- WITH SURCHARGE
14 B/L - 2i S/L - 35 B/L . O.E.
o
X
K
t""T --T "I rprr: 5 10 IS »•>
MOISTURE CONTENT (%) AT TOP OF MOLD
25
RELATIONS BETWEEN PENETRATION DENSITY AND MOISTURE CONTENT SAND NJ-20
FIGURE 8

3.25 30 2.75
A, A -ft- 3^ **-• >*"
?x! t
i— WITHOUT SURCHARGE
a 56 B/L X 35 13/L o 21 B/L • 14 B/L A 2 MIN V/L A 30 SEC V/L a SIDE S/L
5 10 15
MOISTURE "CONTENT AT TOP OF MOLD
20 / o/ \ V 'O I
25
n ... . - }
f f- f 4- -
3> , ,
NO PENETF TAKFN
AT10NS W|TH
t i | 4 |.._|—
o {T. 0.8 < or
' • SURCHAI RGE : i 'I"!"-
! • • t
1 !
: i ! I i- m ....
O.'i
a
o io >
-',— ... -
•
1 ' ' ' '
'
1.2 ^* ...,..+...,.; : • . t-+—! I -t- * .._
5 10 15 20
MOISTURE CONTENT (%) AT TOP OF MOLD
25
RELATIONS BETWEEN PENETRATION DENSITY AND MOISTURE CONTENT SAND WT~3
h IbUKt

0.5
0.6
<D 0.7
2o.8 »- < cc 0.9
o
o >
1.0
I.I
1.2
3£ T 30 -a—•—;—k
9 **; %d-f-r t"
--r-—-jHy
rfct=t£ ±1 -1-
—
H (•-
zzprn:
= =t
T4-4—
~h-t-
+—i 4 —i—
-4-
JL -r- •-•. 4-,-K
~-4^t
.... L .....
-i—h
_4. _+.'...._(_
• --
(- \ ±t -1—r
4—4-
•+•-
X
fc<
^C 1
:a: ^w WITHOUT SURCHARGE
• -14 B/L^ c -21 B/L x -35 B/L X-O.E.
£B^E2-3. 5 10 16 20
MOISTURE 'CONTENT ( %) AT TOP OP MOLD
29
O.B _ i. i- . j i
1 • 1 f t
1
. I...: i i I 1 1 ,_ .J p [ | - ~M -4—, I
* J"* —».-- - L • 1-|- —1 . i
""""" 1 . i
PENETF A IN s$^ —i
o j | 7.1« T . ] AKc N Will
•
l_ OJ 1 1 i , i 1 1 1 i - -t- '- illfiC! Jfl, AlSE T
1 ! ^ .>. —
| 1 ^ 1 : , a: |_ 4 l ' "I ' f *— —f- _
—
a* -4-f- —i 1 • r i L_ G i 1
mm*
O io —1—i—i—1— t-4 ?> ill —• ... i_ i—, —1 »—
—I—4 - i i i 1 ' . , i 1 1 i I ; i i i i ! L
" 1—' —i— 4—<— 1.2 —f 1 . i——\— ^ P' ; ! ' !
5 io :s
MOISTURE CONTENT AT TOP OF MOLD
20
(% 2»
RELATIONS BETWEEN PENETRATION DENSITY AND MOISTURE CONTENT SAND A
FIGURE 10

OtlVki QIOA

RELATIVE EFFECT OF
DENSITY AND MOISTURE ON PENETRATION
Figures 2 to 10 show that penetration .does vary In rej3~
ponse to density, moisture and grain changes. They also show
that the relative amount cf variation, for a given sample,
depends upon the value of moisture or density that is chosen
constant.
Because of the inter-relation between density, moisture
and grain-size, a complete detailed evaluation of their relative
influence on penetration is exceptionally tedious -- and beyond
the scope of this report. Instead of such an evaluation, the
report is concerned with general conclusions regarding such
influence.
These general conclusions are discussed in the following
pages.
Effect of Density and Median Grain-Size
With w = 1.5%
Figure 12 shows the variation of penetration with density,
using a moisture content of 7-5%, for the entire field range of
median grain-sizes. A value of w « 7-5$ was selected for two
reasons::
1, It is within, or close to, both the field a.,d
laboratory ranges for all samples.
2. It is midway between the moisture extremes
associated with minimum penetration for all
-32-

1.0
«t
•8
-7
I 1—1
2.75 3.0 3.25 3.3
2.26 \ x x \
\ \ v \ K s /
I N
FIELD RANGE LI^IT U
C
\
UJ M 3
< *
<
Q UJ
"!.75
1.9
~l.2=
.05 as
\
sV I N \ i x \
L \ \ \
-T».-
\ \ \ \ \ I
1 \ ', i
& y / I
/i t
• LABORATORY SAMPLES
+ FIELD SAMPLES
O/
0.8 0.9
VOID RATIO i.o ;,;
MGURF 12 EFFECT of DENSITY and GRAIN SIZE
on PENETRATION for w = 75%

samples, i.e., it is close to an everage
moisture content of presumed maximum shear
strength for all median grain-sizes.
The degree of symmetry displayed by Figure 12 is surpris-
ing. It is true that the diagram was made with a considerable
amount of extrapolation and that approximately £5$ of the points
do not fall near the proper line3. However, few of the points
diverge from the lines by more that 1/4 inch of penetration
and only three (2 from the field) diverge in excess of 1/2 inch.
The symmetry is more surprising in view of the following facts:
1. The laboratory samples have uniformity coef-
ficients ranging v tween 1.22 and 2.03 (sec
Figure 1) and a similar variety of gradations.
2. The samples have a variation in grain shape
v*« -*- KJ v* -kfcSMW.*.W4AhJ*
3« Both laboratory (45) and field (9) points
were plotted.
4. The field points included moisture contents
that varied between 6.5$ and 8.0$ rather
than the constant ?.5%«
5. The various laboratory samples were tested by
several different groups of people with con-
sequent slight differences in technique and
results.
-34-

6. The diagram was derived from Figures 2 to 10
which in themselves insure a certain amount
of divergence.
?. Penetrometer readings for the first series
of samples and for the field points were read
to the nearest 1/4 inch only.
8. The lines may be considered as the center
of aones.
Since Figure 12, subject to all the discrepancies indi-
cated by this series of variation factors, still maintains a
sreat degree of symmetry and also reproduces experience in moat
of its areas, it is presumed to be generally correct (for
w = 7.5$).
Effect of Moisture and Median Grain-Size
with e * 0.7
Figure 13 shows the variation of penetration with moisture
(e • 0.7) for the entire field range of median grain-sizes. A
figure of e =• 0.. 7 was selected because it was within, or close
to, both the field and laboratory ranges for ail samples.
Unlike Figure 12, the pattern is asymmetrical. There are also
more discrepancies. Nevertheless, there is a definite general
order in the data (whose collection was subject to many of the
variation factors listed for w = 7.5$) and the pattern fits the
data in general. There is some reason to believe that a more
symmetrical diagram would be better reconciled with experience.
However, the data of these tests does not fit such a pattern.
-35-

MOISTURE CONTENT AT
SURFACE (.%>
FIGURE 13 EFFECT of MOISTURE CONTENT and GRAIN SIZE on PENETRATION for e^OJ

General statements Regarding the Relative
Effects of Penalty and Moisture Content on Penetration
for Sands of Various Median Grain-Size
As mentioned previously, due to the inter-relation of the
various factors involved, a detailed evaluation of their rela-
tive effects on penetration would be exceptionally tedious.
It would be necessary to construct Figure 12 for a series of
moisture contents between zero and twenty-five. It would be
necessary to construct Figure 13 f°~ a series of void ratios
between 0.6 and 0.9. Even then, the results would involve three
independent variables, and it would be difficult lo present them
without resorting to tables or equations.
In the next f*v? pages, a number of general statements are
listed. Because of the difficulties mentioned above, the quan-
titative statements are limited to the conditions of Figures 12
and 13, the remaining statements being qualitative and based
upon an examination of Figures 2 to 11=
For w - 7.5% within the range e = 0.6 to 0.9:
1. The effect of density on penetration is quite
pronounced Tor the finer median sand sizes,
beginning to decrease as sizes approach the
medium range.
2. The effect continues to decrease until a size
of 0,25mm is reached remaining constant to
0.30mm.
-37-

3. Beyond 0.30mm, the effect of density increases
constantly (at least until size 0.72mm, the
limit of the tests).
For e - 0.7 within the range w = 0 to 25$:
1. For fine sands and medium sands up to the 0.3mm
size, the effect of moisture variation on
penetration is relatively constant at a fairly
high value.
2. For medium sands beyond 0.3mm and coarse sands,
the effect decreases only slightly (assuming
that moistures above 10$ are obtainable =- a
dubious possibility).
3. Recognizing that the moisture contents for
coarse sands are either very low or near sat-
uration, the practical effect of moisture on
penetration is appreciably less.
4. For all sands, the effect of moisture on
penetration remains at a fairly high level,
particularly in the dry (0-5$) and very wet,
(22-25#) areas.
5. The effects of moisture are particularly
important in fine sands and lea3t important
in coarse sands.
An examination of ail the Figures in this report leads to
a number of additional general statements regarding the relative
effects of moisture and density on penetration:
-38-

1. Both moisture and density appreciably
affect penetration in sands throughout
the entire range of median grain-sizes.
2. For any given density, minimum penetrations
in fine sands tend to be associated with
moistures of 10$ to 15$ (S - 30-50$) in
medium and coarse sands with moistures of
5% to 1C% (s = 20-40$). (Figures 2 to 5).
3. Because of the relatively small range of
moisture obtainable with coarse sands, the
effects of moisture are not as important as
with fine sands.
4. As sands become denser, lines of equal pene-
tration seem to be associated with lines of
constant saturation. (Figures 2 to 10).
-39-

SECTION III
CONCLUSIONS
-40-

GENERAL
The following conclusions are baseS primarily upon the
results of tests described in this report. They also reflect
the author's experience gained by participating in other phases
of beach research. Only those major conclusions are included
that are believed to be of practical value in using the other
parts of this report.
In listing the conclusions, it is assumed (as described
in preceding pages) that the capacity of beach sands to support
wheel loads without excessive deformation is related to the
shearing strength of the beach sands. In turn, it is assumed
that the shearing strength is a function of the combined effect
of moisture, density and grain characteristics.
-41-

CONCLUSIONS
1. Constant weight penetration is appreciably affected by
variations in both density and moisture for sands of all
median grain-sizes.
2 = The amount of penetration is a function of the moisture,
density and grain characteristics acting around the locale
of penetration. Consequently, for sands in general,, there
are an infinite number of moisture-density-grain combina-
tions and -- for a given sand — an infinite number of
moisture-density combinations tnat will yield the same
penetration.
3. Bp<"ause the constant wexght penetrometer does reflect the
combined effect of moisture, density and median grain-size,
1* i£ * valid instrument for measuring an index of the
capacity of beach Bands to support wheel loads without
excessive deformation. In view of its many advantages, it
appears to be a highly useful instrument for this purpose.
4. Because of the infinitude of moisture-density-grain combin-
ations, the difficulty of evaluating single penetration
readings Is apparent. Unless data is available concerning
moisture, density, grain characteristics -- or secondarily,
slope or width — it is possible to come to the erroneous
conclusion that single penetrations are excessively erratic.
This conclusion is the result of insufficient data rather
than inaccurate measurement. Consequently, although some
-42-

erratic penetration readings may be expected, particularly
in very dry, very wet or coarse sands, the assumption of
excessive erraticism appears unfounded.
6. For the range of median grain-sizes commonly occurring on
sand beaches, moisture changes tend to have a greater effect
on penetration than density changes. This Is particularly
true for fine sands and is least true for coarse sands.
7. Density changes are most effective in the coarser sand
sizes.
8. Some of the conclusions of VOLUME I*, to the effect that low
penetrations are associated with fine grain-sizes and high
penetrations with coarse sizes, are corroborated by the data
of these teats,
9. There are indications that materials smaller than fine sands
would yield constent-weight penetrations having the same
order of magnitude and pattern of variation as medium and
coarse sands.
10. Penetrations of all sands at saturations greater than 9Qjd
are likely to be greater than 2.5 inches, but less than 3-75
inches. In general, the penetrations of the finer, highly
saturated sands will be slightly lower than those of coarser
highly saturated sands. A certain amount of erraticism may
aleo be expected. ^^— • • •!•- • •• • I !• •-•— > I I • - HI I -. .. I — •••- I — M ... I.ll. — •!•••• • •• I I ll I
"Sss KEY following Title Page.
-43-

APPENDIX A
TEST, COMPUTATION
AND ANALYSIS PROCEDURES
•44-

TEST PROCEDURES
The test apparatue was eaaentialiy an oversized Proctor
mold (base, main cylinder and collar), with an oversized hammer
and hammer guide.
Each sample was tested in the following manner:
1. The mold was filled 1/3 full (2") from a 50 lb.
mixed and quartered atock pile to which had
been added an amount of moisture necessary to
bring the percentage of moisture to a desired
figure (0, 3, 6, 9, 12, 15, 18 and 20# were
the successive goals in every test aeries).
2. The layer of sand was compacted, The method of
compaction depended upon the test that was
being rur (see Figures 2 to 10). The following
methods were used*.
a. Loose (sand poured from a slight elevation).
b. Dropped on edges (twice per layer from an
elevation of 6" at an angle of «*5°-60°).
c. Ik blows/layer (rotating the meld).
d. 21 tlows/layer (rotating the mold).
e. 35 blows/layer (rotating the meld).
f. 10 h<..:nmer blows/layer on the outside of
the mold (rotating the mold).
g. 30 seconds vibration/layer with a concrete
vibrator.
• 45-
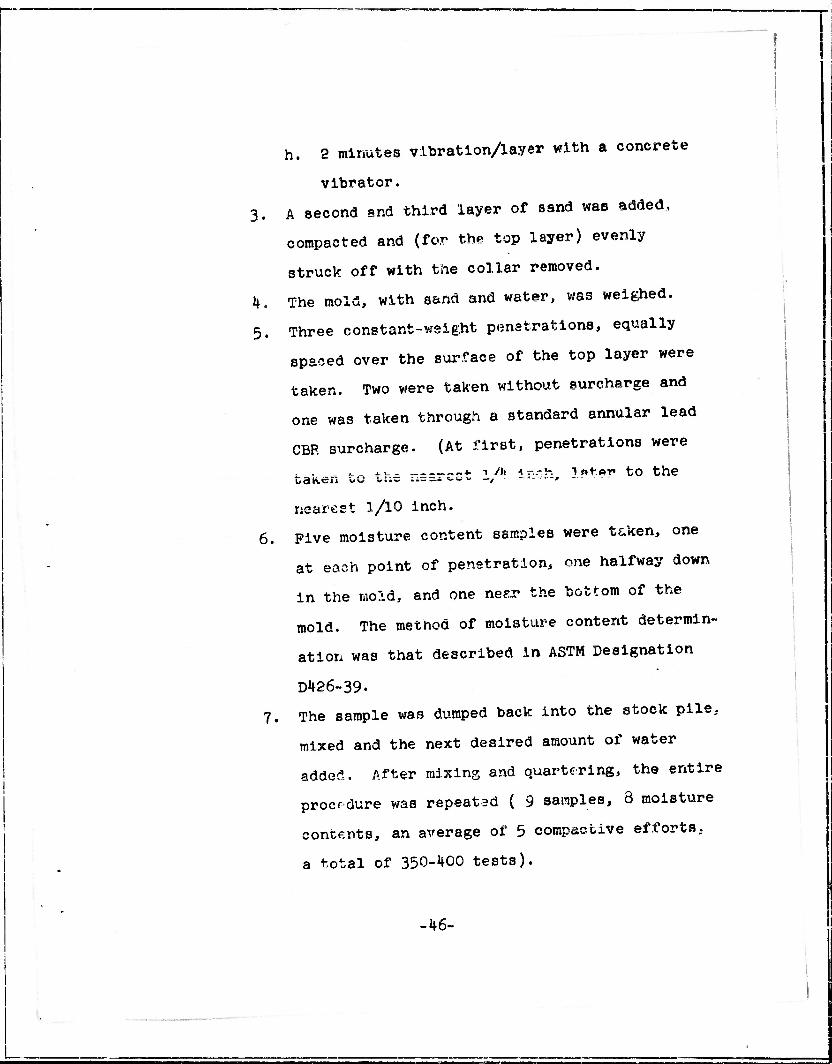
h. 2 minutes vibration/layer with a concrete
vibrator.
3. A second and third layer of sand was added,
compacted and (for the top layer) evenly
struck off with the collar removed.
k. The mold, with sand and water, v.*a3 weighed.
5. Three constant-weight penetrations, equally
spaced over the surface of the top layer were
taken. Two were taken without surcharge and
one was taken through a standard annular lead
CBR surcharge. (At first, penetrations were
taken to the nsarsst l/»! issh, l«t*r to the
nearest 1/10 inch.
6. Five moisture content samples were taken, one
at each point of penetration, one halfway down
in the mold, and one nesr the bottom of the
mold. The method of moisture content determin-
ation was that described in ASTM Designation
Dlf26-39-
7. The sample was dumped back into the stock pile,
mixed and the next desired amount of water
added. After mixing and quartering, the entire
procedure was repeatad ( 9 samples, 8 moisture
contents, an average of 5 compastive effortss
a total of 350-400 tests).
-46-

W.M s W *g" —• "' '•' •- ' " mm
8. At the beginning nnd conclusion of each
compactive effort series (except vibration,
loose and dropping on edges), grain-size
analyses were made on a representative sample
from the mold. ASTM Designation D422-39
was used as a method.
A true specific gravity was obtained for
each sample used. ASTM Designation D854-4ST
was U3ed as a method for this determination.
n
!
• 47-

COMPUTATIONS
Following the completion of each test, the following
quantities were computed:
1. Moisture contents (# of dry weight).
a. Average for the surface (w*• ). **8
b. Middle of the mold (wm).
c. Bottom layer of the mold (wfe).
d. Average content for the entire mold
according to Simpson's Rule (wa ).
2. Total weight of mold plus sample plus water (Wt).
3. Total weight of water (Ww).
4. Total weight of polids (Ws).
5. Total volume of cylinder (Vt).
6. The void ratio-presumed for the cylinder as a
whole (e).
7. True specific gravity (Q).
8. Degree of saturation at the top (St).
9. Average wet density (^w).
10. Average dry density ( j"d).
11. Average penetration without surcharge (P).
12. Penetration with surcharge (Ps).
13* Grain-size distribution curve
14. Median grain-size (D^Q).
15« Effective grain-size (D1Q).
16. Uniformity coefficient (Uc). Wri special techniques were used in obtaining ths above quanti-
ties -48-

ANALYSIS PROCEDURES
The following diagrams were plotted for each sample from
the computational data:
1. Moisture (wa) versus Wet Density (w) for each
compactive effort.
2. Moisture (wa) versus Dry Density ( <fd) for
e£iCh compactive effort.
3. Void-ra^io (e) versus Moisture (w£a) with
coincident Saturation (St) and Penetration
withe it surcharge (P). (These plots appear
as Figures 2 to 10).
k. Same as 3 but with Penetration with surcharge
(Ps). (These plots appear in Figures 2 to 10).
5. Penetration (P) versus Moisture (wt.) for
each compactive effort.
6. Penetration (P) versus Average Dry (ifd) and
Average Wet Density (i w) for each compactive
effort.
No special techniques were used to obtain the above plots *
-Kg-

APPENDIX S
FORMULAS USED TO OBTAIN VARIOUS. QUANTITIES
-50-

1. Moisture Contends
a. General: w « ~ x 10° W8
b. At surfacet wt « wti + wt2 + wt3
c. Average for mold: wa « 1/6 (wta + 4wm + wb)
lghts
a. Weight of solids: Ws
2. Weights Wt
1 + wa
b. Weight of water: Ww • Wt - W»
3. Void Ratio (Centigrade System) e „ (VtG)(l + waa) m x
_
4. True Specific Gravity
a. Pycriometer Method: G = Ws
Wi + Ws + W2
5. Saturation
a. At top: S - _!:§ e
Densities (English System)
a. Wet: Jr - ii w Vt
b. Dry: Jrd «= w 1+w
7. Uniformity Coefficient
c •
Dio Uc - D50
-51-

tf»» W»i^"*fc}li**S^AOTI)iW»i W5WIW-.H
rmed Services Technical liformatin figencf Because of our limited supply, you are requested to return tMs copy WES:*? IT HAS EXMVFJJ YOUR PURPOSE so that it may be made available to other requesters. Ifcsir crafjmratiwi wi.i be appreciated.
»f ' •••••'—«• i • ^, <»>EU».f-J|fci|;,i»«j,jg».,
NOTICE: WHEN GOVERNMENT OR OTHER DRAWINGS, SPECIFICATIONS QR OTHER DATA ARE USED FOR ANY PURPOSE OTHER THAN IN CONNECTION WITH A DEFINITELY RELATED GOVERNMENT PROCUREMENT OPERATION. THE U. S. GOVERNMENT THEBIB? HHCVES NO RESPONSIBILITY, NOR ANY OBLIGATION WHATSOEVER; AND THE FACT TEAT THIS GOVERNMENT MAY HAVE FORMULATED, FURNISHED, OR 3N -ANY WAY StfF'PUJRI* THJ3 SAID DRAWINGS, SPECIFICATIONS, OR OTHER DATA IS NOT TO S8 R19GABDEC' BY IMPLICATION OR OTHERWISE AS IN ANY MANNER LICENSING THE HOLDER OS ANY OTHIP. PERSON OR CORPORATION, OR CONVEYING ANY RIGHTS OH PERMES30N TO BMNCTAfiTt *S, j USE OR SELL ANY PATENTED INVENTION THATTKAY IN AWT WAY iiJ2 RELATE? THERETO, j
h
Reproduced by
DOCUMENT SERVICE CENTER KHOTT BUILDING, DAYTON, 2 OHIO
iiii