unclassified ad number limitation changes · unclassified ad number limitation changes to: from:...
TRANSCRIPT
UNCLASSIFIED
AD NUMBER
LIMITATION CHANGESTO:
FROM:
AUTHORITY
THIS PAGE IS UNCLASSIFIED
AD919337
Approved for public release; distribution isunlimited. Document partially illegible.
Distribution authorized to U.S. Gov't. agenciesonly; Test and Evaluation; MAY 1974. Otherrequests shall be referred to Air ForceArmament Lab., Eglin AFB, FL. Documentpartially illegible.
AFRPL ltr, 30 Jun 1975

s.
AEDC TR-74-31
1
CONDENSATION OF NITROGEN IN
A HYPERSONIC NOZZLE FLOW FIELD
C. C. Limbaugh, J. W. L. Lewis, M. Kinslow, et al. ARO, Inc.
VON KAR MAN GAS DYNAMICS FACILITY ARNOLD ENGINEERING DEVELOPMENT CENTER
AIR FORCE SYSTEMS COMMAND ARNOLD AIR FORCE STATION, TENNESSEE
PROPERTY OF U.S. AIR FORCE AEDC TECHNICAL LIBRARY
May 1974
Final Report for Period July 1, 1972 - February 28, 1973
TECHNICAL REPORT .FILE COtff
S
r Distribution limited to B. SV Government .agencies only; this report contains information on test and «valuation of military hardware; May 1974; other requests foe this document must be referred to Air Force Rocket Propulsion Laboratory (DY5PI, Edwards AFB, CA93523.
Prepared for
AIR FORCE ROCKET PROPULSION LABORATORY IDYSP) EDWARDS AFB, CA 93523
NOTICES
When U. S. Government drawings specifications, or other data are used for any purpose other than a definitely related Government procurement operation, the Government thereby incurs no responsibility nor any obligation whatsoever, and the fact that the Government may have formulated, furnished, or in any way supplied the said drawings, specifications, or other data, is not to be regarded by implication or otherwise, or in any manner licensing the holder or any other person or corporation, or conveying any rights or permission to manufacture, use, or sell any patented invention that may in any way be related thereto.
Qualified users may obtain copies of this report from the Defense Documentation Center.
References to named commercial products in this report are not to be considered in any sense as an endorsement of the product by the United States Air Force or the Government.
APPROVAL STATEMENT
This technical report has been reviewed and is approved.
JIMMY W. MULLINS Lt Colonel, USAF Chief Air Force Test Director, VKF Directorate of Test
7^4^^ FRANK J. PASSARELLO Colonel, USAF Director of Test

UNCLASSIFIED SECURITY CLASSIFICATION OF THIS PACE (When Data Entered)
REPORT DOCUMENTATION PAGE READ INSTRUCTIONS BEFORE COMPLETING FORM
1 REPORT NUMBER
AEDC-TR-74-31 2. GOVT ACCESSION NO. 3. RECIPIENT'S CATALOG NUMBER
_L 4 TITLE tana Submit]
CONDENSATION OF NITROGEN IN A HYPERSONIC NOZZLE FLOW FIELD
S. TYPE OF RESORT ft PERIOD COVERED
Final Report, Jul 1, 1972 to Feb 28, 1973 6 PERFORMING ORG. REPORT NUMBER
7 AUTHORI«;
C. C. Limbaugh, J, et al.
B CONTRACT OR GRANT NUMBERf«)
W. L. Lewis, M. Kinslow,
9 PERFORMING ORGANIZATION NAME AND ADDRESS
Arnold Engineering Development Center Arnold Air Force Station, Tennessee 37389
10 PROGRAM ELEMENT, PROJECT. TASK AREA • WORK UNIT NUMBERS
Program Element 62302F Project No. 5730
11 CONTROLLING OFFICE NAME AND ADDRESS
Air Force Rocket Propulsion Laboratory (DYSP), Edwards AFB, CA 93523
12. REPORT DATE
May 1974 13 NUMBER OF PAGES
104 14 MONITORING AGENCY NAME « ADDRESSfif dlllerent from ContiolltnH Oftica) IS SECURITY CLASS, fol IJilo report)
UNCLASSIFIED
IS«. DECLASSlFICATION DOWNGRADING SCHEDULE N^A
IS DISTRIBUTION STATEMENT (ol Ihla Report)
Distribution limited to U.S. Government agencies only; this report contains information on test and evaluation of military hardware; May 1974; other requests for this document must be referred to Air Force Rocket Propulsion Laboratory (DYSP), Edwards AFB, CA 93523.
17. DISTRIBUTION STATEMENT (ol tha abstract entered in Block »0, H dlllerent from KsporrJ
18. SUPPLEMENTARY NOTES
Available in DDC.
19 KEY WORDS fConrfnuo on reverse aida if necessary and Identity by black number)
nitrogen
condensation
condensing hypersonic flow
Rayleigh scattering
rotational temperature
20 ABSTRACT (Continue an revrao aide It naceaaar}- and Identity by block number)
Condensation of nitrogen in a hypersonic flow field produced by a small, 14.5-deg half-angle conical nozzle exhausting into vacuum has been studied using Rayleigh scattered radiation. Concomital measurements for the plume far-field gas density and rotational temperature were obtained using the electron beam fluorescence methods. Near-field plume gas density measurements were made with Raman scattering. The data taken were spatially resolved and had
WU I JAN 7» 1473 EDITION OF 1 NOV «S IS OBSOLETE UNCLASSIFIED 5ECURIT-Y-CLA5SIF1CATION OF THIS PAGE (When Data Entered) IIT-Y-CL.

UNCLASSIFIED SECURITY CLASSIFICATION OF THIS PAGE[Wian Data ffnrarad)
20, Continued
an axial extent of 14 < x/D < 220. Radial scans were made at selected axial locations. The onset of condensation was observed, both as a function of reservoir pressure and as a function of axial location for selected reservoir pressures. The density data show that the condensation process does not markedly affect the plume density, except at the highest reservoir pressure. However, there is a significant effect on the rotational temperature, with the rotational temperature increasing with mass fraction condensed. Data obtained from the uncondensed portions of the plume were in good agreement with isentropic method of characteristics calcu- lations. An approach for calculation of condensation effects is developed herein, and resulting calculations are in order of magnitude agreement with the experimental measurements.
UNCLASSIFIED
n SECURITY CLASSIFICATION OF THIS PAGEfWianDa
AEDCTR-74-31
PREFACE
The work reported herein was conducted by the Arnold Engineering Development Center (AEDC), Air Force Systems Command (AFSC), for the Air Force Rocket Propulsion Laboratory (AFRPL), AFSC. This project was monitored by Capt. Sam Thompson of AFRPL. The results presented were obtained by ARO, Inc. (a subsidiary of Sverdrup & Parcel and Associates, Inc. ), contract operator of AEDC, AFSC, Arnold Air Force Station, Tennessee under ARO Project Numbers VV0271 and VA096. The final data analysis was completed on Septem- ber 1, 1973, and the manuscript (ARO Control No. ARO-VKF-TR-73- 161) was submitted for publication on December 20, 1973.
The contributions of H. M. Powell, L. L. Price, and W. D. Williams of the Aerospace Projects Branch of the von Ka'rmän Gas Dynamics Facility, co-authors of this technical report, are grate- fully acknowledged.

AEDC-TR-74-31
CONTENTS
Page
1. 0 INTRODUCTION 1. 1 Objective 9 1.2 Background and Approach 10
2. 0 THEORY 2. 1 Introduction 13 2.2 Scattering 13 2. 3 Condensation 18
3. 0 APPARATUS AND PROCEDURE 3. 1 4- x 10-ft Research Vacuum Chamber 25 3. 2 Nozzles and Gas Supply 26 3.3 PDP-8F Computer 28 3.4 Electron Beam and Spectrometer 29 3.5 Light-Scattering Apparatus 32 3. 6 Electron Beam Measurements Procedure 39
3. 6. 1 Rotational Temperature 40 3. 6. 2 Density Measurements 44
3.7 Light-Scattering Measurements Procedure 45 4. 0 RESULTS AND DISCUSSION
4.1 Test Conditions 50 4. 1. 1 Experimental Conditions 50 4. 1. 2 Isentropic Plume Calculations 52 4.1.3 Condensation Calculations " . 53 4.1.4 Anticipated Condensation Conditions 56
4.2 Plume Properties 58 4. 2. 1 Flow Visualization Results 58 4. 2. 2 Gas Density Results 59 4. 2. 3 Rotational Temperature Results 69 4. 2. 4 Rayleigh Scattering Results "69
4. 3 Discussion 80 4. 3. 1 General 80 4. 3. 2 Electron Beam and Raman Scattering 83 4. 3. 3 Rayleigh Scattering 84 4. 3. 4 Particle Size Estimates 92
5.0 SUMMARY 93 REFERENCES 98
AEDC-TB-74-31
ILLUSTRATIONS
Figure Page
1. Scattering Coordinate System . 15
2. Log P-Log T Diagram Illustrating Condensation Process 19
3. Installation Schematic in the 4- x 10-ft Research Vacuum Chamber 25
4. Photograph of FF Nozzle Installation 27
5. Gas Inbleed System Schematic . . ." 28
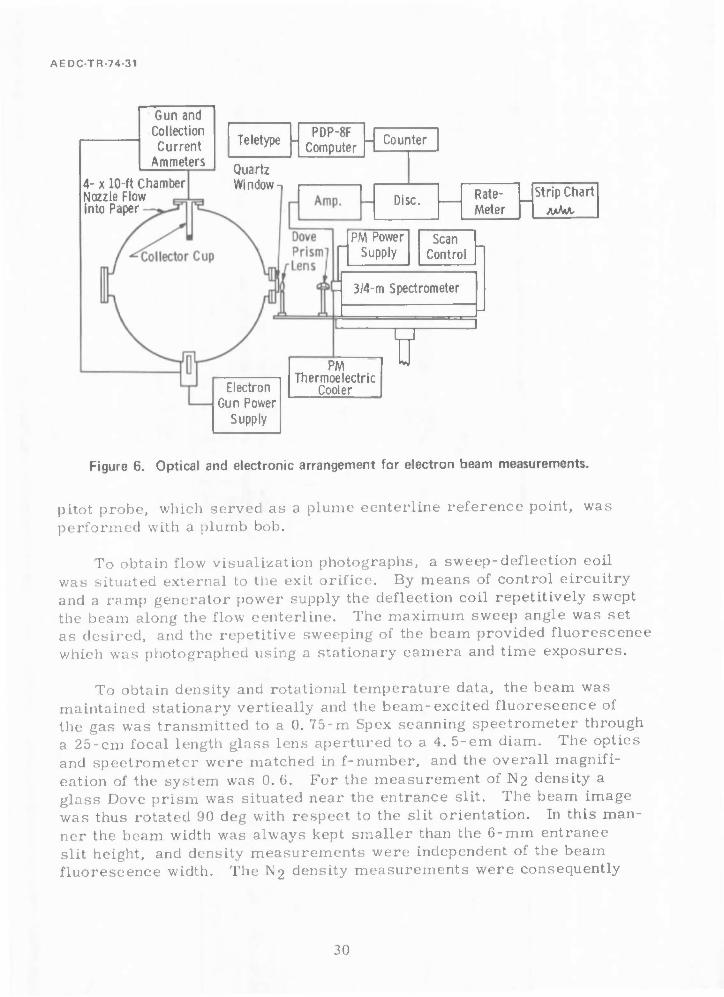
6. Optical and Electronic Arrangement for Electron Beam Measurements 30
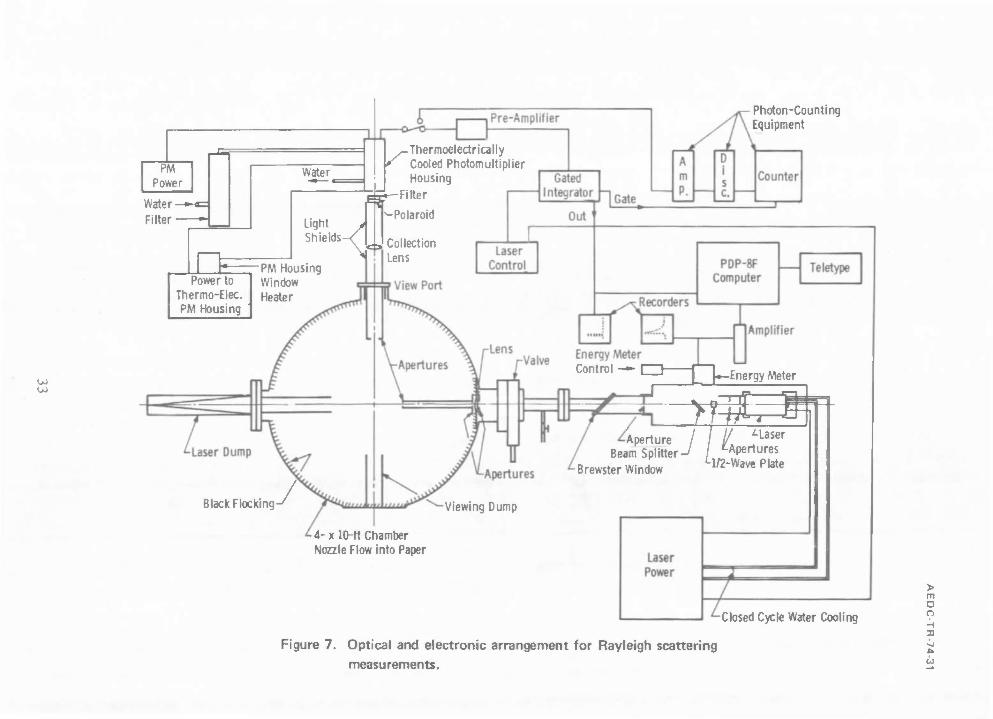
7. Optical and Electronic Arrangement for Rayleigh Scattering Measurements 33
8. Optical and Electronic Arrangement for Raman Scattering Measurements 34
9. Transmission Curve for 6943-Ä Filter 36
10. Transmission Curve for 6943-A Rejection Filter. ... 37
11. Transmission Curve for 8284-Ä" Filter 38
12. Variation of Rotational Line Intensity Ratios R(l)/R(3) and R(3)/R(7) with TR 43
13. Typical Calibration Plot for Rayleigh Scattering .... 46
14. Typical Calibration Plot for Raman Scattering 46
15. Initial Conditions used in Condensation Calculations . . 55
16. Isentropic Log P-Log T Plot for the Plume Expansions 56
17. TR/TQ versus P0 Plot Illustrating Condensation Onset . 58
18. Plume Flow Visualization Photograph at P0 = 760 Torr . 61
19. Plume Flow Visualization Photograph at P0 = 1965 Torr 61
20. Plume Flow Visualization Photograph at P0 = 5170 Torr 63

AEDC-TR-74-31
Figure Page
21. Plume Flow Visualization Photograph at P0 = 7905 Torr 63
22. Axial Density Profile, PQ = 51. 7 Torr 65
23. Axial Density Profile, P0 = 760 Torr 65
24. Axial Density Profile, PQ = 1965 Torr 66
25. Axial Density Profile, P0 » 7755 Torr 66
26. Electron Beam Radial Density Profiles, - P0 = 760 Torr 67
27. Electron Beam Radial Density Profiles, P0 = 1965 Torr 68
28. Electron Beam Radial Density Profiles, P0 = 7755 Torr 68
29. Electron Beam Axial Rotational Temperature Profile, PQ = 51.7Torr 70
30. Electron Beam Axial Rotational Temperature Profile, P0 * 760 Torr .70
31. Electron Beam Axial Rotational Temperature Profile, P0 = 1965 Torr 71
32. Electron Beam Axial Rotational Temperature Profile, P0 = 7755 Torr 71
33. Electron Beam Radial Rotational Temperature Profile, P0 « 760 Torr 72
34. Electron Beam Radial Rotational Temperature Profile, P0 = 1965 Torr 73
35. Electron Beam Radial Rotational Temperature Profile, P0 = 7755 Torr 74
36. Experimental Rayleigh Scattering Axial Profiles, AN2 Nozzle 75
37. Experimental Rayleigh Scattering Radial Profiles, AN2 Nozzle, PQ = 7755 Torr 77
38. Experimental Rayleigh Scattering Radial Profiles, AN2 Nozzle, P0 - 6204 Torr 78
AEDC-TR-74-31
Figure Page
39. Experimental Rayleigh Scattering Axial Profile, FF Nozzle, P0 = 7755 Torr 79
40. Experimental Rayleigh Scattering Radial Profiles, FF Nozzle, P0 = 7755 Torr 80
41. Variation of Rayleigh Scattered Signal with K-Bottle Water Vapor Content 81
42. Depolarization Ratio Profiles, P0 = 4136, 6204, and 7755 Torr 81
43. Isentropic <Na^> from Method of Characteristics versus Axial Distance x/D 84
44. Axial Variation of Rayleigh Scattering Signal Contributions, PQ - 3102 Torr 85
45. Axial Variation of Rayleigh Scattering Signal Contributions, PQ = 6204 Torr 86
46. Calculated Rayleigh Scattering Axial Profiles ..... 87
47. Calculated and Experimental Supersaturation Ratios versus Reservoir Pressure 88
48. Log P-Log T Plot from Condensation Calculations ... 90
49. Ratio of Condensation Cessation and Onset Locations versus Reservoir Pressure 91
50. Variation of Rayleigh Scattered Peak Values with Reservoir Pressure 91
51. Variation of Half-Width, Half-Maximum Points of <Na6> and N with Axial Distance 92
NOMENCLATURE 101

AEDC-TR-74-31
TABLES
Page
1. Nozzle Dimensions 26
2. Experimental Conditions and Measurements for the FF Nozzle 51
3. Experimental Conditions and Measurements for the AN2 Nozzle 52

AEDC TR-74-31
1.0 INTRODUCTION
1.1 OBJECTIVE
There has recently been extensive work devoted to the development of systems for detection of high altitude vehicles. An integral compon- ent of all such systems is the means for distinguishing the vehicle against the background of the space environment. This can generally be accom- plished by observing the electromagnetic radiation either reflected from or emitted by the vehicle and can, in principle, utilize radiation from any part of the electromagnetic spectrum. Obviously, if there is any • , constituent foreign to the space environment within the field of view of the system', the information obtained from the system can be erroneous. Since some such systems are designed as orbital stations with long op- erating lifetimes, part of the design includes small jets utilized as atti- tude control systems. If gaseous constituents from the jets enter the field of view of the sensor, the effects are readily calculable and are generally insignificant. However, if these gaseous constituents should condense into conglomerates of larger particles, the effects are not readily determinate.
It is well known that nozzle gas sources, such as those employed as attitude control system thrusters, produce a hypersonic flow which condenses when the gas source pressure is sufficiently high for a given gas source temperature. From a microscopic point of view this con- densation is manifested by the formation of dimers, trimers, tetramers, and in general N-mers, each species occuring sequentially along the flow direction. The production of these species within the time scale of a hypersonic flow field is a nonisentropic and exothermic process which will naturally affect the plume properties. Additionally, the for- mation of such species results in enhanced scattering of optical radia- tion incident upon the plume.
Past studies of condensation in flow fields have lead to the conclu- sion that condensate sizes are on the order of 100 A or less, and con- sequently, such radiative scattering processes for visible and infrared wavelengths are most assuredly characterized by the Rayleigh.descrip- tion rather than by the more complicated Mie equations. For the , Rayleigh formulation the scattering efficacy of the clusters or particles is proportional to <Na°> where a is assumed to represent a "mean di- ameter" of the cluster distribution and N is the number density of the V» scattering particles.

AEDC-TR-74-31
Calculations of the scattering of radiation incident upon the two- phase plume require knowledge of the spatial location of condensation onset and the spatial distribution of condensate both during and follow- ing the cluster growth processes, as well as accurate estimates of the magnitude of the <Na°> product of the condensate. At the present time the rate constants appropriate to such processes are insufficiently known to allow accurate calculations of the required parameters, and recourse must be made to experimental studies of the scattering phe- nomena. For this purpose an experimental program was initiated at AEDC to provide the required parameters to allow an assessment of the effects of radiation scattering by plume condensate.
The principle specific objective of the current investigation was to experimentally measure the spatially resolved scattering of electro- magnetic radiation from a gaseous nitrogen plume and from this to in- fer <Na^>. A correlary objective was to obtain flow-field data from the plumes which were used in the scattering measurements. In this manner a base of coupled flow-field and scattering data is provided for the subsequent assessment of the importance of condensate in the plume.
1.2 BACKGROUND AND APPROACH
Although the condensation process may be described as being well understood qualitatively after onset has occurred and the resulting two- phase environment can be described by classical means, neither the mechanism by which the condensation process commences nor the growth process is well understood. There are generally grave diffi- culties in attempting to predict the point in the hypersonic expansion at which condensation occurs," the growth and/or evaporation of the re- sulting condensate, and the final condensate size and concentration. Although the classical approach as presented in Ref. 1 is applicable in principle to all gaseous homogeneous condensation processes, a priori calculations are generally impossible because of the absence of the re- quired molecular parameters.
Condensation in supersonic expansions has been examined exten- sively over the past several decades, generally with a view towards avoiding the phenomena in wind tunnel and turbine applications (Ref. 2). Much of the earlier work was concerned with bulk properties, and sub- sequent estimates of particle size and concentration were obtained from implicit theoretical relationships depending upon macroscopic flow measurements. These approaches are summarized in References 1 and 2.
10

AEDC-TR-74-31
In recent years there have been extensive mass spectrometer stud- ies of condensation by various groups (e.g., Refs. 3 and 4); these stud- ies have elucidated some of the questions of the basic problem. How- ever, this mass sampling process is performed in the far field of the plume, and the resulting cluster mass spectra are the result of inte- gration of the rate process over the centerline distance of the plume and provide no direct information concerning'spatial profiles. Further, even if spatially resolved data were available, one could not obtain meaningful information for description of the radiative scattering prop- erties without making some difficult decisions concerning the shape, density, and size of the clusters.
Of more direct relevance to the problem at hand is some of the recent experimental work in the scattering of electromagnetic radiation from supersonic plumes. Although light scattering was used in the early 1950'e^ (e.g., Ref. |5) to examine condensation in supercooled flows, results were limited, principally because of the relative inade- quacies of the light source. This experimental technique has been used most successfully only recently with the development of the in- tense well-defined energy source available in the laser.
Some of the recent notable work includes that of Wegener and his students, which emphasizes binary mixtures of a single condensable specie such as water (Refs. 6 and 7) and ethanol (Ref. 8) in a noncon- densable carrier gas. Estimates of mean size and number density of condensate were obtained, and angular dependence studies were per- formed. In addition to the difference in gas composition, the Mach numbers employed in these studies were much lower than those en- countered in thruster plume exhausts, thereby having different flow gradients and kinetics. Beylich (Refs. 9 and 10) has studied carbon dioxide (CO2) condensation with spatially resolved measurements, but the onset of condensation occurred within the nozzle, obscuring the growth process. Finally, Daum and his colleagues (Ref. 11) have ob- tained <Na^> measurements for air flows, but the necessary limitations on source condition variations and the absence of axial profiles restrict the application of these data to the problem at hand.
In each of these mentioned works, where appropriate data were available, the particulate radii were in the range from 10 A to 100 A, and particle densities were in the range from 10H cm"** to 10*4 cm"^. Thus, the condensate sizes and densities are of magnitudes such that Rayleigh theory is assuredly applicable. Although these experiments generally used different gases at different conditions than are to be used in the
11
AEDC-TH-74-31
present work, that of Hagena and Obert (Ref. 3) did use the same gas at similar conditions and obtained particle sizes and concentrations consistent with the other work.
The evidence cited above shows that the scattering of electromag- netic radiation from the condensate plume is described by Rayleigh scattering theory at visible wavelengths (and thus at longer wavelengths also). The approach for the present work is to obtain measurements of the ratio of the scattered to incident intensities as a function of position within the plume when the plume is irradiated by visible light from a pulsed ruby laser (6943 A). This scattered light relative to the incident radiation will immediately yield <Na°>. The study to be described is limited to homogeneous condensation, as were all of the previously referenced works. Because attention was restricted to homogeneous processes, the resulting <Na^> values represent the minimum which are attainable for given source conditions and a clean gas supply.
Ancillary calculations were initially planned to be performed with program CONTAM (Ref. 12), which is designed to provide calculations of supersonic expanding plumes coupled with the condensation process. However, it was subsequently determined that for the problem at hand, the program was inadequate in its current state of development. Hence, it was decided to develop equations for condensation growth in the flow field for the specific problem being attacked.
Besides obtaining the scattering measurements, a test objective was to obtain the plume properties as a function of spatial position. For these measurements the electron beam fluorescence method was used (Ref. 13). This method has previously been used with satisfactory results both in hypersonic flows (Ref. 14) and as a diagnostic tool when condensation is present (Ref. 10). During the course of the study it be- came possible to obtain limited Raman scattering measurements of the nitrogen (N2) gas density in the plume. These measurements were ob- tained near the nozzle exit at gas densities which were too high for the electron beam to be useful. Using this method, it was possible to ob- tain gas density measurements in the region of condensate growth.
12
AEDCTR-74-31
2.0 THEORY
2.1 INTRODUCTION
In this section the Rayleigh scattering equations are discussed, and the equations used to describe the condensation phenomena are developed. Since the electron beam fluorescence technique has been described pre- viously for wind tunnel applications (Ref. 14), it is not discussed here. Further, since Raman scattering will be more fully discussed at a later date, it is given only a cursory description in these pages.
2.2 SCATTERING
When a substance such as a gas is irradiated by a beam of mono- chromatic light whose frequency is such that it is not absorbed by the gas, the majority of the beam passes through the gas virtually unaf- fected. However, there will be a small fraction of the beam scattered by the constituents of the sample in a direction other than that of the in- cident beam. The majority of this scattered light, at the same frequency as the incident beam, constitutes Rayleigh scattering, which can be de' scribed classically. However, a small portion of the scattered light is at a frequency other than that of the incident light. This light, scattered at a shifted frequency, is caused by the Raman effect, which is the re- sult of inelastic photon-molecule collisions. Raman, as well as Rayleigh scattering, is distinct from fluorescence phenomena in that the scatter- ing process occurs with characteristic times of 10"*^ sec or less, where- as fluorescence results from the usual radiative decay of excited states and possesses characteristic decay times of 10~9 sec or greater.
The frequency, or wavelength, shift relative to the incident radi- ation frequency is characteristic of the molecular specie and provides a means of selectively studying individual molecular species, The Raman scattered intensity is directly proportional to the molecular number density, thereby providing a determination of molecular num- ber density. A detailed discussion of the Raman effect and its applica- tions can be found in Ref. 15.
In the work described herein, it became possible near the close of the experiments to utilize the Raman effect for gaseous specie density determinations. This work, which depends upon the interaction be- tween the laser light and the nitrogen molecule vibrational-rotational
13
AEDC-TR-74-31
energy structure, provided density determinations at higher plume den- sities than could be obtained from the electron beam fluorescence methods.
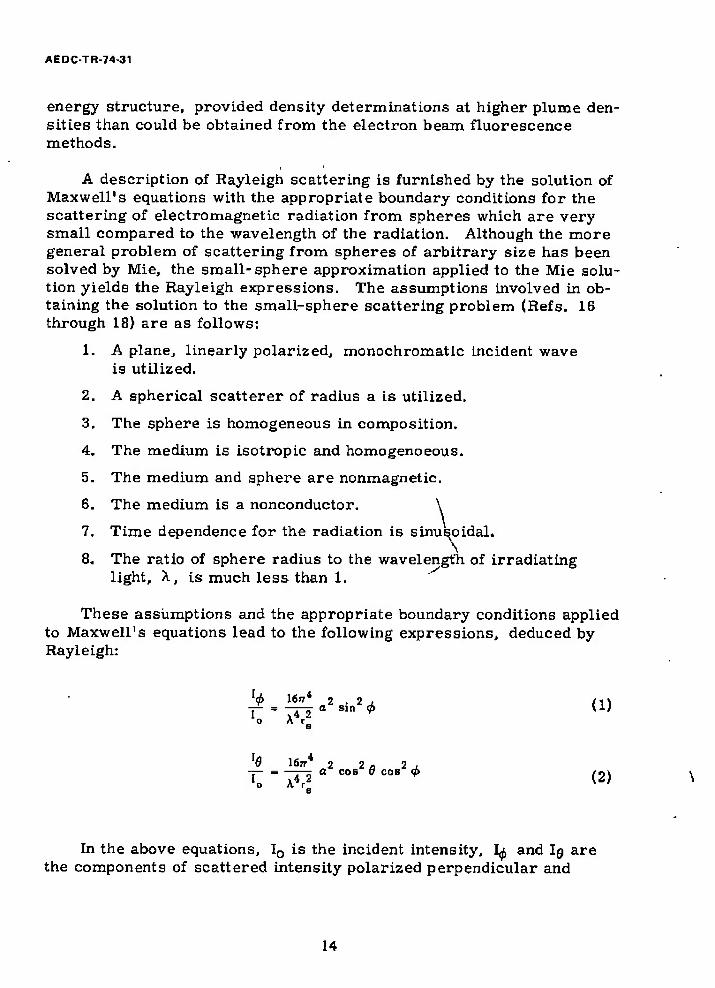
A description of Rayleigh scattering is furnished by the solution of Maxwell's equations with the appropriate boundary conditions for the scattering of electromagnetic radiation from spheres which are very small compared to the wavelength of the radiation. Although the more general problem of scattering from spheres of arbitrary size has been solved by Mie, the small-sphere approximation applied to the Mie solu- tion yields the Rayleigh expressions. The assumptions involved in ob- taining the solution to the small-sphere scattering problem (Refs. 16 through 18) are as follows:
1. A plane, linearly polarized, monochromatic incident wave is utilized.
2. A spherical scatterer of radius a is utilized.
3. The sphere is homogeneous in composition.
4. The medium is Isotropie and homogenoeous.
5. The medium and sphere are nonmagnetic.
6. The medium is a nonconductor. \
7. Time dependence for the radiation is sinusoidal. \
8. The ratio of sphere radius to the wavelength of irradiating light, X, is much less than 1.
These assumptions and the appropriate boundary conditions applied to Maxwell's equations lead to the following expressions, deduced by Rayleigh:
f0 I6ff* 2.2, C\\ T = TTT a sin * {1)
o Ar s
lB lfirr4 2 2 a 2 . ~ = T7! a cos B cos * (2) o A r s
In the above equations, I0 is the incident intensity, IA and Ig are the components of scattered intensity polarized perpendicular and
14

AEDC TR-7431
parallel to the scattering plane, respectively, and rs is the distance from the scatterer to the observation pointj X is the wavelength of the irradiating radiation, and a is the polarizability of the scatterer. The scattering plane is defined as that plane containing the propagation di- rection of the incident radiation and the propagation direction of the scattered ray. This is also called the plane of observation and is de- fined geometrically in Fig. 1 by the angles 9 -and <j>, where 6 is the angle of the scattered ray with the incident ray and.<£ is the angle between the polarization direction and the scattering plane. In Fig. 1 the incident intensity, I0, with electric field (polarization) unit vector 1ü0 along the X-axis and propagation vector k0 along the Z-axis, is incident upon the scattering center at the origin of the coordinate axes (X, Y, Z). The scattered ray of intensity, Is, electric field, "E"S) and propagation vec- tor» ks, are scattered at an angle 0 with the incident direction. The plane formed by'k'g x k0 is the scattering plane. For the test described herein, the scattering- plane was defined by 9 = 90 deg and o = 90 deg, or the Y-Z plane. /
Each of the above expressions is developed for scattering by a single particle. The expressions are general with respect to the optical prop- erties of the medium and particle, and the principle requirement is that the sphere radius be much smaller than the wavelength. As discussed in Kerker (Ref. 18), for a/A < 0. 05, the Rayleigh formulation provides
Scattering Center
Figure 1. Scattering coordinate system.
15

AEDC-TR-74-31
negligible error compared to the more rigorous and formally correct Mie solution. This is usually taken as the criterion for the validity of the Rayleigh theory. For the present experiment, which used the 6943- A light from a ruby laser, the scatterer radius must be less than 350 A.
Each particle will scatter the radiation incident upon it according to Eqs. (1) and {2). If single scattering dominates, the incident radia- tion will be that of the incident laser beam. If the scatterers are in- dependent, the total scattered light can be expressed as the sum (or integral) of Eqs. (1) and (2) over each particle in the scattering volume.
Single scattering means that the radiation incident upon a particle is from the incident beam and not from scattering by some other par- ticle. Implicit in this definition is the insignificant attenuation of the beam as it traverses the scattering volume. If the optical depth of the scattering volume is small (i.e., if absorption is negligible) the only mechanism for attenuation of the incident beam is the scattering. For these experiments, which used nitrogen, there is no significant absorp- tion at the wavelength of interest, 6943 A.
If multiple scattering in the stricter sense is present to an appre- ciable extent, there will be considerable scattered radiation at a scat- tering angle of 90 deg, with its polarization vector aligned parallel to the scattering plane. [From Eq. {2), this value is zero for Rayleigh scattering.] As will be seen from the data, this component of the scat- tered intensity was negligible with respect to the other component. If multiple scattering were a factor, this parallel component of the scat- tered intensity would be a much larger value since the scattering plane would change its orientation with respect to the scattering of light which has been previously scattered by another particle. As some undefined limit is reached, with multiple scattering the light observed at the ob- servation point would become diffuse with circular polarization. These observations verify the assumption of single scattering.
Independent scattering means that there are no phase relationships between the light scattered from separate particles within the scattering volume; i.e., the scattering is incoherent. It can be shown that, for a large ensemble of particles, if the inequality 4Ü/A sin 9/2 » 1 is satis- fied, where i is a characteristic dimension of the scattering volume and 6 is the observation angle, the scattering will be independent (Ref. 19). For this set of experiments the ratio i/X ;> 100, and thus the in- equality was satisfied.
16
AEDCTR-74-31
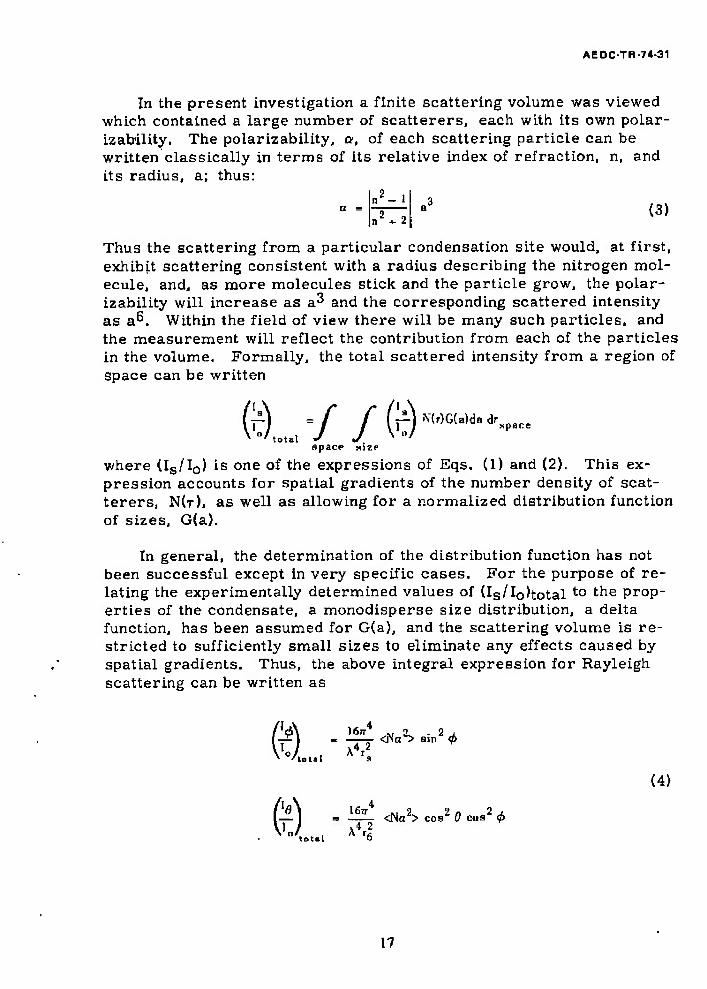
In the present investigation a finite scattering volume was viewed which contained a large number of scatterers, each with its own polar- izability. The polarizability, a, of each scattering particle can be written classically in terms of its relative index of refraction, n, and its radius, a; thus:
2 n —
*3 (3)
Thus the scattering from a particular condensation site would, at first, exhibit scattering consistent with a radius describing the nitrogen mol- ecule, and, as more molecules stick and the particle grow, the polar- izability will increase as a^ and the corresponding scattered intensity as a^. Within the field of view there will be many such particles, and the measurement will reflect the contribution from each of the particles in the volume. Formally, the total scattered intensity from a region of space can be written
feL-Z/fe)^*"1**"'" space
where (Is/I0) is one of the expressions of Eqs. (1) and (2). This ex- pression accounts for spatial gradients of the number density of scat- terers, N(T), as well as allowing for a normalized distribution function of sizes, G(a).
In general, the determination of the distribution function has not been successful except in very specific cases. For the purpose of re- lating the experimentally determined values of (Ig/Io^total to the prop- erties of the condensate, a monodisperse size distribution, a delta function, has been assumed for G(a), and the scattering volume is re- stricted to sufficiently small sizes to eliminate any effects caused by spatial gradients. Thus, the above integral expression for Rayleigh scattering can be written as
ft) ,-$* y 'Lot« I S
> sin <p
© (4)
= i£ü! <Na2> cos2 0 cos2 <*
i'1 2
total O
17
AEDC TR-74-31
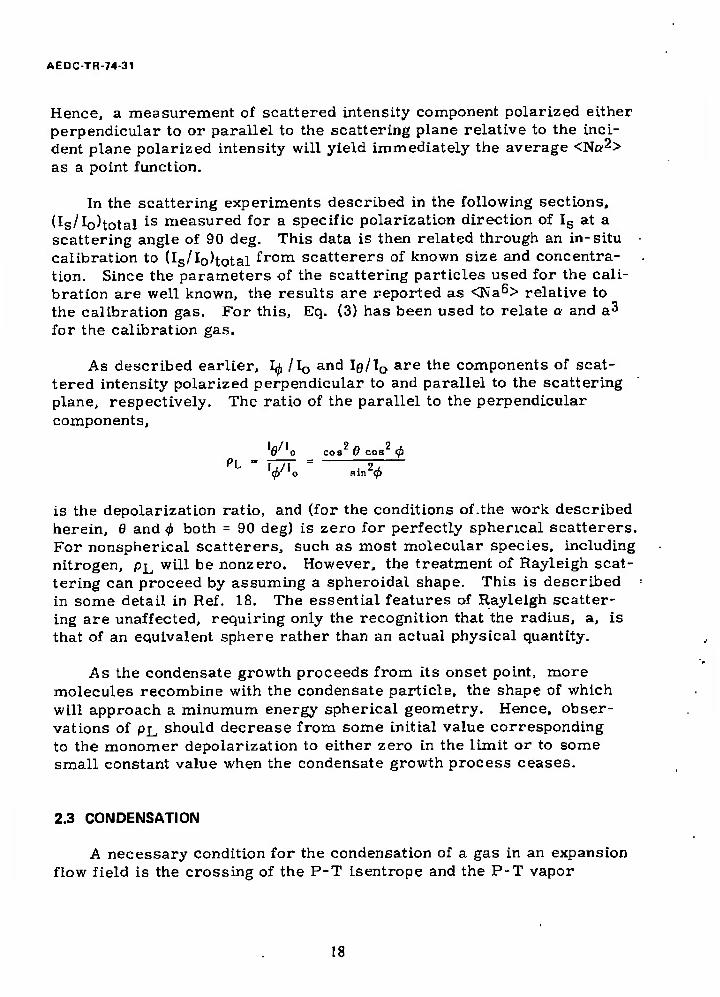
Hence, a measurement of scattered intensity component polarized either perpendicular to or parallel to the scattering plane relative to the inci- dent plane polarized intensity will yield immediately the average <No?2> as a point function.
In the scattering experiments described in the following sections, (Is/I0)totai is measured for a specific polarization direction of Is at a scattering angle of 90 deg. This data is then related through an in-situ calibration to (Ig/IoHotal fr0m scatterers of known size and concentra- tion. Since the parameters of the scattering particles used for the cali- bration are well known, the results are reported as <Na6> relative to the calibration gas. For this, Eq. (3) has been used to relate a and a^ for the calibration gas.
As described earlier, 1^ /I0 and IQ/10 are the components of scat- tered intensity polarized perpendicular to and parallel to the scattering plane, respectively. The ratio of the parallel to the perpendicular components,
PL
l8/lo cos2 g cos2 ^
(ft o sin <$>
is the depolarization ratio, and (for the conditions of .the work described herein, 0 and <f> both = 90 deg) is zero for perfectly spherical scatterers. For nonspherical scatterers, such as most molecular species, including nitrogen, pj_, will be nonzero. However, the treatment of Rayleigh scat- tering can proceed by assuming a spheroidal shape. This is described in some detail in Ref. 18. The essential features of Rayleigh scatter- ing are unaffected, requiring only the recognition that the radius, a, is that of an equivalent sphere rather than an actual physical quantity.
As the condensate growth proceeds from its onset point, more molecules recombine with the condensate particle, the shape of which will approach a minumum energy spherical geometry. Hence, obser- vations of pj_, should decrease from some initial value corresponding to the monomer depolarization to either zero in the limit or to some small constant value when the condensate growth process ceases.
2.3 CONDENSATION
A necessary condition for the condensation of a gas in an expansion flow field is the crossing of the P-T isentrope and the P-T vapor
18

AEDC-TR-74-31
pressure curve when plotted in the P-T plane. This is illustrated qual- itatively in Fig. 2. The straight line illustrates the log P-log T rela- tionship for the reversible adiabatic expansion of a perfect gas, expressed as
vy/y-l
In an expanding adiabatic isentropic flow, with gas reservoir pres- sure and temperature conditions P0, T0, the P-T conditions at any point in the flow field will proceed along the straight line from the in- itial conditions. At some point in the flow, designated as point "S" in Fig. 2, the P-T conditions will cross the P-T vapor pressure curve which describes the necessary conditions for the gaseous state to be in equilibrium with the liquid state. As the flow proceeds from this point, it is in the supersaturated state with respect to its liquid phase. The state of the gas is thus metastable with respect to its phase from this point and may proceed along the isentrope uncondensed. Or, conversely, condensation may occur at some degree of supersaturation, designated as point "C11 in Fig. 2, and continue until the condensed and gaseous phases re-establish equilibrium. The condensation process releases heat, and thus from this point of condensation the initial restrictions of the expansion are violated and, in the P-T diagram, the expansion proceeds along some other path illustrated qualitatively by the dashed line.
Log P
Vapor Pressure of Solid Phase-
Isentropic Expansion
P , T o' o
Noniaentropic Condensation
Isentropic Expansion Following Condensate Growth
Log T
Figure 2. Log P-log T diagram illustrating condensation process.
o 19
AEDC TR-74-31
In the past, most research in condensation has been concerned with the condensation of a low-pressure vapor in a carrier gas, e.g., water vapor in air. The carrier gas acts as a reservoir to maintain equality of temperature between the static gas, the vapor, and the con- densed phase. Most of the theoretical work in the past has therefore been based upon the isothermal assumption (see the excellent chapter on condensation by Wegener, Ref. 1). For the condition of a pure gas, most investigators have simply applied the isothermal results where the assumptions are usually not justified.
In this section the equations describing the condensation of a pure gas are developed. The analysis presented is based upon the following assumptions:
1. The condensing flow within a given stream tube is in- viscid, one-dimensional flow.
2. The flow within the defining stream tube is adiabatic with no mass transfer across the boundary.
3. The gaseous components obey the perfect gas relation.
4. Thejcondensed phase exists in the form of spherical drops or particles, whose properties are given by the bulk liquid or solid properties.
5. The mean directed velocities of the gas and the con- densate are equal in the nozzle expansion and plume.
6. The growth rate of condensate is determined by the interaction between the condensate and the gaseous phase; i.e., the interaction between the condensate particles is neglected.
7. The condensate particles are considered to be in the free molecule flow regime relative to the uncondensed gas phase.
8. The probability that a molecule will be condensed upon striking a condensate particle is unity. However, re- evaporation will be permitted.
9. All condensate particles are of equal size.
The total mass flux at any location along the stream tube is given by the following equation:
™ = AVJPi + Pa) (5)
20

AEDC-TR-74-31
where A is the cross-sectional area of the stream tube, V,,, is the free- stream flow velocity, and p\ and p2 represent the density of uncondensed and condensed particles, respectively. From the second assumption, rh, mass flux within the stream tube, is a constant; i.e., 9m/9x = 0. The net mass exchange between the gas phase and the condensate par- ticles can be determined by the application of assumptions four through nine.
The flux of mass to a condensate particle is given by the free mole- cule mass flux equation and is written as
4ffP„a2
V2nH T
Considering a particle in equilibrium with its gas phase for which the ambient temperature and pressure are Tc and PV(TC, a), respec- tively, the mass flux to the particle is given by
4JTP (T ,a)a2
V'2»ft Tc
Under equilibrium conditions this expression also gives the evaporation rate, which is a function only of condensate properties. Therefore, this expression is valid for arbitrary ambient conditions.
The rate change of mass in a particle is given by
. 2 da
Equating this expression to the difference between the condensation and evaporation rates and simplifying yields the following equation:
p« pvCTca) /7r- v da /fi* —— —— = V2T PCV — (6) VRT^ VRT
C
Here the time derivative has been changed to a distance derivative by introducing the flow velocity.
The conservation of energy for the total flow may be expressed as follows:
^o ■ PiAV* fcpiT-+ -r) + PaAV- [v-+ T " L(T«-a) + CPIT-J <7>
21
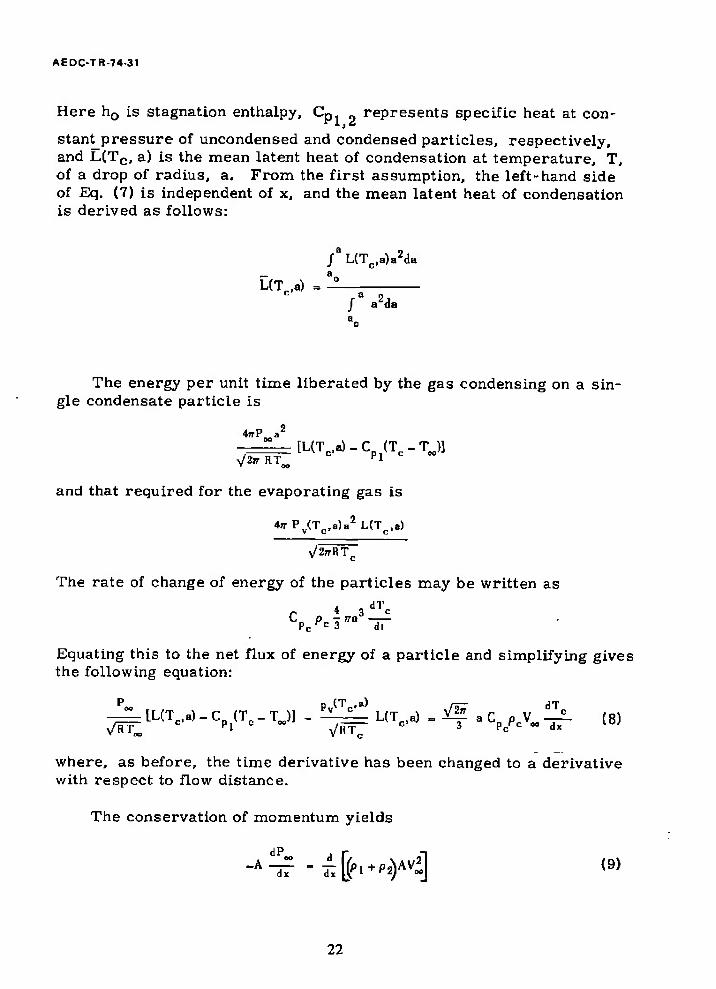
AEDC-TR-74-31
Here h0 is stagnation enthalpy, Cpi „ represents specific heat at con-
stant pressure of uncondensed and condensed particles, respectively, and L(TC, a) is the mean latent heat of condensation at temperature, T, of a drop of radius, a. From the first assumption, the left-hand side of Eq. (7) is independent of x, and the mean latent heat of condensation is derived as follows:
2. / L(T a)«M»
L(T, a) = — / a2da
The energy per unit time liberated by the gas condensing on a sin- gle condensate particle is
477Pooa2
[UTc,a)-C (Te-TJ8 v/2r RT ^1
and that required for the evaporating gas is
4ffPv(Tc,a)a2L(Tc,«)
J2TTHT ' c
The rate of change of energy of the particles may be written as
Cpcp*3n IT
Equating this to the net flux of energy of a particle and simplifying gives the following equation:
Pv(Tc'a) .... t/ä? _ .. dT [L(Tc,a)-Cp<Tc-TJ] - !^L L(Tc,a) - & a C„ pc V, C
t c* rj, C oo'J . (8)
where, as before, the time derivative has been changed to a derivative with respect to flow distance.
The conservation of momentum yields
-*% -T.h*'^ <9>
22
AEDC-TR-74-31
There is no net momentum exchange between the gas and the condensate, since" it was assumed that there was no velocity differential.
The third assumption permits writing the perfect gas relation for the uncondensed gas and the '"gas" of condensed particles respectively, as
Pi - Pi RT~
and
P2 = p<> RTM/z
where z is the number of molecules per condensate particle. The static pressure attributable to all particles is simply the sum of these two terms and may be written as
p„ = RTM(p1+P2/z) (10)
On the basis of the fourth assumption, a relation between the num- ber of molecules per condensate particle, z, and particle properties can be written as follows:
,, i7Tp>*3 (11) 3m
where m is the molecular mass.
Equations (5) through (11) are basic equations governing the eight unknowns (P., Tol V,,,, p\> P2, a, z, and Tc). It is therefore neces- sary that an additional equation be obtained.
As described earlier, as a gas expands and crosses the vapor pres- sure curve, condensation commences on existing particles in the flow. Condensation can occur on nuclei of foreign particles (heterogeneous nucleation) or on naturally occurring clusters formed from the parent, gas (homogeneous nucleation). As an equilibrium gas or vapor is slowly cooled, dimers, trimers, and in general N-mers are present in equilibrium concentrations which increase as the temperature is lowered. For a finite expansion rate clusters are formed in the gas, and while their concentration is less than the equilibrium value, the equilibrium concentration is locally being approached at a rate deter- mined by flow properties.
23
AEDC-TR-74-31
It is beyond the scope of the present theory to analytically deter- mine the concentration of these clusters which subsequently serve as nucleation centers. In lieu of this it is assumed that nucleation centers exist in the flow in a given proportion and size. This proportion and size will be determined to best fit the experimental condensation results.
Let the number fraction of condensation nuclei in the uncondensed flow be denoted by E. In other words,
' = N^q ,orP- <pÄ.— ~)
A consequence of assumption six is that the number flux of condensate particles is constant at any point along the stream tube. In other words, a condensation nucleus and later a condensate particle cannot vanish or new ones appear, but can only grow (or decay) at the expense of the gas phase.
This can be described analytically as
NnAV„ = constant £, OO
The relation between number density and mass density is expressed as
m
and B
■ mz
Using these results, one arrives at the final required equation,
p2=-Hr: <12>
Equations (5) through (12) are the basic equations that describe the condensing flow. In order to solve these equations, one must know the following:
1. Flow conditions: m, hQ, A(x)
2. Condensate properties: PV(TC, a), pc, LlTc, a), Cp
3. Gas properties: R, Cp, 7
4. Nucleation parameters: e, z
24

AEDC-TR-74-31
Numerical solutions to these equations will be given later in this report for selected experimental conditions.
3.0 APPARATUS AND PROCEDURE
3.1 4- x 10 ft RESEARCH VACUUM CHAMBER
The 4- x 10-ft Research Vacuum Chamber is a stainless steel vac- uum chamber nominally 4 ft (1.2 in) in diameter and 10 ft (3. 5 m) in length. The chamber is constructed in two sections: a movable section approximately 4 ft (1. 2 m) in length and a stationary section, approxi- mately 6 ft (1. 8 m) in length. For tins test an additional spool piece 1. 5 ft (0. 46 m) in length was used to provide instrumentation ports. For the duration of this test the plume generator was mounted in the movable section, measurements were taken through ports provided in the spool piece, and cryopumping liners were in the stationary section. The arrangement of the three sections and the other chamber-mounted hardware is illustrated in Fig. 3.
Initial pumping capabilities are provided by an 8500-1/min mechan- ical pump for rough pumping and a 15-cm oil diffusion pump for inter- mediate pumping. Final pumping is accomplished by a 20°K gaseous helium (GHe) cryoliner with a liquid nitrogen (LIs'2) cryoliner for a ra- diation shield. The GHe cryoliner provides pumping for the gas from the plume generator.
Gas Inbleed Electron Beam Collector Cup and Laser Dump Port Scattering Optics Bench Port ,-Electron Beam
GHe-Cooled Endplate
^-Millipore Filters Traversing Table
in n n n n rf n mm
u n o ci n 0 u a
LN2
Spectrometer and Laser Entrance Port
Electron Radiation Shield
*Mm GHe Cryoliner Port '
Figure 3. Installation schematic in the 4- x 10-ft Research Vacuum Chamber.
25

A60C-TR-74-31
The traversing table mounted in the movable section provided posi- tioning of the plume generator in three orthogonal directions. Distances of travel were approximately 25 cm parallel to the chamber axis, 38 cm transverse to the axis, and 13 cm vertically. Position readouts were provided by a digital voltmeter to determine the voltage drop across a potentiometer mounted for each table movement. The precision of the axial movement was 0. 013 cm.
A small impact probe mounted in the stationary section of the cham- ber provided a reference point for alignment of the various optical sys- tems and nozzle. The probe was positioned on the centerline of the chamber for alignment and then rotated out of the way during data ac- quisition.
22. NOZZLES AND GAS SUPPLY
Two nozzles were used in the series of experiments. The two noz- zles, nominally of the same throat diameter and expansion ratio, dif- fered in the construction of the exit plane of the nozzle. One of these had its exit plane in the plane of a 3. 8-cm-diam flat plate, was con- structed of stainless steel, and is designated the "FF Nozzle. " The other nozzle had no flat plate in the exit plane, was constructed of black anodized aluminum, and is designated the nAN2 Nozzle. " The actual dimensions of each nozzle were measured by the TSD Precision Inspection Laboratory, and these finished dimensions are shown in Table 1.
Table 1. Nozzle dimensions.
FF AN2
Throat Diameter 0. 112 cm 0. 104 cm
Exit Area Ratio 25 27.6
Half-Angle of Expansion 14.5 deg 14. 5 deg
Figure 4 is a photograph of the FF nozzle mounted on the traversing table before it was painted with black Nextel'for the scattering meas- urements. For the light-scattering measurements the entire nozzle as- sembly with the exception of the throat and expansion section was painted black to minimize spurious light scattering. Visible in Fig. 4 are the mounting block, vertical drive motor, vertical position potentiometer.
26

AEDC TR-74 31
Figure 4. Photograph of FF nozzle installation.
pressure transducer, and Millipore Corporation filter manifold. The nozzle was attached to the mounting block by a standard AM fitting.
Gas was supplied to the plume generator from a manifold of four K-bottles. The gas used in the experiments was of two grades: bone dry and prepurified. The gases had stated purities of 99. 997 and 99. 998 percent, respectively. Although the gas assays for both grades are similar in specification, there are differences in the procedures by which the bottles are filled, possibly giving rise to bottle-by-bottle fluctuations. Some variation of the scattering signal with the gas sup- ply was noted, and this variation is discussed in a following section. Gas was inbled to the nozzle through a 9. 5-mm copper and stainless steel flexible line. A needle valve in the copper line at the manifold provided fine control of the reservoir pressure.
27

AEDC-TR-74-31
The gas was filtered through two 0. 025-/jm Millipore filters mounted in parallel approximately 61 cm upstream of the nozzle. Res- ervoir temperature was determined with a copper constantan thermo- couple, and reservoir pressure was obtained with an absolute pressure transducer. The thermocouple and transducer were mounted approxi- mately 3. 8 cm upstream of the nozzle throat. Details of the gas in- bleed system are shown schematically in Fig. 5.
Chamber Wall
-Bottle Manifold
Regulator
Rapid Shutoff Valve
Needle Valve
10er y—\.
777777%7777777>
Chamber Isolation Valve
Thermocouple Lead
Millipore Filters
i— Nozzl / Mount
Y» Pres L-l Tran
Nozzle and ing Block
Pressure sducer
Figure 5. Gas inbleed system schematic.
3.3 PDP-8F COMPUTER
The PDP-8F computer acquired for data acquisition purposes was used for both the electron beam and the light-scattering measurements. In each case the instrumentation systems described elsewhere in the report were interfaced through the various input media of the computer, and parameters in both analog and digital form were processed by the system. A brief system description is given below.
The central processor is a binary machine with a 12-bit word length and a 4096-word capacity. It has seven basic instructions but includes microprogramming capability that provides programming
28

AEOC-TR-74-31
flexibility. The floating point software package provides better than six-digit accuracy on all computations.
A teleprinter was used as one of the input-output media for the computer. This device provides for printed and paper tape punch out- put and keyboard and paper tape input to the computer. Program prep- aration and input of test constants and control parameters utilized this device.
In addition to the teletype described above, other input-output de- vices incLuded an eight-channel analog multiplexer, an analog-to-digital (A/D) converter, and a digital-to-analog (D/A) converter. The multi- plexer is directly addressable by the computer. The A/D converter is a 10-bit (not including sign) device with computer selectable ranges of 10, 5, 2.5, and 1.25 v full scale. The D/A system is for a 12-bit word length including sign for 10-v output. Conversion rates to 50,000 con- versions/sec are possible.
Digital data, as from the photon counting system, was read in through an input/output buffer register. Each digit from the computer was read in serially and reassembled as a data sample in the computer. Additional input/output bits from the buffer were used for timing and counter synchronization functions.
3.4 ELECTRON BEAM AND SPECTROMETER
The electron beam system employed in the investigation was simi- lar in mechanical design to that described in Ref. 20. "The electron source was an RCA model VC2126 V4 electron gun mounted in a stain- less steel housing at the bottom of the chamber, and the beam was di- rected vertically upwards as shown in Fig. 6. The beam was injected into the chamber and flow field through a 1. 0-mm-diam orifice and was magnetically focused to provide a small-diameter beam source at the centerline of the cell and flow field. The injection orifice was lo- cated approximately 50 cm from the chamber centerline. A 15-cm dif- fusion pump with a LN2-cooled baffle maintained the electron gun pres- sure at less than 2 x 10"5 torr. Modification of the gun power supply enabled use of a beam energy of 30 keV and a 1. 0-ma current. The beam collector cup was similar to that described and shown in Ref. 21 except that the length used here was 34 cm. The distance from the plume axial centerline to the first grid of the collector cup was 30 cm. Coarse vertical alignment of the gun exit orifice, collector cup, and
29
AEDC-TR-74 31
Gun and Collection Current
Ammeters
Teletype PDP-8F
Computer
4- x 10-ft Chamber Nozzle Flow into Paper
Quartz Window-i
Counter
Disc. Rate- Meter
Strip Chart
Electron Gun Power
Supply
PM Power Supply
Scan Control
3/4-m Spectrometer
PM Thermoelectric
Cooler
¥
Figure 6. Optical and electronic arrangement for electron beam measurements.
pitot probe, which served as a plume centerline reference point, was performed with a plumb bob.
To obtain flow visualization photographs, a sweep-deflection coil was situated external to the exit orifice. By means of control circuitry and a ramp generator power supply the deflection coil repetitively swept tin In am along the flow centerline. The maximum sweep angle was set as desired, and the repetitive sweeping of the beam provided fluorescence which was photographed using a stationary camera and time exposures.
To obtain density and rotational temperature data, the beam was maintained stationary vertically and the beam-excited fluorescence of the gas was transmitted to a 0. 75-m Spex scanning spectrometer through a 25-cm focal length glass lens apertured to a 4. 5-cm diam. The optics and spectrometer were matched in f-number, and the overall magnifi- cation of the system was 0. 6. For the measurement of N2 density a glass Dove prism was situated near the entrance slit. The beam image was thus rotated 90 deg with respect to the slit orientation. In this man- ner the beam width was always kept smaller than the 6-mm entrance slit height, and density measurements were independent of the beam fluorescence width. The IV^ density measurements were consequently
30
AEDC-TR-74-31
obtained with an effective spatial resolution of 10 mm along the flow- field centerline, and for the far-field region of the flow where the den- sity gradients are small, this resolution is adequate. However, one must evaluate the effects of a finite slit length and the density gradient in the near field of the plume on the measured value of gas density. If one expands to second order the gas density in a Taylor series about the axial position, x0, it is easily seen that the difference in intensity, AI/IOJ between a flow with density gradient and one without, is given by
AI/I0 - CV7No)(S?/24)
where N5 = (82N/8x2)x and 5\ is the slit length along the flow. As-
suming an inverse x^ dependence on N, it follows that
AI/I0 - t(VD)/2<V/D)]2
Assuming the electron beam fluorescence diameter is 5 mm and is imaged within the 10-mm slit length, then for a 1-mm source diameter,
AI/I0 = [2,5/(x0/D)]2
Therefore, for a correction of 10 percent or less it is seen that x0/D £ 8; this condition is satisfied for all reported data. For some of the rotational temperature measurements the Dove prism was removed, and a 1-mm entrance slit height was set to obtain adequate spatial reso- lution. The first two R-branch lines of the N2 First Negative System were completely resolved in first order using 20-^m entrance and exit slit widths and a 1200 groove/mm grating blazed at 3000 A. Wave- length scan rates were from 2 to 3 A/min.
An EMI 6256S and an ITT FW 130 photomultiplier tube were both utilized as detectors in conjunction with the spectrometer. The 6256S has an "SM (Q) spectral response, which is a maximum at about 3800 A, and it was operated at 1500 v and -20°C. The FW 130 has an S-20 spec- tral response with maximum near 4200 Ä, and it was operated at 1800 v and -30°C. Signal-to-noise ratios were greatly improved by cooling the photomultiplier; in the case of the 6256S the signal-to-noise ratio was 100 times greater at -30°C than at 20°C.
The photon-counting system consisted of the following Ortec in- struments: Model 454 timing filter amplifier, Model 100 MHz discrimi- nator, Model 441 ratemeter, and Model 715 dual counter/timer. Two
31
AEDC-TR-74-31
methods of data recording were employed. The first method consisted of a Honeywell Electronik 19 strip chart recorder registration of the analog output of the ratemeter. The other method utilized the PDP-8F computer to acquire the output data from the counter/timer. A more detailed description of the on-line computer acquisition and analysis procedures will be given in following sections. A 50-f2 photomultiplier output load resistor and maximum amplification of the electronic pro- cessing system were used. Discriminator voltage selections were carefully determined to provide for optimum balance between count rate and sufficiently high signal-to-noise ratios.
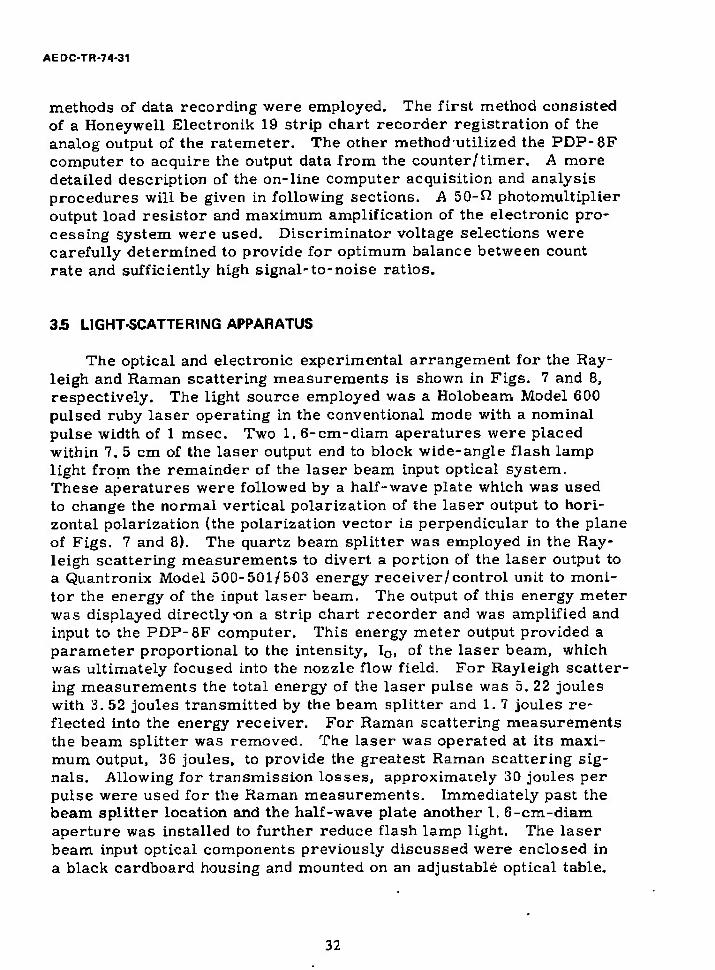
3.5 LIGHT-SCATTERING APPARATUS
The optical and electronic experimental arrangement for the Ray- leigh and Raman scattering measurements is shown in Figs. 7 and 8, respectively. The light source employed was a Holobeam Model 600 pulsed ruby laser operating in the conventional mode with a nominal pulse width of 1 msec. Two 1. 6-cm-diam aperatures were placed within 7. 5 cm of the laser output end to block wide-angle flash lamp light from the remainder of the laser beam input optical system. These aperatures were followed by a half-wave plate which was used to change the normal verticaL polarization of the laser output to hori- zontal polarization (the polarization vector is perpendicular to the plane of Figs. 7 and 8). The quartz beam splitter was employed in the Ray- leigh scattering measurements to divert a portion of the laser output to a Quantronix Model 500-501/503 energy receiver/control unit to moni- tor the energy of the input laser beam. The output of this energy meter was displayed directly «on a strip chart recorder and was amplified and input to the PDP-8F computer. This energy meter output provided a parameter proportional to the intensity, I0l of the laser beam, which was ultimately focused into the nozzle flow field. For Rayleigh scatter- ing measurements the total energy of the laser pulse was 5. 22 joules with 3. 52 joules transmitted by the beam splitter and 1. 7 joules re- flected into the energy receiver. For Raman scattering measurements the beam splitter was removed. The Laser was operated at its maxi- mum output, 36 joules, to provide the greatest Raman scattering sig- naLs. Allowing for transmission losses, approximately 30 joules per pulse were used for the Raman measurements. Immediately past the beam splitter location and the half-wave plate another 1. 6-cm-diam aperture was installed to further reduce flash lamp light. The laser beam input optical components previously discussed were enclosed in a black cardboard housing and mounted on an adjustable optical table.
32
PM Power
Water -—« Filter
Water
Photon-Counting Equipment
Light - Shields—C
Power to Thermo-Elec. PM Housing
PM Housing Window Heater
,-Thermoelectrically * Cooled Photomultiplier
Housing Filter
-Polaroid
Collection Lens
Black Flocking^ Viewing Dump
■4-x 10-ft Chamber Nozzle Flow into Paper
Energy Meter
Control^ CD- -L_£nergyMeter
r yfifc
Aperture / / V ^ Beamsplitter^
Brewster Window
Laser res
1/2-Wave Plate
Closed Cycle Water Cooling
Figure 7. Optical and electronic arrangement for Rayleigh scattering
measurements.
> m D n
■
H a

Thermoeledncally Cooled Photomultiplier Housing
Photon-Counting Equipment
> T 0 o
Energy Meter Control -•» I I f ... . 1—' [_ f«—Lner-jy Meter
*i ~7T^T3
Beam Brewster Window
Aperture / / j/h f* »m Splitter-' / ^APer,u
Laser res
1/2-Wave Plate
Black F locking - -Viewing Dump
■ 4- x 10» Chamber Nozzle Flow into Paper
Closed Cycle Water Cooling
Figure 8. Optical and electronic arrangement for Raman
scattering measurements.

AEDC-TR-74-31
The laser beam was passed through a schlieren quality pyrex win- dow set at the Brewster angle and was focused approximately onto the chamber centerline by a quartz lens 7. 5 cm in diameter and 51 cm in focal length- The lens was mounted inside the chamber and was aper- tured to 3. 2 cm on the input face. The output lens face was apertured to 1. 25 cm and was attached to a black cardboard tube 32. 5 cm in length. The end of the tube was apertured to 0. 95 cm. This final laser input aperture was located 15 cm from the laser focal volume. As the laser beam defocused, it entered a laser dump, the first portion of which was a black cardboard tube which extended into the chamber to 22. 5 cm from the chamber centerline. The latter stage of the dump was a black ano- dized aluminum conical section, capped with a black anodized aluminum conical tip piece.
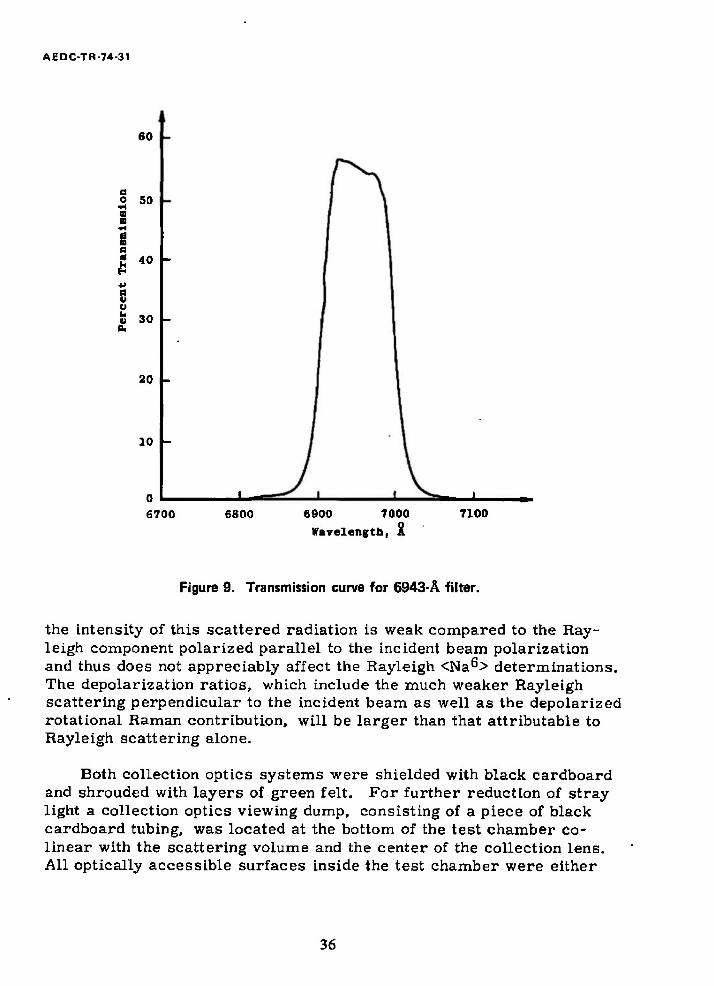
The focal region of the laser beam was located at the focal point of the collection optics system, which was oriented at 90 deg with respect to the flow-field axis and laser beam. For the Rayleigh scattering measurements the scattering volume was viewed through a glass port by a glass lens 75 mm in diameter with a 200-mm focal length, and for the Raman scattering measurements viewing was accomplished through a glass lens 127 mm in diameter with a 240-mm focal length. The col- lected Rayleigh scattering signal was transmitted through a small piece of HN-22 Polaroid material with the polarization direction normally parallel to that of the laser beam (perpendicular to the scattering plane) and then through a 6943-A pass interference filter of 100-Ä half width (see Fig. 9 for transmission curve). The signal was focused onto a 0. 12-cm-diam aperture attached to the face of a Products for Research, Inc. thermoelectrically cooled photomultiplier housing. Collected Raman scattered radiation was transmitted through a high-pass filter which partially rejected the 6943-A Rayleigh scattered radiation (see Fig. 10 for transmission curve) and an approximately 50-A half-width interfer- ence filter with maximum transmission at the N2AV = +1 Stokes vibration-rotation band center at 8284 A (see Fig. 11 for filter trans- mission curve). The filtered Raman radiation was then focused onto... the entrance aperture of a JACO 1/4-m spectrometer timed to 8284 A, A small lens at the exit of the spectrometer partially focused the pure Raman radiation onto the photomultiplier tube. The detection element for both Rayleigh and Raman scattering measurements was an RCA C31000F photomultiplier tube cooled to -26°C.
It should be noted that using a 100-A half-width filter for the Ray- leigh scattering measurements means that these measurements include contributions from the pure rotational Raman scattering. However,
35
AEDC-TR-74-31
a o
g a
s u u V a.
60
50
40
30
20 -
10
X 6700 6800 6900 7000
Wavelength, X
7100
Figure 9. Transmission curve for 6943-Ä filter.
the intensity of this scattered radiation is weak compared to the Ray- leigh component polarized parallel to the incident beam polarization and thus does not appreciably affect the Rayleigh <Na^> determinations. The depolarization ratios, which include the much weaker Rayleigh scattering perpendicular to the incident beam as well as the depolarized rotational Raman contribution, will be larger than that attributable to Rayleigh scattering alone.
Both collection optics systems were shielded with black cardboard and shrouded with layers of green felt. For further reduction of stray light a collection optics viewing dump, consisting of a piece of black cardboard tubing, was located at the bottom of the test chamber co- linear with the scattering volume and the center of the collection lens. All optically accessible surfaces inside the test chamber were either
36

AEDC-TR-74-31
7000 8000
Wavelength, A
9000
Figure 10. Transmission curve for 6943-Ä rejection filter.
painted with black Nextel®or covered with a black flocking material. For the Rayleigh scattering measurements an additional 25.4-cm length of black cardboard tubing was attached to the interior side of the collection optics view port, and a 3. 8-cm-diam aperture was mount- ed on the end of this tube to restrict the field of view of the collection optics.
The combination of input laser beam optics and the collection optics provided a spatial resolution of approximately 0. 5 to 1 mm**.
37

AEDC-TR-74-31
8200 8300
Wavelength, %
Figure 11. Transmission curve for 8284-A filter
8400
Both charge storage and photon-counting schemes were used to process the output signal of the photomultiplier, which was proportional to the scattered light intensity, Is. For the majority of the Rayleigh scattering measurements the output of the photomultiplier tube was pre- amplified and input to a gated integrator (a modified Box Car Integrator). The laser power supply source provided a firing trigger pulse to the integrator, and after a proper time delay the integrator gate pulse was initiated. The pulse width was adjusted so that the photomultiplier tube output was integrated only during the desired interval of the laser pulse. During all other times the integrator detects essentially no input signal so that it holds the results of the last integration until reconnected to the input signal. The sensitivity of the gated integrator was changed
38

AEDC-TR-74-31
through various integration time constant selections. The signal output of the gated integrator was displayed on a strip chart recorder as well as input to the PDP-8F computer.
For Raman scattering and low intensity Rayleigh scattering meas- urements the Ortec photon-counting system described in Section 3.4 was used. The output of the photo multiplier was coupled through a 50- H load resistor to the photon-counting system, and the counting time interval was controlled by the gate output of the gated integrator so that photon counting occurred only during the laser pulse.
3.6 ELECTRON BEAM MEASUREMENTS PROCEDURE
Prior to flow-field data acquisition it was necessary to establish the location of the electron beam relative to the nozzle, and additionally, to determine the direction of the flow-field centerline, which was not necessarily colinear with the chamber axial centerline. The axial po- sition of the nozzle exit plane relative to the electron beam was estab- lished initially by the use of a plumb bob for the approximate vertical alignment of the collector cup and gun exit orifice with the pitot probe. During chamber operation the nozzle axial zero position relative to the pitot probe was established by driving the nozzle to the point of contact with the pitot probe as observed through a jig transit. The nozzle was then withdrawn axialiy, the pitot probe rotated out of the way, and the electron beam operated and adjusted spatially to provide peak current in the collector cup. Asa check against the axial zero position of the nozzle as established by the probe, the nozzle was driven forward into the electron beam until the collector current had been reduced to 50 percent of its peak value, This position agreed within ±0. 05 cm with the zero position established relative to the pitot probe.
The transverse and vertical positions of the plume centerline rela- tive to the spectrometer were established by recording the photon count rate as a function of the nozzle transverse and vertical positions. The point of maximum count rate was taken to be the centerline position at the axial position. This procedure was repeated at each of several axial positions covering the axial range to ensure knowledge of the plume cen- terline relative to the electron beam and spectrometer positions. In all cases variation of this transverse and vertical position was slight or nonexistent.
39

AEDC-TR-74-31
3.6.1 Rotational Temperature
Rotational temperature data acquisition was accomplished by two methods, strip chart or analog recording and computer data acquisition, each of which is discussed below.
Using analog recording at each position in the flow for which data were acquired, background deflections for each scale position of the ratemeter were recorded at 3918 A. This wavelength location was de- cs ° o void of any impurity radiation and yet was only 4 A from the 3914-A (0,0) bandhead, thereby precluding any wavelength-dependent effects on the background measurement. For temperature measurements only, the P-branch was bypassed and the spectral scan begun at approximately the band origin at 3910 A, and scanning was concluded at approximately 3900 A. No spectral sensitivity corrections were required over this wavelength interval.
The ratemeter scale factors were selected to obtain maximum chart deflections for each line, and the ratemeter was linear over the ranges selected. The time constant associated with the standard devi- ation selector of the ratemeter was kept equal to or less than 0. 5 sec. Because the time constant is a function of the scale factor, the two switches were changed together. Background-corrected peak heights of the emission lines were used in computer program TROT (Ref. 21) to calculate the rotational temperature from the Boltzmann plot as de^ scribed in the just-mentioned reference of the experimental data.
Ideally, if the N2 rotational mode is described by a Boltzmann dis- tribution function, the experimental data processed by-program TROT will yield a straight line on a Boltzmann plot. The rotational tempera- ture follows immediately from the slope of the data. It has been found in some cases that the data from the higher quantum states tend to de- part from the least squares line in a manner, to indicate that they are overpopulated. It should be noted that the inability to ascribe a unique temperature to an internal mode of motion undergoing a nonequilibrium process such as relaxation or condensation is not surprising. Only two types of systems relax through a manifold of states characterized by a Boltzmann distribution, the harmonic oscillator and the two-state sys- tem. The rotational mode, of course, is neither of these. However, the energy possessed by the non-Boltzmann mode is still determinable. To enable assessements of the non-Boltzmann character of the rotational distribution to be made and to be able to ascribe an effective temperature, TR, to the mode, which is related to the molar rotational energy by RTR,
40

AEDC-TR-74-31
the data reduction scheme in program TROT is such that the rotational temperature is first calculated utilizing the first two lines, then the first three, etc., so that the overpopulated lines may be discerned and discarded before they influence the temperature calculation. For the low rotational temperatures encountered in these measurements, de- partures from a straight line began to occur with the fourth to seventh rotational lines.
A computer program that weighed each line according to its inten- sity and calculated a rotational temperature was developed for the latter part of the measurements. Since stronger lines had larger signal-to- noise ratios, more weight was given to them. The rotational tempera- ture from a five-line weighted average was generally taken.
During the course of the measurements the PDP-8F computer be- came available for on-line data acquisition. The data acquistion pro- gram employed included provisions for spectral background measure- ments, measurement of R-branch peak amplitudes and wavelengths, real-time calculations of rotational temperatures, and normalization of the data for variation of the electron beam current. Additionally, provisions were made for gas density measurement and calibration.
The spectrometer data were acquired through the digital input buf- fer from the Ortec photon-counting equipment. A variable sampling in- terval was available and was chosen for compatibility with the spectro- meter scanning speed and signal intensity. The line wavelength was de- termined from the time measurement which was read into the computer along with the spectrometer data. The Ortec B counter was used in the 0. 1-sec clock mode. The spectrometer starting wavelength and scan speed were input manually via the keyboard so that the wavelength of the individual lines could be identified.
An average background count was determined by accumulating counts for several sampling intervals and dividing by the number of samples taken. A background wavelength interval was specified via the keyboard. Similarly, the wavelength intervals for density and tempera- ture measurements were input to the computer. Density was deter- mined by accumulating the count over the specified interval correspond- ing to the first N2 First Negative (0,0) band and multiplying by an ap- propriate constant. This constant was determined by performing a cali- bration scan when the chamber was at a static, known pressure and tem- perature condition.
41

AEDC-TR-74-31
The line amplitudes were determined by selecting the maximum value that existed between a specified number of monotonically decreas- samples. The number of samples used to identify a positive or negative slope was variable and was generally chosen as 3. This approach was taken to isolate false peaks caused by noise. Although three samples for a slope identifier occasionally gave false peaks, this number of samples was chosen for sensitivity purposes. Real and false lines were identifiable by inspection of the associated wavelength.
For the purpose of obtaining real-time temperature results from the spectral data, ratios of individual R-branch rotational line intensi- ties of the N^j First Negative (0,0) band were used. Theoretical calcu- lations of the electron beam-induced fluorescence of the N2 First Nega- tive (0,0) band were performed using the spectrometer dispersion, en- trance and exit slit width values. Ratios of the rotational line intensi- ties of the K ■ 1 and 3 levels and the K = 3 and 7 levels were expressed as a function of TR over the TR ranges from 10° to 70°K and from 50° to 150°K, respectively. Figure 12 shows the TR variation of these ra- tios. The rotational temperature was calculated on-line by the computer using the equations
(10° to 70°K)
and
TR-
TR - 107
"•■«»♦«.1$ (50° to 150° K)
where R(l), R(3), and R(7) are the rotational line intensities of the transitions from the K = 1, 3, and 7 rotational levels, respectively. Sufficient computer storage was not available to use multiple-line least- squares curve fits for temperature determination. However, the above curves were adequate to the extent that temperature errors of less than 2°K were obtained when the curves were compared to least-squares cal- culations.
Redundancy in data acquisition was provided for the temperature measurements by simultaneously recording spectral intensity data with the PDP-8F and with the strip chart recorder. This redundancy was provident in that low density and low intensity data acquired by the PDP- 8F often provided false peaks as a result of the small number of points used for peak detection.
42

AEDC-TR-74-31
100 I-
10.0
.2 %
2 .2
1.0
0.1
O R(l)/R{3), 10°K < TR < 70°K
A R(3)/R(7). 50°K < TR < 150°K
RU) RÖ)
20 -L
40 60
TR.°K
80 100 120
Figure 12. Variation of rotational line intensity ratios R(1)/R(3) and R(3)/R{7)withTB.
43
AEDC-TR-74-31
3.6.2 Density Measurements
The intensity of the entire (0,0) band is independent of rotational temperature, whereas the intensity ratio of its components, the P- and R-branches, is not. Therefore, since the rotational temperatures of calibration and plume flow field are different, it was necessary to scan both the P- and the R-branches for density measurements. Also needed were calibrations in N2 gas of known densities, accurate measurements of spectrometer scan rate and collector current, and use of a Dove prism to prevent loss of light at the entrance slit due to electron beam spreading.
For a calibration, the chamber was filled with N2 gas at static pressures measured by calibrated alphatrons. No nozzle flow existed. With identical slit settings and scan rates and with collector currents similar to those used in the experiment, the entire (0,0) band was scanned and the resultant net counts summed by the PDP-8F computer. A counter/timer accumulated count was used before utilization of the PDP-8F. Since the number of net counts was inversely proportional to the scan rate, and since the scan rate varied slightly from scan to scan, the product of net counts, normalized to 1 ma, and scan rate plotted as a function of static density formed the calibration curve. A calibration constant was then calculated from the slope of a least-squares line through the points. Static pressures were limited to a maximum of 5 x 10"2 torr to prevent the pressure inside the electron gun for exceed- ing 2 x 10"5 torr. The estimated accuracy of the alphatron pressure measurement and hence the density measurement was ±10 percent. Three calibrations were performed in the course of the measurements.
The flow-field density data were acquired in the same manner as the calibration measurement. Spectral scans were begun at approxi- mately 3918 A, and only background signals were detected until the 3914-A bandhead was reached. The scan was continued through both the P- and R-branches, and the total count number, corrected for back- ground and current variation, which was essentially nonexistent, was used for N2 gas density determination. When the PDP-8F data acqui- sition method was used, the rotational temperature was acquired simul- taneously with the density measurements by activation of the peak de- tection algorithm of the computer. All data were displayed on the tele- printer.
44

AEDC-TR-74-31
3.7 LIGHT-SCATTERING MEASUREMENTS PROCEDURE
Alignment of the laser beam focal volume with the focal point of the collection lens was necessary before actual scattering measure- ments began. Initially the small-diameter pitot probe was swung into a position that placed it on the centerline of the test chamber. A small incandescent light with frosted bulb was placed just below the tip of the pitot probe with the flat (top) surface of the bulb just touching the under- side of the probe tip. The center of the circular bulb face was located 0. 159 cm from the probe tip and colinear with the probe. Collection optics were adjusted in such a manner that the image of the lighted bulb was in focus and centered on the aperture defining the scattered volume. With the light bulb removed, small pieces of developed but unexposed Polaroid film were attached to the pitot probe tip with the plane of the film surface perpendicular to the laser beam path. The laser was op- erated at low energy, and its position was adjusted so that the small- diameter laser ''burn" patterns on the film were ultimately centered on the axis of the pitot probe 0. 159 cm from the probe tip. Fine adjust- ment was accomplished by adjusting the horizontal position of the laser to achieve maximum photomultiplier output as it detected the Rayleigh scattering from the air within the chamber.
In order to relate the measured relative scattering intensities, (Is/I0)s, to values of <Ma6> and N, calibrations had to be performed. For each calibration the test chamber was evacuated at room tempera- ture. After the chamber pressure had decreased below 0.05 torr, the laser was operated to determine the background (or zero-pressure) relative intensity. For Rayleigh scattering the background intensity was primarily attributable to detection of laser light scattered from optical and chamber surfaces; however, for Raman scattering the back- ground intensity was entirely the result of photomultiplier dark current. After the chamber vacuum pumps were valved off, nitrogen was slowly leaked into the chamber through the nozzle gas flow system until the chamber pressure came to some predetermined value. The chamber was then allowed to remain quiescent for 5 to 10 minutes. Rayleigh scattering intensity measurements were made at pressures of 50, 200, and 400 torr as indicated by a calibrated Wallace and Tiernan gage, whereas for Raman calibration measurements the pressures were set at 12, 200, and 400 torr. Typical calibration plots of the background- adjusted Rayleigh and Raman scattering are shown in Figs. 13 and 14, respectively. It is seen from these figures that the scattering relative intensity, (Is/I0)s> was linear with pressure at constant temperature and was quite repeatable.
45

AEDC-TR-74-31
It/* LO1 102 It? Poi torr
Figure 13. Typical calibration plot for Rayleigh scattering.
1000 -
s 100 - c
s & S < J" 10
11 i i vL i i i i mil ■ ' ■ ■ i i 11 mil 1 ID 100 1000
P0, torr
Figure 14. Typical calibration plot for Raman scattering.
i 11 mi
46
AEDC-TH-74-31
The 200-torr calibration point was used as the point from which calibration factors were determined. The calibration factors for the Rayleigh scattering measurements were determined using the simple relation
<Ws°0lCFl = N(200t)aö
where
N(200 t) = number density of N2 at 200 torr and room temperature, in units of cm*
o a = nominal radiua of the N, molecule, 1.855 A (Ref. 22)
(ls/ID)8 s the scattered relative intensity from N2 at 200 torr and
room temperature
n
Cpj = the calibration factor, in units of cm
The calibration factor for Raman scattering was determined simi- larly from
(I8/g200,CF2 = tM(200torr)
where Cp2 i-s expressed in units of cra"^ per count.
For actual flow-field measurements the location of the nozzle exit plane relative to the observed scattering volume had to be accurately known. The axial location of the exit plane was readily determined by using the jig transit to determine the point at which the nozzle exit just touched the pitot probe tip. The nozzle axial position indicator reading in inches less 1/16 in. gave the axial zero position indicator reading. The vertical and radial zero positions were measured by establishing a nozzle flow field, making vertical and radial intensity profile meas- urements, and determining the zero positions from the flow-field sym- metry.
For Rayleigh scattering flow-field measurements the PDP-8F com- puter was normally utilized. The procedure for the measurements was as follows:
1. The nozzle position was set and recorded by hand on the PDP-8F teleprinter output.
47

AEOC-TR-7431
2. With no nozzle flow established, the laser shot number and gated integrator range setting were input to the PDP-8F computer through the teleprinter keyboard.
3. The integrator and energy meter were nulled.
4. The laser power supply was charged, and the laser was fired to record the background intensity.
5. With the nozzle flow stablized at the desired reservoir pressure, steps 2 through 4 were repeated.
A total intensity measurement was thus recorded by the computer, range was adjusted, and background was corrected. The resulting Rayleigh scattered relative intensity was then displayed by the tele- printer.
The energy meter measured a fraction of the laser output energy for each shot to monitor the input energy fluctuations. For this pur- pose the PDP-8F computer was used with a gated integrator, and the scattered signal integrator output was divided by the output of the energy meter. Since the energy meter and gated integrator are subject to con- siderable drift, an initial value taken immediately before the laser pulse must be read and subtracted from the value read immediately after the laser pulse. The zero shift in the energy meter can result from a cool- ing of the calorimeter as it is returning to its equilibrium condition after a laser shot. Drift in the integrator can result for selection of a high gain condition. An interval of approximately 500 lusec is required for delay between receipt of laser synchronous pulse and the actual laser energy pulse. This is ample time for acquisition of the instru- ment initial values via the analog-to-digital converter before the instru- ments respond to the laser energy pulse. Final values are taken im- mediately after the laser pulse is terminated, and the timing functions are provided by the integrator and oscilloscope gate pulses. The laser energy was determined using a peak detection algorithm which was simi- lar to that employed in the electron beam temperature measurements. However, in this case 64 increasing and decreasing values were used to define the peak height. It is to be noted that the energy meter re- sponse time was approximately 5 sec, which is compatible with the maximum firing repetition rate of the laser of one pulse per 10 sec.
Experiments showed that when the nozzle exit was greater than 2. 54 cm from the scattering volume, the background signal was not a function of nozzle position. Therefore, the background signal at these
48
AEDC-TR-74-31
positions were recorded only periodically» However, at axial positions within 2. 54 cm of the nozzle exit the background scattering was a func- tion of nozzle axial position, but it was not a function of radial position over the range of radial positions used at these close axial positions. Recording of the background signal was therefore required for each axial position within 2. 54 cm of the nozzle exit.
The photon-counting system was utilized for Raman scattering flow-field measurements. The measurement procedure was as follows:
1. The nozzle position was set and recorded.
2. With no nozzle flow and with the chamber evacuated to 10" 5 torr or less, the laser power supply was charged to its maximum, and the laser was fired repetitively in order to record a sufficiently large number of photon counts for good precision. The average number of counts per laser firing gave the back-ground signal,
3. With the nozzle flow stabilized at the desired reservoir pressure, step 2 was repeated, and the average number of counts per firing minus the background signal gave the Raman scattered relative intensity in average counts per laser firing.
Experiments showed that for scattering volume axial positions greater than 0. 635 cm from the nozzle exit the Raman background sig- nal was not a function of nozzle position. Furthermore, the background signal was completely independent of the magnitude of the Rayleigh scat- tered intensity; that is, the combination of high-pass.filter, Raman Stokes band filter, and 0. 25-m spectrometer had completely rejected the Rayleigh scattered signal. This fact was evident when (1) the noz- zle reservoir pressure and position were adjusted to give maximum flow-field Rayleigh scattering, (2) the spectrometer wavelength setting was moved off the Raman band center and 100 A closer to the Rayleigh line, and (3) the measured signal remained the same as the background signal. Only for axial positions within 0. 635 cm of the nozzle exit did the radiation scattered from the nozzle become intense enough to in- crease the background signal. All Raman measurements were made for axial positions greater than or equal to 0. 635 cm; therefore, the background signal was recorded only periodically.
49

AEDC-TR-74-31
4.0 RESULTS AND DISCUSSION
4.1 TEST CONDITIONS
4.1.1 Experimental Conditions
The experimental Investigation was performed over the range of reservoir pressure from 51.7 to 7755 torr (1 to 150 psia) for a reser- voir temperature of approximately 280°K. This range of reservoir pressure was sufficient to ensure that observations were made of flow fields ranging from no condensation to those of suspected massive con- densation. Moreover the lowest PQ value, 51.7 torr, as will be shown, produced not only an uncondensed flow field but also one for which ro- tational relaxation effects were significant. Two different conical ex- pansion nozzles were studied, and they are designated, as previously mentioned, FF and AN2. These nozzles are described in Section 3. 2, and their dimensions are shown in Table 1. For each of these nozzles experimental data were acquired for the axial range 14 <.x/D < 220, and radial profile data were obtained when experimentally feasible.
For gross characterization of the flow-field properties, electron beam fluorescence flow visualization was performed for the FF nozzle. The reservoir pressure was varied over the range from 760 to 7905 torr at 280°K for the photographic data acquisition. A wide axial dis- tance range as well as the complete radial range was observed.
The electron beam fluorescence technique was used to obtain spatially resolved measurements of gas number density and rotational temperature of N2. The reservoir pressure range investigated using electron beam diagnostics was from 51.7 to 7755 torr. The axial spatial profile data acquistion region depended upon the reservoir pres- sure being studied, and generally no data acquired in a spatial region for which the gas density exceeded 2 x 1016 cm"3 are reported herein. Radial profile data of both density and temperature were acquired if the gas density was 'sufficiently large for precise measurements to be made.
Additional measurements of N2 density were performed for the near field of the nozzle expansion using laser-Raman scattering. Axial profile data were acquired for the 760-.to 7755-torr reservoir pressure range. Radial profile data were obtained for P0 = 7755 torr at the axial
50
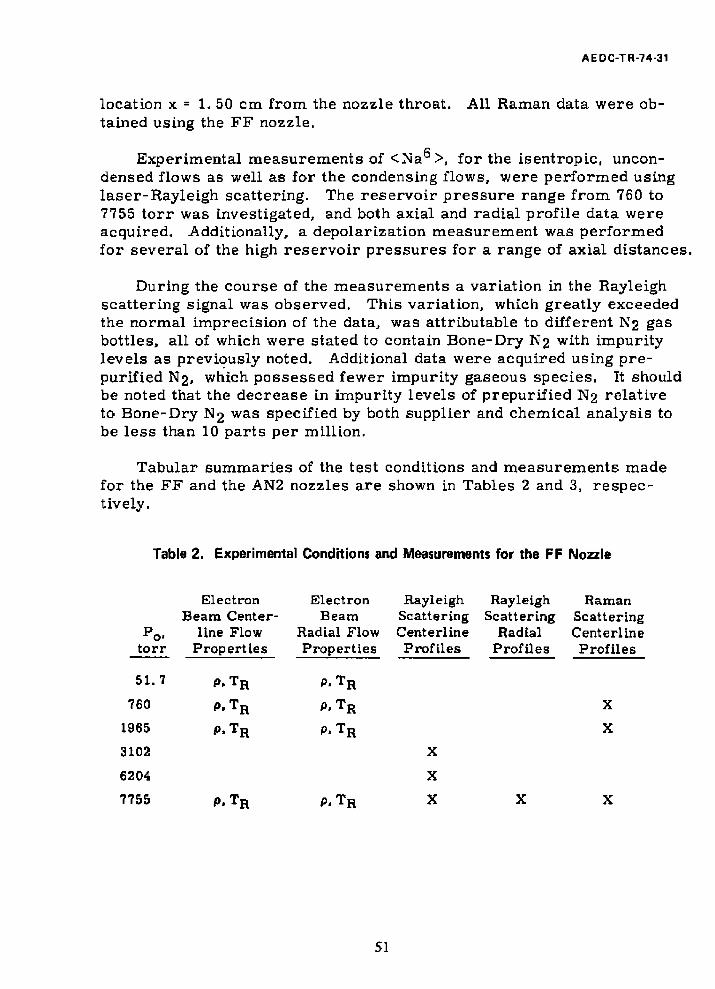
location x = 1. 50 cm from the nozzle throat, tained using the FF nozzle.
AEDC-TR-74-31
All Raman data were ob-
Experimental measurements of <Na°>, for the isentropic, uncon- densed flows as well as for the condensing flows, were performed using laser-Rayleigh scattering. The reservoir pressure range from. 760 to 7755 torr was investigated, and both axial and radial profile data were acquired. Additionally, a depolarization measurement was performed for several of the high reservoir pressures for a range of axial distances.
During the course of the measurements a variation in the Rayleigh scattering signal was observed. This variation, which greatly exceeded the normal imprecision of the data, was attributable to different N2 gas bottles, all of which were stated to contain Bone-Dry N2 with impurity levels as previously noted. Additional data were acquired using pre- purified N2, which possessed fewer impurity gaseous species. It should be noted that the decrease in impurity levels of prepurified N2 relative to Bone-Dry N2 was specified by both supplier and chemical analysis to be less than 10 parts per million.
Tabular summaries of the test conditions and measurements made for the FF and the AN2 nozzles are shown in Tables 2 and 3, respec- tively.
Table 2. Experimental Conditions and Measurements for the FF Nozzle
Po- torr
Electron Beam Center-
line Flow Properties
Electron Beam
Radial Flow Properties
Rayleigh Scattering Centerline Profiles
Rayleigh Scattering
Radial Profiles
Raman Scattering Centerline Profiles
51.7 P-TR P-TR 760 P.TR P-TR X
1965 P.TR P.TR X
3102 X
6204 X
7755 P. To P.TR X X X
51

AEDC-TH-74-31
Table 3. Experimental Conditions and Measurements for the AN2 Nozzle
Po. torr
Electron Beam Center-
line Flow Properties
Electron Beam
Radial Flow Properties
Rayleigh Scattering Centerline Profiles
Rayleigh Scattering
Radial Profiles
760 P.TR TR
1965 X
2274 X
2585 X
3102 X
4136 X
6204 P.TR TR X X
7755 P,TR TR X X
4.1.2 tsentropic Plume Calculations
Theoretical predictions of isentropic plume properties were calcu- lated by the well-known inviscid method of characteristics (MOC). The numerical MOC program used to calculate plume properties was devel- oped by Lockheed and is reported in Ref. 23. This program was run at AEDC on an IBM 370/155 computer for the nozzle flow conditions tested. These calculations were made only for the flow field external to the aero- dynamic nozzle. For the internal nozzle flow, the boundary layer was calculated and the resultant nozzle exit conditions were calculated using a program developed by D. L. Whitfield and reported in Ref. 24.
There is some slight compromise necessary to couple the results of the boundary-layer program to the MOC free expansion. There is a small region near the nozzle wall where the boundary layer is subsonic, but the MOC calculation is defined only if the entire flow field is super- sonic. Further, experimental evidence (Ref. 25) obtained in a low den- sity nozzle shows that for an unbalanced nozzle flow (ambient and static pressures are unequal at the nozzle exit) the ambient conditions can propagate upstream through the subsonic portion of the boundary layer and thereby affect the supersonic flow. However, for the condition of
52

AEDC-TR-74-31
the nozzle flow discharging into a low pressure environment, as is the case reported here, the subsonic portion of the boundary layer is ac- celerated until the low pressure environment is not in fact felt upstream. This means that the flow is entirely supersonic at the nozzle exit. Thus, in order to obtain the desired nozzle exit conditions, it is assumed that at the nozzle wall the Mach number approaches 1. 01 and is faired into the calculated distribution so that for M£ 2 the calculated value is used.
The calculated pressure at the nozzle exit and the Mach number distribution were used to completely determine the flow properties at the nozzle exit for a given stagnation pressure and temperature. These properties were then used as the starting line input for the Lockheed MOC calculations which were run for the various conditions. These computations are the basis for the theoretical MOC curves shown on various figures throughout the remainder of this report.
Although the two nozzles were quite similar in dimensions, a priori knowledge of the effect of the flat plate in the exit plane of the FE rioz- zle was not assumed. Rather, calculations were made using the geom- etry of each nozzle, including simulation of the flat plate for the FF nozzle. The resultant calculations showed little discernible differ- ence between the two nozzles along the centerline of the plume when the parameters were normalized by the-reservoir conditions and axial distance was normalized by the throat diameter. There were, however, differences in the radial profiles of the plume from the two nozzles. Hence, through the remainder of this report, measurements from both the FF and the-AN2 nozzles are compared to a single theoretical curve for centerline profiles but are separately compared for radial profiles.
4.1.3 Condensation Calculations
The equations describing the basic condensation phenomenon were developed in Section 2. 3 in Eqs. (4) through (11). These equations were numerically solved on an SDS 9300 digital computer. A brief de- scription of the numerical values used in the calculation follows.
It was assumed that the condensation effects are not coupled to the flow-field calculations. Therefore, an effective area for the one- dimensional condensation calculation can be obtained from the method- of-characteristics calculation. For one-dimensional flow the absolute magnitude of the cross-sectional area of the stream tube is immaterial, and, for convenience, a stream tube is so chosen that the cross section at the sonic point is unity.
53

AEDC-TR-74-31
The total mass flux in the stream tube, m, and the total enthalpy, h0, which are independent of axial position, x, were determined at a point where all flow conditions were known. Upstream of the point where the flow crosses the vapor pressure curve (Fig. 2) the flow is isentropic, and the conditions are identical to those from the MOC cal- culations. The point chosen to start the condensation calculation was the nozzle exit.
For the nitrogen flows tested, the numerical values listed below were used in the calculations:
1. The gas properties are as follows:
7 =1.4
R = 2. 968 x 106 erg/gm^K
Cpi = 3. 5R
Cp_ = 3. 5R/Z
2. The surface tension, CJ, in dyne/cm is given as follows:
a = 24.7 - 0. 204 T, T > 63. 15°K
a = 11.9, T < 63. 15°K
3. The latent heat of condensation in erg/gm is assumed to be as follows:
L = 2.86 x 10⁹ - 1.13 x 10⁷ T - 2/pca, T > 63. 15°K
L = 2. 79 x 109 - 6. 05 x 106 T - 2/pca, T < 63. 15°K
4. The vapor pressure of condensed nitrogen in torr is as follows:
Pv = exp (15. 859 - 714. 67/T + 2/pcaRT), T > 63. 15°K
Pv = exp (17. 635 - 826. 83/T + 2/pcaRT), T < 63. 15QK
5. The bulk condensate properties are given as follows:
Cpc = 1. 09 x 107 erg/gm°K
pc = 0. 873 gm/cm3, T > 63. 15°K
pc = 0. 947 gm/cm3, T < 63. 15°K
While the condensation calculation could be made along any stream tube, the present calculations were carried out only for the centerline
54

AEDC-TR-74-31
(r = 0). As stated in Section 2, 3, the initial size and number of con- densation nuclei were considered as unknowns. These quantities were varied for each flow condition in order to obtain the best fit of the cal- culated <Na°> to the experimental data in regard to general shape of the curves. The values of number fraction of nuclei, e, and initial num- ber of molecules per condensate particle, z, obtained are presented in Fig. 15 as a function of P0 for the AK2 nozzle. The initial particle size can be obtained from the data on the preceding page and Eq. (11). Throughout the remainder of this report these numerical results are referred to as the condensation calculations.
10-2 r-
Initial Number of Molecules per Condensate Particle
g ?
"'I 3^
I g
4» - Z
a
Ji
2000 4000 6000 8000
P0. torr
Figure 15. Initial conditions used in condensation calculations.
55
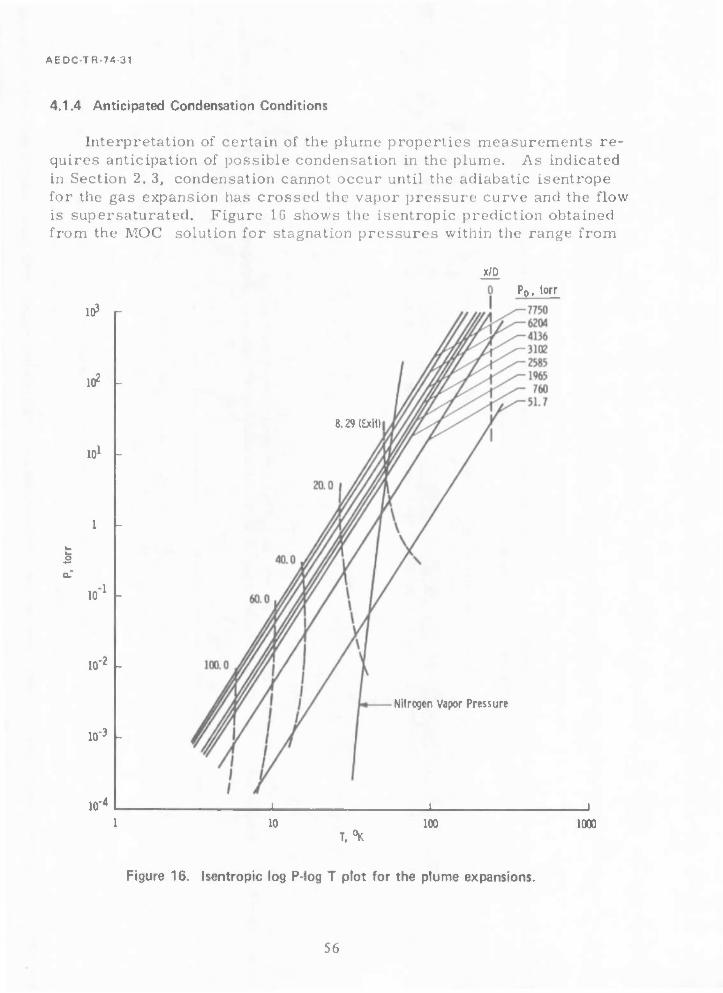
AEDC-TR-74 31
4.1.4 Anticipated Condensation Conditions
Interpretation of certain of the plume properties measurements re- quires anticipation of possible condensation in the plume. As indicated in Section 2. 3, condensation cannot occur until the adiabatic isentrope for the gas expansion has crossed the vapor pressure curve and the flow is supersaturated. Figure 16 shows the isentropic prediction obtained from the MOC solution for stagnation pressures within the range from
x/D
IQ3
102
10 1 -
1 -
10
10 -2
10 -3
10 4
8.29 (Exit)
Pp. torr
Nitrogen Vapor Pressure
10 T.°K
100 1000
Figure 16. isentropic log P-log T plot for the plume expansions.
56

AEDC-TR-74-31
51. 7 to 7755 torr used in this investigation. Also shown is the vapor pressure curve for nitrogen, and, on each isentrope, the location of the nozzle exit as well as representative distances downstream from the throat in the plume, as x/D. As is seen, the flow becomes just saturated at the nozzle exit at 1965 torr, is saturated inside the nozzle at pressures above 1965 torr, and is not saturated until well down- stream of the exit at the lower pressures. Because condensation is necessarily a collisional process, one would anticipate some character- istic time associated with the appearance of the condensate after the flow becomes saturated. Hence, from these observations and Fig. 16, one would least expect condensation at the low pressures where the sat- uration point occurs well downstream in the plume and the collision time is appreciable compared with flow times.
The question was pursued experimentally by examining the rota- tional temperature at a fixed point in the plume while the stagnation chamber pressure was varied. At low pressures where rotational re- laxation is significant, the measured TR is expected to be above isen- tropic predictions. As the pressure is increased, relaxation becomes a less significant factor, and TR approaches the isentropic value. Fi- nally, as the pressure is increased further and condensation onset is reached and passed, the resultant heat liberation to the gas serves to once again elevate the observed temperature.
The results of such an investigation are shown in Fig. 17 with the measured ratio of rotational temperature to stagnation temperature on the ordinate and the stagnation pressure on the abscissa. The data were all taken on the centeriine of the plume and 13. 5 cm from the noz- zle throat (x/D = 130). The point at 51, 7 torr is from the FF nozzle, whereas all the other data are from the AN2 nozzle. Although it was not possible to go to lower stagnation pressures because of loss of in- tensity, the minimum in the curve in the neighborhood of 500 torr is apparent along with the subsequent increase in Tjj/T0 with P0. It should be noted that the difference between the data and the MOC solu- tion includes both the decreasing relaxation effects with P0 and the in- creasing condensation effects. The condensation calculations do not in- clude relaxation considerations.
The experimental data shown in Fig. 17 reflect the average of two measurements, and the bars indicate the spread of the measurements. Also included for reference in Fig. 17 is the TR/T0 predicted by both the MOC calculations and the condensation calculations. The presence of rotational relaxation at the low stagnation pressures is obvious from comparison of the data and the isentropic predictions.
57

AEDC-TH-74-31
a 07 r
a 06
T,, - 290**
x/D - 130
a 05 -
a 04 N.
a as ^"""""■fr""""" A—Condensation
y Calculation
aoz
MOC Calculation
HOI
0 ■ ' 1 ' i .. J_. .i i i i i 1 I i i i i i i i 1
10 100 1000 10,000
P0, torr
Figure 17. TR/T0 versus P0 plot illustrating condensation onset.
Even though a conclusion that a specific pressure is the onset point for condensation cannot be drawn from these data, one can conclude that when condensation does occur, it will be in the 500- to 1000-torr region. Thus, one does not expect condensation at the low (51. 7-torr) pressure. Condensation may be present in the flow at the 760-torr pressure, and it is to be expected at the higher stagnation pressures investigated.
4.2 PLUME PROPERTIES
4.2.1 Flow Visualization Results
The visible optical fluorescence produced by electron beam colli- sions with N2 was used to provide visualization of the FF nozzle- produced flow field. The resulting color photographs, as well as visual observations, provided confirmation of the method of characteristics
58

AEDCTR-74-31
solutions that no shock structure existed within the spatial region in which data were to be acquired. The photographic results also pro- vided information concerning gross changes in the plume shape and size which might occur as a result of massive condensation.
Selected color photographs of the investigated conditions are shown in Figs. 18 through 21 for the reservoir pressures of 760, 1965, 5170, and 7905 torr, respectively. As these figures show, there is no appar- ent gross alteration in the plume properties throughout this pressure range, other than an expected increase in the visual diameter and axial length of the plume as P0 increases. Since it is anticipated that the higher values of P0 will produce two-phase flow fields, it is to be noted that no effects discerned from the photographs could be attributed to condensation phenomena. More quantitative conclusions are not possi- ble because of collisional effects on the unknown radiating states of N2, electron beam spreading and attenuation, and likely reciprocity law failures of the photographic film. Although no plume barrel shock is evident in the color photographs, such a shock structure was observed at large distances from the plume centerline when black-and-white Po- laroid photographs were taken. However, it should be noted that se- vere overexposure of the high density centerline region was required for detection of the weak barrel shock,
4.2.2 Gas Density Results
The experimental centerline profiles of gas density for reservoir pressures of 51.7, 760, 1965» and 7755 torr are shown in Figs. 22 through 25, respectively. The experimental data presented in these figures include both electron beam and Raman scattering data. Figures 26 through 28 show the resulting experimental radial profiles of N2 den- sity at various axial positions for the reservoir pressures of 760, 1965, and 7755 torr, respectively. The ordinate of these figures is the free- stream measured density divided by the reservoir density value, and the distances shown on the abscissa are normalized to the nozzle throat diameter. The electron beam data shown in Figs. 22 through 28 have all been corrected for collisional quenching effects using a temperature- independent quenching rate constant value of 2 x 10"1" cm /sec. This correction never exceeded approximately 25 percent. It should be noted that experimental data were acquired on both sides of the flow centerline, and axial symmetry was verified.
59

AEDC-TR-74-31
Figure 18. Plume flow visualization photograph at P0 = 760 torr.
Figure 19. Plume flow visualization photograph at P0 = 1965 torr.
61

AEDC-TFI-74-31
Figure 20. Plume flow visualization photograph at PD = 5170 torr.
Figure 21. Plume flow visualization photograph at P0 = 7905 torr.
63
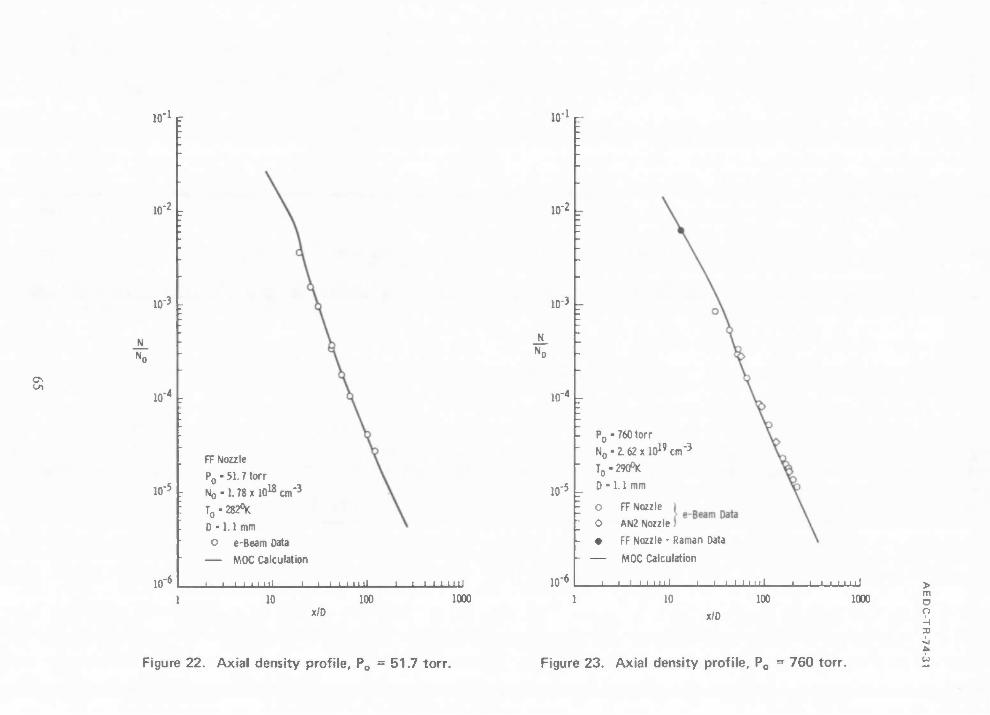
10 -1
10 ,-2
10 -3
IQ"'
10"
10 -6
FF Nozzle
P0 ■ 51.7 torr
No-l^xU^cm'3
T0-282\
D ■ 1.1 mm
o e-Beam Data
— MOC Calculation
-J ' ■ i ■ ■ ■ ■■■! i l i t i i i I
10 x/D
100 1000
10 -1
10"
10-3
_N_
10"
10 5
10'
P0 • 760 torr
N0-2.62xl019cm-3
T0-290°K
D -1.1 mm
o FF Nozzle
O AN2 Nozzle
• FF Nozzle - Raman Data
— MOC Calculation
e-Beam Data
' ii'"i J L I Mill 1 ' ■ il
10 100 1000
x/D
> m C C H x
Figure 22. Axial density profile, P0 = 51.7 torr. Figure 23. Axial density profile, PQ ■ 760 torr. -
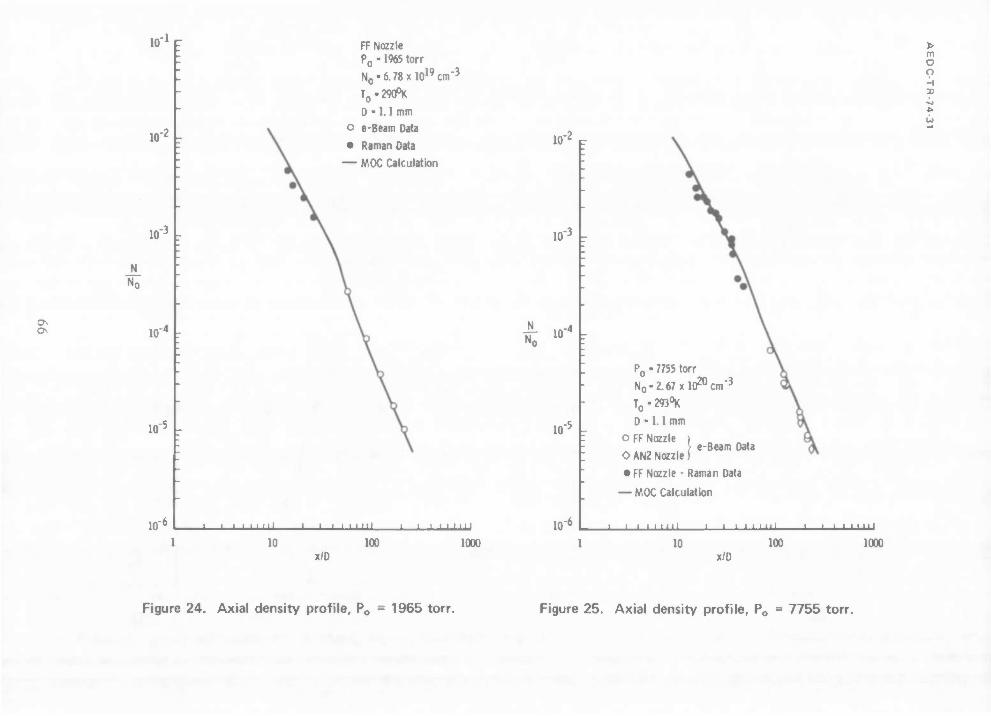
10"
10
10'
10
10
10 "6 1 i ■ ■ i ■ in
10
FF Nozzle P0 • 1965 torr
N0 • 6.78 x 1019 cm"}
T0-290°K
0 ■ 1.1 mm
o e-Beam Data
• Raman Data
— MOC Calculation
i i i 11 in i ' ■ i ■ i HI
100 1000
io-2r
10 -3
£ 10-
10"
10"
P0 • 7755 torr
N0-2.67xl020cm"3
T0-293°K
e-Beam Data
D ■ 1.1 mm
o FF Nozzle |
OAN2 Nozzle I
• FF Nozzle - Raman Data
— MOC Calculation
■ ' ■ ' 10 100
> m c n H 30
ü
i nniii 1000
x/D x/D
Figure 24. Axial density profile, P0 ■ 1965 torr. Figure 25. Axial density profile, P0 = 7755 torr.

AEDCTR-74 31
Shown in Figs. 22 through 28 by solid lines are the results of a method of characteristics solution (MOCS) for the assumed-isentropic flow process. The MOCS utilized a starting line at the nozzle exit for the computation which was obtained from boundary-layer calculations through the nozzle expansion section as described earlier. The bend in the MOC axial centerline density profiles (Figs. 22 through 25) is caused by the boundary-layer effects in the nozzle propagating to the centerline.
2x10
FF Nozzle
V 760 torr
V 2.62 x 1019 cm -3
V 290°K
D- 1.1 mm
Syrr x/0
0 30
0 53
A 87
D 121
ö 167 MOC Calculation
Figure 26. Electron beam radial density profiles, P0 = 760 torr.
67

>-
lo-V
10"
Jl in-5 10 7 r
10 ° -
10"
FF Nozzle
P0 ■ 1965 torr
N0 - 6.76 x 1019 cm "3
- \ T0-290°K
D ■ 1.1 mm
-""Vy, Sym
O
G
53
37
A 1?1 V 0 167
MOC Calculations
53 N 4rV -12lV MoT"
Nn A
-
' ' i 1 1 1
20 411
10 4_
» m o n H X il
FF Nozzle
V 7755 torr
V 2.67xl020cm-3
V 293°K
D- 1.1 mm
Syn x/D o 87 o 121 O 167 A 212
MOC Calculations
10 00 80 iOO 120 20 40
r/0
60
r/D
80 100 120
Figure 27. Electron beam radial density profiles, P0 ■ 1965 torr. Figure 28. Electron beam radial density profiles, P„ * 7755 torr.

AEDC-TR-74-31
4.2.3 Rotational Temperature Results
The rotational temperature experimental results normalized by the reservoir temperature obtained by the electron beam fluorescence technique are shown in Figs. 29 through 32 for reservoir pressures of 51.7, 760, 1965, and 7755 torr, respectively. The radial profile data for Tp, normalized by the reservoir temperature, T0J for these same reservoir pressures are shown in Figs. 33 through 35, respectively. Also shown in these figures is the MOCS for the free-stream static temperatures for an assumed-isentropic flow. It is noted that the MOCS predicts radial profiles of TR/T0 for which .the off-axis values exhibit local minima and maxima. These effects, which obviously de- viate from a simple source flow expansion, are attributable to the ex- istence of the boundary layer within the nozzle and its subsequent effect upon the free-stream plume expansion. It is noted that the electron beam results also exhibit local minima but no local, off-axis maxima. This discrepancy with the MOCS is believed to arise because of the inability of the MOCS to correctly model the expansion effects at the nozzle lip.
The behavior of the centerline temperature profile data as the res- ervoir pressure increases is to be noted in Figs. 29 through 32. The obvious elevation of TR/T0 relative to the MOC result at 51.7 torr decreases throughout the axial region for a P0 value of 760 torr. This behavior at one axial location was noted earlier in Fig. 17. Quantita- tive interpretation of this diminution is made difficult by the effects of the boundary layer not only along the interior of the nozzle wall but also at the nozzle throat, resulting in an effective throat diameter different from the geometrical value. However, further increases in P0 as shown in Figs. 31 and 32 yield even larger deviations of TR/T0 from tne MOC result throughout the entire axial regime. Such increases in TR are attributed to the occurrence of condensation.
4.2.4 Rayleigh Scattering Results
The onset of condensation and the subsequent growth of clusters and condensate was observed by measurements of the axial and radial profiles of the <Na6> product. Figure 36 shows the experimental axial profile data acquired for the AN2 nozzle for the reservoir pressure range from 1965 to 7755 torr. The onset of condensation is evident from the data. Qualitatively, from the profiles of P0 of 2585 and 3102 torr, one sees the initial near-isentropic expansion followed by sudden onset of condensation and subsequent growth of clusters.
69

AEDCTR-74-31
3x10"
10 -1
6x10
10-2
-3
1
FF Nozzle
P0 - 51.7 torr
N0-1.78xlOI8cm"3
T0-282°K
0 ■ 1.1 mm o e-Beam Data
— MOC Calculation Static Temperature
J_J I ■■■■'! J I I I
10 100 1000 XlO
Figure 29. Electron beam axial rotational temperature profile, P0 = 51.7 torr.
3x10 ■lr
10-1 7
10"
5x10 •3
P0-760 torr
^■^XlO1'«!!"3
To-290°K
D • 1.1 mm
o FF Nozzle )
O AN2 Nozzle (
— MOC Calculation Static Temperature
e-Beam Data 0*9,
' ' ■ ■■«■■■ 1 I J I LljJ
10 100 1003 x/D
Figure 30. Electron beam axial rotational temperature profile, P0 = 760 torr.
70
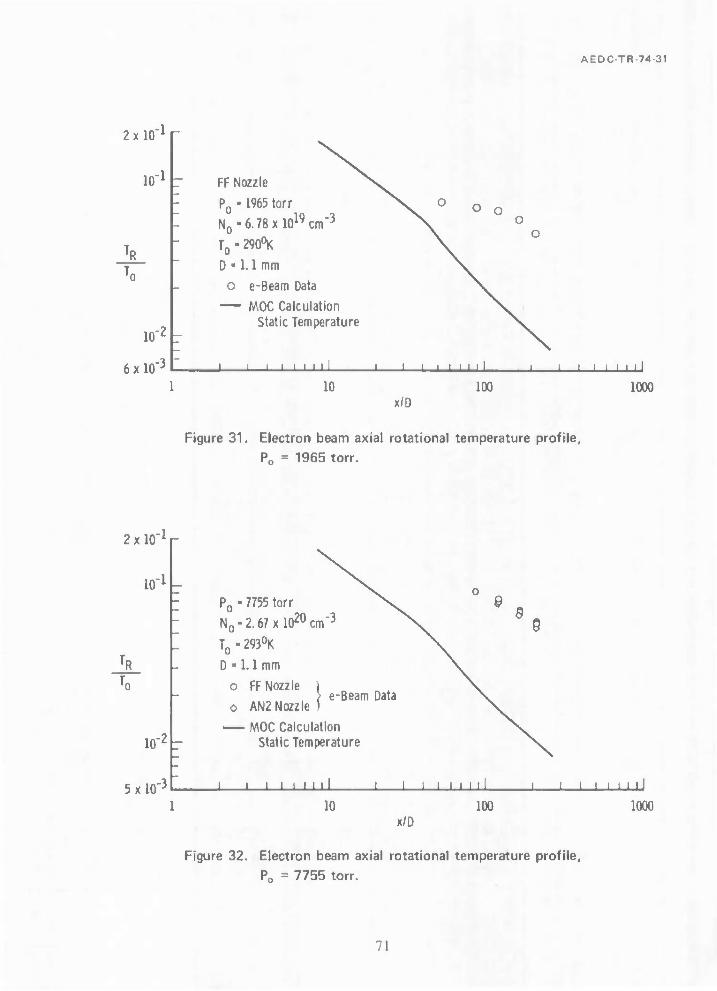
AEDC TR 74 31
2x10 -lr
10 1 _
10 2 _
FF Nozzle
P0 ■ 1965 torr
No-6.78xl019cm"3
T0 ■ 290°K
D ■ 1.1 mm
o e-Beam Data
— MOC Calculation Static Temperature
o o
6x10" 1 ' ■ J i i i i j i i i i i i i I
10 100 x/D
Figure 31. Electron beam axial rotational temperature profile,
P0 = 1965 torr.
1000
2xl0_1
lo-i
10"
P0 ■ 7755 torr
No-2.67xl020cm"3
T0 ■ 293°K
D ■ 1.1 mm
o FF Nozzle
o AN2 Nozzle
MOC Calculation Static Temperature
e-Beam Data
9 $
5x10" J i I J I I I i i i i i i i i J I I Mill
10 100 1000 x/D
Figure 32. Electron beam axial rotational temperature profile,
P0 = 7755 torr.
71

AEDC-TR-74-31
10L FF Nozzle Sym x/D
P0 ■ 760 torr
No-1.78xl018cm"3
o 30 O 53
0 A 87 T„ ■ 290°K a 121 0 • 1.1 mm o 167
~^~ MOC Calculation Static Temperature
121 J"-n
167 877 ry Z*
K.
IQ"2 I-
10"
^30
- ^^>^ -^^53
——cE. - rm
r-\tl
-
1 i 1 1 __i i i
20 40 60 80
r/D
100 120 140
Figure 33. Electron beam radial rotational temperature profile, P„ = 760 torr.
72

AEDC-TR-74 31
10u (T FF Nozzle
10"
P0 ■ 1965 torr
N0-6.78xl019cm"3
T0 ■ 290°K
D ■ 1.1 mm
Sym x/D
o 53 o 87 A 121 o 167 MOC Calculation
Static Temperature
x/D /
« / 87-v 121-
/ / S ^ / // /
167^ tf
120 140 0 20 40 60 80 100 r/D
Figure 34. Electron beam radial rotational temperature profile, P„ = 1965 torr.
73
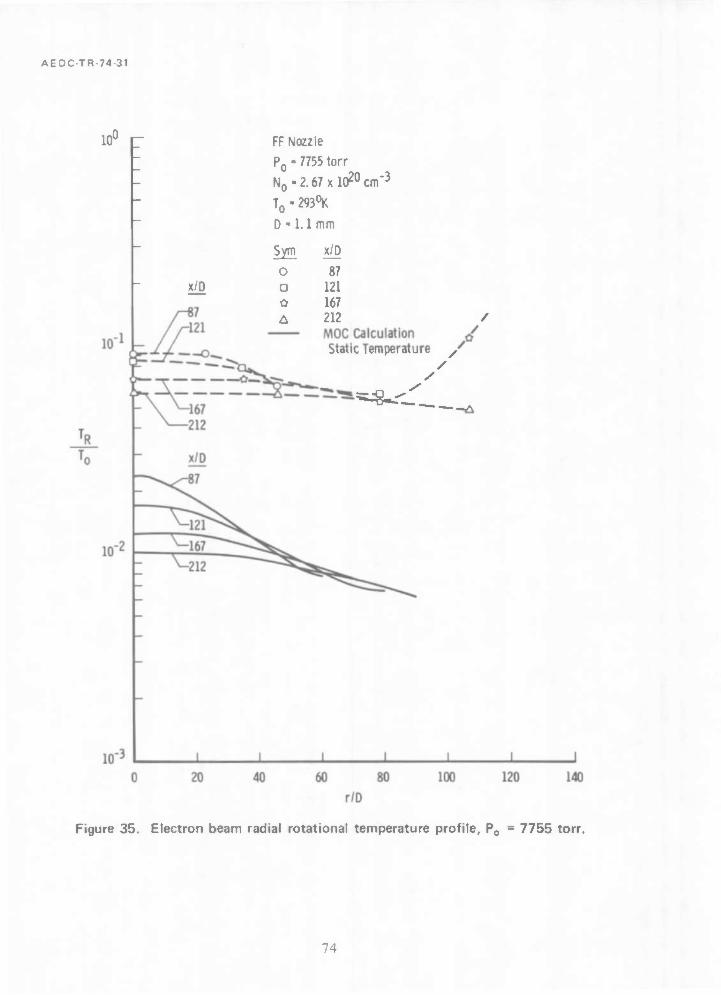
AEDC-TR-74-31
10' 0 ,- FF Nozzle
P0 ■ 7755 torr
N0-2.67xl020cm"3
T0-293°K
D ■ 1.1 mm
x/D
sym o o 0
x/D
87 121 167 212 MOC Calculation Static Temperature
/
Figure 35. Electron beam radial rotational temperature profile, P0 = 7755 torr.
~4

AEDC TR 74 31
lO"25 er
10 26
10 n E <->
v-
1Ü -28
10 29
10 -30 L ,1 I
Sym
O 0
a o
P a o *
P0, torr
1965 3102 4136 6204 7755 1965 2274 2585 3102 6204 7755
Measurement Technique
Charge Storage
Photon Counting
Charge Storage
I
V
Gas Supply
Bone Dry N?
Prepur tied N2
ft /^s\ / //
^ Nfc \i
t
J I I I '''■ J-
8.0 10.0 20 40 60 80 100
x/D
200
Figure 36. Experimental Rayleigh scattering axial profiles, AN2 nozzle.
AEDC-TR-74-31
The cessation of the cluster growth is obviously followed by an axial de- cay because of the plume expansion. The variation in scattering signal caused by gaseous supply impurties is also shown in this figure. One notes that the spatial location of onset does not appear to be sensitive to this variation Ln impurity levels, but the maximum scattering signal varies by approximately a factor of two in going from the Bone-Dry to the Pre-purified N2. It is tempting to attribute this difference to en- hanced condensation of N2 resulting from additional nucleation sites of more easily condensed impurities. Figures 37 and 38 show the experi- mental radial profiles of <Na^> at various axial positions for the AN2 nozzle for reservoir pressures of 7755 and 6204 torr, respectively. Figures 39 and 40 show the axial and radial <Na6> profiles for the FF nozzle at 7755 torr. Comparing the axial profile <Na^> data for the FF and AN2 nozzles at 7755 torr one sees that the location of the maximum <Ka6> value occurs at approximately x/D = 32 for both cases and that the magnitude of the maximum value for the two nozzles differ by less than 25 percent. This result is to be expected since the internal geom- etry of the two nozzles is very nearly the same.
The variation of <Na**> at. a fixed axial position with the N2 of many different "KM bottles was investigated using the FF nozzle. The results are plotted in Fig. 41 as a function of the impurity level of H2O, which was determined subsequently by chemical analysis. It is seen that a factor-of-two increase in <Ka^> is observed by increasing the H2O im- purity from approximately 5 ppm to 10 ppm by volume. Such a correla- tion was not found with any other common impurity of N2 bottles, such as argon (Ar), oxygen (O2), or hydrocarbons.
For the purpose of acquiring some information concerning the as- symmetry of the scattering cluster, depolarization measurements of the Rayleigh scattering signal were performed for reservoir pressures of 7755, 6204, and 4136 torr. These data were obtained over a range of axial distances, and one radial profile was taken at 7755 torr. The results are shown in Fig. 42. It is seen that the depolarization does indeed decrease from its room temperature monomer value as one pro- ceeds axially through the cluster growth region. The limiting lower value, indicating a more spherical scatterer than the monomer N2. occurs in the expansion following the growth process.
76

AEDC TR-74-31
-26 _
AN2 Nozzle
Prep urilied ^
V 7755 torr
V 293°K
Sym x/D o 19 o 31 A 53 o 87
G 121 o 167
40 60
r/D Right
Figure 37. Experimental Rayleigh scattering radial profiles, AN2 nozzle.
P0 = 7755 torr.
77
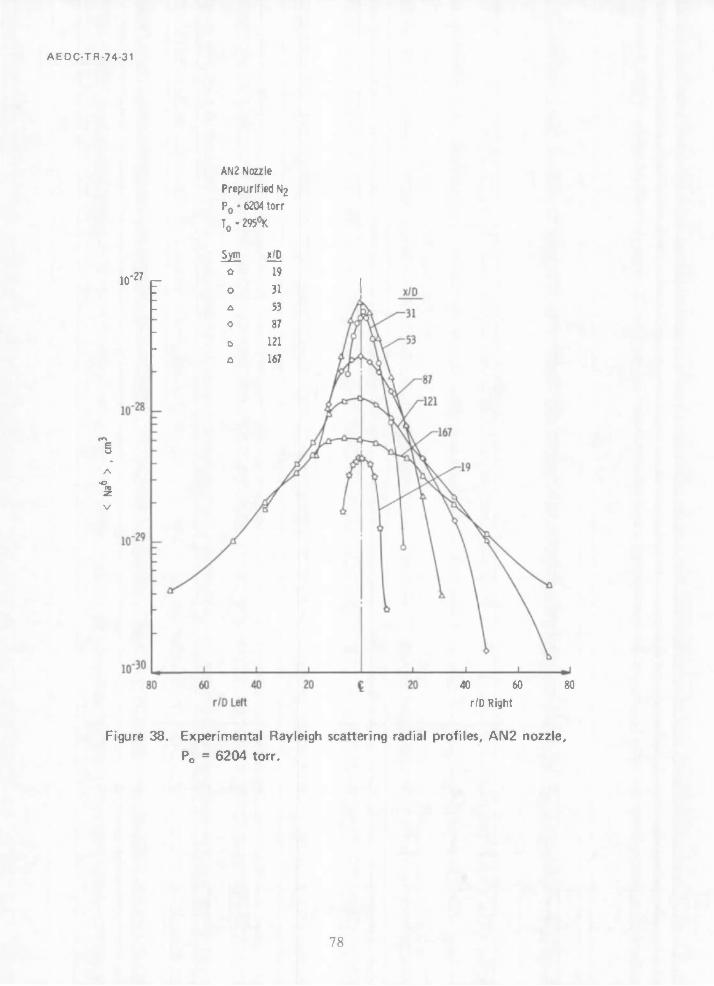
AEDC TR 74-31
10 27 ^_
A
3
AN2 Nozzle
Prep urified N2
V 6204torr
To* 295°K
Syri x/D o 19
0 31 A 53 O 87
D 121 a 167
40 60
r/D Right
Figure 38. Experimental Rayleigh scattering radial profiles, AN2 nozzle,
P0 = 6204 torr.
78
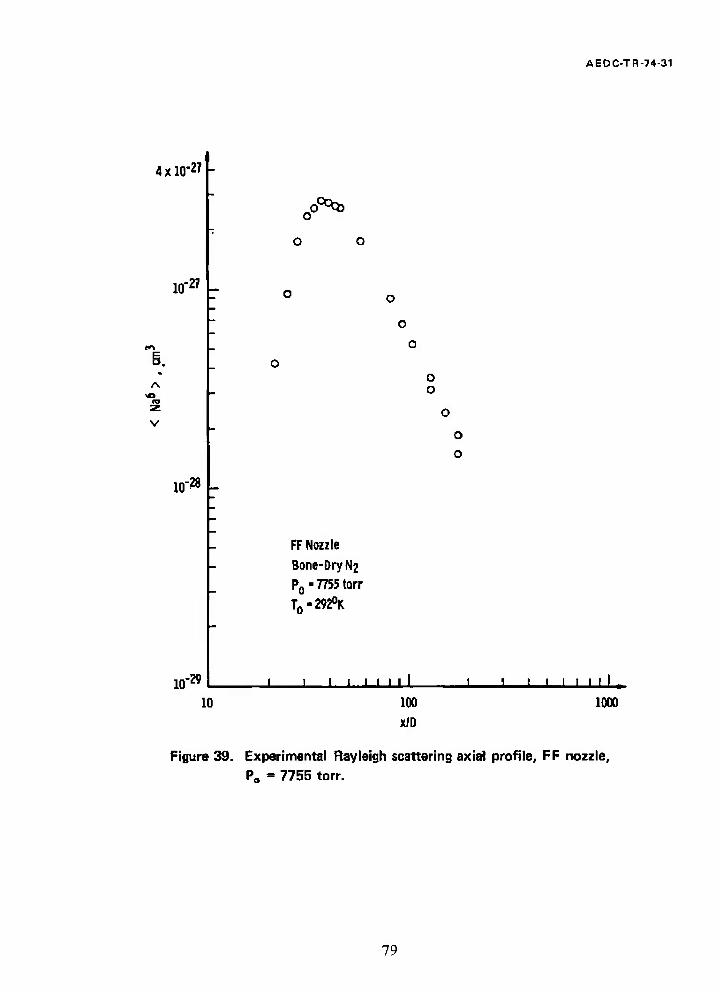
AEDC-TR-74-31
4xlO"2T
10 27
10 ■28
10 ,-29
10
D°^to
o o
o o
FF Nozzle
Bone-Dry N2 P0 - 7755 torr
T0-292°K
J 1 ■ ' 1 ' 1 1 I 1 I » ■ 1 ' ■ 1 I 1
100
xJD
1000
Figure 39. Experimental Ftayleigh scattering axial profile, FF nozzle, P„ = 7755 torr.
79
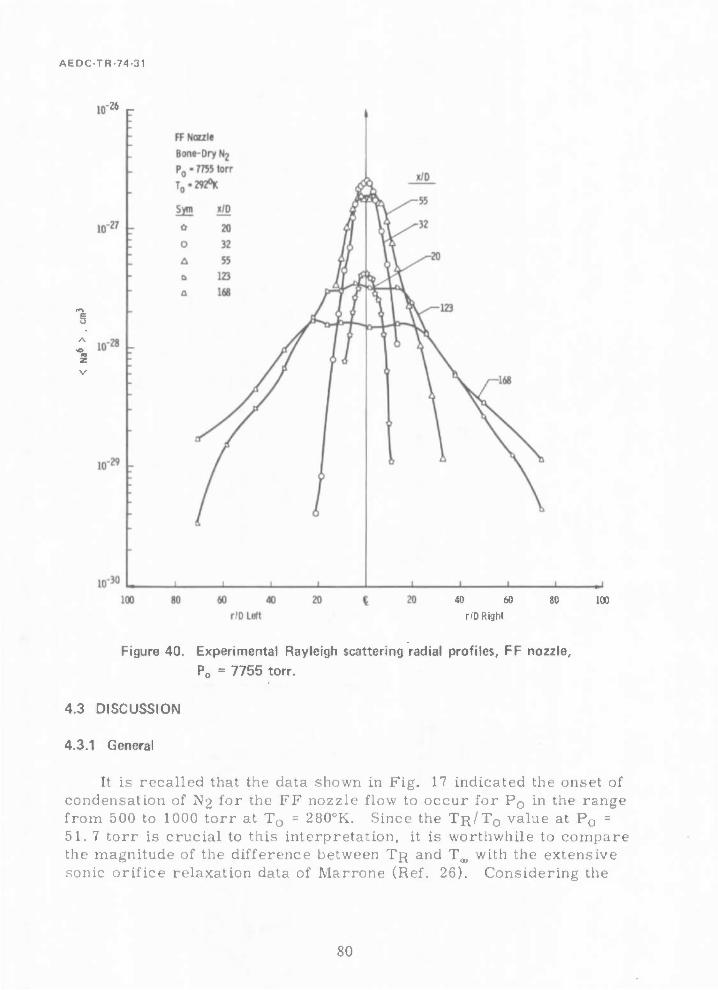
AEDC-TR-74-31
"26 r-
2 V
40 60
nD Right
Figure 40. Experimental Rayleigh scattering radial profiles, FF nozzle.
P0 ■ 7755 torr.
4.3 DISCUSSION
4.3.1 General
It is recalled that the data shown in Fig. 17 indicated the onset of condensation of N2 for the FF nozzle flow to occur for P0 in the range from 500 to 1000 torr at T0 = 280°K. Since the TR/T0 value at P0 = 51.7 torr is crucial to this interpretation, it is worthwhile to compare the magnitude of the difference between TR and T,,, with the extensive sonic orifice relaxation data of Marrone (Ref. 26). Considering the
SO

AEDC-TR-74-31
0
b Z-D
Po V
■7755 torr 293°K
o o
°5b tm M
x/D -53 o
S 1.5 - 0 o A
"5 cP v 1.0 1 1 i •
3 5 10 15 20 K-Bottle, H2O Content, ppm by Volume
Figure 41. Variation of Rayleigh scattered signal with K-bottle water
vapor content.
o IS
c
£
10.0
9.0
8.0
7.0
6.0
D
AN2 Nozzle
O P„ ■ 7755 torr
A P0-6204 torr
a P0 - 4.136 torr
2.0
1.0
0
Radial xlD
oc
Profile ■53
0
1
1 L 0 eft
( 10 Right
r/0
5.0
4.0
3.0 O
Axial Profile
2.0 a
1.0 O 0
0 a 6 ° 0 0 A ° O 0 0
n 1 1_ 1 1 1 1 L 111 j J_ 1 1 1 1 1
10 20 30 40 50 60 70 80 90 100 110 120 130 140 150 160 170
x/D
Figure 42. Depolarization ratio profiles, P0 = 4136, 6204, and 7755 torr.
81

AEDCTR-74-31
51.7 torr data point in Fig. 17, the relevant expansion parameters are as follows:
P0D < 57 torr mm, where the inequality results from boundary-layer effects at the nozzle throat
x/D = 123 using D ■ 1. 1 mm
TR - T^ = 8. 1-K
From the results of Ref. 26 it is seen that for comparable values of P0D and x/D
TR " T,,, = 20°K.
Such agreement is felt to be satisfactory for the following two reasons:
1, The axial temperature gradients of a sonic orifice ex- pansion exceed those of a conical nozzle expansion of the same throat diameter. Since the deviation TR - Tm
is proportional to dTpj/dx, it is to be expected that the Tpj - Ta values of sonic orifice expansions will exceed those of comparable conical nozzle flow fields.
2. Inclusion of the boundary-layer effects on the nozzle throat diameter will decrease P0D and move the ef- fective x/D location to larger values which will result in increasing the TR - T^ difference in the sonic ori- fice and nozzle data. It is felt that these considerations as well as the results of Figs. 31 and 32 are suffi- cient to demonstratethat the onset of condensation oc- curs in the region of reservoir pressure between 500 and 1000 torr. Since these electron beam data for ni- trogen condensation are unique, it is not possible to compare these results with the work of others. It is realized that mass spectrometric sampling data of the far field of such flows do exist (Ref. 4), and comparison of the electron beam results and mass spectrometer re- sults is of interest. However, it must be noted that such comparisons may yield order of magnitude agreement at best since the mass spectrometer scaling laws for con- densation apply to a specific cluster size (e.g., dimer peak scaling or trimer peak scaling laws). Assuming that the electron beam results of condensation onset cor- relate with the N2 dimer peak data of Ref. 4, the results
82

AEDC-TH-74-31
of Golomb et al. indicate an onset pressure of 1000 torr for the identical nozzle employed in this study. Such agreement is considered satisfactory.
4.3.2 Electron Beam and Raman Scattering
The electron beam density profiles (Figs. 22 through 28) show that the density of the gaseous phase of the plumes is not markedly affected by the condensation process except at the high (7755-torr) reservoir pressure. At this reservoir pressure the density data are reduced from 10 to 20 percent below the isentropic value (Figs. 25 and 28).
The Raman data, taken in the high density regions of the flow, sim- ilarly show adequate agreement with the MOCS. There is a tendency of the Raman data to show a slightly different slope from the MOC solu- tion, particularly at 7755 torr, which is a strongly condensing flow. It is tempting to ascribe this difference to the condensation process (satu- ration occurs inside the nozzle at this pressure) and the resultant effect of the nonisentropic process on the specific heat ratio, y, of the flow. The electron beam data, taken farther downstream, show a slope simi- lar to that of the MOC solution. This occurs because the condensation process has been completed at this point and the flow has become isen- tropic once again.
In viewing the progression of the centerline profiles in Figs. 29 through 32 one should note that the discrepancy between the data and the MOC solution increases with stagnation pressure. This increase is in agreement with the aforementioned observation that with more massive condensation with increasing pressure, the observed TR should be elevated in comparison to the isentropic predictions. At the low (51. 7-torr) pressure (Fig. 29), in which there is no condensation, ro- tational relaxation effects are apparent in the significantly different slopes of the data and the MOC prediction.
At the 760-torr pressure (Fig. 30) the slope of the data is not widely deviant from that of the MOC, suggesting lower relaxation effects. As was suggested earlier, condensation may be present at this pressure, albeit slight, and this could account for the elevated TR/T0.
At 1965 and 7755 torr the condensation is assuredly present, and rotational relaxation is negligible. As is seen in Figs. 31 and 32, the TR/T0 is elevated with respect to the MOC solution, as would be ex- pected with significant condensation. The TR/T0 at 7755 torr is higher
83

AEDC-TR-74-31
than at 1965 torr, consistent with a higher mass fraction of condensate. Of particular interest is the apparent change in slope of the experimen- tal data at 1965 torr. This suggests that the condensation process is making significant energy contributions to the flow to an approximate x/D = 120. Subsequent to this the condensation process terminates or significantly decreases so that the natural expansion of the gas provides the character of the TR/T0 variation.
4.3.3 Rayleigh Scattering
Figure 36 showed the resulting experimental axial profiles of <Na"> for various reservoir pressure values. It is of interest now to com- pare these results with the <Na^> values obtained from isentropic ex- pansions of the same P0 values. These <Na°> values, using the MOCS for the nitrogen density, are shown in Fig. 43. It should again be men- tioned that the MOCS axial values of both the FF and AN2 nozzles are
Ti
Figure 43. Isentropic <Na6> from method of characteristics
versus axial distance x/D.
84
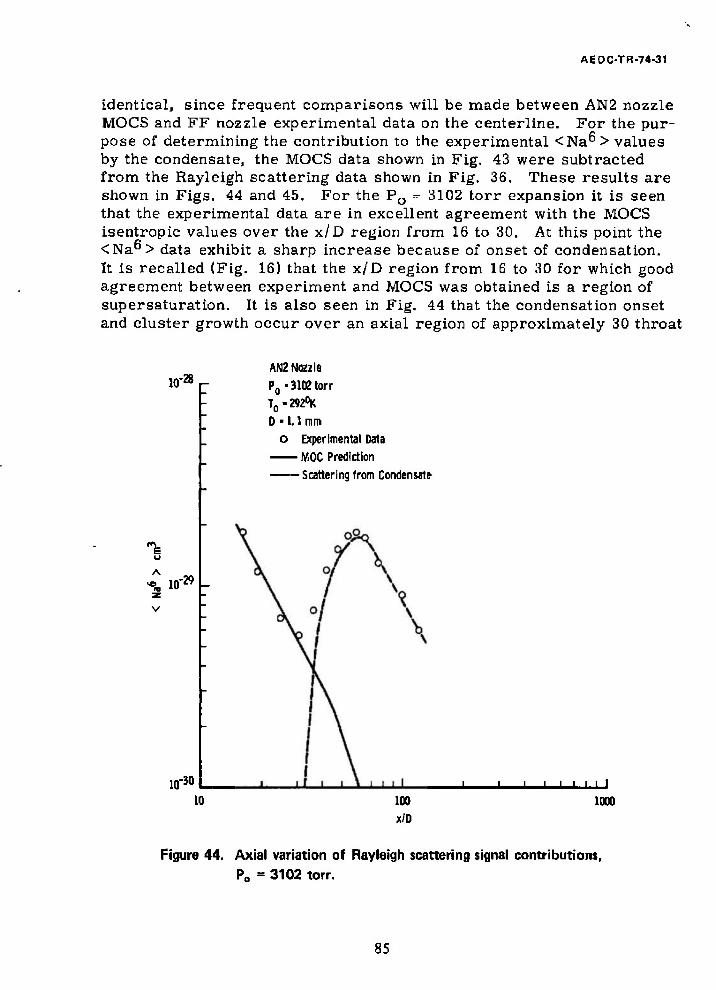
AEDC-TR-74-31
identical, since frequent comparisons will be made between AN2 nozzle MOCS and FF nozzle experimental data on the centerline. For the pur- pose of determining the contribution to the experimental <Na^> values by the condensate, the MOCS data shown in Fig. 43 were subtracted from the Rayleigh scattering data shown in Fig. 36. These results are shown in Figs. 44 and 45. For the PQ = 3102 torr expansion it is seen that the experimental data are in excellent agreement with the MOCS isentropic values over the x/D region from 16 to 30. At this point the <Na°> data exhibit a sharp increase because of onset of condensation. It is recalled (Fig. 16) that the x/D region from 16 to 30 for which good agreement between experiment and MOCS was obtained is a region of sup er saturation. It is also seen in Fig. 44 that the condensation onset and cluster growth occur over an axial region of approximately 30 throat
HT28,-
u
10 -29
10 -30
ID
AN2 Nozzle
P„-3102 torr
V292°K D ■ 1.1 mm
o Experimental Data
MOC Prediction
Scattering from Condensate
J—l—l I I I I 100
x/D 1000
Figure 44. Axial variation of Rayleigh scattering signal contributions,
P„ = 3102 torr.
85

AEDC-Tfl-74-31
10 27^
E
10'
28
- 1 \ t o
1 \ t \ i * t \
i , \ 1 AN2 Ncezle
t P0-620*torr
V J T0-295°K
\ 1 D -1.1 mm \ ' o Experimental Data
V —— MOC Predictions X — — Scattering from Condensate
29 1 \
>i \ i i i i i i 1 _ i i... i i i i i i l
10"" -
10 100
x/D 1000
Figure 45. Axial variation of Rayleigh scattering signal contributions,
P0 = 6204 torr.
diameters, or approximately 3 cm. If the flow speed is on the order of 10* cm/sec, it is seen that the entire process occurs within a char- acteristic time of approximately 30^sec, a rapid process considering the comparatively low gas densities at which it occurs.
Figure 45 shows the results for PQ = 6204 torr. Once again it is seen that the condensation growth process occurs rapidly. In this case the axial region of growth is approximately 2 cm, and one finds a char- acteristic time of approximately 20^sec. This decrease in character- istic time, from 30 ßsec to 20 jusec, is, of course, the result of higher gas density for P0 = 7755 torr. It is also of interest to consider Fig, 43 and to observe that an increase in <Na° > of approximately 1 x 10"'" cm3 would have been easily detectable at the onset point. If one sup- poses that at onset of condensation the clusters, acting as nucleation
86

AEDCTR-74-31
sites for further condensation, were dimers, N4, with diameter of ap- proximately 7.4 A, one may see that a dimer number density on the order of 5 x 10*2 dimers/cm^ results. In reality, with careful meas- urements a dimer number density of approximately 5 x lO1* dimers/cm^ would be detectable.
The results of the condensation calculation which was described in Sections 2. 3 and 4. 1. 3, were used to provide calculated values of <Na^> for the centerline expansions of the various reservoir pres- sures. Figure 46 shows the results which are to be compared with the experimental data shown in Fig. 36. It is seen that the calculations predict quite well the location of the onset of condensation, the location of the <Na^ > peak value, and the subsequent decay caused by expansion.
Pa, torr
Figure 46. Calculated Rayleigh scattering axial profiles.
87
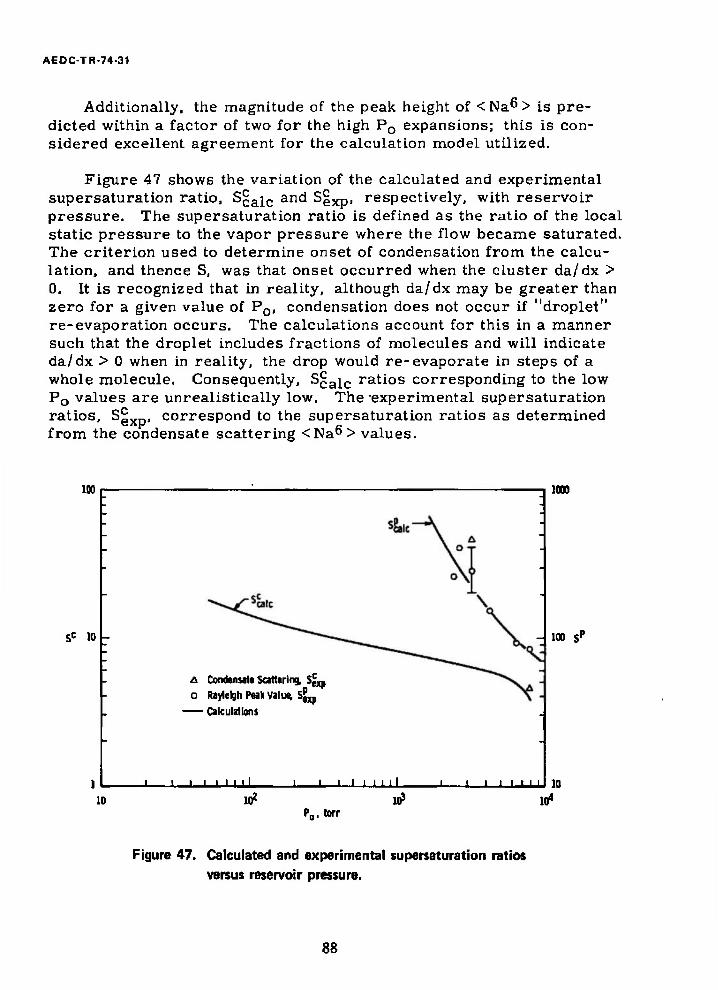
AEOC-TR-74-31
Additionally, the magnitude of the peak height of < Na^ > is pre- dicted within a factor of two for the high PQ expansions; this is con- sidered excellent agreement for the calculation model utilized.
Figure 47 shows the variation of the calculated and experimental supersaturation ratio, S£aic and S|xp) respectively, with reservoir pressure. The supersaturation ratio is defined as the ratio of the local static pressure to the vapor pressure where the flow became saturated. The criterion used to determine onset of condensation from the calcu- lation, and thence S, was that onset occurred when the cluster da/dx > 0. It is recognized that in reality, although da/dx may be greater than zero for a given value of P0, condensation does not occur if "droplet" re-evaporation occurs. The calculations account for this in a manner such that the droplet includes fractions of molecules and will indicate da/dx > 0 when in reality, the drop would re-evaporate in steps of a whole molecule. Consequently, S^a^c ratios corresponding to the low P0 values are unrealistically low. The experimental supersaturation ratios, SgX_, correspond to the supersaturation ratios as determined from the condensate scattering <Na^> values.
100
Sc 10
10
A Condensate Sattering, S^ o Raylclgh Peak value, 5^
— Calculations
l l I I 11 ' i i i i 11 J l I I I I I) 10
1000
- 100 sp
10* P0.«orr
Figure 47. Calculated and experimental supersaturation ratios versus reservoir pressure.
88
AEDC-TR-74-31
An alternate criterion may be used that massive condensation must result before the gas is no longer supersaturated. For this the <Na^> peak value locations are perhaps more appropriate. These results, designated S§aic and SgXp, are also shown in Fig. 47. It is seen that one would predict an order-of-magnitude increase in S if massive con- densation rather than onset were used. Moreover, recalling the elec- tron beam values of TR for these cases, one observes that gross changes in the flow-field temperature and static pressure have occurred by the time the <Na^> peak has formed. The difference in the experi- mental and calculated super saturation ratios is nothing more than the indication that cluster growth^ da/dx > 0, occurs well before flow-field properties significantly change and well before clusters are experimen- tally observed with the present sensitivity.
Figure 48 shows the log P-log T profiles obtained from the conden- sation calculations in the same manner as in Fig. 16. The location of condensation onset as described above is also shown in Fig. 48. Inter- pretation of these profiles also provides a means by which the cessation of cluster growth may be estimated. For, when the log P-log T locus of an expansion approaches a linear variation following the onset, one can infer constant specific heat ratio, 7, for the subsequent expansion. Since 7 .is a function of the mass fraction of condensate, the asymptotic linear variation of log P versus log T implies a constant condensate mass fraction.
The location of condensation or growth cessation was determined in this manner, and Fig. 49 shows the result. The ordinate in Fig. 49 is the ratio of cessation position, Xf/D, to the onset position, x0/D. Noting Fig. 48 and comparing it to Fig. 16, one can see that for de- creasing P0, x0/D moves downstream and xf/D moves upstream. This is illustrated in Fig. 49 by the monotonic variation of Xf/x0 with P0. It would be anticipated from this that, at some lower P0, xQ/D and Xf/D would approach the same value and hence signify the absence of cluster growth, regardless of re-evaporation considerations.
Figure 50 shows" the variation of the <Na^> peak height of the Ray- leigh data as a function of P0. It is seen that a one-order-of-magnitude increase in P0 results in a 3-order-of-magnitude increase in <Na°>. For comparison the calculated peak height is also shown. Figure 51 shows the locus of the half-width-half-maximum (HWHM) points from both the electron beam density measurements and the Rayleigh scatter- ing measurements for the 7755-torr expansion. The results of the MOCS are also included for comparison. The ordinate in Fig. 51 is
89

AEDC TR 74 31
Pn< torr
1000
Figure 48. Log P-log T plot from condensation calculations.
the ratio of the radial position and throat diameter at which the meas- ured density of <Na°> was half the centerline value, and the abscissa is the axial position x/D. The agreement between the electron beam data and the MOCS is good, as is the agreement between the scattering data from the two nozzles. It is to be noted that the plume size as measured by the gas density is larger than the size as determined by the <Na°> data. This indicates that the condensate radial distribution is more heavily weighted along the centerline of the flow.
90

AEDC-TR-74-31
10
8 -
V 6
J I I I I L
lCf» 10* PD. torr
Figure 49. Ratio of condensation cessation and onset locations
versus reservoir pressure.
4x10
10
-27
•27
& A
10 •28
10 -29
10
Calculation
J I I I I L J 30
1000 2000 3000 4000 5000 6000 7000 8000
P0. torr
Figure 50. Variation of Rayleigh scattered peak values with
reservoir pressure.
91

AEDC TR 74-31
100
(o)l,2 10
■ 7755 torr
D • 1.1 mm
o FF Nozzle, Rayleigh Scattering
£ AN2 Nozzle, Rayleigh Scattering
-o- FF Nozzle, e-Beam Data
—•— MOC Prediction
J 1 1 1 1 1 I 1 1 '
10 100
x/D
1000
Figure 51. Variation of half-width, half-maximum points of <Na6>
and N with axial distance.
4.3.4 Particle Size Estimates
The results of the scattering data are reported in terms of an av- erage <Na^> relative to gaseous nitrogen scattering. Using this <Na6> product and reasonable assumptions about the mass fraction of conden- sate, one can estimate probable sizes of the scatterer. Assuming closest packing, spherical scatterers, spherical molecules, and a delta function size distribution, one can arrive at the expression
■m 1/3
92

AEDC-TR-74-31
where a is the radius of the scatterer, a0 is the radius of the molecule, and AN is the number density of molecules removed from the flow, The maximum <Na^> observed was at 7755 torr and was on the order 10"2^ cm^. Based upon the electron beam and Raman density data (Fig. 25), approximately 10 to 20 percent of the total flow molecules were in the condensed phase. This makes AN on the order of 1016
cm-"* at the axial point of maximum <Na^>. This then yields, as an estimate of the drop radius,
o a * 25 A
o which is well below the upper limit of a = 350 A required for the va- lidity of the Rayleigh theory. It should further be noted that this value is in good agreement with the condensation calculations performed in this study. The theoretical prediction at this reservoir pressure was a = 22 Ä.
Examining the effect of the various assumptions upon the results, one sees that the ratio of <Na°> to AN must change by 3 orders of mag- nitude in order to affect the radius of the scatterer, a, by 1 order of magnitude. The central assumptions, closest packing and spherical molecules, affect principally the number of molecules contained within each drop. This assumption leads to the maximum number of drops for a given mass fraction. If each drop contains fewer than this maximum number, then N must increase, and therefore, a decreases to maintain a constant <Na^> product. Finally, if the particle is ellipsoidal rather than spherical, the scattering is more intense than that from a sphere of the same volume (Ref. 18). In this sense also, the estimate of a has a tendency to^be large. Thus 25 A represents a maximum size the particle can exhibit.
5.0 SUMMARY
The preceding pages have described an experimental program con- ducted at AEDC to examine condensation in a cold nitrogen hypersonic flow field. The objective of the program was to provide data for the assessment of the scattering of electromagnetic radiation from conden- sate in the flow field for systems application. For this purpose, the flow field of two similar nozzles was probed with (1) electron beam fluorescence to provide flow visualization, gas density, and rotational temperature measurements of the plume flow field and (2) a pulsed
93
AEDC-TR-74-31
ruby laser to provide gas density measurements by Raman scattering and <Na^ > data by Rayleigh scattering from the plume flow field. The electron beam density measurements and the Raman scattering meas- urements are complementary in that since each is applicable over dif- ferent density ranges, together they provide data over a larger plume extent than would otherwise be possible.
The experimental program was augmented both by analytic calcu- lations of the plume flow field and by predictions of condensation onset and cluster growth. The plume flow field was calculated with the isen- tropic method of characteristics, which cannot predict condensation but does give an accurate theoretical base for comparisons. The equa- tions for the prediction of condensation onset and cluster growth are developed in Section II.
The flow visualization studies showed that there were no unusual visual effects or apparent gross alterations of the plume throughout the pressure range examined, 760 to 7905 torr. There was the expected increase of the visual diameter and length of the plume with increasing
Electron beam fluorescence and Raman scattering density studies were made of plumes generated from four reservoir pressures, 51.7, 760, 1965, and 7755 torr {1, 14.7, 38, and 150 psia). The measured densities were in generally good agreement with the isentropic predic- tions except for the high (7755-torr) reservoir pressure. At this res- ervoir pressure, the measured densities were noticeably below the MOC predictions. This behavior is to be expected since it is only at higher density that a significant mass fraction is removed from the gaseous phase by condensation. The radial and axial density profiles showed the same behavior compared to the MOC calculations.
The electron beam fluorescence rotational temperature measure- ments showed that, for the nozzles used in this study, condensation on- set occurred in the 500- to 1000-torr region. The axial and radial pro- files showed elevated rotational temperatures in comparison with isen- tropic predictions. The discrepancy between the data and the isentropic predictions increased with reservoir pressure, in keeping with increased condensation. Although there was no condensation at the low reservoir pressure, 51.7 torr, the rotational temperature was elevated because of obvious relaxation effects. Boundary-layer considerations in estab- lishing the starting line for the MOC solutions caused a local fluctuation in the predicted static temperature radial profiles at large radii. The
94

AEDC-TR-74-31
rotational temperature data showed similar behavior at the same radii. Departures in qualitative behavior at larger radii are attributed to the inability of the MOC to correctly model the nozzle lip effects.
Rayleigh scattering data were taken on axial and radial profiles from plumes with reservoir pressures ranging from 1965 to 7755 torr. At the low pressures investigated, scattering from the uncondensed isentropic expansion was noted close to the nozzle and in good agree- ment with the MOC predictions. The scattered signal showed a subse- quent sharp increase with x/D at the low to intermediate pressures, indicating that condensation onset occurred downstream of the nozzle. With continued increasing x/D, the scattering signal further went through a maximum because of continued condensate growth, and then subsequently decayed, indicating that the condensation process had ceased. At the high pressures investigated, the onset point of conden- sation was not detected because it occurred either inside or very close to the nozzle exit. In all cases condensation onset and maximum growth had occurred for x/D < 64.
During the course of the Rayleigh scattering investigation, varia- tions in the scattered signal were noted as the gas supply was changed. These variations, which were far too large to be attributed to normal experimental fluctuations, were later found to be apparently correlated with the water vapor content of the gas supply. The water vapor con- tent of the gas supply was analyzed as from 10 to 20 ppm by volume, and the scattering intensity appeared to increase linearly with the H2O concentration. It should be noted that MIL spec MIL-P-27401 B, which provides the military specification for the N2 gas used in thrusters, al- lows as high as 26. 3 ppm by volume of H2O.
As described in Section 4. 1, 3, the condensation calculations for each reservoir pressure were performed for a range of initial nucleation site conditions, and comparison of the set of calculational results with the experimental data was performed for the selection of the best initial nucleation site conditions. The results show that the set of initial nuc- leation conditions shown in Fig. 15 as a function of P0 yields calculated behavior of the condensation phenomenon which closely approximates the experimental data insofar as the onset and cessation locations are concerned. The magnitude of the measured scattered intensity agrees within a factor of two with that calculated, but this agreement is quite likely fortuitous. The experimental apparatus was calibrated using a scattering radius, a, of 1. 855 A which is, of course, only approximately correct but is adequate for the purpose of scaling the scattered intensities
95

AEDC-TR-74-31
to other wavelengths. For the isentropic portion of the expansion, agreement between experiment and calculations was forced by using the same scattering radius value. However, as condensation proceeds, the transition from molecular to bulk properties of the effective scat- tering radius is difficult to describe a priori, and only approximations can be made at present. Consequently, order of magnitude agreement between calculations and measurements is considered satisfactory at present.
For the highest values of PQ the values of TR obtained by electron beam fluorescence agree closely with the calculated values. As the reservoir pressure decreases, the deviation between the two tempera- tures increases, as Fig. 17 shows. However, it should be noted that the absolute value of the temperature difference at its maximum is ap- proximately 10°K. Further, it can be argued that condensation in the region from 500 to 1000 torr occurs in a flow field which is character- ized by a nonequilibrium rotational energy mode- i.e., nonequilibrium condensation is observed for an otherwise nonequilibrium flow field. If one attempts to account for the excess of measured temperature at- tributable to rotational mode nonequilibrium and attributes only the dif- ference between the measured value and the extrapolated rotational re- laxation value to effects of condensation, the resulting temperatures are in approximate agreement with the calculated values; i.e.,
and
™!TT<>'(Measiiie<fl " *~R oMExtrapolated relaxing value) + Ä(T„/T ),r . . , H »'(Condensation)
^^R^o^Condensution) = ^«/^(CalcuLated) - (T«/TtP(M0CS)
It is also noted that for the lower PQ flow condensation onset occurs as does a subsequent re-evaporation process, producing evaporated mole- cular species with temperatures characteristic of the condensate. Since the condensate temperature quite likely exceeds the gas temperature for low values of P0, the free-stream gas is composed of molecular N2 species with a bimodal temperature distribution, and this effect can increase the measured values by an amount which depends on both the condensate temperature and the fraction of free-stream molecules which have resulted from the evaporation process.
The results of this study enable the following conclusions to be made:
96

AEDC-TR-74-31
1. There are no essential differences in the condensate properties for the flat-face and conventional conical nozzles. The gas properties for the two nozzles are in good agreement along the flow centerline, but dif- ferences were noted in the radial profiles for the off- axis properties.
2. Condensate mass fractions of 10'2 or less produce ex- perimentally observable increases in the rotational temperature of the gas but no noticeable change in the monomer gas density. For the nozzles studied, con- densation onset occurred for the reservoir pressure range from 500 to 1000 torr,
3. The axial profiles of the condensate scattering showed the cluster growth process to be rapid, with character- istic times on the order of 10 to 30 /jsec for the res- ervoir pressures investigated. The scattered inten- sity for the condensed flow fields increased by several orders of magnitude relative to the isentropic gas ex- pansion.
4. The radial profiles of the scattered intensity for the condensed flow fields indicated a distribution more sharply peaked along the flow-field centerline than did the radial profile for the uncondensed flow field. This effect could not be visually observed.
5. Knowledge of the experimental scattering results en- ables selection of nucleation initial conditions for the calculation such that the calculated properties of con- densed K2 nozzle flow such as gas density, tempera- ture, spatial locations of onset and cessation of con- densation, and order of magnitude of scattered inten- sity are in satisfactory agreement with experimental results.
6. The condensation of N2 is noticeably influenced by the presence of an H2O impurity of 10 to 20 ppm, and H2O impurity levels of this magnitude increase the scat- tered intensity by approximately a factor of two. Con- sequently, to decrease the scattered intensity to its minimum pure nitrogen homogeneous condensation value, the presently acceptable H2O impurity level of MIL-P-27401B must be decreased by more that a factor of two.
97
AEDC-TR-74-31
A priori calculations of condensing single-specie flow-field properties including the scattering effi- cacy of the condensate are not possible at present for reservoir conditions outside the range of this in- vestigation. Further information required to enable such a priori calculations to be performed includes the condensation scaling laws for nozzle throat diam- eter, half-angle, length of expansion section, reser- voir conditions, boundary-layer effects, and molecu- lar parameters. For gas mixtures the additional data required for such calculations include the effect of condensation of the more easily condensed species upon subsequent onset of condensation of supersatu- rated species in the flow. Some of these just- mentioned areas are presently being studied in a continuation of this investigation.
REFERENCES
1. Wegener, P. P. "Gas Dynamics of Experimental Flows with Con- densation and Homogeneous Nucleation of Water Vapor. " Nonequilibrium Gas Flows, Part I, edited by P. P. Wegener. Marcel Decker, New York, 1969, pp. 163-243.
2. Stever, H. G. "Condensation Phenomena in High-Speed Flows. " Fundamentals of Gas Dynamics, Vol. HI, edited by H. W. Emmons. Princeton University Press, Princeton, New Jersey, 1958, pp. 526-573.
3. Hagena, O. F. and Obert, W. "Cluster Formation in Expanding Supersonic Jets: Effect of Pressure, Temperature, Nozzle Size, and Test Gas. " The Journal of Chemical Physics, Vol. 56, No. 5, March 1972, pp. 1793-1802.
4. Golomb, D., Good, R. E. , Bailey, A. B. , Busby, M. R. , and Dawbarn, R. "Dimers, Clusters, and Condensation in Free Jets. II. " The Journal of Chemical Physics, Vol. 57, No. 9, November 1972, pp. 3844-3852.
5. Durbin, E, J. "Optical Methods Involving Light Scattering for Measuring Size and Concentration of Condensation Particles in Supercooled Hypersonic Flow. " NACA TN 2441, August 1951.
98

AEDC-TR-74-31
6. Wegener, P. P. and Stein, G. D. ''JLight Scattering Experiments and Theory of Homogeneous Nucleation in Condensing Super- sonic Flow. " Combustion Institute, International Symposium on Combustion, University of Poiters, Poiters, France, 1968, pp. 1183-1190.
7. Stein, G. D. "Angular and Wavelength Dependence from a Cloud of Particles Formed by Homogeneous Nucleation. " Dept. of Engineering and Applied Science, Yale University, December 1968.
8. Clumpner, J. A. "Light Scattering from Ethyl Alcohol Droplets Formed by Homogeneous Nucleation. " The Journal of Chem- ical Physics, Vol. 55, No. 10, November 1971, pp. 5042- 5045.
9. Beylich, A. E. "Condensation in Carbon Dioxide Jet Plumes. " AIAA Journal, Vol. 8, No. 5, May 1970, pp. 965-967.
10. Beylich, A. E. "Experimental Investigation of Carbon Dioxide Jet Plumes. " The Physics of Fluids, Vol. 14, No. 5, May 1971, pp. 898-905.
11. Daum, F. L. and Farrell, C. A. ''Light Scattering Instrumenta- tion for Detecting Air Condensation in a Hypersonic Wind Tun- nel. " Fourth International Congress on Instrumentation in Aerospace Simulation Facilities. Brussels, Belgium, June 1971, pp. 209-215.
12. Hoffman, R. J. , English, W. D.. Oeding, R. G., and Webber, W. T. "Plume Contamination Effects Prediction: The CON- TAM Computer Program. " AFRPL-TR-71-109, December 1971.
13. Muntz, E. P. and Marsden, D. J. "Electron Excitation Applied to the Experimental Investigation of Rarefied Gas Flows. " Rarefied Gas Dynamics Symposium, Vol. II, edited by J. A. Laumann. Academic Press, Inc., New York, 1963, pp. 495- 526.
14. Williams, W. D., Hornkohl, . J. O. , and Lewis, J. W. L. "Elec- tron Beam Probe for a Low Density Hypersonic Tunnel. " AEDC-TR-71-61 (AD 727004), July 1971.
15. Szymanski, H. A., Editor. Raman Spectroscopy: Theory and Practice. Plenum Press, New York, 1967.
99
AEDC-TR-74-31
^6. Hülst, H. C. van de. Light Scattering by Small Particles. John Wiley and Sons, New York, 1957.
17. Born, M. and Wolf, E. Principles of Optics. Pergamon Press, Oxford, England, 1965. (Third edition).
^/fö. Kerker, M. The Scattering of Light and Other Electromagnetic Radiation. Academic Press, New York, 1969.
19. Morse, P. M. and Feshback, H. Methods of Theoretical Physics, Part II. McGraw-Hill, New York, 1953.
20. Smithson, H. K. , Price, L. L. , and Whitf ield, D. L. 1,Wind Tun- nel Testing of Interactions of High Altitude Rocket Plumes with the Free Stream. " AEDC-TR-71-118 (AD 731141), September 1971.
21. Williams, W. D. "Laboratory Verification Studies of Rotational and Vibrational Temperature Measurements by the Electron Beam Technique. " AEDC-TR-68-265 (AD 683001), February 1969.
22. Hirschfelder, J. O., Curtis, C. F., and Bird, R. B. Molecular Theory of Gases and Liquids. John Wiley and Sons, New York, 1954.
23. Prozan, R. J. "Development of a Method of Characteristics Solu- tion for Supersonic Flow of an Ideal, Frozen, or Equilibrium Reacting Gas Mixture. " Lockheed Report No. HREC A782535, April 1966.
24. Whitfield, D. L. "Viscous Effects in Low-Density Nozzle Flows. " AEDC-TR-73-52 (AD 761489), June 1973.
25. Potter, J. L. and Boylan, D. E. "Experience with an Overex- panded Nozzle in a Low-Density, Hypervelocity Tunnel. " AEDC-TR-62-85 (AD 274383), April 1962.
26. Marrone, P. V. "Rotational Temperature and Density Measure- ments in Underexpanded Jets and Shock Waves Using an Elec- tron Beam Probe. " University of Toronto Institute for Aero- space Studies Report No. 113, April 1966.
100

AEDC-TR-74-31
NOMENCLATURE
A Cross-sectional area of stream tube
a Radius of condensed particle
a^ Initial radius of condensation nuclei
aQ Nominal radius of nitrogen molecule
Cpi, Cf2 Constants
Cp Specific heat at constant pressure
D Nozzle throat diameter
Incident electric field unit vector
Scattered electric field unit vector
G Size distribution function
hQ Stagnation enthalpy
I0 Incident intensity
Is Scattered intensity
Lj Intensity scattered perpendicular to the scattering plane
IQ Intensity scattered parallel to the scattering plane
VQ Incident electric field propagation unit vector
Ks Scattered electric field propagation unit vector
L(T, a) Latent heat of condensation at temperature, T, of a drop of radius a. [mL(T, a) is the energy required to evaporate one molecule.]
L(T, a} Mean value of L(T, a) for the complete evaporation of a condensate particle.
A Characteristic length of the scattering volume
m Molecular mass
m Mass flux within stream tube
N Number density
N0 Reservoir number density
101
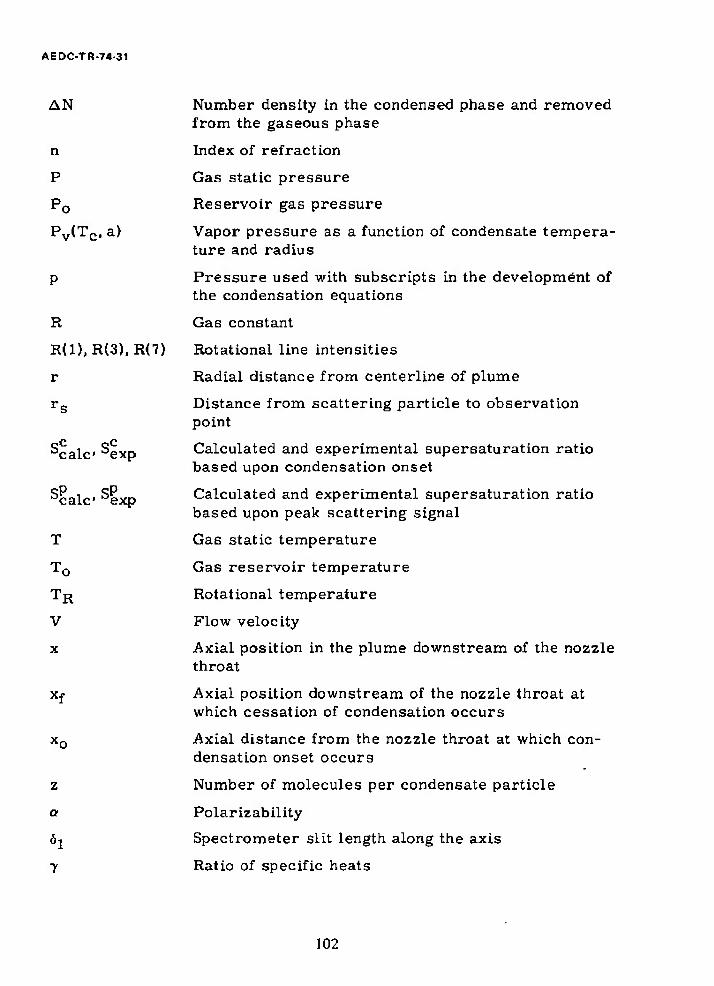
AEDC-TR-74 31
AN Number density in the condensed phase and removed from the gaseous phase
n Index of refraction
P Gas static pressure
P0 Reservoir gas pressure
PV(TC, a) Vapor pressure as a function of condensate tempera- ture and radius
p Pressure used with subscripts in the development of the condensation equations
R Gas constant
R(l), R(3), R(7) Rotational line intensities
r Radial distance from centerline of plume
rs Distance from scattering particle to observation point
^calc ^exp Calculated and experimental supersaturation ratio based upon condensation onset
locale' SPxp Calculated and experimental supersaturation ratio based upon peak scattering signal
T Gas static temperature
T0 Gas reservoir temperature
TR Rotational temperature
V Flow velocity
x Axial position in the plume downstream of the nozzle throat
Xf Axial position downstream of the nozzle throat at which cessation of condensation occurs
x0 Axial distance from the nozzle throat at which con- densation onset occurs
z Number of molecules per condensate particle
a Polarizability
öj Spectrometer slit length along the axis
7 Ratio of specific heats
102

AEDC-TR-74-31
c Initial number fraction of condensation nuclei
A Wavelength of irradiating light
p Density
PT Depolarization ratio
CT Surface tension
Q,$ Angles defining the scattering plane
T Symbolically represents space coordinates
Subscripts
1, 2 Refer to perfect gas properties of uncondensed and condensed particles, respectively
c Refers to condensate particles
i Refers to initial condensation nuclei
■ Refers to free-stream properties
103