unclassified ad 409 434 · solid solution resulting from the relative sizes of the solvent and...
TRANSCRIPT
UNCLASSIFIED
AD 409 434
DEFENSE DOCUMENTATION CENTERFOR
SCIENTIFIC AND TECHNICAL INFORMATION
CAMERON STATION, ALEXANDRIA, VIRGINIA
UNCLASSIFIED

NOTICE: When government or other drawings, speci-fications or other data are used for any purposeother than in connection with a definitely relatedgovernment procurement operation, the U. S.Government thereby incurs no responsibility, nor anyobligation whatsoever; and the fact that the Govern-ment may have formulated, furnished, or in any waysupplied the said drawings, specifications, or otherdata is not to be regarded by implication or other-wise as in any manner licensing the holder or anyother person or corporation, or conveying any rightsor permission to manufacture, use or sell anypatented invention that may in any way be relatedthereto.
C ASD-TDR-63-204
409 '434S LID SOLUBILITY LIMITS OF Y AND Sc IN THE ELEMENTS
W, Ta, Mo, Nb, AND Cr
~TECHNICAL DOCUMENTARY REPORT NO. ASD-TDR-63-204
May 1963
Directorate of Materials and Processes
Aeronautical Systems Division
Air Force Systems Command
Wright-Patterson Air Force Base, Ohio
Project No. 7351, Task No. 735103 ','-. ,
(Prepared under Contract No. AF33(6l16)-83 15 by Westinghouse Electric Corp.,Research Laboratories, Beulah Road, Churchill Borough, Pittsburgh 35, Pa.;
A. Taylor, Author)
NOTICES
When Government drawings, specifications, or other data are used for anypurpose other than in connection with a definitely related Government procure-ment operation, the United States Government thereby incurs no responsibilitynor any obligation whatsoever; and the fact that the Government may haveformulated, furnished, or in any way supplied the said drawings, specifications,or other data, is not to be regarded by implication or otherwise as in anymanner licensing the holder or any other person or corporation, or conveyingany rights or permission to manufacture, use, or sell any patented inventionthat may in any way be related thereto.
Qualified requesters may obtain copies of this report from the Armed
Services Technical Information Agency, (ASTIA), Arlington Hall Station,Arlington 12, Virginia.
This report has been released to the Office of Technical Services, U.S.Department of Commerce, Washington 25, D.C., in stock quantities for saleto the general public.
Copies of this report should not be returned to the Aeronautical SystemsDivision unless return is required by security considerations, contractual
obligations, or notice on a specific document.
B
3 0
FOREWORD
This report was prepared by Westinghouse Electric Corporation, ResearchoLaboratories, under USAF Contract No. AF 33(616)-8315. This contract vas ini-tiated under Project No. 7351, "Metallic Materials," Task No. 735103, *UniqueMetallic Materials and Techniques." The work was administered under the dirs-tion of the Metals and Ceramics Division, Air Force Materials Laboratory, Aero-nautical Systems Division, with Mr. K. L. ojola acting as project engineer.
This report covers work conducted from 1 June 1961 to 30 November 1962.
The author wishes to acknowledge the assistance of N. J. Doyle in prepar-ing the specimens and carrying out the X-ray diffraction work, W. M. Hickmaand G. G. Sweeney for the mass spectroscopy, and Roy L. Anderson for the prep-aration of the pbotomicrographs.
ABSRACT
Alloys and diffusion couples of yttrium and scandium with the refrac-tory elements Nb and Ta of Group V and Cr, Mo, and W of Group VI have beenexamined by means of the optical microscope, X-ray diffraction, and massspectrometry. The results indicate that the solid solubility of Y and Scin these elements is less than 1 part per million. This is in conformity.-ith the Hume-Rothery Rule that only a very restricted range of solid solu-tion can be expected when the atomic diameter of solvent and solute differby more than 14 to 15 per cent.
This technical documentary report has been reviewed and is approved.
I. PERLXUTTERChief, Physical Metallurgy BranchMetals and Ceramics DivisionAir Force Materials Laboratory
0
iii
!0
,s0
TABLE OF CONTENTS
PAGE
INTRODUCTION 1
THERMAL AND CRYSTALLOGRAPHIC DATA 1
EXPERIMENTAL 2
RESULTS 7
I. ALLOYS WITH YTTRIUM 7
II. ALLOYS WITH SCNDI-UM 12
CONCLUSIONS 15
REFERENCES 15
LIST OF ILLUSTRATIONS
1. Yttrium-Chromium Phase Diagram 16
2. Yttrium-Niobium Phase Diagram 17
3. Yttrium-Molybdenum Phase Diagram 18
4. Yttrium-Tantalum Phase Diagram 19
5. Yttrium-Tungsten Phase Diagram 20
6. Tungsten Tube High Temperature Furnace 21
7. Pointed Counter Electrode as a Mass Spectrograph Microprobe 22
8. Layout of Mass Spectrograph (Schematic) 23
9. 99.999% Cr Argon Arc Melted as Cast 24
10. 75 Cr 25Y Argon Arc Melted as Cast 24
11. 75 Cr 25Y Annealed 68 hr 12000 C 24
iv
0

LIST OF ILLUSTRATIONS (cont.)
12. Nb as Cast (Nb + Carbide Traces) 25
13. 75 Nb 25Y As Cast (Nb + Unresolved Eutectic) 25
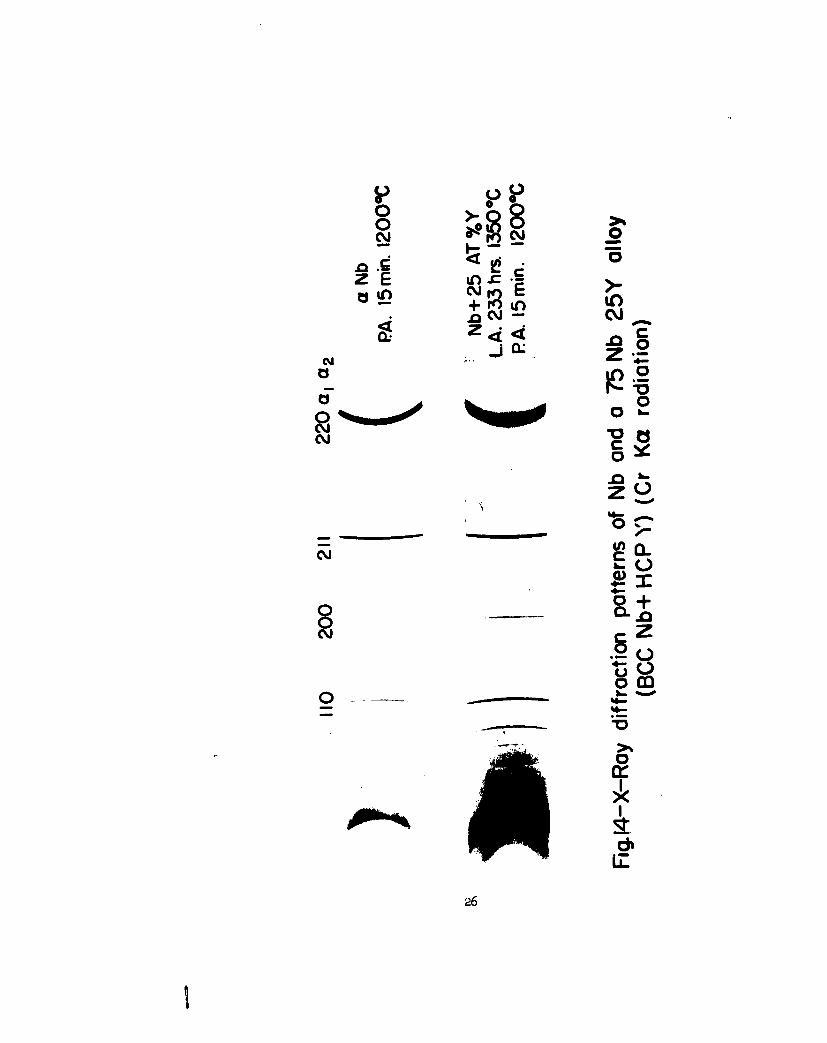
14. X-ray Diffraction Patterns of Nb and a 75 Nb 25Y Alloy 26
(BCC Nb + HCP Y) (Cr Ka Radiation)
15. 99.2 Nb 0.8Y Annealed 233 hr 13500 C (Nb + Y) 25
16. 99.8 Nb 0.2Y Annealed 233 hr 13500 C (Nb + Y) 25
17. Effect of Yttrium Additions on the Lattice Parameter 27
of Niobium
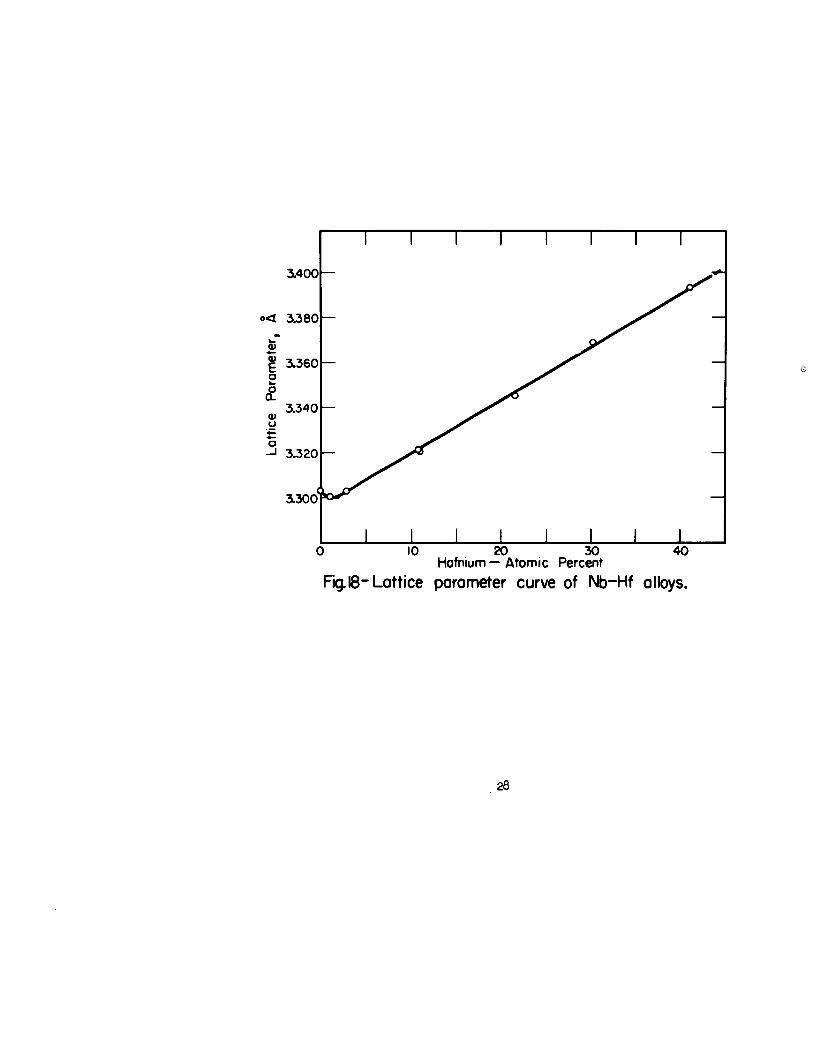
18. Lattice Parameter Curve of Nb-Hf Alloys 28
19. Mo-Y Diffusion Couple Interface. Mo + Eutectic 29
20. Sparked Areas Near Mo-Y Interface 29
21. Mass Spectra from Regions Near Mo-Y Interface 29
22. Y-Ta Diffusion Couple 30
23. Y-W Diffusion Couple 30
24. Sparked Areas Near Y-W Interface 30
25. Scandium Crystals on Tungsten Support Wire 31
26. 96.5 Cr 3.5 Sc as Cast 32
27. 95 Nb 5 Sc Annealed 113 hrs at 12000 C 32
28. Mo Cylinders Encapsulating Sc-Mo Diffusion Couple 33
29. Section Through Sc-Mo Diffusion Couple and Encapsulating 33
Cylinder
30. Sparked Areas Near Mo-Sc Interface 34
31. Tantalum Globules in Scandium Matrix Near Sc-Ta Diffusion 35
Couple Interface
32. Sparked Areas Near Sc-Ta Interface 35
33. Region of Tungsten Rod at W-Sc Interface 36
V
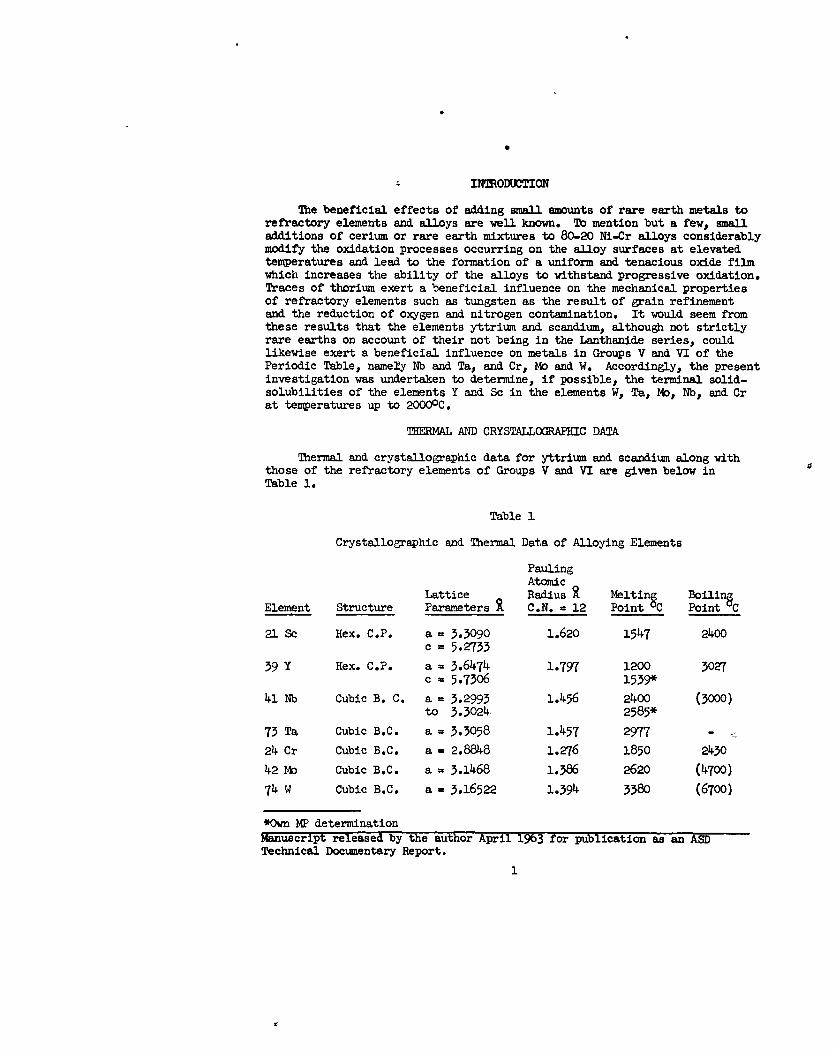
"INTODUCTION
The beneficial effects of adding small amounts of rare earth metals torefractory elements and alloys are well known. To mention but a few, smalladditions of cerium or rare earth mixtures to 80-20 Ni-Cr alloys considerablymodify the oxidation processes occurring on the alloy surfaces at elevatedtemperatures and lead to the formation of a uniform and tenacious oxide filmwhich increases the ability of the alloys to withstand progressive oxidation.Traces of thorium exert a beneficial influence on the mechanical propertiesof refractory elements such as tungsten as the result of grain refinementand the reduction of oxygen and nitrogen contamination. It would seem fromthese results that the elements yttrium and scandium, although not strictlyrare earths on account of their not being in the Lanthanide series, couldlikewise exert a beneficial influence on metals in Groups V and VI of thePeriodic Table, namely Nb and Ta, and Cr, Mo and W. Accordingly, the presentinvestigation was undertaken to determine, if possible, the terminal solid-solubilities of the elements Y and Sc in the elements W, Ta, Mt, Nb, and Crat temperatures up to 20000C.
THERMAL AND CRYSTALLOGRAPHIC DATA
Thermal and crystallographic data for yttrium and scandium along withthose of the refractory elements of Groups V and VI are given below inTable 1.
Table 1
Crystallographic and Thermal Data of Alloying Elements
PaulingAtomic
Lattice Radius Melting BoilingElement Structure Parameters C.N. = 12 Point °C Point C
21 Sc Hex. C.P. a = 3.3090 1.620 1547 2400c = 5.2733
39 Y Hex. C.P. a = 3.6474 1.797 1200 3027c - 5.7306 1539*
41 Nb Cubic B. C. a - 3.2993 1.456 2400 (3000)to 3.3024 2585*
73 Ta Cubic B.C. a - 3.3058 1.457 2977 -
24 Cr Cubic B.C. a - 2.8848 1.276 1850 2430
42 14 Cubic B.C. a - 3.1468 1.386 2620 (4700)
74 W Cubic B.C. a - 3.16522 1.394 3380 (6700)
*Own MP determinationManuscript released by the author April 1963 for publication as an ASDTechnical Documentary Report.
1

According to Hume-Rothery (1) there axe limits set upon the range ofsolid solution resulting from the relative sizes of the solvent and soluteatoms and their valencies. When the atomic diameters of solvent and solutediffer by more than 14 to 15 per cent from that of the solvent, the sizefactor is unfavorable and only a very restricted range of solid solution canbe expected. 1oreover, a metal of lower valency is more likely to dissolveone of higher valency than vice-versa, especially when the solvent obeysthe "(8 - N)-rule" and forms homopolar bonds.
From the atomic radii presented in Table 1, it can readily be seen thatexcept for Sc in Nb or Ta (radius ratio 11.3%), the size factor is extremelyunfavorable, a typical example being Y in Nb or Ta where the atomic radiidiffer by approximately 23.5%. As a result, it can be anticipated that thesolid solubilities of Y and Sc in the refractory Groups V and VI elementswill be extremely small, with the possible exception of Sc in Nb or Ta.
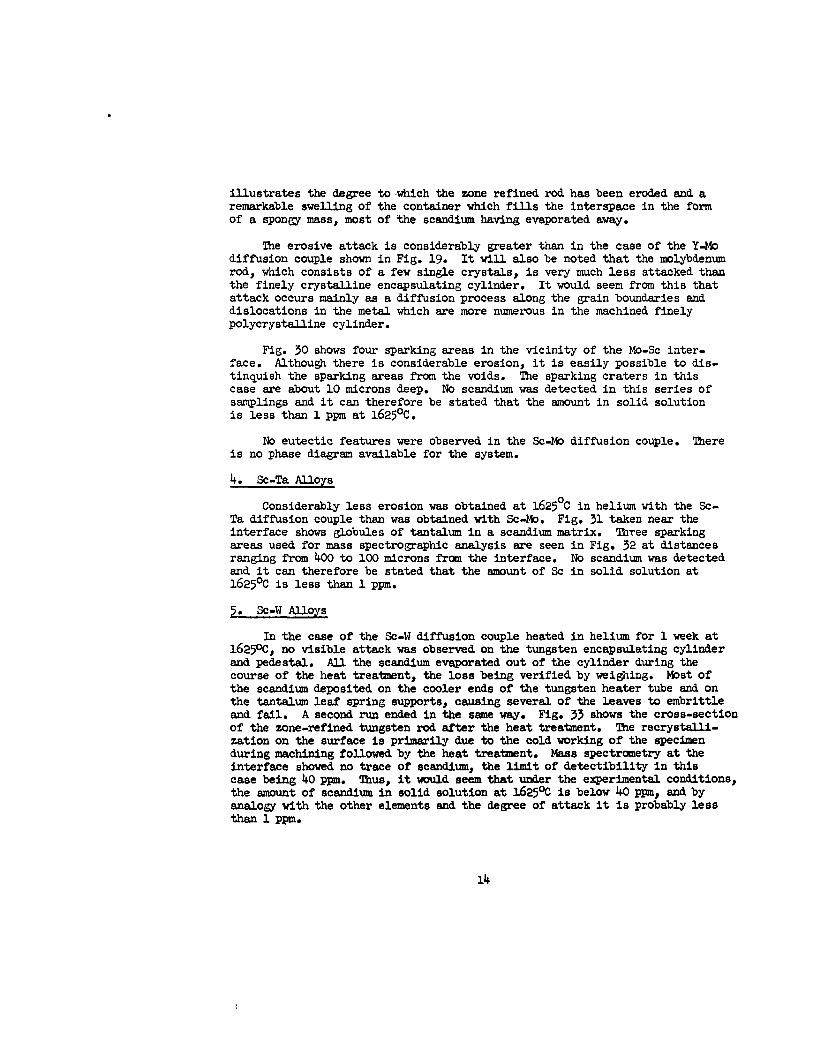
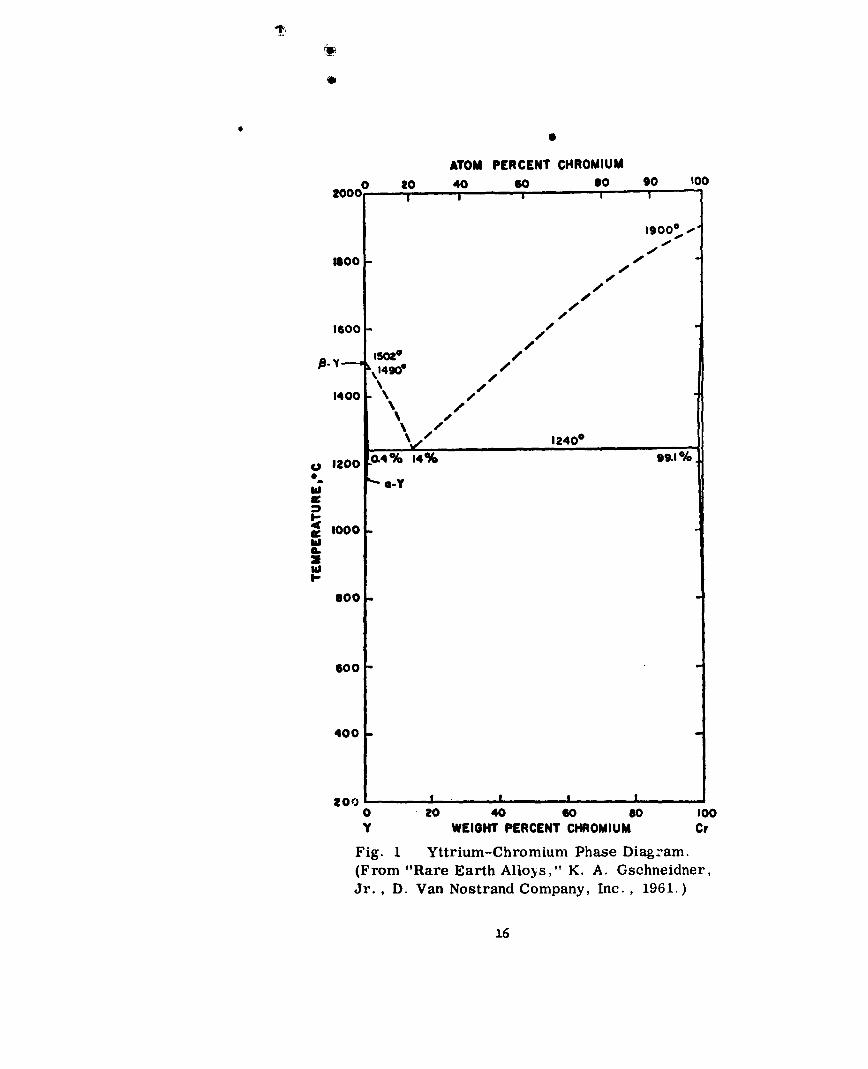
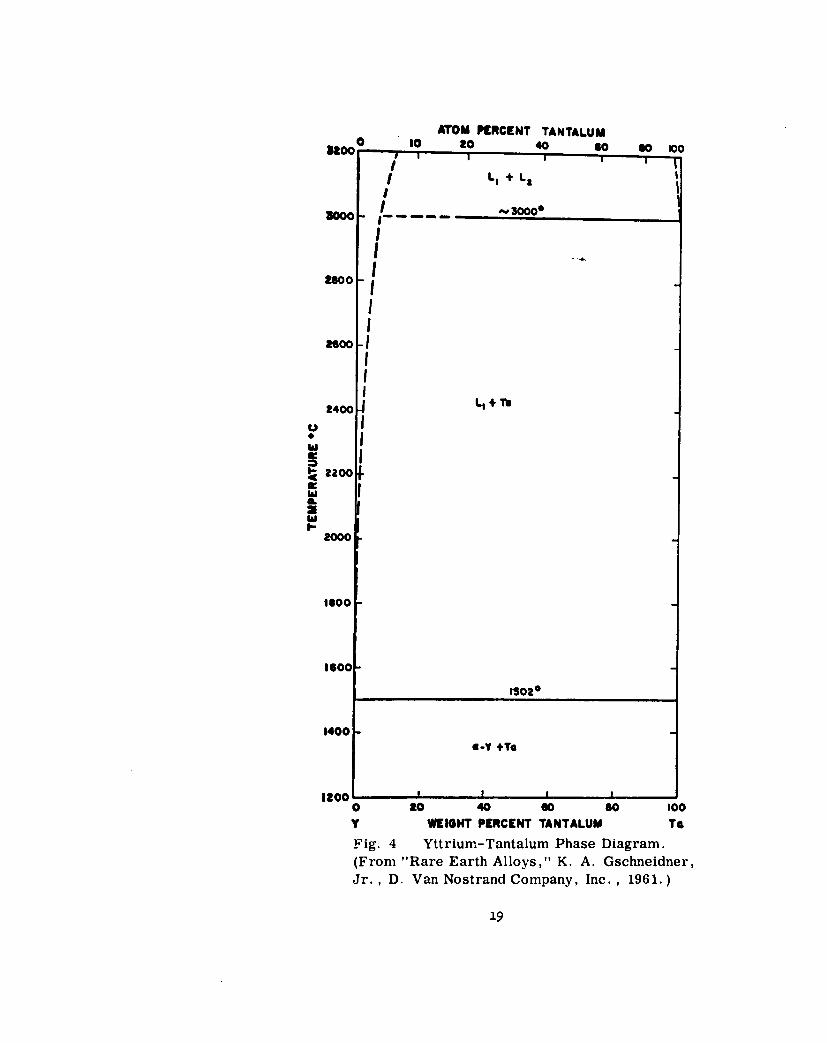
When the present investigation was initiated, there were no data on theabove-mentioned alloy systems available in the literature, but subsequentlythe book "Rare Earth Alloys" by K. A. Gschneidner (D. Van Nostrand and Co.,Inc., 1961) appeared which gave a number of systems taken from ClassifiedReports. Figs. 1-5 inclusive reproduce diagrams of the systems Y-Nb, Y-Cr,Y-Mo, Y-Ta and Y-W from Gschneidner's book. It will be seen readily thatthe amount of Y in solid solution is extremely small, in conformity with theHume-Rothery size-factor rule. No diagrams are available for comparableSc-containing alloys, but from the crystallographic data in Table 1, similarresults are to be expected.
EXPERIMENTAL
Materials Employed
In view of the anticipated low solid-solubility of the rare earth ele-ments in the refractory metals W, Ta, Mo, Nb, and Cr, it was important toemploy materials of the highest purity possible in order to avoid any con-fusion in the identification of second phases and the determination of thesolid-solubility limits. The following materials were used:
Yttrium. American Potash and Chemical Co. Purity designation 99.9%.Rare eart aximum imqurities 0.1% Dy + Gd + traces Tb. 0.07% 0, 0.005% N,0.001% No, 0.015% C.
Scandium. American Scandium Corporation. 99.5% distilled metal.
T . Westinghouse Corporation. Zone refined rod. Impurities inparts per m3ion, 1-2Q, 1-2N, 1-2H, 10C, total metallics less than 50 ppm.
Tantalum. As for tungsten, with total metallics less than 100 ppm.
2

Niobium (Columbium) (a) Rondelles. Union Carbide Corp. Electron bom-bardeT -a--ial. uity stated to be 99.99%. (b) Metals Resins Corporation.Zone refined. Maximum total impurities 25 ppm. Maximum total 02 content9 ppm.
Chromium. United Mineral and Chemical Corp. Pellets. 99.999% purity.Zone refined material not available.
Molybdenum. Westinghouse Corporation. Zone refined Rod. Total impuri-
ties less than 50 ppm.
Alloying and Heat Treatment Procedures
Because of the highly oxidizable nature and elevated melting points of
the alloying elements, conventional alloying procedures, such as melting under
flux in a ceramic crucible, were clearly out of the question. The followingalternative alloying techniques were suggested:
(1) Alloying by direct melting in vacuum or an inert atnosphere, suchas purified helium or argon, using a Kroll-type arc furnace fittedwith a non-consumable tungsten electrode and a water-cooled copperhearth.
(2) Electron-beam melting in vacuum.
(3) Levitation melting in an evacuated, or inert atmosphere high fre-
quency furnace to avoid contact with metallic or ceramic materials.
(4) Diffusion-couple techniques using either solid consitutents and
solid-state diffusion or liquid Y or Sc in contact with a solidrefractory element.
(5) Alloying by the admixture of a fused rare-earth element salt, such
as a chloride or fluoride, which decomposes and leaves the rare-earth metal in solution.
On account of the unfavorable densities of the materials, it was foundimpracticable to employ levitation melting. Ultimately, the methods usedwere the Kroll furnace technique in which an atmosphere of pure argon wasemployed and the diffusion couple method in which the liquid rare-earth metalwas in contact with solid, zone-refined refractory element.
Alloys made in the Kroll type furnace were in the form of small buttons,
each weighing approximately 30 grams. Prior to melting, the furnace wasevacuated to a pressure of 10" Torr by means of a mechanical pump, thenflushed 4 times with argon and finally filled with argon to a pressure of
approximately 1/2 atmos. The gas was then gettered by melting a 25 gramtitanium button in the arc, after which the arc was transferred to the sample
proper. Difficulties were frequently encountered with the melting of thesamples owing to their tendency to separate into two liquid phases or to a
3
solid plus liquid rare-earth constituent. Added to this difficulty, therewas a tendency for the rare earth metal to volatilize and deposit on thewater-cooled metal components of the furnace and on the glass enclosure.These losses could be accounted for by weighing the sample before and aftermelting.
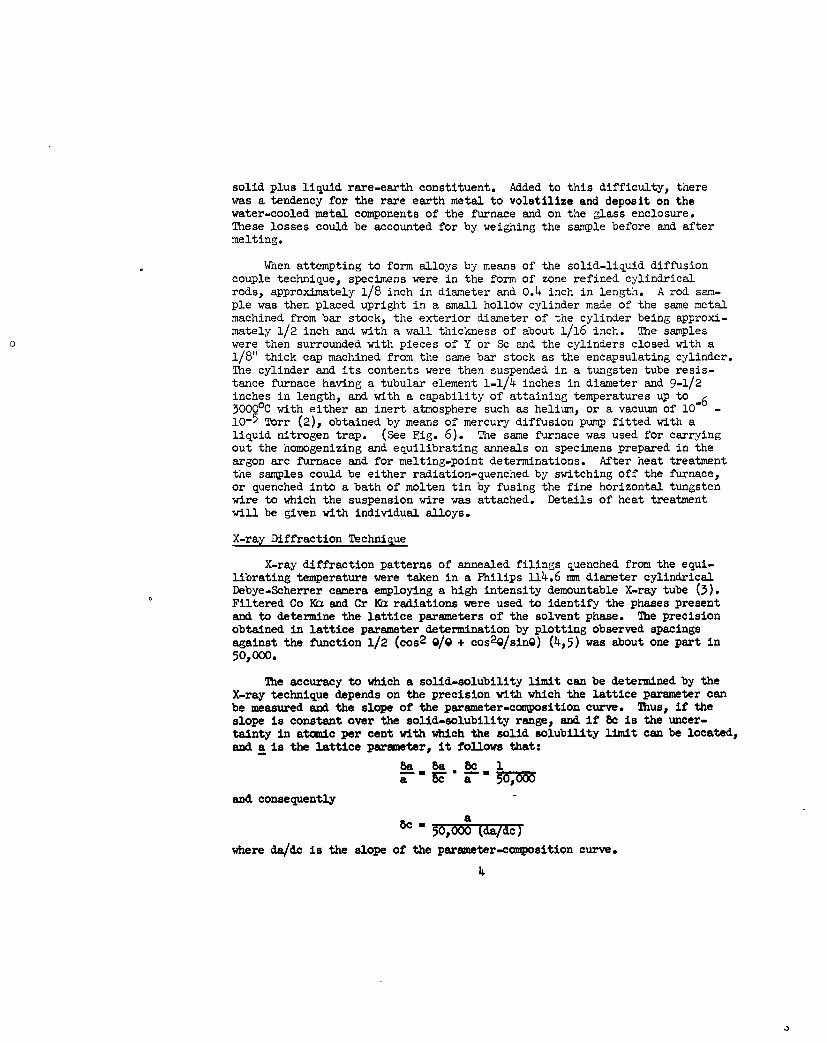
When attempting to form alloys by means of the solid-liquid diffusioncouple technique, specimens were in the form of zone refined cylindricalrods, approximately 1/8 inch in diameter and 0.4 inch in length. A rod sam-ple was then placed upright in a small hollow cylinder made of the same metalmachined from bar stock, the exterior diameter of the cylinder being approxi-mately 1/2 inch and with a wall thickness of about 1/16 inch. The samples
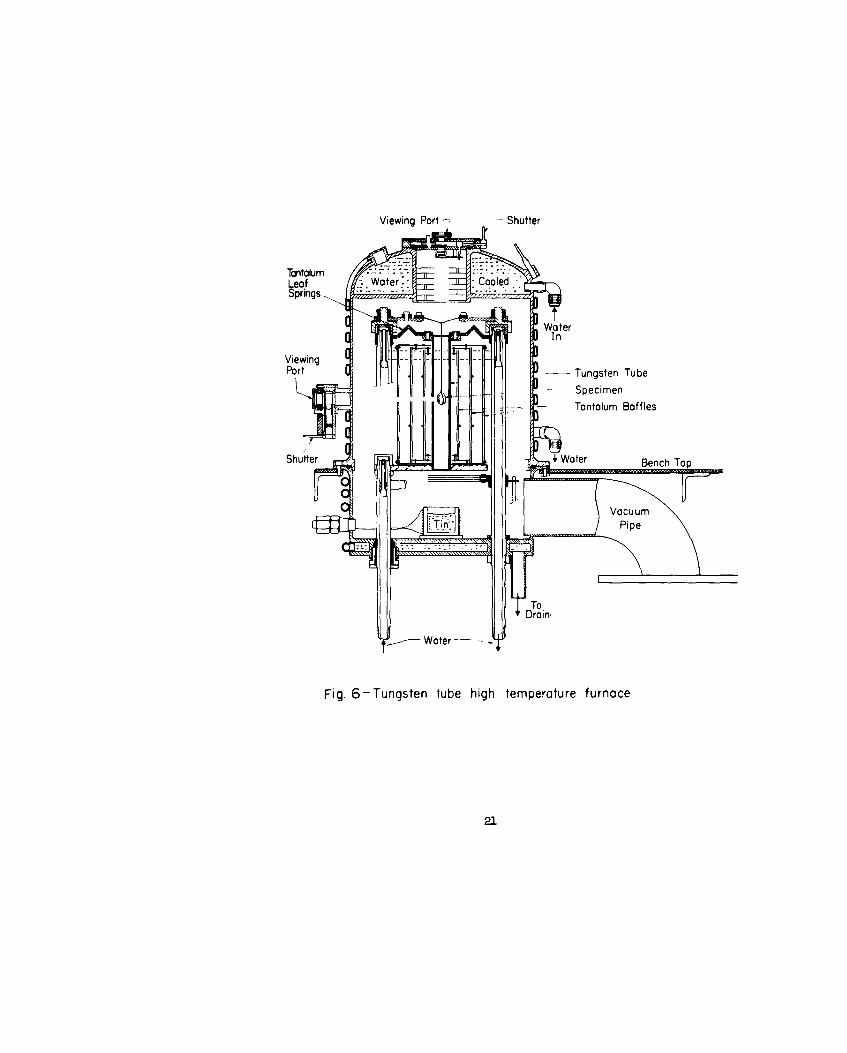
0 were then surrounded with pieces of Y or Sc and the cylinders closed with a1/8" thick cap machined from the same bar stock as the encapsulating cylinder.The cylinder and its contents were then suspended in a tungsten tube resis-tance furnace having a tubular element 1-1/4 inches in diameter and 9-1/2inches in length, and with a capability of attaining temperatures up to -630000 C with either an inert atmosphere such as helium, or a vacuum of 10 -lO-5 Torr (2), obtained by means of mercury diffusion pump fitted with aliquid nitrogen trap. (See Fig. 6). The same furnace was used for carryingout the homogenizing and equilibrating anneals on specimens prepared in theargon arc furnace and for melting-point determinations. After heat treatmentthe samples could be either radiation-quenched by switching off the furnace,or quenched into a bath of molten tin by fusing the fine horizontal tungstenwire to which the suspension wire was attached. Details of heat treatmentwill be given with individual alloys.
X-ray Diffraction Technique
X-ray diffraction patterns of annealed filings quenched from the equi-librating temperature were taken in a Philips 114.6 mm diameter cylindricalDebye-Scherrer camera employing a high intensity demountable X-ray tube (3).Filtered Co Ka and Cr KU radiations were used to identify the phases presentand to determine the lattice parameters of the solvent phase. The precisionobtained in lattice parameter determination by plotting observed spacingsagainst the function 1/2 (cos 2 g/g + cos20/sino) (4,5) was about one part in50,000.
The accuracy to which a solid-solubility limit can be determined by theX-ray technique depends on the precision with which the lattice parameter canbe measured and the slope of the parameter-composition curve. Thus, if theslope is constant over the solid-solubility range, and if 8c is the uncer-tainty in atomic per cent with which the solid solubility limit can be located,and a is the lattice parameter, it follows that:
8a ba .C 1
and consequently
bc a50,wr5 (da/ic
where da/de is the slope of the paremeter-composition curve*

If r is the atomic radius of the solvent, and Ar is the change in atomicper cent change in composition, the above equation may be written
8c M r50,000 (An100)7
M r per cent.
For the Y-Nb system, using Table 1, r = 1.456 R and Ar = 1.797 - 1.456 - O.34L.Hence the precision to which the solid-solubility limit can be fixed by meansof a lattice parameter determination is given by ac = 1.456/500-.0341 = 0.085atomic per cent. Alternatively, if there is 0.085 at. % Y in solid solutionin Nb, the change in lattice parameter will just be on the limit of detect-ability. Similarly the limit of detectability of Sc in Nb or Ta, where theradius ratio is 11. % and therefore favorable, would be 5c = 1.456/500-0.164 =0.18 atomic %. The X-ray technique, under favorable circumstances, is thuscapable of detecting quite small amounts of solute in solid solution.
Micrographic Examination
Whereas the X-ray diffraction technique is suitable for identifying thephases present in an alloy and of determining the amount of solute in solidsolution, the microscope yields information concerning the distribution ofthe phases and will frequently detect the presence of small quantities of asecond constituent which fails to show up in the diffraction pattern owing toan unfavorable signal to background ratio. In general, all the alloys wereexamined in the "as cast" or homogenized and equilibrated condition. Theywere mounted in lucite and then ground and polished on "Automet" machines.The following etching reagents were employed.
1. Tungsten Alloys
30 ml lactic acid10 ml HN035mlIF
2. Mlybdenun Alloys
30 ml lactic acid10 ml HN035mlHF
3. Tantalum Alloys
15 ml HN0 330 ml HCl30 ml HF
5
4. Niobium Alloys
50 ml 2014 ml H2 SO45 ml H0o3
20 ml HF
5. Chromium Alloys
Unetched
Mass Spectrographic Analysis
In view of the extremely small amount of Y and Sc in solution in therefractory elements of the Vth and Vth Groups as shown by the lack of coringin the-microspecimens and the X-ray diffraction results, it was decided toemploy mass spectroscopy in certain cases to analyse the solvent after heattreatment. For this purpose a vacuum spark sourceomass spectrograph wasemployed having a sensitivity of approximately 101 to 10I atoms, therebyenabling elemental concentrations of I in 10 atoms to be obtained. Sincethe ion signal is linearly proportional to the concentration, the mass spec-trograph is equally sensitive to all elements.
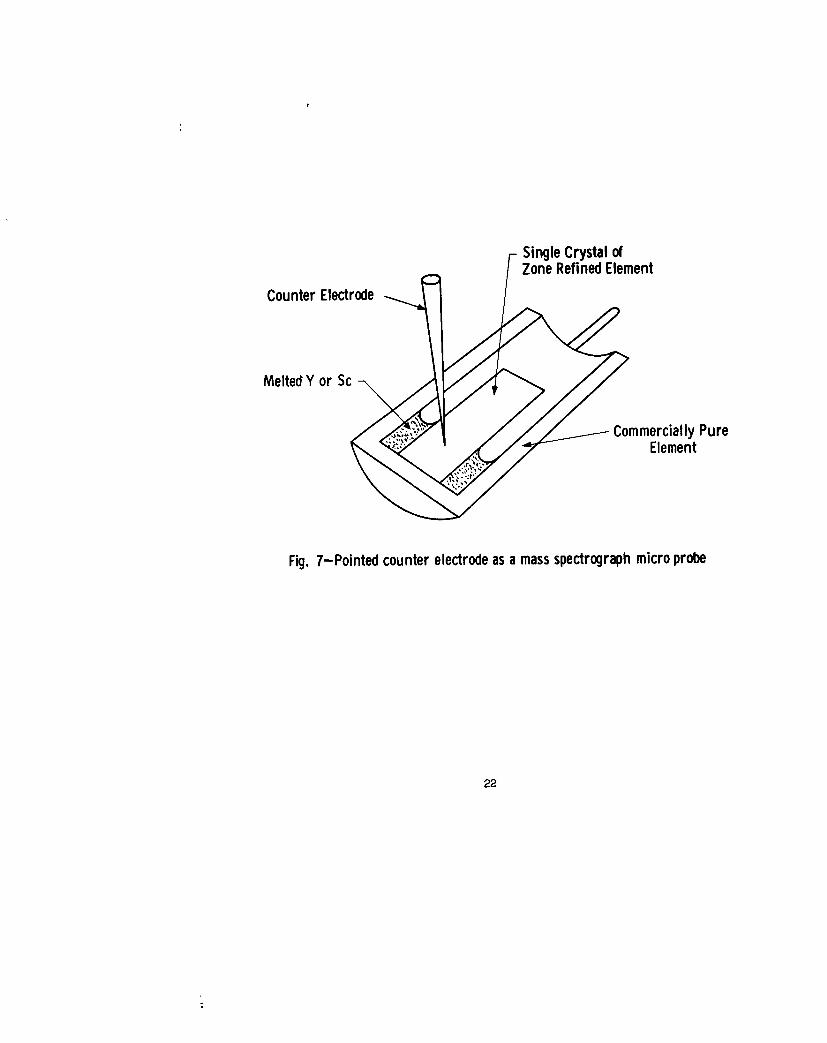
The spectrograph was employed in conjunction with the liquid rare earth-solid refractory element diffusion couple using a specially designed needle-shaped counter-electrode which enabled a radio-frequency spark to ionize aselected region of the sample haying a diameter of 25-50 microns, removingmaterial to a depth of 3-5 microns. It was possible to employ the counter-electrode as an analytical probe by aligning it with the aid of an opticalmicroscope so as to spark selected regions of the refractory element in theregion of the liquid-solid interface. The quantity of sample consumed bythe spark was of the order of 1-10 micrograms, which allowed a concentrationof 1 part per million of solute to be observed. To avoid contamination, theneedle-probe was made of the same material as the solvent element.
Fig. 7 illustrates schematically a vertical section taken through adiffusion couple and its encapsulating cylinder. The section is carefullypolished prior to sparking, the visible mark on the surface produced by thespark enabling the spectrum to be associated with a well-defined location ofthe sample. In this manner it is possible to determine the concentration ofrare-earth element as a function of distance from the solid-liquid interface.
Fig. 8 illustrates schematically the geometry of the mass spectrograph.The ions are detected by means of a photographic plate located in the focalplane, the design of the instrument permitting a mass-ratio of 15 to 1 to beregistered in a single exposure with a mass resolution of 1 in 500.
6
* . ~- .-

RESULTS
I. Alloys With Yttrium
1. Y-Cr Alloys
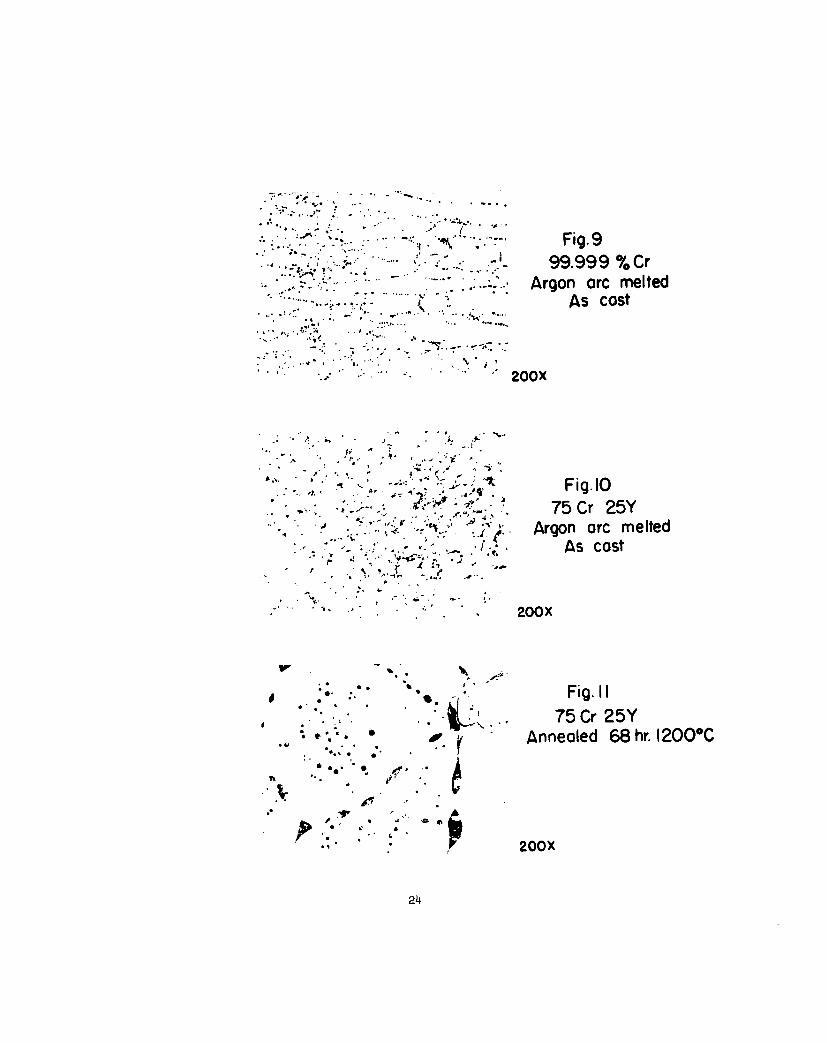
Prior to alloying, the high purity chromium pellets were deassed by heat-ing to 12000C in a pure alumina crucible in a vacuum of lo 5 -lo-OTbrr for24 hours using a high frequency induction furnace fitted with a mercury dif-fusion pump and liquid nitrogen trap. A photomicrograph of the degassed metalafter melting in the argon arc furnace is shown in Fig. 9. The material evi-dently contains traces of residual oxide, or possibly carbide. The initialweight of the sample was 10.13 grams before melting and 10.04 after, the netloss in weight being 0.09 grams.
A sample containing 25 atomic per cent yttrium was prepared by melting4 times in the argon arc furnace, the initial weight of material being 27.00grams, the weight of the "as cast" alloy being 26.91 grams -- a net weightloss of only 0.09 grams.
A photomicrograph of the as cast alloy is shown in Fig. 10. This displaysa typical dendritic structure of chromium metal with an infilling of Y-Creutectic, as would be expected from the phase diagram shown in Fig. 1. Debye-Scherrer diffraction patterns from unannealed filings of the as cast ingotrevealed no constituents other than the primary phases Cr and Y.
The 25 atomic per cent yttrium-chromium alloy was subjected to a 68 hourhomogenizing anneal in a vacuum of 10-6 Torr at 12000C, which is only 400Cbelow the eutectic temperature. As shown by the microstructure in Fig. U,there is a considerable aggregation of the yttrium and chromium phases. X-raydiffraction patterns of alloy filings which had been subjected to a stressrecovery "flash anneal" in vacuo for 2 minutes at 12000C using Cr Ka radiationshowed only lines belonging to chromium and yttrium.
The lattice parameter of 99.999% Cr was found to be 2.847 (5) + 0.0001 R,while that of the 75-25 Cr-Y alloy was 2.8848 (0) + 0.0OO1 . The differencein parameter clearly lies within the experimental error which is approximately1 part in 50,000 and which, based on the atomic radii of 1.797 R for Y and1.276 for Cr corresponds to a maximum possible solid-solubility of around 0.005atomic per cent Y in Cr.
The published Vickers diamond hardness number of chromium varies from 548for electroplated material (presumably due to its hydrogen content) to 127 foras cast chromium. Our own measurements on as cast chromium yielded a Vickershardness of 126 + 1 (mean of three) while the 75 Cr 25 Y alloy gave a value of103 + 1 (mean of-three). This very low value is probably due to the largeamount of segregated yttrium in the microstructure.
7

2. Y-Nb Alloys
Initially, two master Y-Nb alloys were made from Union Carbide niobiumrondelles by melting under argon in the Kroll furnace, the alloys containing5 and 25 atomic % yttrium, respectively. A photomicrograph of the niobium inthe "as cast" condition is shown in Fig. 12 and reveals traces of a secondphase which is probably carbide, or carbo-nitride. This phase is absent inthe Nb-Y alloys. Fig. 13 illustrates the microstructure of 75 Nb 25 Y inthe as cast condition and shows that the alloy is badly segregated, the darkconstituent being unresolved eutectic.
Since no phase diagram of the system was available at the outset of theinvestigation, an attempt was made to homogenize small slices of the alloysin a vacuum of i0-5 to 10" Torr for 446 hours at 20000 C. Weight checks onthe heat treated alloys indicated losses corresponding almost exactly to thetotal amount of yttrium originally present in the samples. It was subsequentlydiscovered, when the phase diagram shown in Fig. 2 became available that theheat treatment had been carried out at approximately 400 0C below the mono-tectic horizontal (-24000C) and well inside the 2-phase field consisting ofsolid Nb + liquid.
On account of the high volatility of the y phase, it was decided toreduce the homogenizing temperature for the remaining slices of specimen.Accordingly, these slices were heat treated in vacuo for 68 hours at 12000CPwhich, from the phase diagram, is 2700C below the eutectic horizontal (147uC).The weight losses during these anneals were found to be negligible.
In order to ascertain whether any yttrium had gone into solution, thesamples were filed and the filings given a "flash" anneal to remove cold workby heating in vacuum in a niobium container for 5 minutes at 1200°C, afterwhich Debye-Scherrer patterns were taken with Cr Ka radiation. (Fig. 14).Only lines belonging to the terminal phases Nb and Y were observed. Latticeparameter measurements of the original Union Carbide niobium and of theniobium-yttrium alloys made with it yielded the following:
8

Table 2
Lattice Parameters of Nb-Y Alloys Made With Union Carbide Niobium
Nominal Composition Latticein atomic per cent Phases Parmeter
Nb Y Heat Treatment Present
100 0 Arc melted, filed, 2 min. at Nb 3.3026120CPC.
95 5 Lump annealed 68 hyrsA at 12000C, Nb + Y 3.2996filed, 5 min. at 1200C.
75 25 Lump annealed 68 hyrs. at 12000C, Nb + Y 3.2993filed, 5 min. at 120OC.
These results are rather astonishing in that the lattice parameter of
niobium is actually lowered by the presence of yttrium instead of being raised.The only reasonable explanation for this effect is a possible scavenging actionby the yttrium which removes any oxygen in solid solution in the niobium, con-
verting it to yttrium oxide. This would fall in line with the work of Seybolt(6) on the solid-solubility of oxygen in niobium, where the lattice parameterof the matrix increases linearly from an extrapolated value of 3.2994 + 0.0004for zero oxygen to 3.3112 A for 0.75 wt. % 02 (4.2 At. %) in solution.-
Lattice parameter determinations made on Union Carbide niobium and the
zone refined material from Metals Resins Corporation yielded identical latticeparameters, namely 3.3024 + 0.0001 R corresponding to approximately 0.16 wt.% 02 (8.6 At. %) in solution despite the statement that the zone refined mater-ial contained only 9 parts per million of 02. Attempts to degas the rondellesand zone refined rod by annealing for periods of up to 70 hours in a vacuumof 10-5 Torr made no difference to the lattice parameter. Presumably much
lower pressures and higher temperatures and the use of thin strip (-0.001inches thick) are required to enable the oxygen to diffuse out of the materialin a reasonable period of time, for an extra-long degassing period of 233hours at 350°C gave the Union Carbide rondelles a lattice parameter of 3.3015+ 0.0001 E. There is, of course, always the remote possibility that someoxygen is picked up during the preparation of the filings and the cold-work
recovery anneal in vacuo at 12000 C.
In the search for the solid-solubility limit of Y in Nb, a master alloywas made up containing 1 atomic per cent Y. Although the atomic numbers ofY and Nb are close to each other (39 and 41 respectively), the pattern of free
Y could not be seen in the X-ray powder diagram although the Y phase was clearlyevident in the microstructure. Using the master alloy, a series of alloys con-
taining respectively 0.8, 0.6, o.4 and 0.2 atomic per cent Y were prepared.Photomicrographs of the alloys containing 0.2 and 0.8 atomic per cent Y afterannealing for 233 hours at 13500 C are shown in Figs. 15 and 16. The presenceof the yttrium phase is still clearly evident in the photomicrographs and indi-
cates that the solid-solubility limit of Y in Nb is less than 0.05 atomic percent.
9

Lattice parameter measurements and micrographic results on the alloyseries ranging from 0.2 to 1.0 atomic per cent Y are given in Table 3. Asmay be seen from Table 3, there is a progressive, if erratic, decrease inthe lattice parameter of the Nb matrix as the yttrium content is progres-sively increased. These results are combined with those of Table 2 andare illustrated in Fig. 17.
Table 3
Micrographic and X-ray Data on Nb-rich Nb-Y AlloysLattice
Atomic Per Cent Phases Parameter ofY Heat Treatment Present a Nb Phase,
0.2 Annealed 233 hours at 135000. a "7o + Y 3.3011Powder annealed 10 min. at 1200 C.
o.4 Annealed 233 hours at 135000. a a Nb + Y 3.3019Powder annealed 10 min. at 1200 C.
0.6 Annealed 233 hours at 13500. a Nb + Y 3.3014Powder annealed 10 min. at 12000C.
0.8 Annealed 233 hours at 135000. a Nb + Y 3.3007Powder annealed 10 min. at 12000C.
1.0 Annealed 233 hours at 135000. a Nb + Y 3.3010Powder annealed 10 min. at 1200C.
It would seem that if the reduction in lattice parameter is caused by ascavenging action, the value of 3.2993 R obtained for the alloy containing 25atomic per cent Y is truly representative of the parameter for oxygen-freeniobium. A somewhat similar scavenging effect probably occurs in the Nb pri-mary solid-solution range of the Nb-Hf system. According to our own (unpub-lished) results, there is an initial drop in the lgttice parameter of Nb withthe addition of Hf, a minimum parameter of 3.3000 X being reached at approxi-mately 1.25 atomic per cent Hf, after which the lattice parameter increasesin an almost linear manner with further Hf additions. The effect is shownin Fig. 18.
Based mainly on the micrographic evidence, it would seem that the solidsolubility limit of yttrium in niobium is less than 0.05 atomic per cent.
Vickers diamond pyramid hardness values obtained on as cast Nb-Y alloyswere as follows:
At.% Y 0.0 0.2 o.4 0.6 0.8 1.O
VDH 128 ll2 111 100 98 93
10
3. Y-Mo Alloys
Attempts to make Y-14o, Y-Ta and Y-W alloys in the Kroll furnace provedunsatisfactory, there being a strong tendency for the yttrium to form a pro-tective liquid coating around the unmelted refractory element and to vola-tilize under the arc, the loss in heat as latent heat of volatilization pre-venting the refractory element from melting. Based on these results, it wasdecided to use a diffusion couple technique employing liquid yttrium incontact with the solid refractory element and study the interface both micro-graphically and by means of the mass spectrometer.
As described in the section on Alloying and Heat Treatmient Procedures,a rod of zone refined molybdenum was placed in an encapsulating cylinder ofthe same metal and surrounded by pieces of yttrium. The capped cylinder washeated in the vertical tungsten tube furnace at 15850 C under a vacuum of lO1 -to l0 Torr and maintained at temperature for a period of two weeks. Thespecimen was then radiation cooled and sectioned vertically for micrographicexamination. Good wetting of the Mo rod was observed.
Fig. 19 is a photomicrograph of the interface showing the erosion of themolybdenum surface caused by the solution of molybdenum in the liquid yttriumto form a eutectic mixture on cooling in conformity with the phase diagramshown in Fig. 3. It can also be seen that small "islands" of molybdenum havefloated out into the liquid phase prior to solidification.
Three regions at distances of 500, 250 and 125 microns from the interfacewere sparked in the mass spectrograph, as shown by the circular areas in Fig.20. No yttrium was to be observed in the first sparking area. A trace (1-3ppm) was recorded on the first exposure taken 250 microns from the edge butdisappeared on further sparking, indicating a surface effect. The third samp-ling area, 125 microns from the edge, showed 1-5 ppm of yttrium on the firstexposure and 1 ppm on later exposures. It is believed that this is a surfaceeffect resulting from sectioning and polishing.
Fig. 21 shows the type of mass spectra obtained. The distance along theplate is proportional to (m/e)l/ 2 . The most intense lines are those of singlyionized molybdenum at masses 92, 94, 95, 96, 97, 98 and 10. This pattern is
repeated at one half, one third, etc. of the mass range. Yttrium has thesingle isotope at mass 89. Carbon, oxygen and hydrocarbons are also present,possibly due to residual traces of polishing and cleaning compounds.
Based on the mass spectrograph results it would seem that the solid-solubility of yttrium in molybdenum at 15856C is less than 1 part per million.
4. Y-Ta Alloys
A diffusion couple between a zone refined tantalum rod and liquid yttriumin a tan calum cylinder was heated in vacuum at 15850 C for a period of twoweeks. Photomicrographs of the interface showed very little erosion of thetantalun sample. The lower part of Fig. 22 shows part of the zone refined
11
tantalum rod in contact with metallic yttrium which is dark on account of theover-etching produced in bringing out the boundaries in the coarse grainedtantalum phase. As shown in Fig. 4, there is no eutectic in the system. Theupper portion of the photomicrograph shows part of the fine-grained tantalumencapsulating cylinder. In general, the erosion of the tant.:-n is very muchless at 15850C than was the case with molybdenum, presumably on account ofthe higher melting point of Ta.
Two series of mass spectra failed to disclose the presence of yttrium inthe tantalum rod. From this it may be concluded that the yttrium content wasless than 1 part per million.
5. Y-W Alloys
A diffusion couple between a zone refined tungsten rod and liquid yttriumin a tungsten encapsulating cylinder was heated in vacuum for a period of twoweeks at 15850C. A typical photomicrograph of the interface is shown in Fig.23. No visible attack has occurred on the tungsten at the interface, theupper part of the photomicrograph showing the over-etched yttrium phase whichis full of voids. No evidence was found for a Y-W eutectic in conformitywith the phase diagram shown in Fig. 5.
Mass spectro raphy at points ranging from the interface to a location750 microns away see Fig. 24) yielded a yttrium content of 150 ppm droppingto zero. It would seem that the initial high value is due to the sparkslightly overlapping the yttrium matrix when near to the interface, as may beseen from Fig. 24. It may be concluded that at 15850C the solid solubilityof Y in W is less than 1 ppm.
II. Alloys With Scandium
Although the melting points of yttrium and scandium are very similar(1539°C and 15470C respectively), their boiling points are very different,that of yttrium being 30270C and that of scandium being 24000C. As a result,it is extremely difficult to prepare scandium alloys with the refractory ele-ments owing to the volatility of scandium at the refractory element meltingpoints. Consequently, except for Sc-Cr and Sc-Nb alloys, diffusion coupletechniques had to be euployed with liquid scandium in contact with solidrefractory element. Early attempts to form diffusion couples in vacuum at16250C (only 780 above the MP of Sc)were unsuccessful owing to the tendencyof the scandium to volatilize and attack the parts of the furnace remote fromthe specimen. In particular, the tantalum leaf springs supporting the tung-sten tube heater-element were attacked and embrittled by intergranular cor-rosion and fell apart. As a result, atteapts were made to operate underhelium at a pressure of approximately 650 mm Hg, but with limited success.
A typical phenomenon is the deposition of fine, perfectly developed hexa-gonal crystals of scandium on the tungsten wire supporting the encapsulatingcylinders Just outside the hot zone as shown in Fig. 25, the atmosphere being
12
U
helium at a pressure of 650 mm Hg. Erosion of the support wire adjacent theencapsulating cylinders caused the wire to fail during the high temperaturerun after only one hour and it became necessary to support the cylinders ona tantalum pedestal capped with a thin thoria disc in order to preventadhesion.
1. Sc-Cr Alloys
After several unsuccessful attempts, an alloy was prepared using theKroll furnace. Allowing for weight losses due to volatilization of scandium,the composition of the alloy corresponded to approximately 96.5Cr 3.5Sc.X-ray diffraction patterns and photomicrographs showed only the two phasesCr and Sc along with traces of Sc 2 03 on the surface.
The photomicrograph of the alloy, shown in Fig. 26, is interesting inthat the scandium has formed cubical cavities in the chromium matrix whichlie parallel to the crystallographic axes of the chromium. The scandiumlocated in the grain boundaries shows some structure which might possibly beidentified with a eutectic, but this is uncertain. No phase diagram of thesystem is available.
The lattice parameter of the chromium constituent of the alloy was2.8848 + 0.0001 R, which is identical with that of the pure e'.ement. As aresult, it may be concluded that the amount of Sc in solution is less thanabout 0.1 atomic per cent.
2. Sc-Nb Alloys
Only one alloy having the composition 95Nb 5Sc was prepared in the Krollfurnace. The weight losses for this alloy were less than one per cent.Micrographic and X-ray diffraction analysis after annealing for ll3 hoursat 12000 C revealed two phases, aNb and Sc. Traces of inhomogeneous distribu-tion of the Sc phase are still evident in the photomicrograph shown in Fig.27.
Lattice parameter determinations of the Nb phase yielded 3.3004 R ascompared with 3.3024 for Union Carbide rondelles and Metals Resins Corpora-tion zone refined material. As in the case of Nb-Y alloys, this reductionin parameter is, in all probability, due to a reduction in the oxygen content.
3. Sc-Mo Alloys
As stated above, a diffusion couple of liquid scandium in contact with arod of zone refined molybdenum was heated for 1 week at 16250 C in helium ata pressure of 650 rmm Hg. Fig. 28 shows the molybdenum encapsulating cylinderon its sintered powder molybdenum pedestal photographed before and afterheat treatment. As may be seen, as a result of the heat treatment, both thecylinder and the pedestal have undergone considerable erosion and the cylinderhas become firmly welded to the pedestal and to its cap. A section throughthe diffusion couple and the encapsulating cylinder is shown in Fig. 29 and
13
illustrates the degree to which the zone refined rod has been eroded and aremarkable swelling of the container which fills the interspace in the formof a spongy mass, most of the scandium having evaporated away.
The erosive attack is considerably greater than in the case of the Y-Modiffusion couple shown in Fig. 19. It will also be noted that the molybdenumrod, which consists of a few single crystals, is very much less attacked thanthe finely crystalline encapsulating cylinder. It would seem from this thatattack occurs mainly as a diffusion process along the grain boundaries anddislocations in the metal which are more numerous in the machined finelypolycrystalline cylinder.
Fig. 30 shows four sparking areas in the vicinity of the Mo-Sc inter-face. Although there is considerable erosion, it is easily possible to dis-tinquish the sparking areas from the voids. The sparking craters in thiscase are about 10 microns deep. No scandium was detected in this series ofsamplings and it can therefore be stated that the amount in solid solutionis less than 1 ppm at 16250C.
No eutectic features were observed in the Sc-Mo diffusion couple. Thereis no phase diagram available for the system.
4. Sc-Ta Alloys
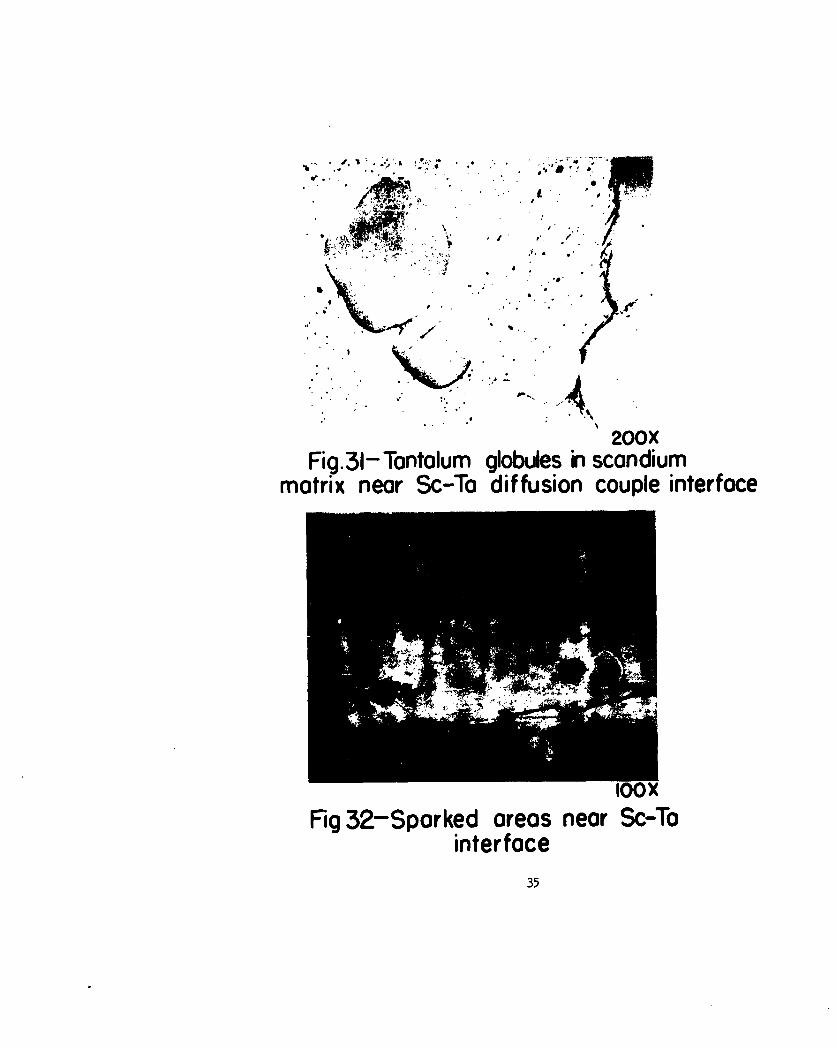
Considerably less erosion was obtained at 16250C in helium with the Sc-Ta diffusion couple than was obtained with Sc-Mo. Fig. 31 taken near theinterface shows globules of tantalum in a scandium matrix. Three sparkingareas used for mass spectrographic analysis are seen in Fig. 32 at distancesranging from 400 to 100 microns from the interface. No scandium was detectedand it can therefore be stated that the amount of Sc in solid solution at16250C is less than 1 ppm.
5. Sc-W Alloys
In the case of the Sc-W diffusion couple heated in helium for 1 week at16250C, no visible attack was observed on the tungsten encapsulating cylinderand pedestal. All the scandium evaporated out of the cylinder during thecourse of the heat treatmient, the loss being verified by weighing. Most ofthe scandium deposited on the cooler ends of the tungsten heater tube and onthe tantalum leaf spring supports, causing several of the leaves to embrittleand fail. A second run ended in the same way. Fig. 33 shows the cross-sectionof the zone-refined tungsten rod after the heat treatment. The recrystalli-zation on the surface is primarily due to the cold working of the specimenduring machining followed by the heat treatment. Mass spectrometry at theinterface showed no trace of scandium, the limit of detectibility in thiscase being 40 ppm. Thus, it would seem that under the experimental conditions,the amount of scandium in solid solution at 16250 C is below 40 ppm, and byanalogy with the other elements and the degree of attack it is probably lessthan 1 ppm.

0o
CONCLUSIONS
It would seem from the experimental results that the solid solubilityof yttrium and scandium in the refractory elements W, Ta, Mo, Nb and Cr isof negligible proportions, being in most cases less than 1 part per million.The results are in conformity with the Hume-Rothery rule that only a veryrestricted range of solid solution can be expected when the atomic diametersof solvent and solute differ by more than 14 to 15 per cent. Erosion bythe rare earth metal in the diffusion couples was in the inverse order ofthe melting points of the refractory elements, being greatest for molybdenumand least for tungsten.
REFERENCES
1) Hume-Rothery, W. and Rapao, G. V. "The Structure of Metals and Alloys."Inst. Metals Monogr. Vol. 1, London, 19 54 .
2) Taylor, A. and Ryden, H. B. J. Less Common Metals. Vol. 4. 1962. p. 4 51.
3) Taylor, A. Rev. Sci Instr. Vol. 27. 1956. P.757.
4) Taylor, A. and Sinclair, H. Proc. Phys. Soc. (London). Vol. 57. 1945.p.126.
5) Nelson, J. B. and Riley, D. P. Proc. Phys. Soc. (London). Vol. 57. 1945,p.160.
15
ATOM PERCENT CHROMIUM
20 t0 40 so so so too
moo0 -
1600-
8. Y 1020
149
~~12000
hi
I
So-
600
400
0 20 40 60 s0 300Y WEIGHT PERCENT CHROMIUM Cr
Fig. 1 Yttrium-Chromium Phase Diagram.(From "Rare Earth Alloys," K. A. Gschneidner,Jr. , D. Van Nostrand Company, Inc. 1961.)
16

ATOM PERCENT NIOBIUM0 20 40 60 s0 100
2600 , 1
/ L1+L2/
2400I '.Z24000 2415*
/45% >95
/
2200 ///
/
2000o 1* /hi /
hi /a.
hi 15020
1600.- v iI
1490 - J 1410*
6%1400
1200
1000o 20 40 60 so 100v WEIGHT PERCENT NIOBIUM Nb
fig. 2 Yttrium-Niobium Phase Diagram.(From "Rare Earth Alloys," K. A. Gschneidner,Jr. , D. Van Nostrand Company. Inc. , 1961.)
17

ATOM PERCENT MOLYBDENUM0 20 40 40 s0 100
2300 p ,
2600 2020 -
4-
2400 /
//I
2200/
/I/
2000 /,/
/
1800 I
w IB. I
I-.1600
t502* 149I
0.2% i% > s%1400
1200
9000
I100 I0 20 40 6Q0 00Y WEIGHT PERCENT MOLYBDENUM MoF'ig. 3 Yttrium-Molybdenum Phase Diagram.
(From "Rare Earth Alloys," K. A. Gschneidner,Jr. , D. Van Nostrand Company, Inc., 1961.)
18
ATOM PERCENT TANTALUM
10 20 40 60 sO '00
I SLi + Ls
I300 -3000
"600
II
I
1800
U I*I
2600-
hi I
0
1502
1400*I-Y +t."
I200 iIi I
0 2O 40 elO S0 I00
Y WEIGHT PERCENT TANTALUM Te
Fig. 4 Yttrium-Tantalum Phase Diagram.(From "Rare Earth Alloys," K. A. Gschneidner,Jr., D. Van Nostrand Company, Inc., 1961. )
19
ATOM PERCENT TUNGSTEN0 10 20 40 60 s0 100
3400 13380 Al
3200-/
32000
/
//
//
2800/
w 2600/
w
/I.
4 /
AL2 2400 /
2200 -
= II-I II
II20Z00- L+
I
1800 -
I
II ~
1600 /
/
-15020
G-y+W
1400 L0 20 40 00 so 100Y WEIGHT PERCENT TUNGSTEN W
Fig. 5 Yttrium- Tungsten Phase Diagram.(From "Rare Earth Alloys," K. A. Gschneidner,Jr. , D. Van Nostrand Company, Inc. , .1961.)
20
Viewing Port - - Shutter
Tantalumarf
Leaf _Water-_.ooeSpring s
W~ater
In
Viewing
Port 6 g l h eTungsten Tube
1Tantalum Baffles
Shutter : Water Bench Top
. Pipe
TODrain,
t W a te r . .
Fig. 6-Tungsten tube high temperature furnace
2.1
Single Crystal ofZone Refined Element
Counter Electrode
Melted Y or Sc
Commercially PureElement
Fig. 7-Pointed counter electrode as a mass spectrograph micro probe
22

Fig. 8- Layout of mass spectrograph (schematic)
23
* ~ ..- ~ ~Fig. 9
.5 . . .55.99.99 9 %Cr
Argon arc meltedAs cost
200X
Fig. 10-. 75 Cr 25Y
-. ,r Argon arc melted
* As cost
200X
- Fig.lII
* Annealed 68 hr. 1200C
00 It.4A
200X
24f
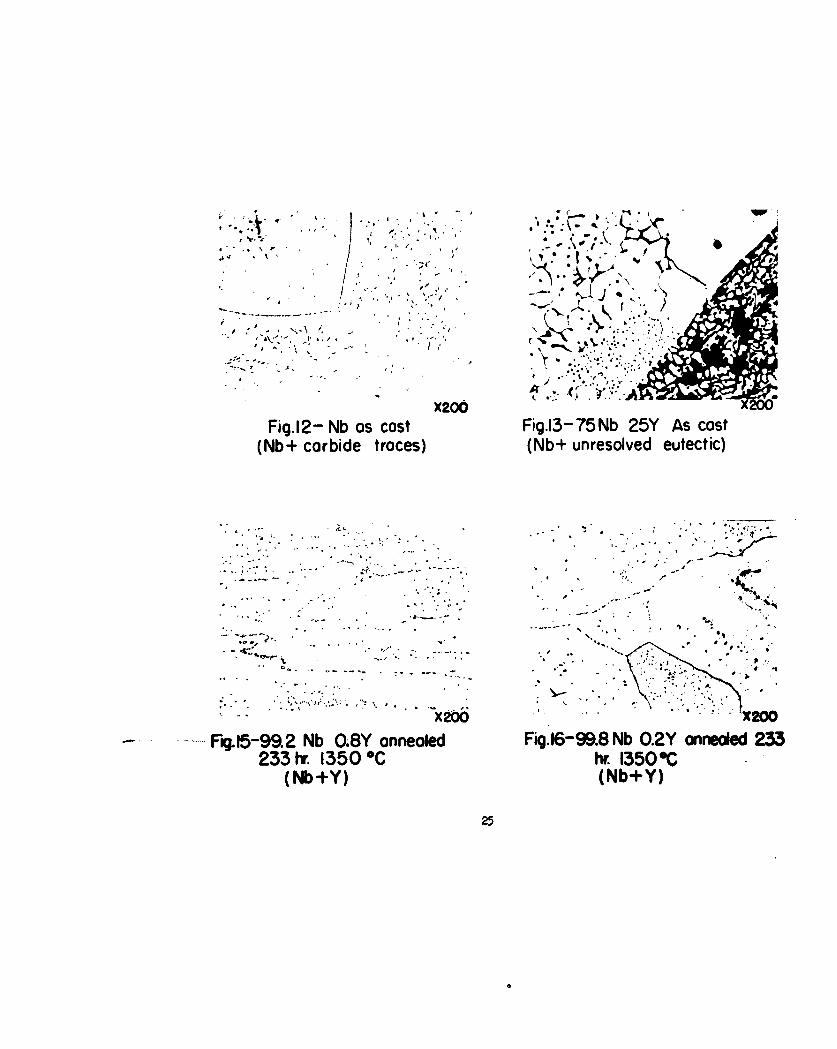
Fig 12 Nb ascs i.37 5 scs"7b crid traces) (N*- unrsove euet
/XO 2 ,. I
*i159 2 Nb 0.8 aneldFg169.N .Y n 323 -y 30O h 30*
(N*Y (NbK.. Y2
25 \
oo
NZEtsN +
.00
O0
Cki -0
C*4-
___ 0+
o M
LZ

3.303
3.302 0
04
E 023.301-& 0
3.300-
0.99 1 2 3 4 5 20 25 30Yttrium - Atomic Percent
Fig.17-Effect of Yttrium additions on the latticeparameter of niobium.
27
36400-
o< 3.380-
3,360-
3.340-
012030 40Hafnium - Atomic Percent
FigJ8- Lattice parameter curve of Nb-Hf alloys.
.28

Fig. 19Mo-Y diffusion coupleinterface. Mo+ eutectic
X 200
Fig. 20Sparked areas near Mo-Yinterface
Fig.21Mass spectra from regionsLI near Mo-Y interface
29
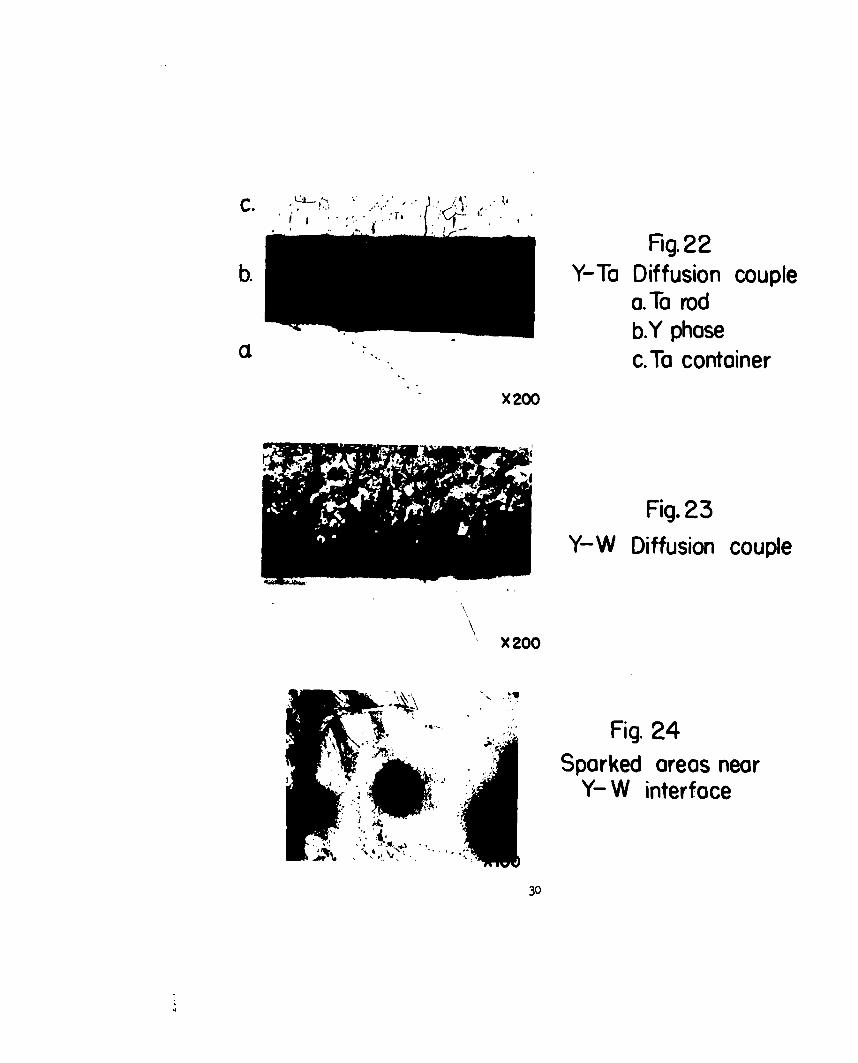
Fig.22b. Y-To Diffusion couple
a.To rodb.Y phase
a c.Ta container
X200
Fig. 23Y-W Diffusion couple
x 200
. Fig. 24A Sparked areas near
SY- W interface
30

Fig.22b. Y-To Diffusion couple
a.To rodb.Y phasec.Ta container
X200
Fig. 23Y-W Diffusion couple
X200
Fig. 24Sparked areas near
Y- W interface4.
30

5XFig.25- Scandium crystals on tungsten
support wire

* ww
S 6 Fig26
of* 96.5 Cr 3.5 Sc As cost
A 11 t o 4
113 hrs. at 120000COfi
32

CP )7S 0
4 00 OL
40
x
33

47
50XFig.30-Sporked areas near Mo-Sc
interface
34
,'i . ' ..... .
T | ,
200XFig.31-Tontolum globules in scandium
matrix near Sc-To diffusion couple interface
Fig 32-Sparked areas near Sc-Tointerface
35

200 XFig. 33- Region of tungsten rod
ot W-Sc interfoce
36

IJH+. EO- 1
4' 4'H 4 00 -4
0' 0'~ 4 ,' JW . .0
0 p , 4 4fl 4 4 I) H
H4 04 In -:t H H H
14 -3
0' 0 c0
1). 0. CO "I 1. ~
A,.
41 00 k 0.'0
00 0'0> 0 0 H O
0O bor HO 0 41.
k 0 0
4)~ 4 0 0- 00 M
U m 11 0 0 1 HOH 4,1,1,0
~~~0 0 U- OH 0 1
I') Pf ' ' 0 40
I, .- I4 ~ 00
00 0.! u 004~~-H En'
44 14 N~ J . " 0 H
HO w) 0U'U 0,,>111, 0 4
-S 0
.0 H
';8 0),v 0 4, I
4.1 'd1 0 1-14r0 0
1, L.( 4O.~ 4 E
~~4-H.0 0 0 00O
.s 0 0 0 04'
>.J 0 HO
4 0'
'A -' p)0
0 0 00
0 0 V-
HO V00a) 4) H 0 0
H0~ 0
0 a) -0'4'H 1) r
.) Ol 04-'0 4- M
0 Id
d) '0 '
"1 0 00'
0,9
M 2F, 0 44
0
4*1 44r
r2 H -HH H
W 0 -H 4I'
0~-H
v 00
-H In MC
-Ho 43+ 0 W H O4
0 'Ho '-I r4 0 C
oC 004 51 C H,'4q C rto-''
'2 2 43"1O0v
S 0 inC 6 - inr
41 0 ~ , 4 0 04 0,
Ho00 0 'C.)OC, CC30 *H CO U a)HC '4
iMC or., 0 0 CC
43 0 02 'oU-~
Mt 4 C CC
00 5 0
" ~ ~ ' io-~, I~- Hi H u .C3z) 4 0 C 0
o 0'-I0 0li *0 CH(VO4
0 0-U-z in
) H 4"CdO4
0 10 .H )COc 4 H9 a)l)i 41 10
Id 0 H H
) CH -. 4UH U-In4 P MC
414