unclasified unmhhhhhhhmm teaching robust methods f siegel for exploratory data ... · ·...
TRANSCRIPT

TEACHING ROBUST METHODS FOR EXPLORATORY DATA ANALYSIS.(U)OCT 80 A F SIEGEL DAA29-79-C-0205
UNCLASIFIED TR173 ER 2 ARO 16669 3-N NLUNmhhhhhhhmmliii..Emmon D ,T .B

111" I2 112.liii0 Ol O
11U. L o.___ 11112 .0
MICROCOPY RESOLUTION TEST CHART
NATIONAL BUREAU Of STANDARDS 193 A

UNCLASS I FIEDSECUR4ITY CLASS'IFIAliON Or ?H t AFf~n e.~i
- READ INSTRIUCTICNSREPORT DOCUMENTATION PA*c- BEFORE OPFrGORL -REPORT NUMBER 2. GOVT ACCESSION NO. 3. RECIPIENT'S C-ATA..OG NUMBIER
14. TITLE (and Su&iol) S. TYPE OF REPORT & PERIOD COV/ERED
Technical"Teach ing Robust Methods for Exploratory DataAnalysis. PERFORMING ORG. REPORT NUMBER
AUTHO(@)S. CONTRACT OR GRANT NUMSERs)
,a Andrew F.JSiegel DA2-9C-00
SZI . PERFORMING ORGANI1ZATION NAME AND ADDRESS 10. PROGRAM ELEMENT. PROjECT. TASKAREA & WORK UNIT NUMBERS
Princeton UniversityPrinceton, iJ 08540
III. CONTROLLING OFFICE NAME AND ADDRESS 12. REPORT DATE
U. S. Army Research Of'fice Oct 8oPost Offi-:e Box 12211 13i. NUMBER OFPAGESResearch Triangl1e Park, NC 27709 is______________
14. MONI0TORING AGENCY NAME 4 A0ORESS(JI different loom Coetrolllnd Office) Is. SECU RI TY CL ASS. fol this report)
UnclassifiedISe. OECL ASSI FCATION/ DOWN GRADING
SCMEDULE
IC. DISTRIBUTION STATEMCENT (*I this Report)I
Approved for public release; distribution unlimited. l
17. DISTRIBUTION STATEMENT (of the abstract enterodin Bleck 20. I dlif.,mt from, Report) 7
NA
to. SUPPLEMENTARY NOTES
The view, opinions, and/or findings contained in this report are those of theauthor(s) and should not be construed as an official Department of the Armyposition, policy, or decision, unless so designated by other documentation.
Is. KC W9RDS (Contiue an ro~ora* side it necesary and tdsmtlty ey Discs flm.O)
statlysst I CSestimat ionteachingdata analysis
q*. AV~rRAcr (=erinse -orm afto if vneowsa m iderify by block nmb~er)5 -1 his paper IS an introduction to some of the ideas of robust statistical methods06. as was presented to the Fourth International Congress for Mathematical Education,C= session on Exploratory Data Analysis. Hlost statistical methods taught and usedC-) today are very sensitive to bad or atypical data and can cive meaningless results
in their presence. -iobust methods protect acainst these undesirable effects and.LI can be incorporated into the teachina of statistics at all levels of complexity.
W__e discuss the need for robust methods to Su~pplement (not replace) standard proce-' dures, suggest some considerations regarding teaching, and review sore of the fun-
Do cet o43 EIWFMVISBSLT aet~r~ f robust estirlaticn.
/ - 7 CL ASSFIC~
*~v OFIIPA E
TEACHING ROBUST METHODS FOR
EXPLORATORY DATA ANALYSIS R21s GT jjSe, T.. AB
by
Andrew F. SiegelPrinceton University -
andBell Laboratories
IA I I
Technical Report No. 173, Series 2Department of Statistics
Princeton University
October 1980
Supported in part by U.S. Army Research Office ContractDAAG29-79-C-0205, awarded to the Statistics Department, PrincetonUniversity.
It

TEACHING ROBUST METHODS FOR
EXPLORATORY DATA ANALYSIS
by
Andrew F. SiegelPrinceton University
ABSTRACT
This paper is an introduction to some of the ideas of robust
statistical methods as was presented to the Fourth International
Congress for Mathematical Education, session on Exploratory Data
Analysis.
Most statistical methods taught and used today are very
sensitive to bad or atypical data and can give meaningless
results in their presence. Robust methods protect against these
undesirable effects and can be incorporated into the teaching of
statistics at all levels of complexity. We discuss the need for
robust methods to supplement (not replace) standard procedures,
suggest some considerations regarding teaching, and review some
of the fundamental concepts of robust estimation.

l ip
Robust Methods for EDA
Robust methods, which protect against undesirable effects
of unusual observations in the analysis of data, can easily
be incorporated into the teaching of statistics at all levels.
Because many of the basic concepts are simple, robustness
can and should be discussed when the student is being introduced
to statistical ideas.
Robustness should complement, not replace, standard
statistical tools such as means, variances, least squares
estimates, and other methods based on assumptions such as
the normal distribution. In fact, many statisticians now
recommend that a robust analysis be used routinely to help
assess the validity of a more .classical analysis, kecause
hidden structure or problems with the data are often brought
to light. If the classical and robust analyses approximately
agree, this can be taken as a confirmation of the classical
results by a secondary analysis. But when they disagree, there
is work to be done because either errors in the data need to
be corrected, or else unexpected structure remains to be dis-
covered and explained.
The need for statistical robustness can be seen even in the
basic problem of finding an "average" value to summarize a
list of numbers. For example, to summarize the five numbers
7, 8, 6, 4, 100
the arithmetic mean is7+8+6+4+100
mean - 5 25
which is not a typical value! For some real-life problems,
25 would be the proper summary; but it is often better to
*.y' e4A'

summarize the reasonable portion of the data (7,8,6, and 4) and to
study exceptional values (like 100) separately, for example,
to decide if they are interesting special cases for further
study or simply in error.
The median is a robust measure of average which has half
of the numbers smaller and half larger than itself. For this
data set, it is
Median - Middle value of (4.6,7,8,100) 7 ,
which we see is a typical value.
0? 50 100MEAN
MEDIAN
Robustness, formally, is protection against unusual data
and violated assumptions. A few atypical or "bad" observations
can ruin an ordinary analysis, but will have only a very limited
effect on a robust analysis. Using robust methods is
analogous to taking out an insurance policy for protection
against the presence of bad data: the insurance premium is paid
as an increase in sampling variation or efficiency of the estimate.
In real data, errors are often present, and this "insurance" can
be vital. Robust methods also help in the detection of outliers
(atypical data), which can be very useful in error detection.
The teaching of robustness can proceed at many levels:
simple or complex, pencil or computer, in-class or independent
project. It can be taught separately as a section by itself,
but is also easily integrated with other statistical topics.
' *1

-3-
For example, after teaching a new standard procedure, some time
can be spent discussing methods of "robustifying" that method.
The use of examples is crucial, of course, to teaching any
statistical ideas and maintaining student interest; pictures
and graphic displays should be used frequently.
To illustrate some robust methods for location (average)
estimation, consider the attention spans of 10 hypothetical
students:
5,18,15,2,8,55,11,3,9,8 minutes
The arithmetic mean (not robust) is
5+18+...+8mean = 10 = 13.4 minutes
The 10% trimmed mean (robust) is formed by
(1) ordering the data from smallest to largest, (2) trimming
(removing) 10% of the data from each side, and (3) taking the
arithmetic mean of what remains.
1) order: 2,3,5,8,8,9,11,15,18,55
2) trim 2 and 55
3) 10% timed near a 3+5+8+18 a 9.6 minutes
The median (very robust against atypical values) is
8+9median * 2 - 8.5 minutes.
These estimators (mean, trimmed mean, median) are all examples
of a rich family of location estimators called L-estimates,
which are linear combinations of order statistics.
Another useful class that also includes robust members is

-4-
the M-estimates which generalize least squares and maximum
likelihood procedures. These include the arithmetic mean,
which minimizes the sum of squared deviations
nE (x1- 0)2 .
i-1
In place of squaring, M-estimates allow a function p that
can be less sensitive to outliers. We minimize
n! p(x1-8)
by differentiating and solving
n*(x -e) - 0
11
where * - (constant) . (dp/de). Different choices of p lead
to different M-estimates with different properties. Some
examples are given in Figure 1.
The median, an M-estimate with p(x) - lxi , is extremely
resistant to bad data but suffers from "granularity", a lack
of responsiveness to data near the central value. The Huber
choice for p corrects this problem: near zero, it is like the
mean, allowing data near the average to "fine-tune" the estimate,
while maintaining resistance to bad data by behaving like the
median away from the middle. Tukey's Sisquare also combines
efficiency and robustness, but has a ip that is "redescends" to
zero; in effect, this says that data that are very far from the
middle will not be believed, and will have zero effect on the
estimate.
For easy pencil-and-paper calculation, L-estimates are
preferable, because the minimization step-for M-estimates (other

-5-
FIGURE 1. mpe of -siae
lp(u) = uMean41
u<O
p P(u) {klulk/ u~
'i(u) Fk1 u <k
u2/2i I uj~k
Tk A ku
-k k u -k h
p P(u)
tuI~u

than the mean and median) is best attempted with a pocket
calculator or computer.
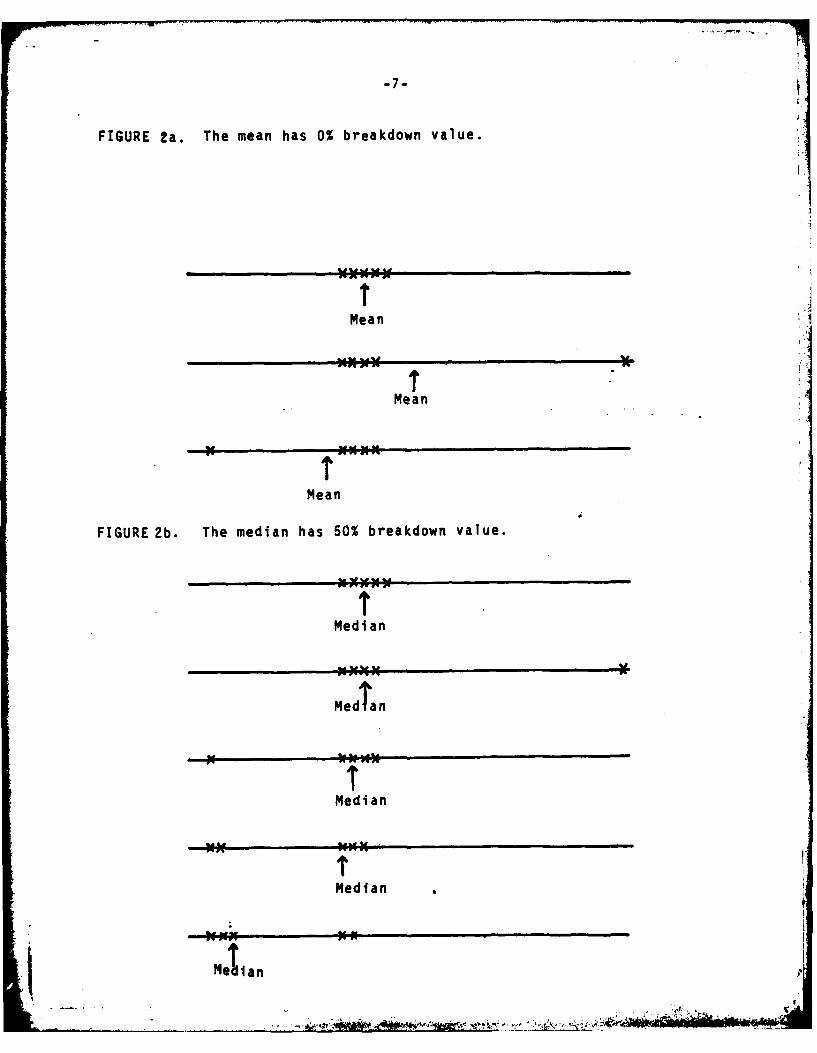
The proportion of bad data that an estimation procedure
can tolerate and still return a sensible answer is its Break-
down Value. The mean has a breakdown value of zero, because
by changing the value of even a single number, the mean can
be forced to assume any value as in Figure 2a. The median
has a breakdown value of 50% because almost half of the data
must be changed before the median breaks down completely,
as illustrated in Figure 2b. Note that extreme observations do
have an effect upon the median (compare the second and third
parts of Figure 2b). Also note that when 3 of 5 points (more
than 50%) are moved, the median breaks down as shown in
Figure 2b. Breakdown Values of trimmed means lie in between
those of the mean and median;for example, the 10% trimmed
mean has a Breakdown Value of 10%.
ni
-7-
FIGURE 2a. The mean has 0% breakdown value.
1'AMean
Mean
lTMean
FIGURE 2b. The median has 50% breakdown value.
Media
Median
Median
Median
MMedian
emt A 4b, O-w
-8-
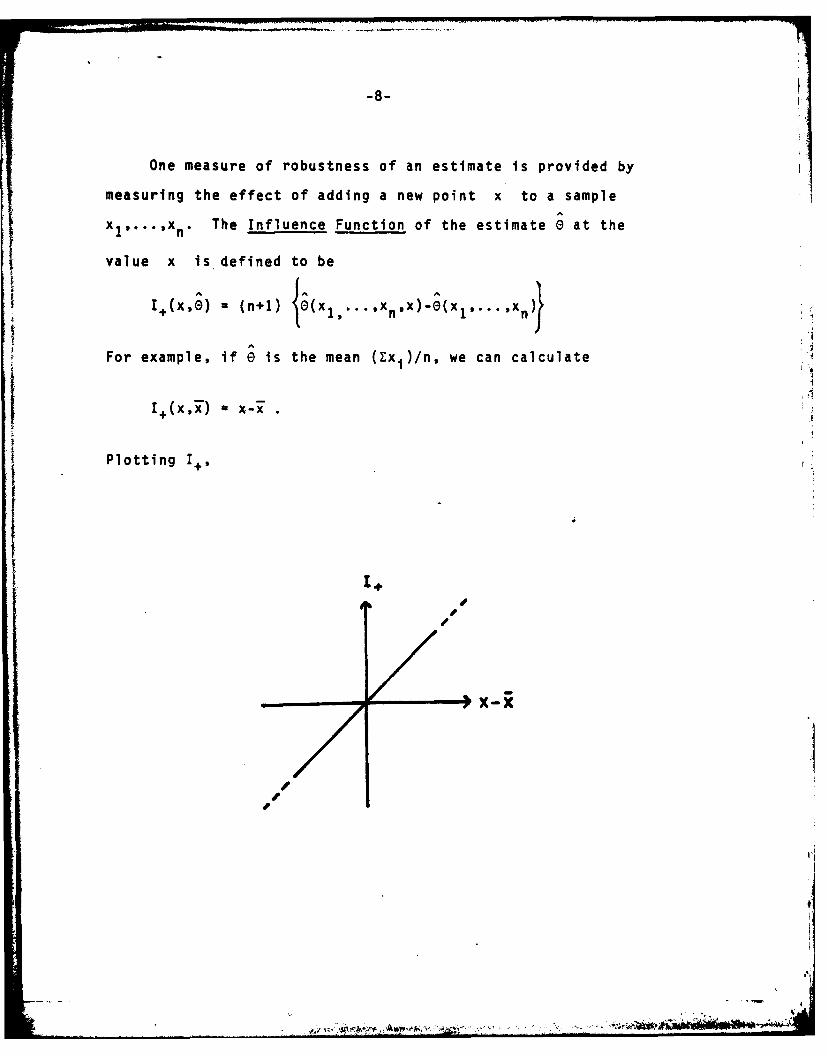
One measure of robustness of an estimate is provided by
measuring the effect of adding a new point x to a sample
x1*9...sX n* The Influence Function of the estimate 0 at the
value x is defined to be
For example, if 0 is the mean (Ex )/n, we can calculate
II+(x,iZ) x-ix
Plotting I+,
'I-
-9-
we see that the mean has an unbounded Influence Function, and
is therefore not robust because there is no limit to the effect
a single new point can have on the mean. For M-estimates, I+ is
very much like j.
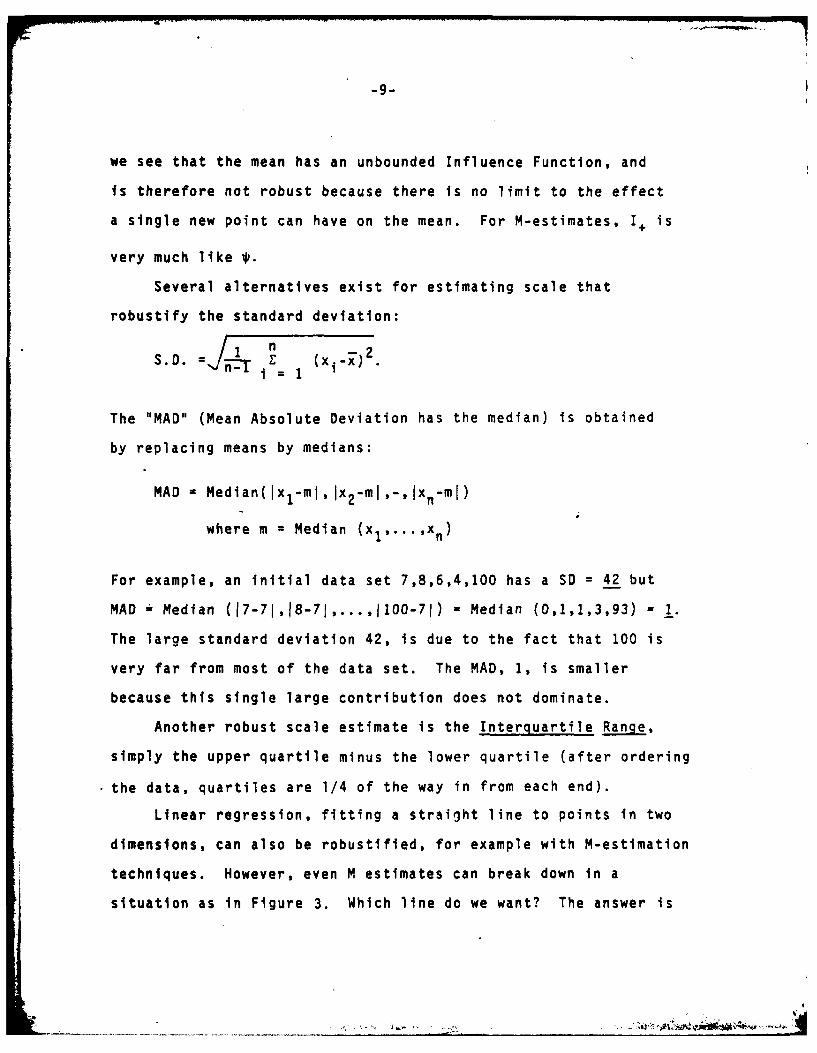
Several alternatives exist for estimating scale that
robustify the standard deviation:
- 1 n -2S.D. - I E (xi-x)
The "MAD" (Mean Absolute Deviation has the median) is obtained
by replacing means by medians:
MAD = Median(Ix z-mlIx2-mI ,-,Ixn-mI)
where m = Median (x1 ,...,x n )
For example, an initial data set 7,8,6,4,100 has a SD = 42 but
MAD= Median (17-71,18-71,...,1100-71) = Median (0,1,1,3,93) = 1-
The large standard deviation 42, is due to the fact that 100 is
very far from most of the data set. The MAD, 1, is smaller
because this single large contribution does not dominate.
Another robust scale estimate Is the Interquartile Range,
simply the upper quartile minus the lower quartile (after ordering
the data, quartiles are 1/4 of the way in from each end).
Linear regression, fitting a straight line to points in two
dimensions, can also be robustified, for example with M-estimation
techniques. However, even M estimates can break down in a
situation as in Figure 3. Which line do we want? The answer is
.. ....

( -10-
i0
L E -
FIGURE 3. Leverage in Regression

-11-
"both lines". If the high-leverage point is in error, we prefer
a robust line, such as the repeated median line (Launer and
Siegel 1981). But the least squares line is preferable when that
outlying point is correct, because in this case that single point
provides nearly all our information about the slope!
A final example of the usefulness of robust methods is the
fitting of two related shapes. Consider a square with one point
distorted (dotted shape) fitted to a perfect square (solid
shape) by allowing rotation, translation, and magnification.
Figure 4 indicates the least squares fit, and the robust fit by
Repeated Medians. Because the robust method "fits what fits"
it indicates clearly that the dotted shape is identical to a
square except at one point. The least squares fit, by compro-
mising and trying to fit too much, makes this sort of inference
much more difficult. Practical application of this type of shape-
fitting has been demonstrated by-Siegel and Benson (1980) in the
comparison of fossil shapes and of human skulls.
L j ....

i +
% S.%E
I EU.Iu
4.4 -c &.
vs
'1 011" A

-13-
Robust methods are also available for correlation, time
series, and two-way analysis in addition to the location,
scale, and regression problems discussed here. For more in-
formation, we refer you to the reference list that follows.
Remember that robustness is a young field (although its roots
are deep in the past) and we can expect more books to become
available in the near future.

-14-
ACKNOWLEDGEMENTS
I am grateful to R. Gnanadeslkan, P. Tukey and J. Kettenring
for helpful conversations during the preparation of this report.
-Ag r S-.

-15-
REFERENCES
GENERAL
HOAGLIN, D.C., and WELSCH, R.E. (1978). The Hat Matrix in Regres-sion and ANOVA. The American Statistician 32, 17-22.
HOGG. R.V. (1979). Statistical Robustness: One View of Its Usein Applications Today. The American Statistician 33. 108-115.
MALLOWS, C.L. (1979). Robust Methods - Some Examples of TheirUse. The American Statistician 33, 179-184.
MC NEIL, D. (1976). Interactive Data Analysis. Wiley, New York.
TUKEY, J.W. (1977). Exploratory Data Analysis, Addison-Wesley,Reading, Massachusetts.
TUKEY, J.W., and MOSTELLER, F. (1977). Data Analysis and Regres- lsion, Addison-Wesley, Reading, Massachusetts. (See ChapterT "'or robustness.)
VELLEMAN, P.F., and HOAGLIN, D.C. (1980). Applicatiohs. Basics,and Computing of Exploratory Data Analysis. Duxbury Press,North Scituate, Massachusetts, forthcoming.
MORE TECHNICAL
ANDREWS, D.F. et al. (1972). Robust Estimates of Location.Princeton University Press.
HUBER, P.J. (1977). Robust Statistical Procedures. S.I.A.M.v. 56, Philadelphia.
LAUNER, R.L., and WILKINSON, G.N. ed (1979). Robustness inStatistics. Academic Press, New York.
LAUNER, R.L., and SIEGEL, A.F. ed (1981). Advances in DataAnalysis. Academic Press, New York, forthcoming.
SIEGEL, A.F., and BENSON, R.H. (1980). Estimating Change inAnimal Morphology. Submitted to Biometrics.
**L -iA