uncertainty in the relationship between climate forcingand...
TRANSCRIPT

Hydrol. Earth Syst. Sci., 15, 897–912, 2011www.hydrol-earth-syst-sci.net/15/897/2011/doi:10.5194/hess-15-897-2011© Author(s) 2011. CC Attribution 3.0 License.
Hydrology andEarth System
Sciences
Uncertainty in the relationship between climate forcingand hydrological response in UK catchments
N. W. Arnell
Walker Institute for Climate System Research, University of Reading, Agriculture Building, Earley Gate,Reading, RG6 6AR, UK
Received: 11 August 2010 – Published in Hydrol. Earth Syst. Sci. Discuss.: 4 October 2010Revised: 10 February 2011 – Accepted: 21 February 2011 – Published: 15 March 2011
Abstract. This paper assesses the relationship betweenamount of climate forcing – as indexed by global mean tem-perature change – and hydrological response in a sample ofUK catchments. It constructs climate scenarios represent-ing different changes in global mean temperature from anensemble of 21 climate models assessed in the IPCC AR4.The results show a considerable range in impact between the21 climate models, with – for example – change in summerrunoff at a 2◦C increase in global mean temperature varyingbetween−40% and +20%. There is evidence of clusteringin the results, particularly in projected changes in summerrunoff and indicators of low flows, implying that the ensem-ble mean is not an appropriate generalised indicator of im-pact, and that the standard deviation of responses does notadequately characterise uncertainty. The uncertainty in hy-drological impact is therefore best characterised by consid-ering the shape of the distribution of responses across mul-tiple climate scenarios. For some climate model patterns,and some catchments, there is also evidence that linear cli-mate change forcings produce non-linear hydrological im-pacts. For most variables and catchments, the effects of cli-mate change are apparent above the effects of natural multi-decadal variability with an increase in global mean temper-ature above 1◦C, but there are differences between catch-ments. Based on the scenarios represented in the ensem-ble, the effect of climate change in northern upland catch-ments will be seen soonest in indicators of high flows, butin southern catchments effects will be apparent soonest inmeasures of summer and low flows. The uncertainty in re-sponse between different climate model patterns is consider-ably greater than the range due to uncertainty in hydrologicalmodel parameterisation.
Correspondence to:N. W. Arnell([email protected])
1 Introduction
The literature now contains hundreds of examples of thepotential impact of future climate change on hydrologicalregimes, in an increasingly wide variety of environments(Kundzewicz et al., 2007; Bates et al., 2008). The vast ma-jority of these studies apply climate scenarios to an observedbaseline climatology, and simulate hydrological regimes un-der baseline and future climates using a catchment hydrolog-ical model. Most climate scenarios are defined for a specificemissions pathway and time horizon (typically the 2050s);most also construct scenarios from only a small number ofclimate models. This makes it difficult to compare resultsfrom different studies or to infer impacts under differentemissions pathways. It also makes it difficult to assess therelationship between rate of climate forcing and rate of hy-drological response, and identify potential critical thresholdsor non-linear responses to change.
The aim of this paper is to examine the relationship be-tween climate forcing – as indexed by change in global aver-age temperature – and hydrological response, using six casestudy catchments representing different hydrological charac-teristics in the UK, and multiple climate scenarios derivedfrom the climate models evaluated in the IPCC’s Fourth As-sessment Report (IPCC, 2007). These scenarios are scaledto represent prescribed changes in global average tempera-ture ranging from 0.5◦C (above 1961–1990) to 6◦C. Thechanges in indicators of hydrological regime, and the vari-ation between the 21 climate models, are compared with theeffects of “natural” multi-decadal climatic variability withno climate change, and with the effects of uncertainty inhydrological model parameterisation. The paper comple-ments papers by Kingston and Taylor (2010), Kingston etal. (2010), Hughes et al. (2010), Nobrega et al. (2011), Singhet al. (2010), Thorne (2010) and Xu et al. (2011) which allfollow the same methodology (Todd et al., 2010) in differentcatchments.
Published by Copernicus Publications on behalf of the European Geosciences Union.

898 N. W. Arnell: Relationship between climate forcing and hydrological response in UK catchments
Table 1. Catchment characteristics.
NRFA Gauging station 1961–1990 average annual (mm)code
Area (km2) Rainfall Potential RunoffEvaporation
25006* Greta at Rutherford Bridge 86.1 1123 505 81932003 Harper’s Brook at Old Mill Bridge 74.3 619 561 17939019 Lambourn at Shaw 234.1 730 565 23040007 Medway at Chafford Weir 255.1 848 543 39954008 Teme at Tembury 1134.4 836 549 39175006* Eden at Temple Sowerby 616.4 1156 466 736
The catchments marked with * are affected by snowfall and snowmelt.
NRFA: National River Flow Archive
Average annual rainfall is calculated from catchment average daily rainfall, and potential evaporation is taken from MORECS (Thompson et al., 1981). Average annual runoff is
calculated from observed river flows on the NRFA. Note that the record for the Eden starts in 1964.
2 Methodology
2.1 Introduction
The basic methodology applies climate scenarios represent-ing prescribed changes in global average temperature to ob-served baseline climate data in six case study catchments inthe UK, and simulates river flows using a catchment hydro-logical model. This section first introduces the case studycatchments, then describes the hydrological model and itsperformance in the study catchments, before describing howthe climate scenarios are defined and applied.
2.2 Case study catchments
The case study catchments are the same as used in earlier im-pact assessments (Arnell and Reynard, 1996; Arnell, 2003a;2004), and represent a range of hydrological conditions inthe UK. Figure 1 shows the locations of the catchments, to-gether with baseline (1961–1990) mean monthly runoff. Ta-ble 1 summarises catchment characteristics and the baselineannual water balance. The Greta and Eden catchments bothdrain relatively impervious upland catchments, and somewinter precipitation in each currently falls as snow; snowstorage and snowmelt peaks, however, are not a major fea-ture of the hydrological regime in either catchment. TheHarper’s Brook and Teme catchments both lie in the Englishmidlands, and drain lowland catchments with relatively lim-ited relief. Both have mixed land covers and geological char-acteristics, but the Harper’s Brook is drier and warmer thanthe Teme. The Lambourn and Medway catchments are bothin southern England. The Medway is largely underlain byrelatively impermeable clays but some small portions of thecatchment are underlain by chalk, which is highly perme-able. In contrast, the Lambourn catchment is almost entirelyunderlain by chalk. In this catchment, virtually all of theriver flows derive from groundwater storage replenished by
recharge during winter. All of the catchments are largely ru-ral, with mixed agricultural land covers.
2.3 The hydrological model
The model used in this study (Cat-PDM, as used in Arnelland Reynard, 1996; Arnell, 2003a; 2004) is a daily concep-tual water balance model with lumped inputs assumed con-stant across the catchment, and with a soil moisture stor-age capacity that varies statistically across the catchment.The model derives from Moore’s (1985, 2007) probability-distributed model (PDM), and a macro-scale version hasbeen used across the global domain (Arnell, 2003b; Goslingand Arnell, 2010).
The model is run in each catchment with 30 years of dailyprecipitation, potential evaporation and, for the upland catch-ments, temperature, spanning the period 1961–1990. Catch-ment average daily rainfall was extracted from the Insti-tute of Hydrology (now Centre for Ecology and Hydrology)rainfall archives. Daily potential evaporation was derivedfrom the monthly potential evaporation produced by the op-erational MORECS system (Thompson et al., 1981). TheMORECS procedure calculates potential evaporation usingthe Penman-Monteith formula, assuming a grass cover. Forthe upland catchments, daily temperature series were con-structed by adjusting daily temperature data from nearbyrecording stations to the difference in altitude. River flowdata for each catchment for calibration and validation weretaken from the National River Flow Archive.
Three model parameters essentially partition rainfall intoevaporation and streamflow, and two parameters routestreamflow out of fast and slow stores to the catchment out-let. For the catchments in which snow occurs, precipitationis assumed to fall as snow when temperature is below 0◦C,and snow melts once temperatures rise above 0◦C in a two-stage process. The five model parameters were estimated by
Hydrol. Earth Syst. Sci., 15, 897–912, 2011 www.hydrol-earth-syst-sci.net/15/897/2011/

N. W. Arnell: Relationship between climate forcing and hydrological response in UK catchments 899
Fig. 1. Catchment locations and monthly hydrological regimes. Catchment map© NERC (CEH). Contains Ordnance Survey data© Crowncopyright and database right 2011. River network from Moore et al. (1994), catchment boundaries from Morris and Flavin (1994), and riverflow data from the National River Flow Archive.
manual calibration over the period 1980–1983, and validatedusing data from 1983–1989 (Arnell and Reynard, 1996). Ta-ble 2 shows model bias and Nash-Sutcliffe efficiency (Nashand Sutcliffe, 1970) over the calibration and validation peri-ods. Observed and simulated flow duration curves are shownin Fig. 2, where it is clear that the model reproduces well the
basic characteristics of river flow regimes in each catchment.It is assumed that model parameters do not change as climatechanges.
This paper concentrates on average annual monthly andseasonal runoff, and on flows exceeded 5% (“high flows”)and 95% (“low flows”) of the time.
www.hydrol-earth-syst-sci.net/15/897/2011/ Hydrol. Earth Syst. Sci., 15, 897–912, 2011

900 N. W. Arnell: Relationship between climate forcing and hydrological response in UK catchments
Fig. 2. Observed and simulated flow duration curves for each catchment, over the calibration period (1980–1983).
Table 2.Model performance.
Calibration(1980–1983) Validation (1983–1989)Bias (%) Nash-Sutcliffe Bias (%) Nash-Sutcliffe
Greta −2.4 0.596 −3.4 0.543Harper’s Brook −1.9 0.66 −6.8 0.581Lambourn −3.2 0.815 −1.5 0.752Medway 0.1 0.712 −10.1 0.747Teme −12.1 0.548 −2.4 0.626Eden 11.4 0.444 10.5 0.451
Nash-Sutcliffe index calculated from daily data.
The effect of uncertainty in model parameterisation onthe estimated impacts of climate change was determined bydefining sets of random variations around the calibrated pa-rameter set. Each parameter was allowed to vary by up toplus or minus 10%, and each perturbed parameter set sam-pled across all five parameter spaces independently. Biasand Nash-Sutcliffe indices were calculated for the calibra-tion period for each set of perturbed parameters. For eachcatchment, 100 parameter sets were identified which pro-duced “good” fits (bias in the calibration period greater than5%, or for the Teme and Eden less than 5 percentage pointsworse than the “best” fit).
Hydrol. Earth Syst. Sci., 15, 897–912, 2011 www.hydrol-earth-syst-sci.net/15/897/2011/

N. W. Arnell: Relationship between climate forcing and hydrological response in UK catchments 901
Table 3. CMIP3 models used to define climate projections (see Meehl et al., 2007 for full references).
IPCC I. D. Centre and locationUKMO-HadCM3 Hadley Centre for Climate Prediction and Research (UK)UKMO-HadGEM1 Hadley Centre for Climate Prediction and Research (UK)ECHAM5/MPI-OM Max Planck Institute for Meteorology (Germany)CSIRO-Mk3.0 CSIRO Atmospheric Research (Australia)CGCM3.1 (T47) Canadian Centre for Climate Modelling and Analysis (Canada)IPSL-CM4 Institut Pierre Simon Laplace (France)CCSM3 National Center for Atmospheric Research (USA)
BCCR-BCM2.0 Bjerknes Centre for Climate Research (Norway)CGCM3.1 (T63) Canadian Centre for Climate Modelling and Analysis (Canada)CSIRO-Mk3.5 CSIRO Atmospheric Research (Australia)CNRM-CM3 Meteo-France, Centre National de Recherches Meteorologiques (France)GFDL-CM2.0 Geophysical Fluid Dynamics Laboratory (USA)GFDL-CM2.1 Geophysical Fluid Dynamics Laboratory (USA)GISS-AOM NASA/Goddard Institute for Space Studies (USA)GISS-EH NASA/Goddard Institute for Space Studies (USA)GISS-ER NASA/Goddard Institute for Space Studies (USA)INM-CM3.0 Institute for Numerical Mathematics (Russia)MIROC3.2 (medres) Centre for Climate System Research, National Institute for Environmental Studies, Frontier Research Center
for Global Change (Japan)
MIROC3.2 (hires) Centre for Climate System Research, National Institute for Environmental Studies, Frontier Research Centerfor Global Change (Japan)
MRI-CGCM2.3.2 Meteorological Research Institute (Japan)PCM National Center for Atmospheric Research (USA)
The seven priority climate model patterns are listed first in the table.
2.4 Climate scenarios
The climate scenarios used in this analysis were constructedfor the QUEST-GSI project, representing changes across theglobal domain in key climate variables at a spatial resolu-tion of 0.5× 0.5◦. The scenarios were derived by applyinga pattern-scaling approach with a large number of climatemodel simulations, and rescaling to defined values of changein global mean temperature.
Climate patterns were derived from 21 of the climatemodels used in the Coupled Climate Model Intercompari-son Project phase 3 (CMIP3: Table 3) and subsquently re-viewed in the IPCC’s Fourth Assessment Report (Meehl etal., 2007; IPCC, 2007). Note that the 21 climate models donot represent a set of independent models. A priority set ofseven climate models (indicated in Table 3) representing thediversity of changes across the global domain was selectedfor more detailed analysis, and used consistently in the com-panion studies (Kingston and Taylor, 2010; Kingston et al.,2010; Hughes et al., 2010; Nobrega et al., 2011; Singh et al.,2010; Thorne, 2010; and Xu et al., 2011).
The pattern-scaling approach used to produce climate sce-narios across the global domain in the QUEST-GSI projectis described in Osborn (2009), and summarised in Todd etal. (2010). For each climate variable, month, model grid celland climate model, change per degree of global mean annual
temperature change was determined from regression rela-tionships between that variable and global mean annual tem-perature. Climate patterns were spatially downscaled fromthe original climate model resolution to 0.5× 0.5◦ acrossthe global domain by simple interpolation. Climate pat-terns were defined for change in mean monthly precipitation,mean monthly temperature, mean monthly vapour pressureand mean monthly cloud cover (from which change in meanmonthly net radiation was determined). The patterns also in-clude change in the parameters of the gamma distribution ofmonthly rainfall, from which it is possible to derive changein the year to year distribution of monthly rainfall (as char-acterised by the coefficient of variation of monthly rainfall).The scenarios do not include change in windspeed, so it wasassumed here that baseline windspeed remained unchanged.It is also assumed in this analysis that the number of days onwhich rain falls does not change.
Pattern-scaling assumes that each climate variable re-sponds linearly to changing global mean annual temperature.Whilst this has been shown to be a reasonable assumptionfor moderate amounts of climate change (Mitchell, 2003), itmay not hold for high changes, and is unlikely to hold wherethe rate of temperature change slows or even reverses.
www.hydrol-earth-syst-sci.net/15/897/2011/ Hydrol. Earth Syst. Sci., 15, 897–912, 2011

902 N. W. Arnell: Relationship between climate forcing and hydrological response in UK catchments
The analysis presented in this paper uses scenarios repre-senting a series of prescribed changes in global mean temper-ature, ranging from 0.5 to 6◦C above the 1961–1990 mean,constructed by scaling the patterns to that temperature. Thescenarios were applied to the case study catchments by firstidentifying the appropriate 0.5× 0.5◦ grid square from theglobal scenarios and subsequently perturbing the catchment1961–1990 daily rainfall, temperature and potential evapora-tion data by the mean monthly changes to create new 30-yeardaily time series. The variability in monthly precipitationfrom year to year was altered by rescaling anomalies from themean to produce a time series with altered coefficient of vari-ation (as also done by Arnell, 2003a). Change in potentialevaporation was estimated by applying the changes in tem-perature, vapour pressure and net radiation to mean monthlytemperature, vapour pressure and net radiation taken fromthe CRU TS3 baseline 1961-1990 climatology (Mitchell andJones, 2005), and using the Penman-Monteith equation toestimate mean monthly potential evaporation under baselineand future climates. Percentage changes in mean monthlypotential evaporation were then applied to the MORECS po-tential evaporation data on which the catchment models werecalibrated.
Figure 3 summarises the climate scenarios for each catch-ment, under an increase in mean global temperature of 2◦C,showing on the left hand side change in mean annual temper-ature against change in mean annual potential evaporation,and on the right hand side change in mean winter rainfallagainst change in mean summer rainfall. The seven prior-ity climate model scenarios are highlighted. Most of the cli-mate scenarios project an increase in temperature at the studysites slightly below the global average, although one consis-tently projects a slightly larger than average rise in tempera-ture across the UK. The climate models consistently projectan increase in mean winter rainfall, with magnitudes vary-ing between models, and virtually all project a decrease inmean summer rainfall. One climate model projects an in-crease in summer rainfall across the whole of the UK; onemore projects very small changes. Potential evaporation in-creases under all but one of the projections, but the mag-nitude of change varies considerably between climate mod-els. The increase is broadly related to temperature change,but is influenced by the change in relative humidity and, toa lesser extent, net radiation. For example, the model whichprojects a decrease in summer potential evaporation has a rel-atively high increase in summer temperature, but combinesthis with a large increase in relative humidity and a reductionin net radiation so potential evaporation actually falls. Thisvariation between models in their projected change in evap-oration, and “clustering” of behaviour, has also been iden-tified by Boe and Terray (2008), who showed that the dif-ferences were related to the way the models represented therespective roles of soil moisture and radiative energy at thesurface on evaporation; these differences led in turn to dif-ferences in summer rainfall and temperature response. This
clustering arises not simply because climate models share thesame pieces of computer code, but because conceptual rep-resentations of processes tend to fall into groups rather thanrepresent a continuum.
Scenarios characterising the effect of “natural” multi-decadal variability, in the absence of climate change, weretaken from the UKCIP98 scenario set (Hulme and Jenkins,1998) as used in Arnell (2003a). These scenarios representseven separate 30-year periods from a long climate modelsimulation with no change in greenhouse gas forcing, eachexpressed as a change relative to 1961–1990. Average an-nual temperature differs from the 1961–1990 average by be-tween−0.29 and +0.21◦C in the seven multi-decadal vari-ability scenarios, and mean monthly rainfall typically variesby between 5–10%.
3 Results
3.1 Seasonal changes in monthly flow regimes
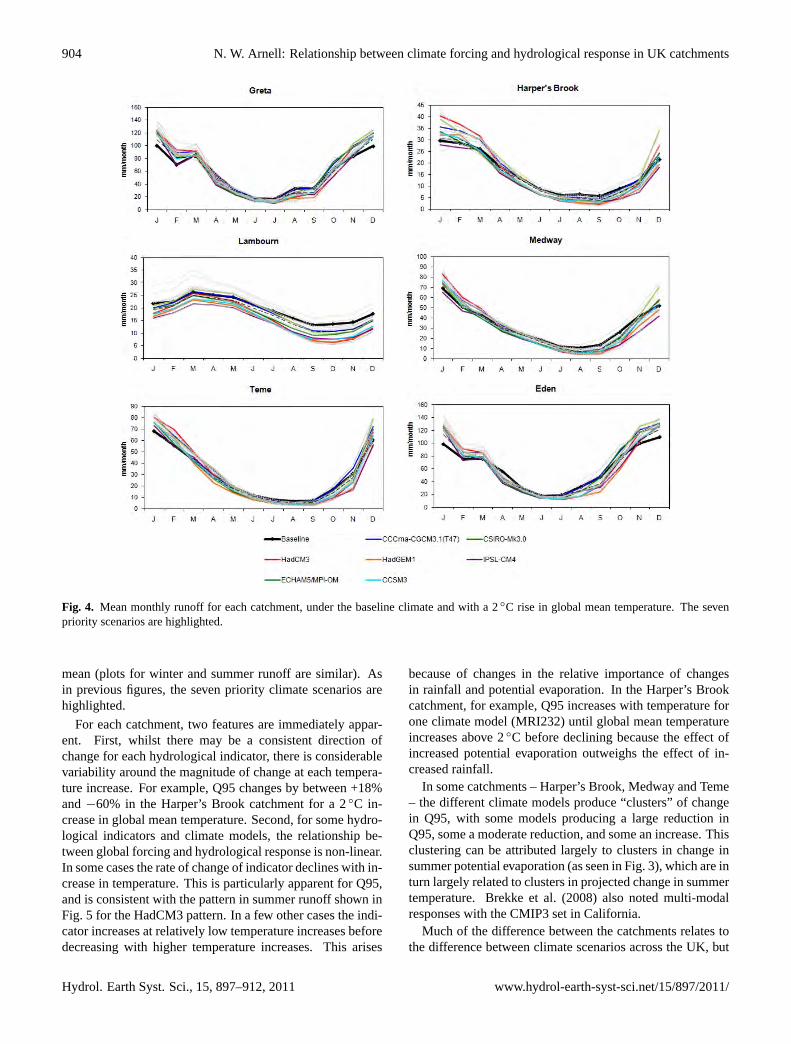
Figure 4 shows the mean monthly flow regimes for the sixcatchments, with a 2◦C change in global mean temperature,as an illustration of the shape of the change in hydrologicalregime. In each case, seven climate models are highlightedto allow comparison with similar monthly regime figures inKingston and Taylor (2010), Kingston et al. (2010), Hugheset al. (2010), Nobrega et al. (2011), Singh et al. (2010),Thorne (2010) and Xu et al. (2011). The other 14 climatemodel results are shown as thin dashed lines.
Qualitatively, the patterns of change in runoff through theyear in the study catchments shown in Fig. 4 are similar tothe patterns simulated in the same catchments under earlierscenarios (Arnell, 2003a, 2004); there is a strong tendencytowards increased runoff in winter and reduced runoff insummer, with geographical variations between the differentcatchments.
3.2 Hydrological response to forcing
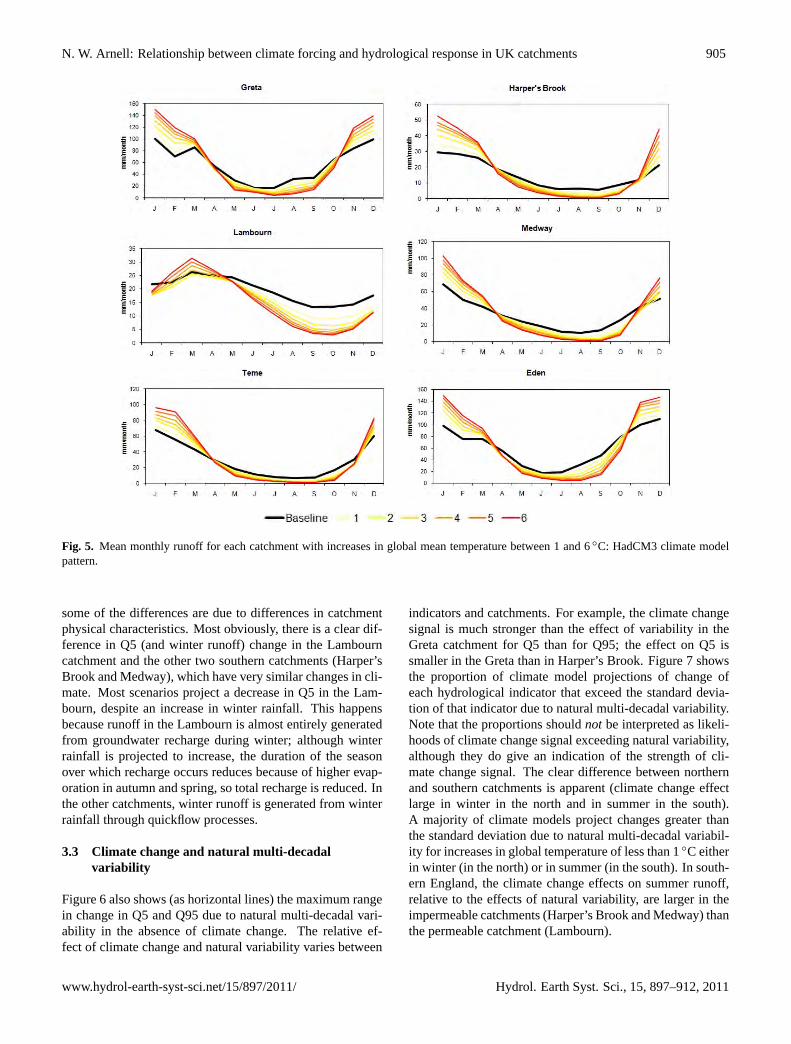
Figure 5 shows the mean monthly flow regimes for eachcatchment with increases in global mean temperature of 1 to6◦C, for the HadCM3 climate model pattern (again, for com-parison with Kingston and Taylor, 2010; Kingston et al.,2010; Hughes et al., 2010; Nobrega et al., 2011; Singh etal., 2010; Thorne, 2010 and Xu et al., 2011). In winter, thereis a tendency for the change in flow (an increase in all ex-cept the Lambourn) to increase consistently with increase inglobal mean temperature, but in summer there is evidencethat the rate of change slows as temperature increases. Thisis because the catchments are all relatively dry in summer, sofurther reductions in water availability have relatively littleeffect on runoff.
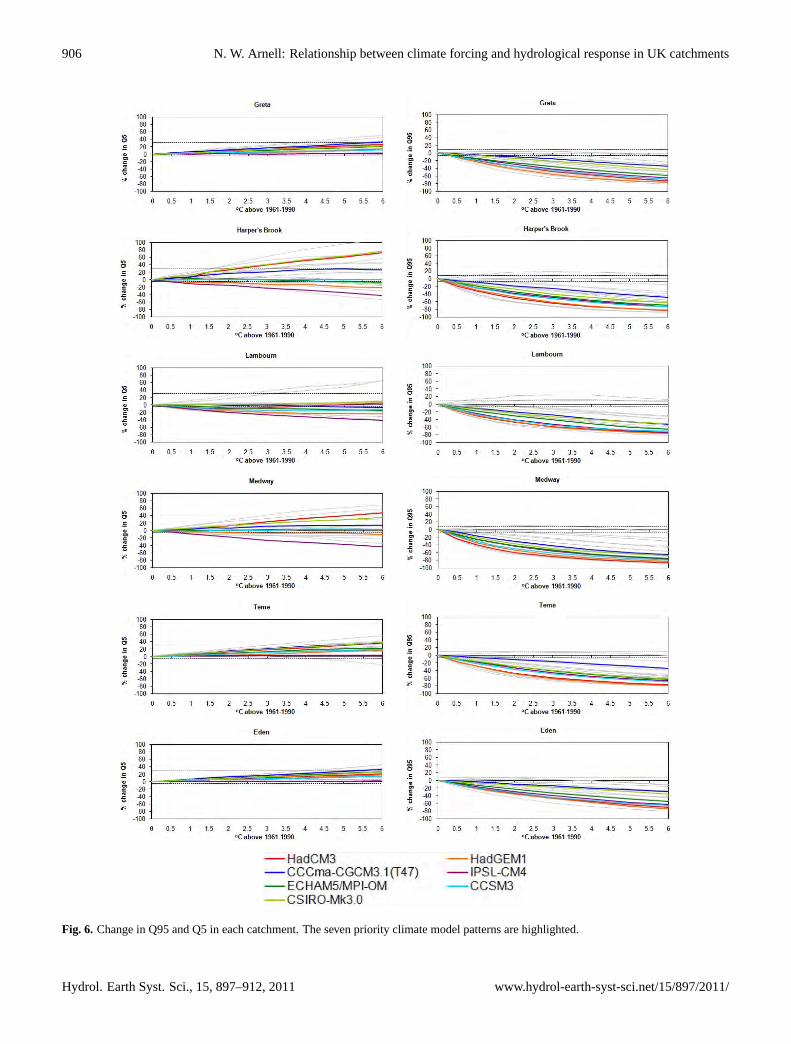
Figure 6 shows the response of Q5 (high flow) and Q95(low flow) in each of the six case study catchments, for globalaverage temperatures from 0.5 to 6◦C above the 1961–1990
Hydrol. Earth Syst. Sci., 15, 897–912, 2011 www.hydrol-earth-syst-sci.net/15/897/2011/

N. W. Arnell: Relationship between climate forcing and hydrological response in UK catchments 903
Fig. 3. Change in climate characteristics for each catchment, for a 2◦C rise in global mean temperature. Left panel: change in mean annualtemperature and mean annual potential evaporation. Right panel: change in mean winter and summer rainfall. The seven priority scenariosare highlighted.
www.hydrol-earth-syst-sci.net/15/897/2011/ Hydrol. Earth Syst. Sci., 15, 897–912, 2011
904 N. W. Arnell: Relationship between climate forcing and hydrological response in UK catchments
Fig. 4. Mean monthly runoff for each catchment, under the baseline climate and with a 2◦C rise in global mean temperature. The sevenpriority scenarios are highlighted.
mean (plots for winter and summer runoff are similar). Asin previous figures, the seven priority climate scenarios arehighlighted.
For each catchment, two features are immediately appar-ent. First, whilst there may be a consistent direction ofchange for each hydrological indicator, there is considerablevariability around the magnitude of change at each tempera-ture increase. For example, Q95 changes by between +18%and−60% in the Harper’s Brook catchment for a 2◦C in-crease in global mean temperature. Second, for some hydro-logical indicators and climate models, the relationship be-tween global forcing and hydrological response is non-linear.In some cases the rate of change of indicator declines with in-crease in temperature. This is particularly apparent for Q95,and is consistent with the pattern in summer runoff shown inFig. 5 for the HadCM3 pattern. In a few other cases the indi-cator increases at relatively low temperature increases beforedecreasing with higher temperature increases. This arises
because of changes in the relative importance of changesin rainfall and potential evaporation. In the Harper’s Brookcatchment, for example, Q95 increases with temperature forone climate model (MRI232) until global mean temperatureincreases above 2◦C before declining because the effect ofincreased potential evaporation outweighs the effect of in-creased rainfall.
In some catchments – Harper’s Brook, Medway and Teme– the different climate models produce “clusters” of changein Q95, with some models producing a large reduction inQ95, some a moderate reduction, and some an increase. Thisclustering can be attributed largely to clusters in change insummer potential evaporation (as seen in Fig. 3), which are inturn largely related to clusters in projected change in summertemperature. Brekke et al. (2008) also noted multi-modalresponses with the CMIP3 set in California.
Much of the difference between the catchments relates tothe difference between climate scenarios across the UK, but
Hydrol. Earth Syst. Sci., 15, 897–912, 2011 www.hydrol-earth-syst-sci.net/15/897/2011/
N. W. Arnell: Relationship between climate forcing and hydrological response in UK catchments 905
Fig. 5. Mean monthly runoff for each catchment with increases in global mean temperature between 1 and 6◦C: HadCM3 climate modelpattern.
some of the differences are due to differences in catchmentphysical characteristics. Most obviously, there is a clear dif-ference in Q5 (and winter runoff) change in the Lambourncatchment and the other two southern catchments (Harper’sBrook and Medway), which have very similar changes in cli-mate. Most scenarios project a decrease in Q5 in the Lam-bourn, despite an increase in winter rainfall. This happensbecause runoff in the Lambourn is almost entirely generatedfrom groundwater recharge during winter; although winterrainfall is projected to increase, the duration of the seasonover which recharge occurs reduces because of higher evap-oration in autumn and spring, so total recharge is reduced. Inthe other catchments, winter runoff is generated from winterrainfall through quickflow processes.
3.3 Climate change and natural multi-decadalvariability
Figure 6 also shows (as horizontal lines) the maximum rangein change in Q5 and Q95 due to natural multi-decadal vari-ability in the absence of climate change. The relative ef-fect of climate change and natural variability varies between
indicators and catchments. For example, the climate changesignal is much stronger than the effect of variability in theGreta catchment for Q5 than for Q95; the effect on Q5 issmaller in the Greta than in Harper’s Brook. Figure 7 showsthe proportion of climate model projections of change ofeach hydrological indicator that exceed the standard devia-tion of that indicator due to natural multi-decadal variability.Note that the proportions shouldnot be interpreted as likeli-hoods of climate change signal exceeding natural variability,although they do give an indication of the strength of cli-mate change signal. The clear difference between northernand southern catchments is apparent (climate change effectlarge in winter in the north and in summer in the south).A majority of climate models project changes greater thanthe standard deviation due to natural multi-decadal variabil-ity for increases in global temperature of less than 1◦C eitherin winter (in the north) or in summer (in the south). In south-ern England, the climate change effects on summer runoff,relative to the effects of natural variability, are larger in theimpermeable catchments (Harper’s Brook and Medway) thanthe permeable catchment (Lambourn).
www.hydrol-earth-syst-sci.net/15/897/2011/ Hydrol. Earth Syst. Sci., 15, 897–912, 2011
906 N. W. Arnell: Relationship between climate forcing and hydrological response in UK catchments
Fig. 6. Change in Q95 and Q5 in each catchment. The seven priority climate model patterns are highlighted.
Hydrol. Earth Syst. Sci., 15, 897–912, 2011 www.hydrol-earth-syst-sci.net/15/897/2011/

N. W. Arnell: Relationship between climate forcing and hydrological response in UK catchments 907
Fig. 7. Proportion of climate scenarios where change in runoff indicators exceeds the standard deviation due to climatic variability.
3.4 Relative magnitude of climate forcing andhydrological model uncertainty
Figure 8 shows the change in mean monthly runoff in thesix catchments for a 2◦C global mean warming with the21 climate model patterns and, for the HadCM3 pattern,the 100 sets of catchment model parameters. Hydrologi-cal model parameter uncertainty has negligible effect on thechange in mean winter and spring runoff (except in the Lam-bourn), but relatively more effect on mean summer and, par-ticularly, autumn runoff. This is largely because the differentparameter sets produce greater differences in absolute runoffduring summer and autumn than in other times of the year,and therefore the seasonal water balance (and hence sensitiv-ity to change) is different. The relatively large effect of pa-rameter uncertainty in the Lambourn arises because the vastmajority of runoff is generated during the winter rechargeseason, and the length of this is relatively sensitive to modelparameters. In the other catchments, runoff is generatedthroughout the year.
The range in change between different hydrological modelparameterisations is considerably smaller than the range inchange between the 21 different climate models (and simi-lar results were found using other climate model patterns).The effect of hydrological model parameter uncertainty inthis study is slightly smaller than found in Irish catch-ments by Steele-Dunn et al. (2008) and for the Thames byWilby (2005).
3.5 Representing the effects of climate modeluncertainty
Figures 4, 5 and 6 show that there is a considerable rangein the potential impact of climate change on hydrologicalregimes in UK catchments amongst the 21 climate scenariosconsidered. This leads to two (related) questions:
i. How can this information be synthesised or sum-marised?
www.hydrol-earth-syst-sci.net/15/897/2011/ Hydrol. Earth Syst. Sci., 15, 897–912,2011

908 N. W. Arnell: Relationship between climate forcing and hydrological response in UK catchments
Fig. 8. Change in mean monthly runoff for the each catchment for a 2◦C rise in global mean temperature, under the 21 climate scenariosand, for the HadCM3 pattern, 100 sets of catchment model parameters.
ii. Can the different climate model projections be treateddifferently?
Papers in the climate literature summarising the results ofmultiple climate model runs typically present the meanchange, and use the standard deviation of change acrossmodel runs as an indication of uncertainty. However, thisassumes that the changes are normally distributed; evidencefrom Fig. 6 suggests that projected hydrological changes arenot necessarily normally distributed, and are not necessarily
even uni-modal. The ensemble mean is therefore not neces-sarily an appropriate indication of “typical” change (as alsonoted by Knutti et al., 2010), and the standard deviation isnot a good measure of uncertainty.
Uncertainty in response is therefore best represented byshowing in some way the full set of modelled outcomes. Re-sults can be presented as histograms of change, as empiricaldistribution functions fitted to the distributions of change,or as inter-quantile ranges. Histograms show all the infor-mation, but the clustering within the histogram may simply
Hydrol. Earth Syst. Sci., 15, 897–912, 2011 www.hydrol-earth-syst-sci.net/15/897/2011/

N. W. Arnell: Relationship between climate forcing and hydrological response in UK catchments 909
reflect similarities in the climate model representations andthe sample of models used rather than clustering in potentialphysical responses. Empirical distribution functions can beseen as simply smoothed histograms, and clustering in sce-narios will manifest itself in “steps” in the empirical distribu-tion function. An inter-quantile range gives an indication ofthe spread of possible outcomes, but unless several quantilesare used provides no information on the distribution of re-sponses within the range. Use of the extremes (highest tolowest) may give a misleading indication of spread of re-sponses, if one scenario is a distinct “outlier”, and use ofintermediate ranges – such as the 10–90% range – may givea better representation of spread.
The simplest integration of the results from multiple cli-mate models assumes that all climate model projections areequally credible, and indeed are independent. An increas-ing literature has explored methods of weighting differentmodel projections in order to produce either weighted ensem-ble mean estimates of impact or weighted probability distri-butions and histograms (e.g. Tebaldi et al., 2005; Moise andHudson, 2008), or to cull “poorly-performing” models fromthe analysis. There are however, both practical and concep-tual challenges to this approach. On the practical level, it isnot clear how to calculate model weights. Ability to simulatepast behaviour is not necessarily a good guide to a model’sability to project future changes, and there are many poten-tial indicators of model skill (Gleckler et al., 2008). Also,the models are not necessarily independent from each other.On a conceptual level, it has been argued that, because ofdeep and structural uncertainty, it is not appropriate to seekto estimate the relative weight of different climate models,and to do so would lead to significant overinterpretation ofmodel-based scenarios (Stainforth et al., 2007): all modelsare only partial representations of a complex world, and missimportant processes. In practice, studies that have examinedthe effects of weighting models differently or culling “poor”models have shown that the weighting or culling has rela-tively little effect on the estimated range of climate changeimpacts (Brekke et al., 2008; Chiew et al., 2009; Weigel etal., 2010).
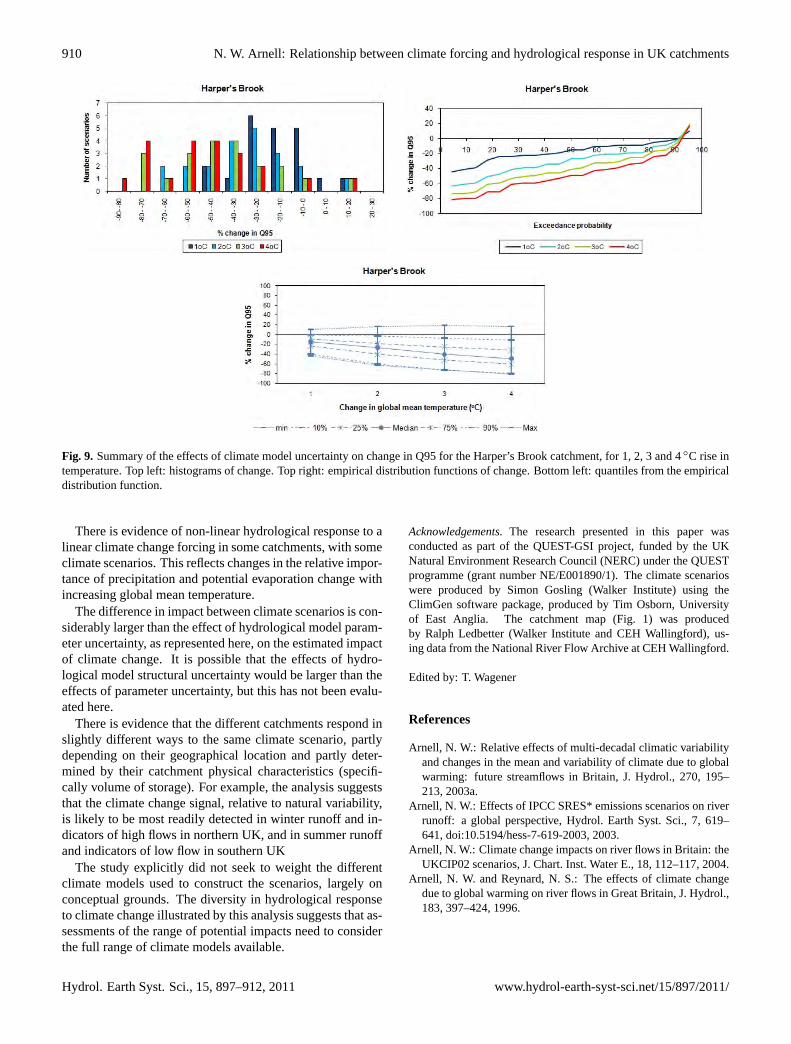
Figure 9 shows three different ways of characterising theuncertainty in change in Q95 at different changes in globalmean temperature in one of the six study catchments, treat-ing each of the 21 climate model scenarios as equally plau-sible. The top left panel shows the histograms of changeat 1, 2, 3 and 4◦C increases in global mean temperature, giv-ing an indication of numbers of scenarios in different changeclasses. The top right panel shows the empirical distributionsof change in Q95, derived simply by ranking the 21 changes.The steps reflect the relatively small number of scenariosused to construct the distributions. The bottom left panelshows quantiles from the empirical distribution function (andcan be compared with the matching plot in Fig. 6). Each ofthese three graphs reduces the complexity of the informationcontained within, for example, Fig. 6.
4 Conclusions
This paper has examined the effect of climate change onriver flow characteristics in a sample of UK catchments, us-ing a large number of climate scenarios (based on 21 cli-mate models) scaled to represent progressively increasingamounts of climate change. This approach allows an assess-ment of the relationship between climate forcing and hydro-logical response, and also facilitates comparisons betweenclimate model scenarios in order to characterise uncertainty.There are, of course, several key caveats with the analysis.It is assumed that catchment properties do not change overtime, and more specifically that hydrological model param-eters derived from the recent past continue to apply as cli-mate changes. It is assumed that the pattern-scaling approachused to construct consistent scenarios representing progres-sive increases in global mean temperature is appropriate; thismay not be the case for the highest increases in global meantemperature considered here. Finally, the climate scenariosrepresent just changes in mean monthly climate, togetherwith changes in year-to-year variability in rainfall, but donot characterise potential changes in, for example, the rel-ative amounts of rain falling in different intensity events, orchanges in the structure of year-to-year variability in weather.It is therefore likely that the resultsunderestimatethe rangein potential changes in hydrological characteristics. Despitethese caveats, it is possible to draw a number of conclusions.
There is a large spread in hydrological response to pro-jected climate change, driven largely but not entirely by dif-ferences in projected change in rainfall with the 21 climatemodels. Differences in projected summer potential evapora-tion also affect substantially projections of change in sum-mer runoff and indicators of low flow. Percentage changesin runoff tend to be greatest in late summer and early au-tumn. With an increase in global mean temperature of 2◦C(above the 1961–1990 mean), the percentage change in sum-mer runoff typically varies between−40% and +20%, in thesix study catchments.
There is some evidence amongst the 21 climate models ofclusters in projected changes, particularly for summer runoffand indicators of low flows. This is largely driven by dif-ferences in climate model projections of summer evapora-tion change – itself influenced to a certain extent by differentclimate model formulations. This implies that it is inappro-priate to characterise the impacts of climate change by theensemble mean impact, or represent uncertainty by simplemeasures such as the standard deviation of response. It is bet-ter to represent uncertainty by showing the full set of results,either through histograms of change, empirical distributionfunctions or as an inter-quantile range.
For most of the hydrological indicators considered, andmost catchments, the effect of climate change begins to ex-ceed that of multi-decadal variability once the increase inglobal mean temperature exceeds 1◦C above the 1961–1990mean.
www.hydrol-earth-syst-sci.net/15/897/2011/ Hydrol. Earth Syst. Sci., 15, 897–912, 2011
910 N. W. Arnell: Relationship between climate forcing and hydrological response in UK catchments
Fig. 9. Summary of the effects of climate model uncertainty on change in Q95 for the Harper’s Brook catchment, for 1, 2, 3 and 4◦C rise intemperature. Top left: histograms of change. Top right: empirical distribution functions of change. Bottom left: quantiles from the empiricaldistribution function.
There is evidence of non-linear hydrological response to alinear climate change forcing in some catchments, with someclimate scenarios. This reflects changes in the relative impor-tance of precipitation and potential evaporation change withincreasing global mean temperature.
The difference in impact between climate scenarios is con-siderably larger than the effect of hydrological model param-eter uncertainty, as represented here, on the estimated impactof climate change. It is possible that the effects of hydro-logical model structural uncertainty would be larger than theeffects of parameter uncertainty, but this has not been evalu-ated here.
There is evidence that the different catchments respond inslightly different ways to the same climate scenario, partlydepending on their geographical location and partly deter-mined by their catchment physical characteristics (specifi-cally volume of storage). For example, the analysis suggeststhat the climate change signal, relative to natural variability,is likely to be most readily detected in winter runoff and in-dicators of high flows in northern UK, and in summer runoffand indicators of low flow in southern UK
The study explicitly did not seek to weight the differentclimate models used to construct the scenarios, largely onconceptual grounds. The diversity in hydrological responseto climate change illustrated by this analysis suggests that as-sessments of the range of potential impacts need to considerthe full range of climate models available.
Acknowledgements.The research presented in this paper wasconducted as part of the QUEST-GSI project, funded by the UKNatural Environment Research Council (NERC) under the QUESTprogramme (grant number NE/E001890/1). The climate scenarioswere produced by Simon Gosling (Walker Institute) using theClimGen software package, produced by Tim Osborn, Universityof East Anglia. The catchment map (Fig. 1) was producedby Ralph Ledbetter (Walker Institute and CEH Wallingford), us-ing data from the National River Flow Archive at CEH Wallingford.
Edited by: T. Wagener
References
Arnell, N. W.: Relative effects of multi-decadal climatic variabilityand changes in the mean and variability of climate due to globalwarming: future streamflows in Britain, J. Hydrol., 270, 195–213, 2003a.
Arnell, N. W.: Effects of IPCC SRES* emissions scenarios on riverrunoff: a global perspective, Hydrol. Earth Syst. Sci., 7, 619–641, doi:10.5194/hess-7-619-2003, 2003.
Arnell, N. W.: Climate change impacts on river flows in Britain: theUKCIP02 scenarios, J. Chart. Inst. Water E., 18, 112–117, 2004.
Arnell, N. W. and Reynard, N. S.: The effects of climate changedue to global warming on river flows in Great Britain, J. Hydrol.,183, 397–424, 1996.
Hydrol. Earth Syst. Sci., 15, 897–912, 2011 www.hydrol-earth-syst-sci.net/15/897/2011/
N. W. Arnell: Relationship between climate forcing and hydrological response in UK catchments 911
Bates,B. C., Kundzewicz, Z., Wu, S., and Palutikof, J.: ClimateChange and Water, Technical Paper of the IntergovernmentalPanel on Climate Change, IPCC Secretariat, Geneva, 210 pp.,2008.
Boe, J. and Terray, L.: Uncertainties in summer evapo-transpiration changes over Europe and implications for re-gional climate change, Geophys. Res. Lett., 35, L05702,doi:10.1029/2007GL032417,2008.
Brekke, L. D., Dettinger, M. D., Maurer, E. P., and Anderson, M.:Significance of model credibility in estimating climate projectiondistributions for regional hydroclimatological risk assessments,Climatic Change, 89, 371–394, 2008.
Chiew, F. H. S., Teng, J., Vaze, J., and Kirono, D. G. C.: Influenceof global climate model selection on runoff impact assessments,J. Hydrol., 379, 172–180, 2009.
Gleckler, P. J., Taylor, K. E., and Doutriaux, C.: Performancemetrics for climate models, J. Geophys. Res., 113 D06104,doi:10.1029/2007JD008972,2008.
Gosling, S. N. and Arnell, N. W.: Simulating current globalriver runoff with a global hydrological model: model revisions,validation and sensitivity analysis, Hydrol. Process., in press,doi:10.1002/hyp.7727,2010.
Hughes,D. A., Kingston, D. G., and Todd, M. C.: Uncertainty inwater resources availability in the Okavango River Basin as aresult of climate change, Hydrol. Earth Syst. Sci. Discuss., 7,5737–5768, doi:10.5194/hessd-7-5737-2010,2010.
Hulme, M. and Jenkins, G.: Climate change scenarios for theUnited Kingdom: scientific report, UKCIP Technical ReportNo. 1, Climatic Research Unit, University of East Anglia, Nor-wich, 1998.
IPCC: Climate Change 2007: The Physical Science Basis, Con-tribution of Working Group I to the Fourth Assessment Reportof the Intergovernmental Panel on Climate Change, edited by:Solomon, S., Qin, D., Manning, M., Marquis, M., Averyt, K.,Tignor, M. M. B., Miller, H. L., and Chen, Z., Cambridge Uni-versity Press, Cambridge, 996 pp., 2007.
Kingston, D. G. and Taylor, R. G.: Sources of uncertainty in cli-mate change impacts on river discharge and groundwater in aheadwater catchment of the Upper Nile Basin, Uganda, Hy-drol. Earth Syst. Sci., 14, 1297–1308, doi:10.5194/hess-14-1297-2010,2010.
Kingston, D. G., Thompson, J. R., and Kite, G.: Uncertaintyin climate change projections of discharge for the MekongRiver Basin, Hydrol. Earth Syst. Sci. Discuss., 7, 5991–6024,doi:10.5194/hessd-7-5991-2010,2010.
Knutti, R., Furrer, R., Tebaldi, C., Cermak, J., and Meehl, G. A.:Challenges in combining projections from multiple climate mod-els, J. Climate, 23, 2739–2758, 2010.
Kundzewicz, Z. W., Mata, L. J., Arnell, N. W., Doell, P., Kabat, P.,Jimenez, B., Miller, K., Oki, T., Sen, Z., and Shiklomanov, I.:Freshwater resources and their management, in: Climate Change2007: Impacts, Adaptation and Vulnerability, Contribution ofWorking Group II to the Fourth Assessment Report of the Inter-governmental Panel on Climate Change, edited by: Parry, M. L.,Canziani, O. F., Palutikof, J. P., van der Linden, P. J., and Han-son, C. E., Cambridge University Press, Cambridge, 173–210,2007.
Meehl, G. A., Covey, C., Delworth, T., Latif, M., McAvaney,B., Mitchell, J. F. B., Stouffer, R. J., and Taylor, K. E.: TheWRCP CMIP3 multimodel dataset – a new era in climate changeresearch, B. Am. Meteor. Soc., 88, 1383–1394, 2007.
Mitchell, T. D.: Pattern scaling – an examination of the accuracyof the technique for describing future climates, Climatic Change,60, 217–242, 2003.
Mitchell, T. D. and Jones, P. D.: An improved method of construct-ing a database of monthly climate observations and associatedhigh resolution grids, Int. J. Climatol., 25, 693–712, 2005.
Moise,A. F. and Hudson, D. A.: Probabilistic prediction of climatechange for Australia and southern Africa using the reliability en-semble average of IPCC CMIP3 model simulations, J. Geophys.Res., 113, D15113, doi:10.1029/2007JD009250, 2008.
Moore,R. J.: The probability-distributed principle and runoff pro-duction at point and basin scales, Hydrolog. Sci. J., 30, 273–297,1985.
Moore,R. J.: The PDM rainfall-runoff model, Hydrol. Earth Syst.Sci., 11, 483–499, doi:10.5194/hess-11-483-2007, 2007.
Moore, R. V., Morris, D. G., and Flavin, R. W.: Sub-set of UKdigital 1:50,000 scale river centre-line network, NERC, Instituteof Hydrology, Wallingford, 1994.
Morris,D. G. and Flavin, R. W.: Sub-set of UK 50 m by 50 m hydro-logical digital terrain model grids, NERC, Institute of Hydrology,Wallingford, 1994.
Nash,J. E. and Sutcliffe, J. V.: River flow forecasting through con-ceptual models – Part 1 – a discussion of principles, J. Hydrol.,10, 282–290, 1970.
Nobrega, M. T., Collischonn, W., Tucci, C. E. M., and Paz, A. R.:Uncertainty in climate change impacts on water resources in theRio Grande Basin, Brazil, Hydrol. Earth Syst. Sci., 15, 585–595,doi:10.5194/hess-15-585-2011, 2011.
Osborn,T. J.: A user guide to ClimGen: a flexible tool for generat-ing monthly climate data sets and scenarios, Climatic ResearchUnit, University of East Anglia, Norwich, 17 pp., 2009.
Singh, C. R., Thompson, J. R., French, J. R., Kingston, D. G.,and Mackay, A. W.: Modelling the impact of prescribed globalwarming on runoff from headwater c atchments of the IrrawaddyRiver and their implications for the water level regime of LoktakLake, northeast India, Hydrol. Earth Syst. Sci., 14, 1745–1765,doi:10.5194/hess-14-1745-2010, 2010.
Stainforth,D. A., Allen, M. R., Tredger, E. R., and Smith, L. A.:Confidence, uncertainty and decision-support relevance in cli-mate prediction, Philos. T. Roy. Soc. A, 365, 2145–2161, 2007.
Steele-Dunne,S., Lynch, P., McGrath, R., Semmier, T., Wang, S.Y., Hanafin, J., and Nolan, P.: The impacts of climate change onhydrology in Ireland, J. Hydrol., 356, 28–45, 2008.
Tebaldi, C., Smith, R. L., Nychka, D., and Mearns, L. O.: Quan-tifying uncertainty in projections of regional climate change: ABayesian approach to the analysis of multimodel ensembles, J.Climate, 18, 1524–1540, 2005.
Thompson,N., Barrie, I. A., and Ayles, M.: The MeteorologicalOffice rainfall and evaporation calculation system (MORECS),Hydrological Memorandum 45, Met. Office, Bracknell, 1981
Thorne, R.: Uncertainty in the impacts of projected climatechange on the hydrology of a subarctic environment: LiardRiver Basin, Hydrol. Earth Syst. Sci. Discuss., 7, 3129–3157,doi:10.5194/hessd-7-3129-2010, 2010.
www.hydrol-earth-syst-sci.net/15/897/2011/ Hydrol. Earth Syst. Sci., 15, 897–912, 2011

912 N. W. Arnell: Relationship between climate forcing and hydrological response in UK catchments
Todd, M. C., Taylor, R. G., Osborne, T., Kingston, D., Arnell, N. W.,and Gosling, S. N.: Quantifying the impact of climate changeon water resources at the basin scale on five continents a uni-fied approach, Hydrol. Earth Syst. Sci. Discuss., 7, 7485–7519,doi:10.5194/hessd-7-7485-2010,2010.
Weigel, A. P., Knutti, R., Liniger, M. A., and Appenzeller, C.: Risksof model weighting in multimodel climate projections, J. Cli-mate, 23, 4175–4191, 2010.
Wilby, R. L.: Uncertainty in water resource model parametersused for climate change impact assessment, Hydrol. Process., 19,3201–3219, 2005.
Xu, H., Taylor, R. G., and Xu, Y.: Quantifying uncertainty in theimpacts of climate change on river discharge in sub-catchmentsof the Yangtze and Yellow River Basins, China, Hydrol. EarthSyst. Sci., 15, 333–344,doi:10.5194/hess-15-333-2011, 2011.
Hydrol. Earth Syst. Sci., 15, 897–912, 2011 www.hydrol-earth-syst-sci.net/15/897/2011/