uncertainty in measurement © 2012 pearson education, inc
TRANSCRIPT
© 2012 Pearson Education, Inc.
Uncertainty in Measurement

© 2012 Pearson Education, Inc.
Uncertainty in Measurements
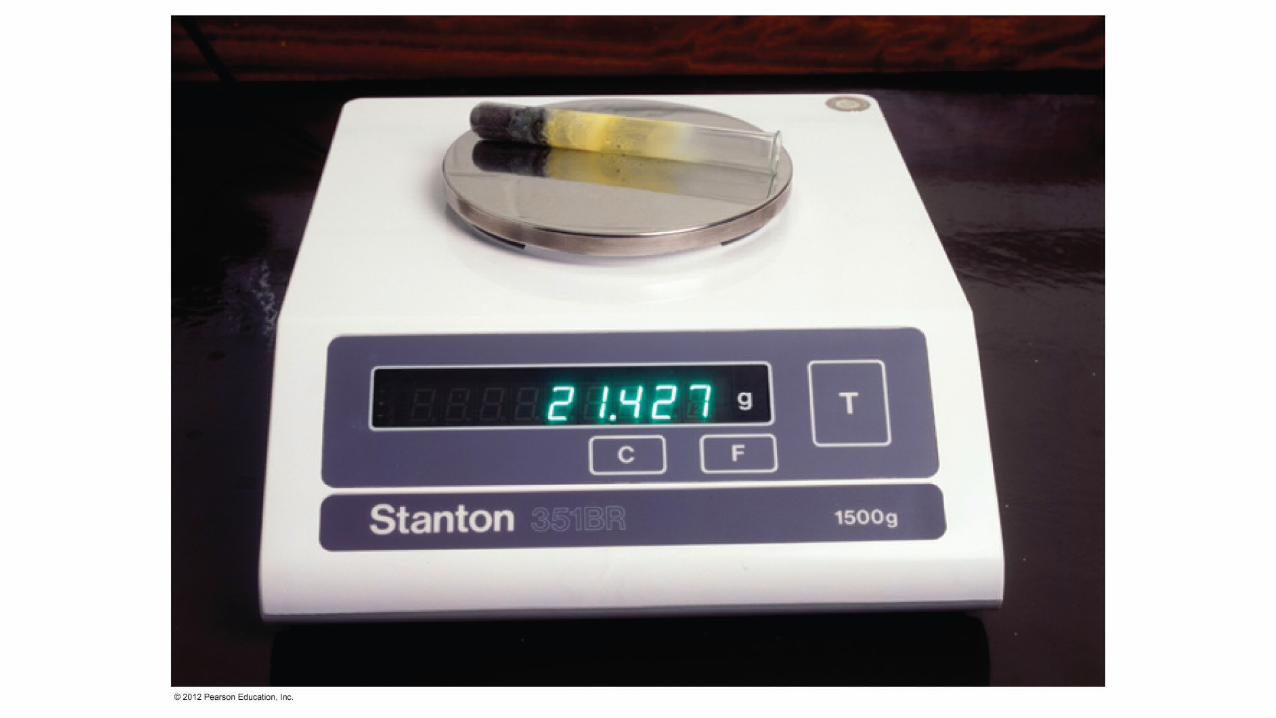
Different measuring devices have different uses and different degrees of accuracy.

ESTIMATE THE LAST PLACE!
© 2012 Pearson Education, Inc.
Significant Figures
•The term significant figures refers to digits that were measured.•When rounding calculated numbers, we pay attention to significant figures so we do not overstate the accuracy of our answers.

© 2012 Pearson Education, Inc.
Significant Figures1. All nonzero digits are significant.2. Zeroes between two significant figures are
themselves significant.3. Zeroes at the beginning of a number are never
significant.4. Zeroes at the end of a number are significant if
a decimal point is written in the number.

10300 g10300 g10300 g
Significant FiguresRule 1: 123 grams (three significant figures)Rule 2: 103 grams (three significant figures)Rule 3: 0.1 or 0.01 gram (one significant figures)
1 x 10 -1 or 1 x 10 -2 gRule 4: End of number with decimal point

7.6 cm = 2 significant figures
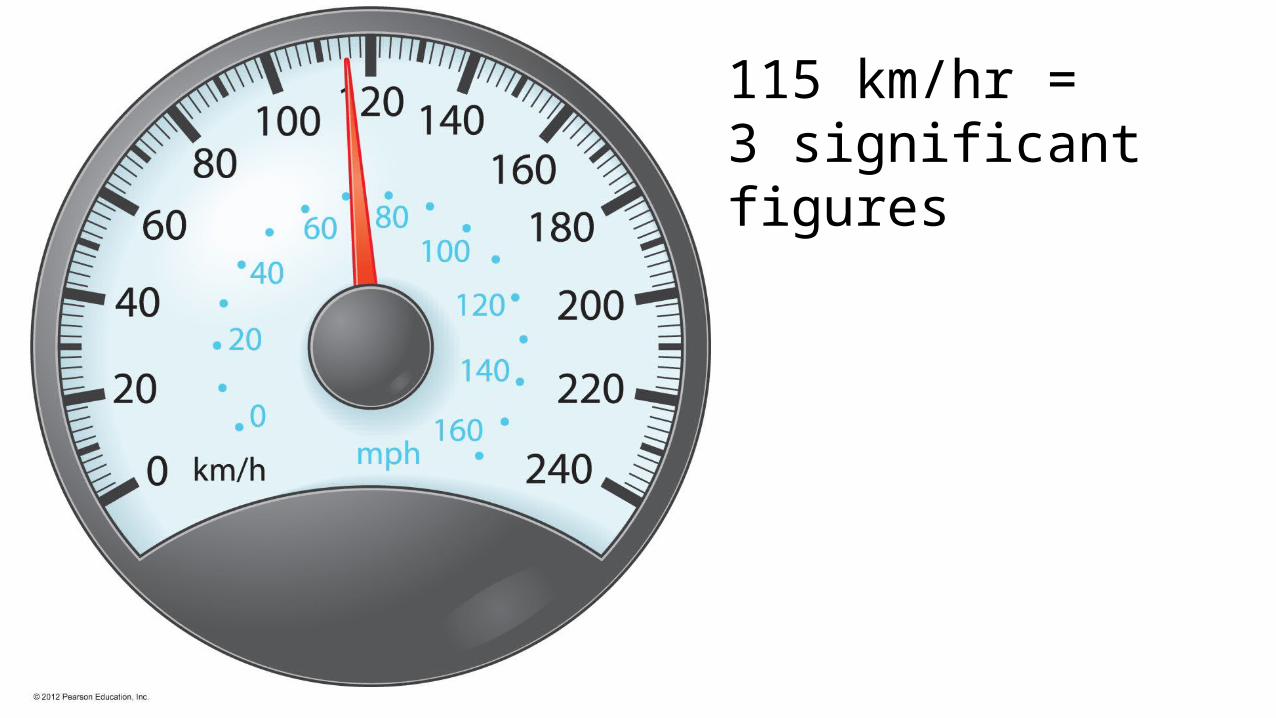
115 km/hr = 3 significant figures

What is “wrong” with the measurements?
How many significant figures in the volume?

14.45 mL
If on the LINE14.40
mL
Always estimate the LAST DIGIT-
even if it is a zero!
© 2012 Pearson Education, Inc.
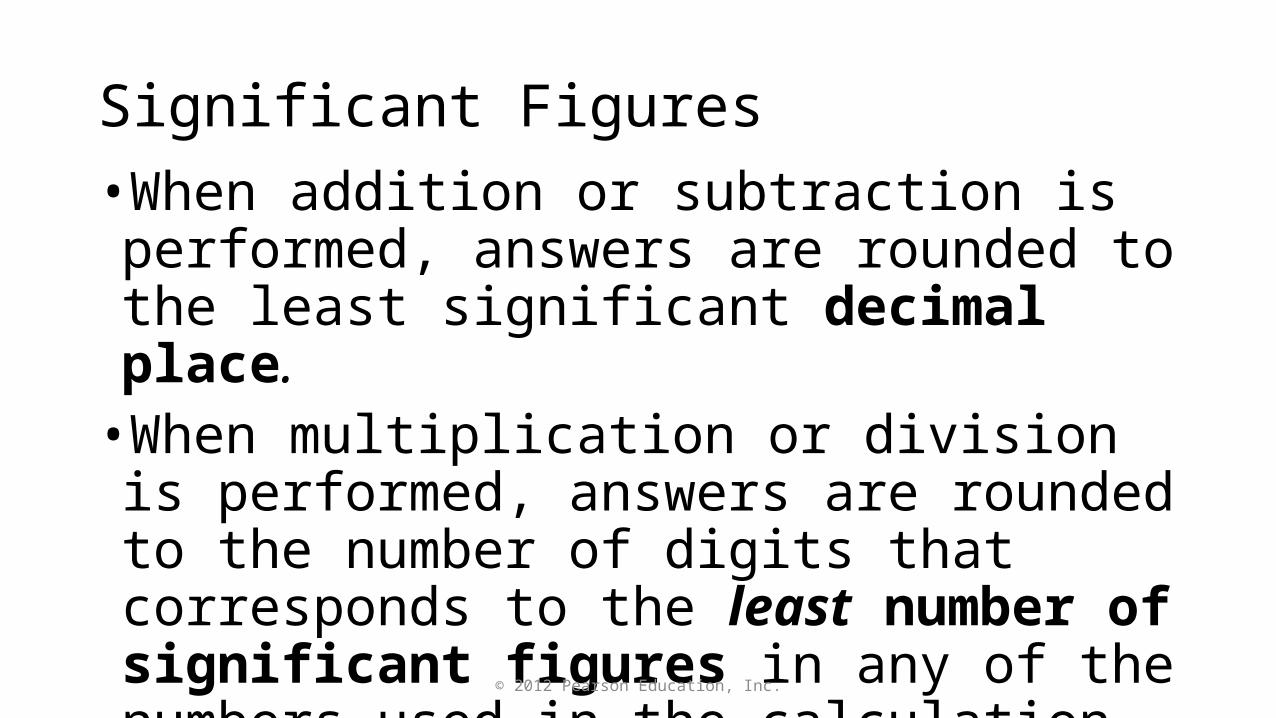
Significant Figures•When addition or subtraction is performed, answers are rounded to the least significant decimal place.•When multiplication or division is performed, answers are rounded to the number of digits that corresponds to the least number of significant figures in any of the numbers used in the calculation.

Addition/Subtraction “POSITION”
Multiplication/Division “least amount/number”

Unit Conversions: Dimensional Analysis
Convert 8.00 m to inches
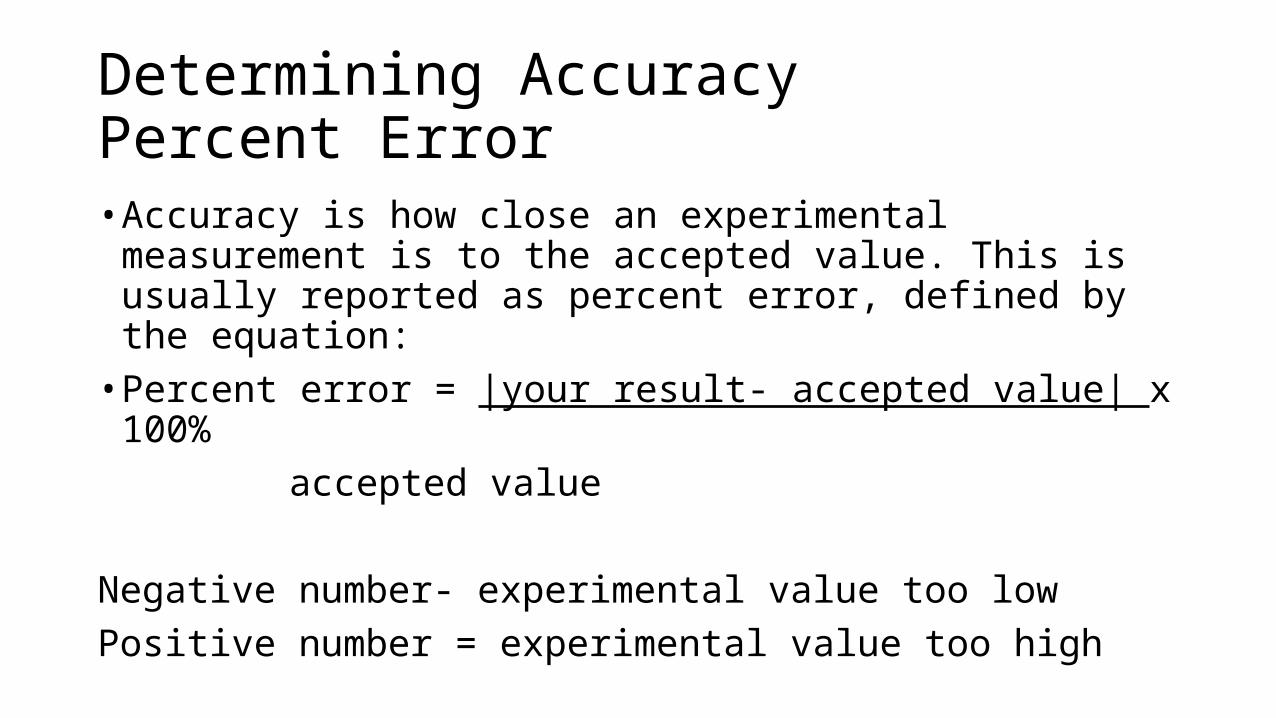
Determining AccuracyPercent Error• Accuracy is how close an experimental measurement is to the
accepted value. This is usually reported as percent error, defined by the equation:• Percent error = |your result- accepted value| x 100%
accepted value
Negative number- experimental value too lowPositive number = experimental value too high

Determining Thickness of Aluminum Foil and determine percent error in your measurements
Pre-Lab•How are you going to do this?•Measurements needed?•Additional information necessary?•What should go in data table?•Materials needed•Accepted Value 22 microns (mm)

Lab Notebook- IN INK ONLY• Title:• Purpose/Problem:• Materials:• Numbered procedure (include SAFETY concerns)• Data Table (measurements AND calculated values)• Calculations (with significant figures)• Percent Error(HOW did your error in measurement affect your calculated value?)• Error Analysis • Conclusion

Pts Self Peer Tchr
Format Includes title, members in group, 1 sentence purpose or problem identified,
2
Materials Include list of materials needed (only necessary when you are designing the procedure)
2
Procedure Procedures were outlined in a step-by-step fashion that could be followed by anyone without additional explanations. No adult help was needed to accomplish this. Must include SAFETY.
2
Data Collection
Measurements and calculated values with labels are in your data table. Data are entered in table(s) during class time. Graphs and tables are labeled and titled (when applicable).
3
Calculations ONE sample calculation is shown; the results are labeled, and included correct number of significant figures. Value should appear in your data table.
2
Error Analysis Predictions are made about your error in measurement. How did your error in measurement affect your calculated value?
2
Conclusion Conclusion is a grammatically correct, one-to two- sentence summary of results, and is a separate section of the report. (Include any calculated error in statement(s)).
2
15