uncertainty communication
TRANSCRIPT

8/2/2019 Uncertainty Communication
http://slidepdf.com/reader/full/uncertainty-communication 1/64
Uncertainty Communication
Issues and good practice
Penny Kloprogge, Jeroen van der Sluijs
and Arjan Wardekker

8/2/2019 Uncertainty Communication
http://slidepdf.com/reader/full/uncertainty-communication 2/64
This report is prepared in commission of the Netherlands Environmental AssessmentAgency (MNP)
Report NWS-E-2007-199ISBN 978-90-8672-026-2
Utrecht, December 2007
Contact person: Jeroen van der SluijsE-mail: [email protected]
Copernicus Institute for Sustainable Development and InnovationDepartment of Science Technology and Society (STS)Heidelberglaan 23584 CS UtrechtThe Netherlands
Phone +31-30-2537631Fax +31-30-2537601

8/2/2019 Uncertainty Communication
http://slidepdf.com/reader/full/uncertainty-communication 3/64
UncertaintyCommunication
Issues and good practice
December 2007version 2.0
Penny Kloprogge, Jeroen van der Sluijs and Arjan Wardekker
Copernicus Institute for Sustainable Development and InnovationUtrecht UniversityThe Netherlands
This document refers to sections of the ‘RIVM/MNP Guidance for UncertaintyAssessment and Communication’ (www.mnp.nl/guidance) The separate publicationsof the Guidance can be downloaded from:- Mini-checklist & Quickscan Questionnaire:
http://www.rivm.nl/bibliotheek/digitaaldepot/Guidance_MC_QS-Q.pdf - Quickscan Hints & Actions List:
http://www.rivm.nl/bibliotheek/digitaaldepot/Guidance_QS-HA.pdf - Detailed Guidance:
http://www.nusap.net/downloads/detailedguidance.pdf - Tool Catalogue for Uncertainty Assessment:
http://www.nusap.net/downloads/toolcatalogue.pdf - Alternative download link for all documents:
http://www.nusap.net/sections.php?op=viewarticle&artid=17

8/2/2019 Uncertainty Communication
http://slidepdf.com/reader/full/uncertainty-communication 4/64
ii

8/2/2019 Uncertainty Communication
http://slidepdf.com/reader/full/uncertainty-communication 5/64
Table of contents
Introduction 3
Part I. Background information on communicating uncertainty 51. Reporting uncertainty in a gradual and custom-made form 62. The reader’s perspective 7
2.1 Access to report/document 82.2 Chapters/sections/sentences paid attention to 82.3 Processing of uncertainty information 102.4 Interpretation of uncertainty information 112.5 Use of uncertainty information 132.6 The writers’ influence on the audiences’ handling of
uncertainty information 143. Criteria for uncertainty communication 15
Part II. Analysis of context and audiences, and customising the
communication accordingly 161 Context of Communication of Uncertainty 172. The target audiences 18
2.1 Who are the Target Audiences? 18
2.2 Information Needs of the Target Audiences 182.2.1 The client/customer 182.2.2 Other target audiences 192.3 Anticipating impacts on target audiences 20
3. Restructuring the (Uncertainty) Information 223.1 Uncertainty Information Collected 223.2 Identifying Policy-Relevant Aspects of Uncertainty 233.3 The Main Messages/statements in view of the uncertainties 24
4 Developing a strategy for Progressive Disclosure of Information 254.1 Filling in the PDI table 254.2 Internal coordination using the PDI table 28
Part III. Practical suggestions on reporting uncertainty information
1. Reporting uncertainty information – What and how 311.1 Context of and insight in the assessment 311.2 Main message in which uncertainties are reflected or takeninto account. 331.3 Reporting orts and types of uncertainties 34
1.4 How uncertainty was dealt with in the analysis 38
1
8/2/2019 Uncertainty Communication
http://slidepdf.com/reader/full/uncertainty-communication 6/64
1.5 Implications of uncertainties 391.6 What can be done about uncertainties 411.7 Educational information on uncertainty 41
2. Reporting uncertainty information – Forms of presentation 42
2.1 Verbal expressions of uncertainty information 422.2 Numeric expressions of uncertainty information 462.3 Graphical expressions of uncertainty information 492.4 Combinations for expressing uncertainty information 54
References 55
Acknowledgements 60
2

8/2/2019 Uncertainty Communication
http://slidepdf.com/reader/full/uncertainty-communication 7/64
Introduction
In 2003 the Netherlands Environmental Assessment Agency (MNP) published theRIVM/MNP Guidance for Uncertainty Assessment and Communication. TheGuidance assists in dealing with uncertainty in environmental assessments. Dealingwith uncertainty is essential because assessment results regarding complexenvironmental issues are of limited value if the uncertainties have not been taken intoaccount adequately. A careful analysis of uncertainties in an environmentalassessment is required, but even more important is the effective communication of these uncertainties in the presentation of assessment results. The Guidance yields richand differentiated insights in uncertainty, but the relevance of this uncertaintyinformation may vary across audiences and uses of assessment results. Therefore, thereporting of uncertainties is one of the six key issues that is addressed in theGuidance. In practice, users of the Guidance felt a need for more practical assistancein the reporting of uncertainty information. This report explores the issue of
uncertainty communication in more detail, and contains more detailed guidance on thecommunication of uncertainty. In order to make this a ‘stand alone’ document severalquestions that are mentioned in the detailed Guidance have been repeated here. Thisdocument thus has some overlap with the detailed Guidance.
Scope
This report offers background information on uncertainty communication, andcontains suggestions and guidance on how to communicate uncertainties inenvironmental assessment reports to several target audiences in an adequate, clear,and systematic way. It is not claimed that this is the only way or the best way tocommunicate uncertainty information, but the guidance in this report draws upon
insights from the literature, insights from an international expert workshop onuncertainty communication (Wardekker and Van der Sluijs, 2005), and severaluncertainty communication experiments in the Utrecht Policy Laboratory (Kloproggeand Van der Sluijs, 2006a, 2006b; Wardekker and Van der Sluijs, 2006a, 2006b).
The report contains three parts. Part I gives a general introduction to the issue of communicating uncertainty information. It offers guidelines for (fine)tuning thecommunication to the intended audiences and context of a report, discusses howreaders of a report tend to handle uncertainty information, and ends with a list of criteria that uncertainty communication needs to meet to increase its effectiveness.Part II helps writers to analyze the context in which communication takes place, and
helps to map the audiences, and their information needs. It further helps to reflectupon anticipated uses and possible impacts of the uncertainty information on the
policy debates. Finally, in part II assistance is offered in customising the (uncertainty)information of an assessment for communication and reporting purposes. Part IIIcontains practical information on how to communicate uncertainties. It addressesaspects of uncertainty that might be important in a specific situation, do's and don'ts,
pitfalls to be avoided, and hints on how to communicate this uncertainty information.
The report focuses mainly on uncertainty communication in written material(especially reports), since the major part of the RIVM/MNP communication takes
place by means of reports. For scientific audiences there are reasonably well-
established protocols for communicating uncertainty. Therefore, this report mainly
3

8/2/2019 Uncertainty Communication
http://slidepdf.com/reader/full/uncertainty-communication 8/64
focuses on written communication towards non-technical audiences. Since policymakers are the primary target audience of RIVM/MNP publications, special attentionis given to this audience.
Using the reportThe difficulty with developing generic guidelines for communicating uncertainty isthat each situation is unique: there is a particular topic; there are particular uncertainties, there is a particular political/societal context concerning the topic, thereare particular intended audiences, etcetera. It is not possible to sketch every possiblesituation and to offer the writers custom-made guidance on how to communicateuncertainties in that particular situation. However, the basic insights offered in part I,together with the results of the analysis done in part II, will help the writer indetermining which items of the practical information in part III are relevant in his or her specific situation.
The report uses cross-references. These will be presented in the text as (part; section;question) (question is optional). For example, ‘II; 3.2;1’ means: see part II, section3.2, question number 1.
A concise version of this guidance report is available separately in Dutch (‘StijlgidsOnzekerheidsommunicatie’) and English (‘Styleguide for UncertaintyCommunication’). The Syleguide is a supplement to the RIVM/MNP Guidance for Uncertainty Assessment and Communication. For a glossary, we refer to the detailedguidance of the RIVM/MNP Guidance for Uncertainty Assessment andCommunication or to www.nusap.net.
4

8/2/2019 Uncertainty Communication
http://slidepdf.com/reader/full/uncertainty-communication 9/64
Part I
Background information oncommunicating uncertainty
5

8/2/2019 Uncertainty Communication
http://slidepdf.com/reader/full/uncertainty-communication 10/64
I. Background information on communicatinguncertainty
This first part of this report summarizes some basic insights in the communication of
uncertainty information. The first section addresses the various roles that the reportingof uncertainty may have. Using the concept of ‘progressive disclosure of information’,guidelines are provided for adjusting the communication of uncertainty information tothe intended audiences and the context of the report at hand. The second section
provides an overview of how uncertainty information is handled by readers of areport. The insights of these two sections lead to a list of criteria for thecommunication of uncertainty information, which is presented in the third section.
1. Reporting uncertainty in a gradual and custom-
made formCentral in this report is the idea of ‘progressive disclosure of information’. GuimarãesPereira and Corral Quintana (2002; p. 104) define progressive disclosure of information (PDI) as follows:
Progressive Disclosure of Information 'entails implementation of several
layers of information to be progressively disclosed from non-technical information through more specialised information, according to the needs of the user’.
Through the use of PDI when reporting uncertainty, the uncertainty information isoffered gradually without overwhelming the reader with all possible information onuncertainty. It also offers the readers the possibility to ‘zoom in’ according to their own information needs and look for more detailed information if desired.
Although the concept of PDI originates from the design of ICT decision tools andinformation systems, the PDI concept can fruitfully be applied to the ways in whichthe MNP and the RIVM communicate assessment results. For a specific topic themost ‘outer’ PDI layer may be a press release (or even one step further, a one-liner for the eight o'clock television news), the summary of an assessment report can be viewed
as the next PDI layer in line, followed by a layer consisting of the chapters in theassessment report dealing with the topic. Finally, a footnote in a technical appendix of a detailed background report on the topic may be the most inner PDI layer where onecan report uncertainty information.
The outer PDI layers of MNP/RIVM publications are generally directed towards non-scientific audiences and are intended for policy advice. The inner PDI layers aregenerally intended for scientific audiences and contain a detailed account of theapproach and results of the assessment for scientific purposes. Although it seemsobvious to state that policy-critical uncertainty information should not be hidden in afootnote of a technical appendix of a background report, studies into the dynamics of
risk controversies have shown many examples where such footnotes, once discovered
6

8/2/2019 Uncertainty Communication
http://slidepdf.com/reader/full/uncertainty-communication 11/64
and exposed became the dynamite that destroyed the credibility and acceptance of risk assessment studies. On the other extreme, technical details on uncertainty informationthat have no policy relevance, should not be presented in the one-liner for the eighto'clock news, but may be highly interesting for colleague researchers.
Because of the differences in purpose and audiences of different PDI layers, the roleof reporting uncertainty is different for inner and outer PDI layers. In outer PDI layersthe main purpose of the reported uncertainties is to put the assessment results and
policy advice in context. In inner PDI layers providing a scientific account of theapproach and results of the environmental assessment is the main purpose of reportinguncertainty. When making use of the concept of PDI in uncertainty communication,the contents, the style and degree of detail of the reported uncertainties are adjusted tothe PDI layer. Some general guidelines are shown in Table 1.
Outer PDI layers Inner PDI layers
Contents Uncertainties can be integrated
in the message (implicit in thewording used, such as using theword "may" or "might")
Uncertainties mentioned separately
and explicitly
Uncertainties as essentialcontextual information on theassessment results
Uncertainties as part of scientificaccounting on the approach used inthe study and on the assessmentresults
Uncertainties translated to the political and societal context
Account of the ‘bare’ uncertaintiesfrom a scientific point of view
Emphasis on policy relevance of
uncertainties
Balanced account of uncertainties in
all parts of the assessmentEmphasis on implications of uncertainties
Emphasis on nature, extent andsources of uncertainties
Implications of uncertainties for the assessment results and the
policy advice given
Implications of uncertainties for representativeness of a study, valueof the results, and further research
Style Scientific information translatedinto ‘common language’
Scientific information with a hightechnical sophistication
Use of jargon to be avoided Use of jargon allowed Degree of detail
Details only if considered policyrelevant
Highly detailed (each layer offersmore detailed information than the
previous PDI layer)Table 1: General guidelines on the contents, style and degree of detail of reported uncertaintyinformation at different PDI layers
2. The reader’s perspective
As mentioned in the introduction in this report we mainly focus on communicatinguncertainty to non-scientific audiences. In this section we analyze how uncertaintyinformation in a specific report or document is handled by these audiences.
7

8/2/2019 Uncertainty Communication
http://slidepdf.com/reader/full/uncertainty-communication 12/64
When communicating uncertainty regarding an environmental assessment, it isimportant to realize that the reported uncertainties will become part of an entire
process of information handling by the reader. With an emphasis on uncertaintyinformation, the following steps can be distinguished in this process (figure 1):
access toreport/document
chapters/sections/sentences paidattention to
interpretationof uncertaintyinformation
use of uncertaintyinformation
processing of uncertaintyinformation
Figure 1: the handling of uncertainty information of assessment reports by non-scientific readers
These aspects of the information handling process are discussed below in more detail(sections 2.1 to 2.5). In section 2.6 the writers’ influence on the audiences’ handlingof uncertainty information is discussed.
2.1 Access to report/document
In current society where Internet services are widely available, access to reports anddocuments are not likely to be a problem, if they can be downloaded from theMNP/RIVM website. However, in order for the reader to obtain the report he has to
be informed of the existence of the report and any background documents.
In short:- audiences have to know about the existence of a report and any
background documents;
- audiences need to have access to the report and any background documents.
2.2 Chapters/sections/sentences paid attention to
Readers spend limited time on reading a report on a specific topic. Generally, there isa lot of written information on other topics as well that compete for the readers’attention and in case of professional readers (that is: readers who read a specific reportfor occupational reasons) there is also an enormous amount of other reports anddocuments on the topic at hand that compete for the readers’ attention. Neutelings
(1997) found that members of parliament on average read only one quarter of a policytext. Vaessen (forthcoming) even found that policy makers read only 9% of policyreports. Since in this study the policy makers were requested to read a report theywere required to read for their work (instead of begin able to choose a report as in
Neutelings’ study), the time for the report was limited and interruptions such as phonecalls were taken into account, this percentage seems more in accordance with reality.Reports can basically be divided into a ‘primary’ or ‘prominent layer’ and a‘secondary’ or ‘background layer’ (Vaessen and Elling, 2000). The primary layer usually contains the summary, introduction, and conclusion and recommendationchapter. Also chapters that contain essential answers regarding the questionsaddressed in the report can be considered part of this layer. Depending on what
questions the reader is interested in, different chapters can be considered to hold
8
8/2/2019 Uncertainty Communication
http://slidepdf.com/reader/full/uncertainty-communication 13/64
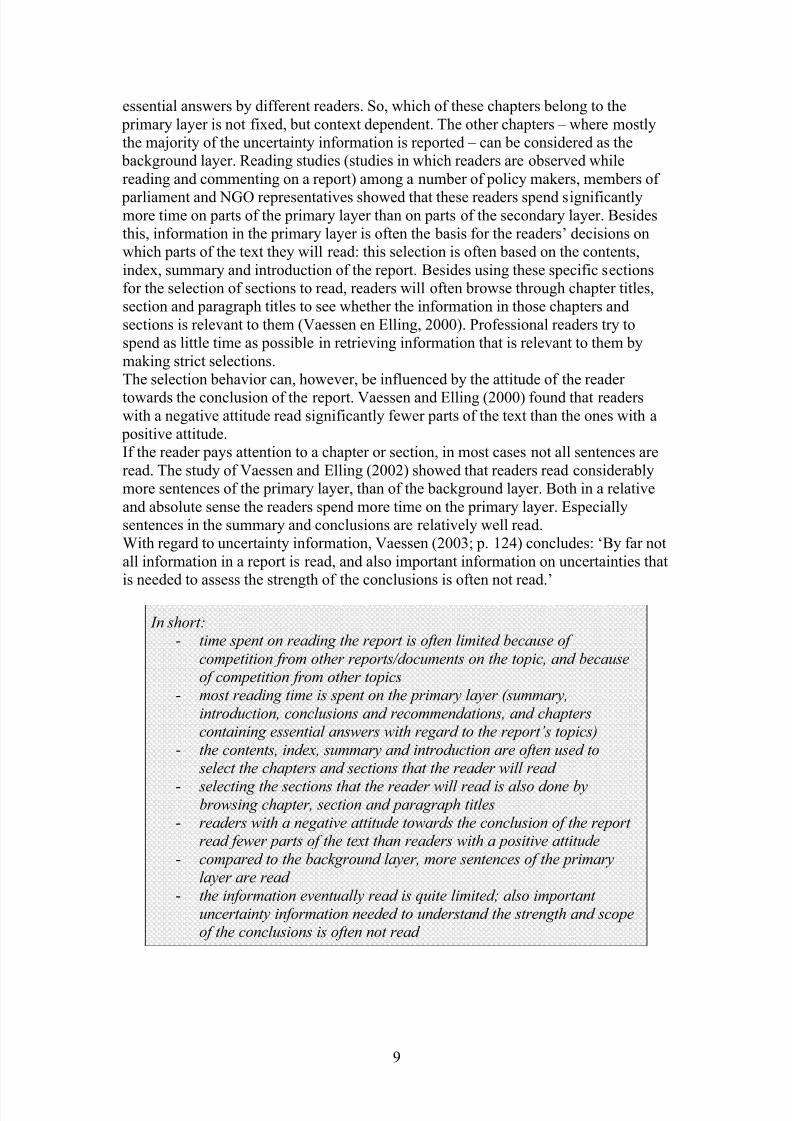
essential answers by different readers. So, which of these chapters belong to the primary layer is not fixed, but context dependent. The other chapters – where mostlythe majority of the uncertainty information is reported – can be considered as the
background layer. Reading studies (studies in which readers are observed whilereading and commenting on a report) among a number of policy makers, members of
parliament and NGO representatives showed that these readers spend significantlymore time on parts of the primary layer than on parts of the secondary layer. Besidesthis, information in the primary layer is often the basis for the readers’ decisions onwhich parts of the text they will read: this selection is often based on the contents,index, summary and introduction of the report. Besides using these specific sectionsfor the selection of sections to read, readers will often browse through chapter titles,section and paragraph titles to see whether the information in those chapters andsections is relevant to them (Vaessen en Elling, 2000). Professional readers try tospend as little time as possible in retrieving information that is relevant to them bymaking strict selections.The selection behavior can, however, be influenced by the attitude of the reader
towards the conclusion of the report. Vaessen and Elling (2000) found that readerswith a negative attitude read significantly fewer parts of the text than the ones with a
positive attitude.If the reader pays attention to a chapter or section, in most cases not all sentences areread. The study of Vaessen and Elling (2002) showed that readers read considerablymore sentences of the primary layer, than of the background layer. Both in a relativeand absolute sense the readers spend more time on the primary layer. Especiallysentences in the summary and conclusions are relatively well read.With regard to uncertainty information, Vaessen (2003; p. 124) concludes: ‘By far notall information in a report is read, and also important information on uncertainties thatis needed to assess the strength of the conclusions is often not read.’
In short:- time spent on reading the report is often limited because of
competition from other reports/documents on the topic, and becauseof competition from other topics
- most reading time is spent on the primary layer (summary,
introduction, conclusions and recommendations, and chapterscontaining essential answers with regard to the report’s topics)
- the contents, index, summary and introduction are often used to select the chapters and sections that the reader will read
- selecting the sections that the reader will read is also done bybrowsing chapter, section and paragraph titles
- readers with a negative attitude towards the conclusion of the report read fewer parts of the text than readers with a positive attitude
- compared to the background layer, more sentences of the primarylayer are read
- the information eventually read is quite limited; also important uncertainty information needed to understand the strength and scopeof the conclusions is often not read
9

8/2/2019 Uncertainty Communication
http://slidepdf.com/reader/full/uncertainty-communication 14/64
2.3 Processing of uncertainty information
People tend to select and interpret information in order to support their existingworldview. This is known as ‘confirmation bias’, ‘belief perseverance’ or ‘selective
perception’ (Poortinga and Pidgeon, 2004; Vaessen, 2003). Whether or not the mainconclusion of a report is in line with the readers’ views may therefore influence the
processing of (uncertainty) information.
Readers with a positive attitude towards the conclusion of a report tend the read moresections of a report than readers with a negative attitude (Vaessen and Elling, 2002).A reader with a positive attitude may, however, be less open to uncertaintyinformation, as this weakens the conclusion that is in line with his views. He may
process it in a fast and frugal way or skip it (Vaessen, 2003).
If the reader has a negative attitude towards the conclusion of the report, he may feel
that the report is not worthwhile putting a lot of effort into (Vaessen and Elling,2002). He will spend little time reading it, and will come across little (uncertainty)information. However, a reader with a negative attitude may also do the opposite: hethen searches for information in the report that does support his views (Vaessen,2003). He will use prior knowledge and analytical thinking to look for arguments thatundermine the – in his view – incorrect approach and conclusions of the report. In thiscase, he will be interested in uncertainty information that undermines the mainconclusion.
In discourses on highly controversial risks with high decision stakes, looking for information that undermines the main conclusion can take the form of ‘stretched peer
review on unwelcome results’ (Myhr and Traavik, 2003; Myhr, 2005, Van der Sluijs,2007). Some readers actively search for weak points in a study in order to use that toattack unwelcome conclusions and undermine the credibility of the authors. For instance, analyzing controversies on risks of Genetically Modified Organisms Myhr found that scientists that publish preliminary findings indicating the possibility of serious harm by GMOs are aggressively jumped upon by a powerful network of scientists from the pro-GMO lobby that heavily criticize and actively discredit thescientists that bring the message that potentially constitutes an early warning of risk.This takes the form of attacks on the scientists’ credibility via newspapers and other fora. This phenomenon stretches the peer review process of healthy critical debate
beyond the scientific journals and scientific communities and into an area of an
unhealthy war against the whistleblowers through personal attacks in the public- and policy arenas. This may cause that scientists refrain from publishing preliminaryresearch findings that may constitute an early warning, which is an undesirabledevelopment seen from the viewpoint of precautionary risk governance. Similar
phenomena were reported on health risks of tobacco smoke (Michaels, 2005) andecological risks of systemic pesticides (Maxim et al., 2007).
Note that the attitude towards the conclusion of a report will strongly depend onwhether the author or the institute that produced the report is trusted by the reader.Social robustness of knowledge claims (Nowotny, 1999, Nowotny et al, 2001), trust,and perceived uncertainty are closely linked.
10

8/2/2019 Uncertainty Communication
http://slidepdf.com/reader/full/uncertainty-communication 15/64
In short:- People tend to look for information that is in line with their existing
world views- Readers with a negative attitude towards the conclusions of the
report may spend little time reading it since it does not support their views or they specifically look for uncertainty information that does
support their views. In discourses on highly controversial risks with
high decision stakes this can take the form of stretched peer review of unwelcome results.
- readers with a positive attitude towards the conclusions of the report may be less open to uncertainty information, since this information isnot in line with their views. They may process it in a fast and frugal
way or skip it.
2.4 Interpretation of uncertainty information
When uncertainty information is read, the ideal situation would be that every reader would interpret the uncertainty information in the same way as the writer hasintended. However, interpreting uncertainties is – even for policy makers –difficult.The reader’s level of knowledge may be insufficient to interpret the informationcorrectly: for instance, the reader may not be familiar with Probability DensityFunctions (PDFs) or probabilities and therefore cannot interpret the uncertaintyinformation presented by a PDF or a Cumulative Density Function (CDF) correctly.The level of understanding may also be a bottleneck: an example is a reader who doesnot understand a PDF, even though an explanation is being provided. Also,interpretations may be biased, and interpretation differences between individuals mayoccur.
Especially uncertainty information concerning probabilities is prone to biases, as theconcepts themselves are not easy to understand fully (Van de Vusse (ed), 1993,Slovic, 1987, Cosmides and Tooby, 1996, Brase et al. 1998, Rode et al., 1999,Hoffrage et al. 2000, Gigerenzer, 2002,2003). This is because in such a highlyartefactual situation, ordinary intuition is not a reliable guide to an estimated answer.The human mind also has problems with correctly combining probabilities. For
example, suppose that 2% of a population has a given disease and a test to this disease performs such that anyone with the disease will test positive (there are no "falsenegatives"), while 90% of those without the disease will test negative. If people areasked to estimate the chance that a person with a positive test result actually has thedisease, estimated chances seriously overestimate the probability that follows frommathematical logic (16.9 % in this example). This is because people put too muchweight on the higher percentage, the reliability of the test, and not enough to the small
prevalence of the disease baseline probability and the false positives (Department of Health (UK), 1997).This tendency to forget the baseline probability also results in a problem when risksare framed in different ways. The perceived message of communication on a risk
depends critically on whether risks are given in absolute terms (chance was 2% and is
11

8/2/2019 Uncertainty Communication
http://slidepdf.com/reader/full/uncertainty-communication 16/64
now 4%) or in relative terms (the chance has doubled). The relative expression soundsmore alarming and newsworthy, but it can be seriously misleading if the baseline risk is not made clear (Department of Health (UK), 1997).Another problem is that the brain tends to manipulate probabilities, to employsimplified ways of managing information (heuristics), in order to reduce difficult
mental tasks. Although they are valid and useful in most situations, they can lead tolarge and persistent biases with serious implications (Department of Health (UK),1997; Slovic et al., 1981). The most relevant heuristics and biases are availability,confirmation bias, and overconfidence effect/bias (Kahneman et al., 1982):Due to the availability heuristic, people judge an event as likely or frequent if
instances of it are easily brought to mind. While this is often appropriate, becausefrequently occurring events are generally easier to imagine than rare events,availability is also affected by numerous factors unrelated to frequency of occurrence. Memorable events, a recent disaster, or even vivid films can increaseimaginability and therefore seriously bias judgments. An example of this is that
people tend to overestimate rare causes of death and underestimate common
causes of death. Rare causes are often dramatic or sensational, while commoncauses tend to be unspectacular. People’s personal experiences can also bias viewsdue to the availability heuristic: people take risks time after time without mishapand therefore often consider themselves personally immune. Moreover, indirectexperience through the media shows that when accidents happen, they happen toothers. A particular important implication of availability is that discussing risk may increase its imaginability and therefore its perceived riskiness, regardless of what the evidence indicates. This would explain the fact that the amount of mediacoverage enhances perceived riskiness.
The confirmation bias results in a situation where, once a view has been formed,new evidence is generally made to fit. Strong initial impressions structure the waythat subsequent information is interpreted. New evidence will appear reliable andinformative if it is consistent with one’s initial belief and it is seen as “proof
positive”. Contrary evidence may be seen as unreliable, erroneous, or unrepresentative, and therefore filtered out. Ambiguous data may be interpreted asa confirmation. As a result, strongly held views will be extraordinarily difficult tochange by informational presentations. One’s own actions can also make theseexpectations self-fulfilling.
The overconfidence effect/bias implies that people typically have too muchconfidence in their own judgments. This appears to affect almost all professions aswell as the lay public. The few exceptions are people who receive constant
feedback on the accuracy of their predictions, such as weather forecasters. The psychological basis for this unwarranted certainty seems to be insensitivity to theweaknesses in assumptions upon which judgments are based. (Slovic et al., 1981;Slovic et al., 1984, Department of Health (UK), 1997, Wardekker, 2004).
In contrast, Cosmides and Tooby (1996) argue that a large part of these biases are dueto the way in which probability information is offered to people, and they illustratethat a more frequentist-based presentation greatly improves the human performance of
probabilistic reasoning, causing various cognitive biases to disappear. See also Braseet al. 1998, Rode et al., 1999, Hoffrage et al. 2000, Gigerenzer, 2002, 2003,Gigerenzer et al. 2005, Krämer and Gigerenzer, 2005.
12
8/2/2019 Uncertainty Communication
http://slidepdf.com/reader/full/uncertainty-communication 17/64
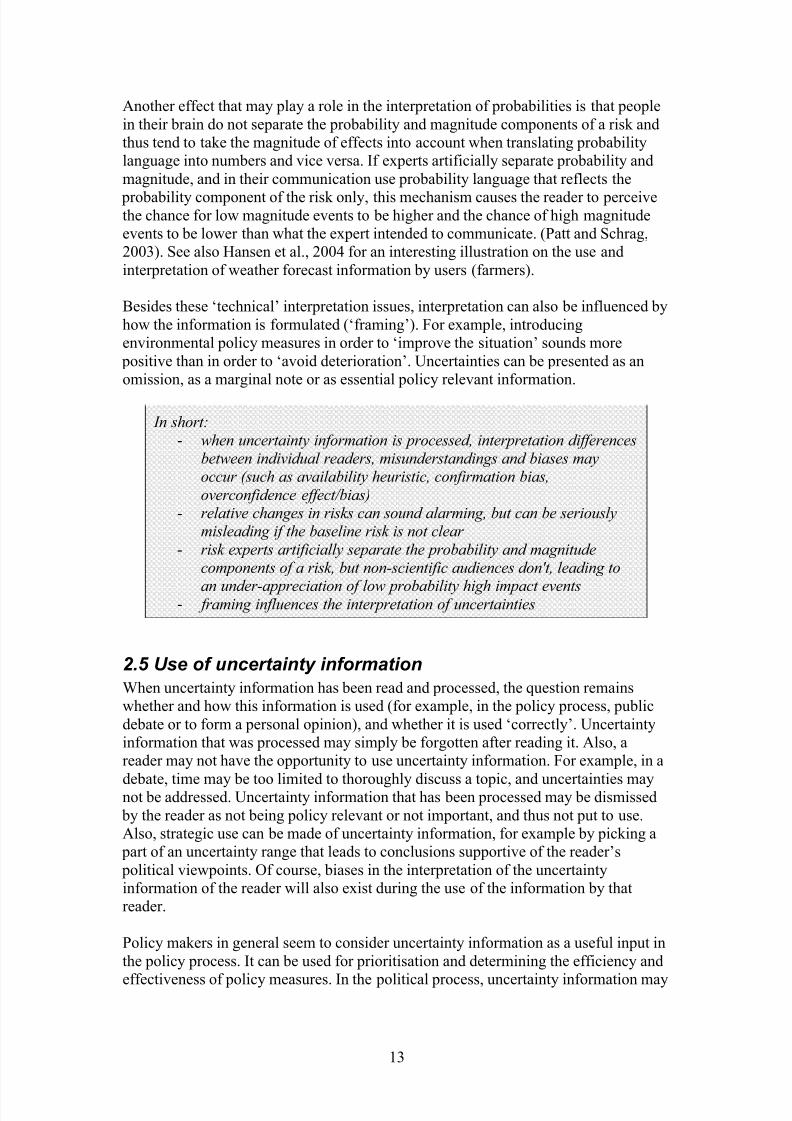
Another effect that may play a role in the interpretation of probabilities is that peoplein their brain do not separate the probability and magnitude components of a risk andthus tend to take the magnitude of effects into account when translating probabilitylanguage into numbers and vice versa. If experts artificially separate probability andmagnitude, and in their communication use probability language that reflects the
probability component of the risk only, this mechanism causes the reader to perceivethe chance for low magnitude events to be higher and the chance of high magnitudeevents to be lower than what the expert intended to communicate. (Patt and Schrag,2003). See also Hansen et al., 2004 for an interesting illustration on the use andinterpretation of weather forecast information by users (farmers).
Besides these ‘technical’ interpretation issues, interpretation can also be influenced byhow the information is formulated (‘framing’). For example, introducingenvironmental policy measures in order to ‘improve the situation’ sounds more
positive than in order to ‘avoid deterioration’. Uncertainties can be presented as anomission, as a marginal note or as essential policy relevant information.
In short:- when uncertainty information is processed, interpretation differences
between individual readers, misunderstandings and biases mayoccur (such as availability heuristic, confirmation bias,
overconfidence effect/bias)- relative changes in risks can sound alarming, but can be seriously
misleading if the baseline risk is not clear
- risk experts artificially separate the probability and magnitudecomponents of a risk, but non-scientific audiences don't, leading to
an under-appreciation of low probability high impact events- framing influences the interpretation of uncertainties
2.5 Use of uncertainty information
When uncertainty information has been read and processed, the question remainswhether and how this information is used (for example, in the policy process, publicdebate or to form a personal opinion), and whether it is used ‘correctly’. Uncertaintyinformation that was processed may simply be forgotten after reading it. Also, areader may not have the opportunity to use uncertainty information. For example, in a
debate, time may be too limited to thoroughly discuss a topic, and uncertainties maynot be addressed. Uncertainty information that has been processed may be dismissed by the reader as not being policy relevant or not important, and thus not put to use.Also, strategic use can be made of uncertainty information, for example by picking a
part of an uncertainty range that leads to conclusions supportive of the reader’s political viewpoints. Of course, biases in the interpretation of the uncertaintyinformation of the reader will also exist during the use of the information by thatreader.
Policy makers in general seem to consider uncertainty information as a useful input inthe policy process. It can be used for prioritisation and determining the efficiency and
effectiveness of policy measures. In the political process, uncertainty information may
13

8/2/2019 Uncertainty Communication
http://slidepdf.com/reader/full/uncertainty-communication 18/64
also be used as a form of hedging, as interest in uncertainty information seems to belimited until problems arise. According to a limited enquiry of policy makers(Wardekker and Van der Sluijs, 2006a), they think that too much emphasis onuncertainty can however give rise to unnecessary discussion, and that thereforeuncertainty information needs to be as limited and policy relevant as possible.
The usefulness and relevance of uncertainty information on a specific issue willhighly depend on the position of the issue in the policy cycle. For example, during the
phase of problem formulation and framing, there will often be a need for uncertaintyinformation on e.g. the (potential) effects and magnitude of these effects. Later stagesof the policy cycle call for uncertainty information on e.g. causes, and once policymeasures are being taken, on the question of whether policy targets are being met.Information that is relevant to other (previous or later) stages of the policy cycle doesnot necessarily become irrelevant for the current stage. Especially when issues aretopical, controversial or relatively new, uncertainties in the problem formulation andframing will stay relevant even in later stages of the cycle. (Wardekker and Van der Sluijs, 2006a).
Finally, the use of the information also depends on the organisational level: policymakers at the national level may have different needs than those at regional and locallevels (Wardekker and Van der Sluijs, 2006a).
In short:- uncertainty information may be forgotten before it is used - the reader may not have the opportunity to use uncertainty
information (for example, because there is not time in a debate for
addressing uncertainties)- uncertainty information may be dismissed because it is not
considered policy relevant or considered unimportant - strategic use may be made of uncertainty information- for policy makers the usefulness of uncertainty information is related
to the position in the policy cycle of the problem at hand - the use of uncertainty information by policy makers partly depends
on the organisational level of the policy makers(local/regional/national)
2.6 The writers’ influence on the audiences’ handling of uncertainty information
The writers of MNP or RIVM reports cannot determine and control whichinformation is read by the target audiences, how it is processed, how it is interpreted,or how it is used. However, the locations where uncertainty information is presentedcan be carefully chosen, and a clear and consistent way of describing the uncertaintieswill be beneficial to a correct interpretation of this information by the audiences.Further, by specifically giving attention to policy relevant uncertainties, and bydiscussing the possible policy-implications of these uncertainties, the uncertaintyinformation becomes meaningful to the policy process into which it feeds, and usefulfor the audiences.
14

8/2/2019 Uncertainty Communication
http://slidepdf.com/reader/full/uncertainty-communication 19/64
3. Criteria for uncertainty communication
From the previous sections the following general good-practice criteria for adequateuncertainty communication can be deduced that ideally should be met:
1. uncertainty communication deals with information on uncertainty that isrequired by good scientific practice and that readers and users need to be
aware of 2. the audiences should have access to the uncertainty information, and know
where to find (more detailed) uncertainty information3. The uncertainty information offered should be consistent (across different
reports, different issues, different authors, et cetera).4. essential uncertainty information should be located in sections of the report
that are most likely to be read by the audiences
5. the information on uncertainty is clear to the readerso
minimise misinterpretationo minimise bias
o minimise differences in interpretation between individuals6. the information on uncertainty is not too difficult to process by the readers
o not too much effort and time required to understand the method of representation
o not too much effort and time required to retrieve the information
itself 7. uncertainty communication meets the information needs of the target
audiences, and therefore is context dependent and customised to the
audiences
8. the overall message (that is: knowledge claims and uncertainty information) isuseful to the audiences for making policy decisions and/or for use in
political/societal debates and/or for forming personal opinions (for assessments for policy advice)
9. the overall message (that is: knowledge claims and uncertainty information) iscredible to the readers (well underpinned and unbiased)
15

8/2/2019 Uncertainty Communication
http://slidepdf.com/reader/full/uncertainty-communication 20/64
Part II
Analysis of context and audiences,and customising the communication
accordingly
16

8/2/2019 Uncertainty Communication
http://slidepdf.com/reader/full/uncertainty-communication 21/64
II. Analysis of context and audiences, andcustomising the communication accordingly
This part of the report helps to explore the context and audiences of communication of
uncertainty information (sections 1 and 2). Next, section 3 assists in restructuring themain findings of the environmental assessment and the uncertainty information for the purpose of communicating this information in the varying PDI layers. Whatinformation to communicate in what PDI layer is explored in section 4.
Together with the basic insights presented in part I of this report, this analysis servesas a preparation for part III (Practical suggestions on reporting uncertaintyinformation) by enabling writers to make a well argued choice regarding which issuesare relevant in the situation at hand.
1 Context of Communication of Uncertainty
To get a clear picture of the context of communication of uncertainty as a starting point for a communication strategy, the following diagnostic questions can help:
1. What is the role of the analysis/assessment that is being reported? Check all thatapply:
Ad hoc policy advice To evaluate existing policy To evaluate proposed policy To foster recognition of new problems To identify and/or evaluate possible solutions To provide counter-expertise To provide background information on earlier communications by the MNP To report new scientific insights/methods Tt forms part of a much broader assessment Other (specify)
2. What contextual factors add to the need for communicating uncertainty?Check all that apply:
To serve a political purpose To conform to good scientific practice (for scientific purposes)
Practice of the institution that carries out the environmental assessment Required by legislation Requested by stakeholders involved in the process Other (specify)
3. What PDI layers can be distinguished? Check all that apply: Press release Presentation for specific target audiences Background article for the website Summary Conclusions and recommendations
Summaries of the chapters
17

8/2/2019 Uncertainty Communication
http://slidepdf.com/reader/full/uncertainty-communication 22/64
Chapters Appendices Background report (again with a summary, conclusion, etc.) Scientific articles Other (specify) .....
4. What other contextual issues are relevant to consider in the design of a strategyregarding what uncertainty information to communicate how?
2. The target audiencesA next step is to make a well argued choice regarding what audiences one needs toaddress when communicating uncertainty information and what specific informationneeds and contexts of use are relevant for each of these audiences.
2.1 Who are the Target Audiences?
A distinction can be made between ‘primary target audiences’ for which thecommunication/report is specifically intended and ‘secondary target audiences’ whichcan be described as ‘others who may have an interest in the subject matter’. Primarytarget audiences for the MNP and the RIVM are often (national) policy makers and
politicians who use the assessment results to design new policies and to evaluateexisting policies. Of course, the client/customer of the assessment is part of the
primary target audience. Secondary target audiences may correspond to the other stakeholders identified for the problems of concern. It might not correspond to the
whole set of stakeholders but it is surely a subset of those.
1. Who are the primary target audiences (including client/customer)? (list according toyour stakeholder list; see section 2.1 of the detailed Guidance)
2. Who are the secondary target audiences? (list according to your stakeholder list; seesection 2.1 of the detailed Guidance)
2.2 Information Needs of the Target Audiences
In this section the information needs of the client/customer of the environmentalassessment are addressed, and the information needs of other audiences are addressed.
2.2.1 The client/customer
In section 2.3.1 of the detailed Guidance the issue of ‘discussing uncertainty in theenvironmental assessment with the client/customer’ was addressed. Because this isdirectly related to the information needs of the client with respect to uncertainty, thequestions posed in that section are repeated here.
1. What are the client’s minimal requirements with respect to uncertainty
management? Check all that apply:
18

8/2/2019 Uncertainty Communication
http://slidepdf.com/reader/full/uncertainty-communication 23/64
Uncertainty is not an issue The robustness of the conclusions with respect to uncertainty should be
assessed Uncertainty in the major outcomes should be indicated The major causes of the uncertainty should be determined The implications of uncertainty for the policy issue at hand should be
indicated Other (specify) ....
2. What form of uncertainty information is requested by the client in this uncertaintyassessment?
Qualitative information Quantitative information
3. Explain why this is the (minimal) requirement with respect to uncertaintymanagement.
4. Describe any further requirements by the client about the form in which uncertaintyshould be presented.
2.2.2 Other target audiences
1. If members of the target audiences have been involved during the assessment process, what conclusions can you draw from the interaction with them with respect
to their information needs on uncertainty?2. Which questions, problems and tasks can be identified among target audiences?What are the problem frames of the stakeholders (see section 1.1 of the detailedGuidance). What are their likely beliefs, agendas and value positions (see section 2.2of the detailed Guidance)? Based on this, what uncertainties are likely to be of importance to them or interesting to them?
3. Do specific stakeholders want the primary audiences to receive specific uncertaintyinformation? (for example, do policy advisors want policy makers to receive specificinformation?)
4. What is the position of the problem at hand in the policy cycle? Based on this, whatare likely information needs of policy makers regarding uncertainty? (see I; 2.5)
5. Are there any particular information needs regarding uncertainty to be expected by policy makers at different organisational levels (local/regional/national)?
6. Are there, do there seem to be or do you expect to occur, any misunderstandingsamong the audiences regarding the topic at hand?
19

8/2/2019 Uncertainty Communication
http://slidepdf.com/reader/full/uncertainty-communication 24/64
7. How have target audiences reacted to uncertainty information in prior publications?Based on this, is it possible to draw conclusions with regard to their information needson uncertainty?
2.3 Anticipating impacts on target audiences
1. What are the target audiences likely to do with the received uncertaintyinformation? What use (including strategic use) could be made of uncertaintyinformation?
2. Are there any risk related issues in the assessment that relate to fright factors or media triggers (see Box 1 and 2)?
3. In case of assessment results indicating a low risk: are the audiences expected todistrust these results because the public perception is that the risk is serious?
4. Are the audiences likely to distrust the results due to low or fragile confidence inthe researchers or the organisation that performed the assessment?
20

8/2/2019 Uncertainty Communication
http://slidepdf.com/reader/full/uncertainty-communication 25/64
Box 1: Fright Factors
In their ‘pointers to good practice’ for communicating about risks to publichealth the UK Department of Health identified a number of risk characteristicsthat make risks generally more worrying for audiences (Department of HealthUK, 1997).
Risks are generally more worrying (and less acceptable) if perceived:1. to be involuntary (e.g. exposure to pollution) rather than voluntary (e.g.dangerous sports or smoking)2. as inequitably distributed (some benefit while others suffer the consequences)3. as inescapable by taking personal precautions4. to arise from an unfamiliar or novel source5. to result from man-made, rather than natural sources6. to cause hidden and irreversible damage, e.g. through onset of illness many
years after exposure7. to pose some particular danger to small children or pregnant women or moregenerally to future generations
8. to threaten a form of death (or illness/injury) arousing particular dread
9. to damage identifiable rather than anonymous victims
10. to be poorly understood by science
11. as subject to contradictory statements from responsible sources (or, evenworse, from the same source).
Box 2: Media Triggers
In their ‘pointers to good practice’ for communicating about risks to publichealth the UK Department of Health identified a number of characteristics of risks to public health that make it more likely to become a major story in mediacoverage (Department of Health UK, 1997).
A possible risk to public health is more likely to become a major story if the
ollowing are prominent or can readily be made to become so:1. Questions of blame
2. Alleged secrets and attempted "cover-ups"
3. "Human interest" through identifiable heroes, villains, dupes, etc. (as well as
victims)4. Links with existing high-profile issues or personalities
5. Conflict
6. Signal value: the story as a portent of further ills ("What next?")
7. Many people exposed to the risk, even if at low levels ("It could be you!").8. Strong visual impact (e.g. pictures of suffering)9. Links to sex and/or crime
For environmental topics we can add the following media triggers:- Environmental problems where human health is at stake (as opposed to
damage to nature or animals)- If animal suffering is involved: a high ‘pet factor’ of the animals
- To ics in which substantial olitical tensions la a role
21

8/2/2019 Uncertainty Communication
http://slidepdf.com/reader/full/uncertainty-communication 26/64
3. Restructuring the (Uncertainty) Information
Through use of the Guidance and tools from the Toolbox insight in and informationon uncertainty in the environmental assessment is obtained throughout the assessment
process. This section aims to assist in bringing the uncertainty information together and restructure and customise it for communication and reporting purposes. It isanalysed which uncertainties are (policy) relevant for the audiences and how the mainmessages should be presented in view of the uncertainties.
3.1 Uncertainty Information Collected
1. What methods were used to address uncertainty management?Check all that apply (see the Tool Catalogue of the Guidance):
Uncertainty analysis (e.g. statistical analysis) Quality assurance (e.g. NUSAP, Pedigree) Explanatory frameworks (e.g. cultural theory) Other (specify) ....
2. Uncertainty methods can operate in the foreground when applied explicitly to produce information on uncertainty (e.g. written material, graphs), or in the background as when run behind a model and results are embedded in the output (e.g.model outputs, scenarios).Are the methods used primarily:
Background Mixed Foreground
3. Indicate the main uncertainties in the environmental assessment and discuss howthis may influence findings.
- Consider the main statistical uncertainties, scenario uncertainties,ignorance
- Consider the main weaknesses in the knowledge base- Consider what important choices were made with respect to the
Contents of the assessment (including problem framing, selection of indicators, assumptions and points of departure)
- Consider what important methodological choices were made, whichmay have affected the outcomes (including methodological limitationsconcerning the selected method).
4. Indicate the main implications of these uncertainties and discuss how this mayinfluence findings.
- Consider implications for the representativeness of the results andconclusions
- Consider implications for the robustness of the conclusions
22
8/2/2019 Uncertainty Communication
http://slidepdf.com/reader/full/uncertainty-communication 27/64
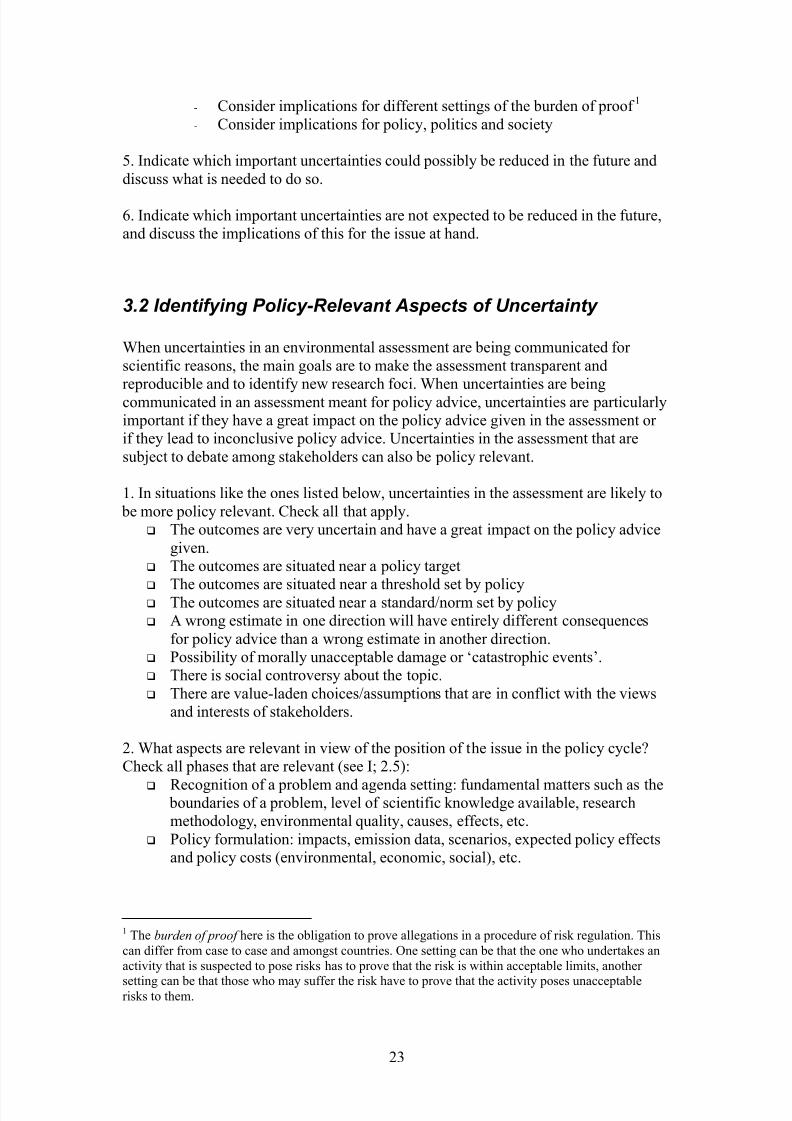
1- Consider implications for different settings of the burden of proof - Consider implications for policy, politics and society
5. Indicate which important uncertainties could possibly be reduced in the future anddiscuss what is needed to do so.
6. Indicate which important uncertainties are not expected to be reduced in the future,and discuss the implications of this for the issue at hand.
3.2 Identifying Policy-Relevant Aspects of Uncertainty
When uncertainties in an environmental assessment are being communicated for scientific reasons, the main goals are to make the assessment transparent andreproducible and to identify new research foci. When uncertainties are beingcommunicated in an assessment meant for policy advice, uncertainties are particularlyimportant if they have a great impact on the policy advice given in the assessment or if they lead to inconclusive policy advice. Uncertainties in the assessment that aresubject to debate among stakeholders can also be policy relevant.
1. In situations like the ones listed below, uncertainties in the assessment are likely to be more policy relevant. Check all that apply.
The outcomes are very uncertain and have a great impact on the policy advicegiven.
The outcomes are situated near a policy target
The outcomes are situated near a threshold set by policy The outcomes are situated near a standard/norm set by policy A wrong estimate in one direction will have entirely different consequences
for policy advice than a wrong estimate in another direction. Possibility of morally unacceptable damage or ‘catastrophic events’. There is social controversy about the topic. There are value-laden choices/assumptions that are in conflict with the views
and interests of stakeholders.
2. What aspects are relevant in view of the position of the issue in the policy cycle?Check all phases that are relevant (see I; 2.5):
Recognition of a problem and agenda setting: fundamental matters such as the boundaries of a problem, level of scientific knowledge available, researchmethodology, environmental quality, causes, effects, etc.
Policy formulation: impacts, emission data, scenarios, expected policy effectsand policy costs (environmental, economic, social), etc.
1 The burden of proof here is the obligation to prove allegations in a procedure of risk regulation. Thiscan differ from case to case and amongst countries. One setting can be that the one who undertakes anactivity that is suspected to pose risks has to prove that the risk is within acceptable limits, another
setting can be that those who may suffer the risk have to prove that the activity poses unacceptablerisks to them.
23

8/2/2019 Uncertainty Communication
http://slidepdf.com/reader/full/uncertainty-communication 28/64
Policy implementation and monitoring: emission data, future projections,environmental quality, the achieved and expected policy effects and policycosts, etc.
Evaluation and adaptation of policy: matters relating to previous phases.
3. What uncertainties have a great impact on the policy advice given in the assessmentor lead to inconclusive policy advice?
4. What uncertainty issues are subject to controversies among stakeholders?
5. What value-laden choices and assumptions made in the environmental assessmentcould be in conflict with stakeholder views and interests?
6. Are there non-scientific uncertainties (legal, moral, societal, institutional, proprietary, situational) that are policy relevant (see section 1.5 of the detailedGuidance)?
7. What uncertainties, assumptions or limitations of methods used do not seem policyrelevant at first sight, but may turn out to be so at the end (for instance, because theycould have a significant (but unquantifiable) influence on the outcomes of theindicator and/or the policy advice eventually given?)
3.3 The Main Messages/statements in view of theuncertainties
In this section the main messages are explored, in view of the uncertainties. There issome overlap with section 3.1. However, in section 3.1 uncertainty is the central issue being explored, whereas here the main messages are the point for departure.
1. Are there any (sub)results of the assessment that you do not want to communicateat this point due to the fact that the study is too preliminary and there are too manyuncertainties to base a policy advice on?
2. Identify the main messages to be conveyed and argue why these are the mainmessages.
3. Which of these main messages are well-founded conclusions and which ones arespeculative or something in between?
4. How should the knowledge claims in the main message be presented/formulated inview of:
- the main statistical uncertainties, scenario uncertainties, ignorance- the main weaknesses in the knowledge base- important choices in the assessment (including problem framing,
selection of indicators, assumptions and points of departure)- important methodological choices (including methodological
limitations of the method chosen).
24

8/2/2019 Uncertainty Communication
http://slidepdf.com/reader/full/uncertainty-communication 29/64
5. What are implications of the uncertainties for the policy process/decision/socialcontext?
6. What are implications of the uncertainties for different risk management strategies?
7. Verify how robust the main messages are in view of the choices made, theassumptions used, the strength of the knowledge base and the uncertainties in data,models, and other knowledge.
4. Developing a strategy for Progressive Disclosure of Information
In order to report uncertainties in an adequate manner several issues have to be taken
into account. It is not simply a matter of presenting a range instead of a singlenumber. In order for the audiences to make sense of the uncertainties, it helps if theyhave some knowledge on the context of the assessment and the assessment itself (thatis, how it was conducted). It is not merely a matter of reporting the uncertaintiesthemselves, but they also need to be properly reflected in the formulation of the mainmessages that are conveyed. Moreover it can be of importance to inform theaudiences on the implications of the uncertainties and what can be done about it. Itwill often be relevant to inform them with insights in how the uncertainties were dealtwith in the assessment and additionally offering them educational information onuncertainties in general.It will definitely depend on the situation at hand (purpose of the report, which
audiences, etcetera) to what degree these aspects need to be addressed in the reporting phase. In order to provide audiences with uncertainty information in a gradual andtiered fashion, customised to their information needs, we use the strategy of Progressive Disclosure of Information (PDI; see section 1 of part I of this report). Inthis section a table is constructed indicating which uncertainties need attention in whatPDI layers.
4.1 Filling in the PDI table
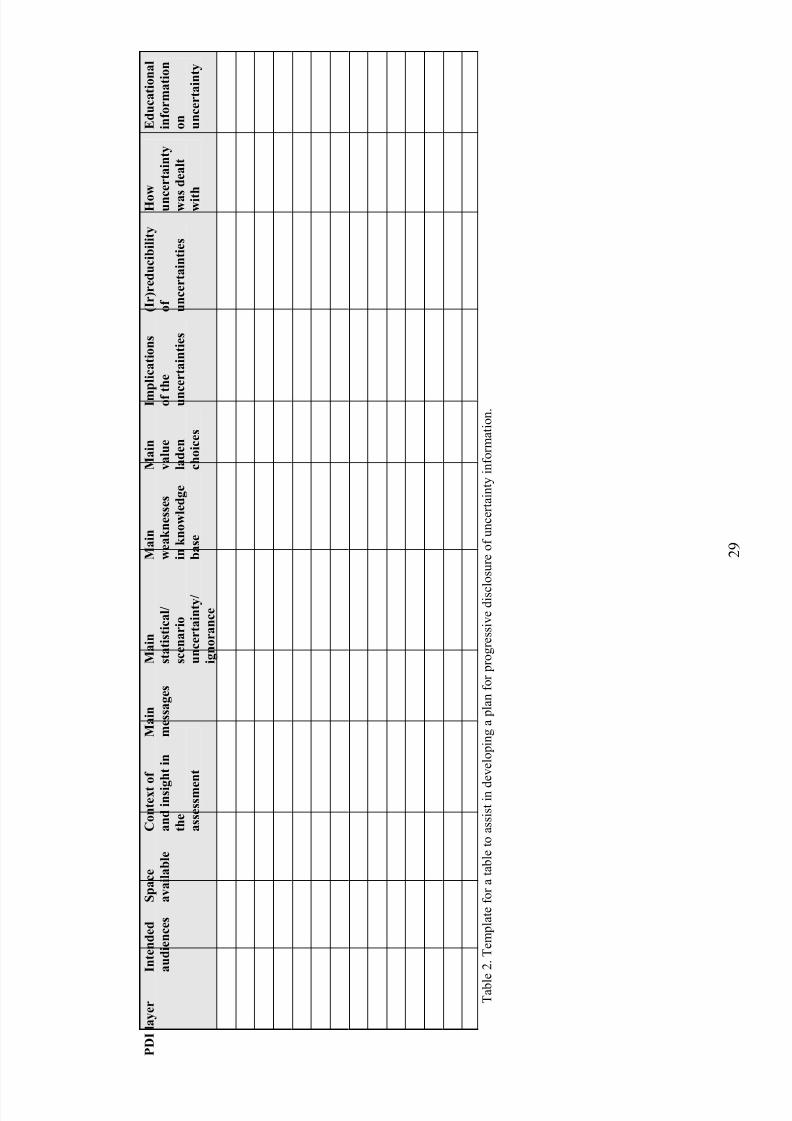
In Table 2 a template for a ‘PDI table’ is given that assists in the making of a planregarding what uncertainty information to communicate in what PDI layer. Whenenvironmental assessment results concerning a topic are reported, this Table can beused as an aid to provide the audiences with a gradual flow of (uncertainty)information, customised to their needs. How to fill in the Table will be discussed
below.
General remarks
- Fill in the Table cells using key words (not the literal text to be used in the writtenmaterial).
- When determining what aspects of uncertainty should be given attention in a
specific PDI layer, consider:- the purpose of the PDI layer at hand (see part II, section 1, question 1)
25

8/2/2019 Uncertainty Communication
http://slidepdf.com/reader/full/uncertainty-communication 30/64
- the purpose of reporting uncertainty (see part II, section 1, question 2)- the information needs of the audiences (see part II, section 2.2)- the expected willingness to read of the audiences and the time they are
likely to put into it- Background reports belonging to a specific report may take some time to be
published. If there is a considerable time period between the publishing of themain report and that of the background report, one can choose to discussuncertainty issues in the main report in more detail (because interested audienceswill be unable to find inner PDI layers with more detailed information for sometime). This information should, however, be customised to the general style andcontents of the main report. That is, the text will need to be more compact than inthe background report.
- Make sure that all essential uncertainty information is included and properlyreflected in the formulations chosen in those parts of a report that are mostly read:the summary, introduction and conclusion and recommendations chapter.
- If stakeholders are involved in the assessment process, discuss with them what
information they would like to find in which layer.- Make sure that the uncertainty information is consistent across the different PDI
layers.- If unfamiliar with the contents of part III of this report, reading part III before
filling out the PDI table will help to avoid overlooking aspects of uncertainty to becommunicated.
How to fill in the columns of the PDI table
PDI layer Indicate the PDI layers that are relevant for the topic at hand (see part II, section 1,question 3).
Intended audiencesIndicate for each PDI layer the main audiences. In general, outer PDI layers havemultiple and broader audiences (policy makers, the public, scientists) and inner layersare usually intended for smaller, less diverse audiences (mainly scientists and lay
persons who take a specific interest in the subject).
Space availableIn general, in outer PDI layers less space is available for information on a single topic
than in inner layers. Indicate how much space is available for (uncertainty)information regarding the topic. Can the available space best be expressed insentences, paragraphs or pages? How many sentences/paragraphs/pages are available?
Context of and insight in the assessment What minimal information should the reader in a specific PDI layer have in order to
be able to understand the context of the environmental assessment (for example, positioning in view of prior studies), and to understand how this assessment wasconducted?
26

8/2/2019 Uncertainty Communication
http://slidepdf.com/reader/full/uncertainty-communication 31/64
Main messagesWhat are the main messages to be communicated in a specific PDI layer? (see part II,section 3.3). Main messages in outer PDI layers generally are statements of a more
political/societal nature ( for example, ‘particulate matter is a policy problem thatrequires action’), whereas the main messages in inner PDI layers tend to (also) convey
‘scientific’ information (for example, ‘ambient particulate matter concentrationsamount to....’).
Main statistical uncertainty/scenario uncertainty/ignoranceWhat are the main statistical uncertainties, scenario uncertainties and ignorance to becommunicated in a specific PDI layer? (see part II, sections 3.1 and 3.3). For outer PDI layers: pay extra attention to policy relevant aspects (see part II, section 3.2).
Main weaknesses in knowledge baseWhat are the main weaknesses in the knowledge base (including methods used) to becommunicated in a specific PDI layer? (see part II, sections 3.1 and 3.3). For outer
PDI layers: pay extra attention to policy relevant aspects (see part II, section 3.2).
Main value laden choicesWhat are the main value laden choices in the assessment that need to becommunicated in a specific PDI layer? (see part II, sections 3.1 and 3.3). For outer PDI layers: pay extra attention to policy relevant aspects (see part II, section 3.2).
Implications of the uncertaintiesWhat are implications of the uncertainties that need to be communicated in a specificPDI layer? (see part II, sections 3.1 and 3.3). For outer PDI layers: pay extra attentionto policy relevant aspects (see part II, section 3.2). This includes implications of excluded uncertainty types and sources of uncertainty (could the findings be radicallydifferent if these excluded uncertainties would be systematically assessed)?
(Ir)reducibility uncertaintiesWhat are aspects of (ir)reducibility of uncertainties to be communicated in a specificPDI layer? For outer PDI layers: pay extra attention to policy relevant aspects (see
part II, section 3.2).
How uncertainty was dealt withWhat aspects of how uncertainty was dealt with in the environmental assessment have
to be communicated in a specific PDI layer? (see part II, section 3.1) What types andsources of uncertainty were included in / excluded from the analysis?
Educational information on uncertaintyWhat educational information on uncertainty is to be communicated in a specific PDIlayer?
27

8/2/2019 Uncertainty Communication
http://slidepdf.com/reader/full/uncertainty-communication 32/64
4.2 Internal coordination using the PDI table
The text of a MNP report is never written by a single person. It is a joint effort of analysts, team coordinators, supervisors, and communication specialists. Among themembers of this ‘writing team’ there may be disagreement on what to communicate.Furthermore, changes are often made in the text in the process of editing that also mayinfluence the contents (for example, shortening of the text). Discussing the PDI tableamong the writing team – or better yet: developing this table jointly within the writingteam – will provide everyone involved with a basic structure for communication. If changes are proposed it can be evaluated whether such changes fit within thecommunication strategy agreed on beforehand.
28
8/2/2019 Uncertainty Communication
http://slidepdf.com/reader/full/uncertainty-communication 33/64
P D I l a y e r
I n t e n d e d
a u d i e n c e s
S p a c e
a v a i l a b l e
C o n t e x t o f
a n d i n s i g
h t i n
t h e
a s s e s s m e
n t
M a i n
m e s s a g e s
M a i n
s t a t i s t i c a l /
s c e n a r i o
u n c e r t a i n t y /
i g n o r a n c e
M a i n
w e a k n e s s e s
i n k n o w l e d g e
b a s e
M a i n
v a l u e
l a d e n
c h o i c e s
I m p l i c a t i o n s
o f t h e
u n c e r t a i n t i e s
( I r ) r e d u c i b i l i t y
o f
u n c e r t a i n t i e s
H o w
u n c
e r t a i n t y
w a s d e a l t
w i t h
E d u c a t i o n a l
i n f o r m a t i o n
o n
u n c e r t a i n t y
T a b l
e 2 .
T e m p l a t e f o r a t a b l e t o a s s i s t i n d
e v e l o p i n g a p l a n f o r p r o g r e s s i v e d i s c
l o s u r e o f u n c e r t a i n t y i n f o r m a t i o n .
2 9

8/2/2019 Uncertainty Communication
http://slidepdf.com/reader/full/uncertainty-communication 34/64
Part III
Practical suggestionson reporting uncertainty information
30

8/2/2019 Uncertainty Communication
http://slidepdf.com/reader/full/uncertainty-communication 35/64
III. Practical suggestions on reporting uncertaintyinformation
This third part of the report offers hints, tips, cautions regarding pitfalls, and do’s and
don'ts regarding communicating uncertainty. Section 1 presents practical guidance on‘what and how’ to report uncertainty information. Practical guidance on different forms of presentation (numeric, linguistic, graphic) is presented in section 2. This partof the report contains some examples, which are placed in boxes2.
Wherever insights from part I and part II of this report are relevant, this will beindicated. This will have the form of (part; section; question) (question is optional).For example, ‘II; 3.2;1’ means: see part II, section 3.2, question number 1. If newinsights emerge from working with part III, writers may want to review the PDI tablethat they filled in when working with part II, section 4.
The hints, pitfall warnings, do’s and don'ts in this part of the report are intended tohelp avoid incorrect interpretations of uncertainties in a specific assessment, and tohelp make the uncertainty information useful and meaningful for the audiences. If –
besides this – attention is paid to the locations in a report where this information isoffered, the presentation of the uncertainty will be better customised to the processes
by which readers deal with (uncertainty) information (see part I, section 2).
1. Reporting uncertainty information – What and how
As presented in part II, section 4 the following aspects related to uncertainty may becommunicated to the audiences:- Context of and insight in the assessment- Main message in which uncertainties are reflected or taken into account.- Reporting sorts and types of uncertainties and how these propagate to the
outcomes of interest- How uncertainty was dealt with in the analysis- Implications of uncertainties- What can be done about uncertainties- Educational information on uncertaintyBelow, what and how to communicate will be discussed per item.
1.1 Context of and insight in the assessment
Report the reasons why the present study was conducted. Indicate how it relates to policy questions and policy developments.
Indicate the (potential) position of this assessment in the policy/societal debate,and in what way it can contribute to this debate.
2 Part of the examples are based on our findings of a communication experiment in the Utrecht PolicyLaboratory (Kloprogge and Van der Sluijs, 2006b). In this session uncertainty information from theDutch Environmental Balance 2005 was tested on a number of 9 lay persons. It should be noted that
due to the limited numbers of participants, the conclusions of this study are preliminary. The examplesmentioned here are only intended as illustrations of the main text.
31

8/2/2019 Uncertainty Communication
http://slidepdf.com/reader/full/uncertainty-communication 36/64
Indicate the (potential) position of this assessment in the scientific debate, and inwhat way it can contribute to this debate.
If desired, position the present study in relation to previous studies, and clarify inwhich respect this study is different concerning both set-up and results. Explain or motivate the differences. Clearly indicate the added value and meaning of the
present study. If applicable, position the study in relation to other studies that are presently being
conducted by the RIVM/MNP or other institutes. If a topic is ‘hot’ or important, provide the readers with an overview of the
MNP/RIVM reports published on this topic. If possible put a ‘dossier’ on theinternet that puts the assessment in its societal context and lists the main findingsof the MNP/RIVM studies.
The MNP website contains several dossiers on environmental topics (e.g., large scale air pollution and acidification, biodiversity, energy and energy supply). The dossiers containinformation on latest developments, facts and figures, frequently asked questions, policyevaluations, MNP/RIVM publications related to the topic, models, and links to other organisations doing work on this subject.
- For integrated assessment studies (in particular the environmental and nature balances and outlooks), explain the procedures and methods used. Do this, for example, in the ‘reading instructions’ or the introduction to the report.
- If useful, comment on the methods that are available and the methods that have been selected for use in the assessment. (So that the choices made and theconsequences of these choices can be put in the context of available methods.)
- Mention essential steps in the calculation procedure for an indicator in order for
the reader to understand how the results for a specific indicator were calculated.- Provide the underlying reasons for steps in the assessment.- The writers will be familiar with the topic and with the way of thinking in an
environmental assessment study. They may therefore not be explicit about aspectsthat seem obvious to them. If possible, pre-test the text on members of theaudience. What parts of/steps in/way of thinking in the assessment are not obviousto them?
32
8/2/2019 Uncertainty Communication
http://slidepdf.com/reader/full/uncertainty-communication 37/64
1.2 Main message in which uncertainties are reflected or taken into account.
Check whether the main messages you want to convey match the interest andneeds of the receiver(s) and what they intend to do with the information (II; 2.2and 2.3)
Check whether the proposed message can be seen as inconsistent with previousmessages. If inconsistency has a reason (for instance, new insights), provide theaudiences with a clear explanation. If it has no reason, avoid inconsistency.Formulate the message in such a way that there is no confusion when it iscompared to ‘old’ messages.
Writing assessment reports is mostly a joint effort involving several people(analysts, team coordinators, supervisors, and communication specialists, andsometimes employees from other institutes.) If there is dissent on the main
messages, be aware of processes in which text sections are kept ‘vague’ or ambiguous on purpose, in order to accommodate all views of those involved. Also be aware of skipping or ignoring issues that involve conflict or moving them toless important sections of the report (for instance, footnotes and appendices).
If debates in politics and society show persistent misunderstandings regardingspecific topics, pay additional attention to messages regarding these topics. (II;2.2.2; 6)
Pay extra attention to formulating messages that involve issues related to frightfactors or media triggers (II; 2.3; 2).
Make sure that the message is underpinned by arguments. State the essential conclusions in a clear and concise form. For this purpose use
can be made of the ‘LOOK/SINCE/THUS’ rule of thumb in order to express in afew short sentences the essence of the message.
E.g., LOOK: RIVM has concluded that the costs of medication and medical appliances inthe Netherlands will increase with 7 to 11%. SINCE population growth and ageing will leadto a higher demand. Also the potential for custom-made goods will grow and these are oftenmore expensive. THUS additional policy measures are required or politicians should acceptthat a larger part of the total budget for medical care is spent on these items.
Be honest and open about what you do not know. Do not make statements thatyou cannot back to a satisfactory level.
Aim for policy-relevant conclusions that are robust with respect to the underlyinguncertainties (II; 3.3).
Make sure that the firmness of the conclusion is obvious from the wording used.The formulation should make the reader clear whether he is dealing with a well-founded or a speculative conclusion or something in between. (III; 2.1)
Pitfall: In situations where the problem or problem definition is barely recognised by important stakeholders, one is tempted to present the results as more certainthan they really are.
Make sure that the conclusion contains an appropriate level of precision in view of the uncertainties and the state of science. If quantitative statements are made: how
many significant digits can be used? (III; 2.2)
33

8/2/2019 Uncertainty Communication
http://slidepdf.com/reader/full/uncertainty-communication 38/64
When formulating conclusions, uncertainty information can be integrated in theformulation of the knowledge claims made. Another option is to separate the two
by presenting the knowledge claim in one sentence and reporting underlyinguncertainties in the following sentence(s). The reader can even be referred to adifferent section in the report where the uncertainty information is provided. In
case of separate presentation, there is a risk that only the knowledge claim is used by the readers (including the press), lifted out of its proper context. Theuncertainties are then lost in the use of the assessment results. (Note that thismechanism is in some way the reverse of the stretched peer review mechanismdiscussed in section 2.3). This caution is particularly important in case of outer PDI layers (for example, press releases and summaries of policy advice reports).
In the sentence ‘X is very likely to be related to Y’, the knowledge claim that X is related toY is integrated with the uncertainty information that this relationship is ‘very likely’. Aseparate presentation would be: ‘X is related to Y. However, ....[arguments that X is notrelated to Y]’. In the latter case there is a risk that the audience will only see or use the
information that X is related to Y.
When describing risks, be aware of the framing effects of wording, for example,the use of the expression ‘lives lost’ versus ‘lives saved’.
Avoid errata in which the contents of the main message are altered. Theconclusion may seem less firm to the readers than the original conclusion and theconclusion may seem less credible.
In the Dutch Environmental Balance 2005 it is concluded that it is likely that the Kyotoobligations for greenhouse gas emissions will be met. In an erratum it is explained thatseveral definitions and assumptions in the calculations were changed at a later stage, whichresulted in the conclusion that there is a fifty-fifty chance of meeting this target. When thisinformation was tested on a group of ten readers, more than half of the group indicated that
because of the fact that these alterations took place the main message on the chance of meeting the target seemed less firm to them.
If possible try to involve matters in the message that are close to the daily(professional) lives of the audiences.
The finding that climate changes are noticeable in the Netherlands is illustrated in the DutchEnvironmental Balance 2005 by showing that the yearly chance of having an‘Elfstedentocht’ (a national event in which natural frozen waters are used to skate a route
along eleven Dutch cities) has declined over the last decades. The Elfstedentocht is widelyknown among the Dutch and of considerable cultural significance. It is something peoplecan easily relate to.
1.3 Reporting sorts and types of uncertainties
Similar to a patient information leaflet accompanying medicines, numbers andconclusions of environmental assessments should come with uncertaintyinformation that puts these statements in their context and gives some clues on
how the assessment should and should not be used. Add informative and relevantinformation on uncertainty to the knowledge statements made.
34

8/2/2019 Uncertainty Communication
http://slidepdf.com/reader/full/uncertainty-communication 39/64
: Information on the following aspects of uncertainty may be presented in reports3
o nature of uncertaintieso magnitude of uncertaintieso sources of uncertaintieso statistical uncertaintieso scenario uncertaintieso ignoranceo weak backing/underpinningo level of theoretical understandingo level of empirical informationo ability to build a model structure based on state of the art knowledgeo theoretical knowledge that is lackingo empirical data that are lackingo degree to which evidence proves somethingo quality of datao quality of theoretical insightso quality of model structureo conflicting scientific evidenceo scientific controversieso societal controversieso different interpretations of data, theories, lines of evidenceo confidence in data, theories, lines of evidenceo acceptance of data, theories, lines of evidence by expertso choices with respect to problem framingo controversies with respect to problem framingo choices with respect to methodso
limitations of methodso choices with respect to indicatorso controversies concerning the indicatorso aspects that were not considered in the study / system boundaries
chosen for the analysiso points of departureo important assumptionso practical limitations (e.g., time constraints)o legal, moral, societal, institutional, proprietary and situational
uncertainties (II; 3.2; 6)
Make sure that the precision level of the uncertainty information is adapted to theexisting scientific understanding. In the following scheme (table 3, Risbey andKandlikar, 2007), an analyst starts at the top-level. If there is no justification for afull probability density function, he moves down one or more level, until hereaches the level that corresponds with the scientific understanding. One can alsostart at the bottom level of the table.
3 This list is not intended to be complete, and lists a sample of partly overlapping issues.
35

8/2/2019 Uncertainty Communication
http://slidepdf.com/reader/full/uncertainty-communication 40/64
Measure of likelihood Justification
Full probability density function Robust, well defended distribution1
Bounds Well defended percentile bounds2
First order estimates Order of magnitude assessment3
Expected sign or trend Well defended trend expectation4Ambiguous sign or trend Equally plausible contrary trend expectations5
Effective ignorance Lacking or weakly plausible expectations6
Table 3: Characterizations of likelihood for a graduated range of precision levels ranging from fullyspecified probability distributions through to qualitative declarations of knowledge and ignorance(Risbey and Kandlikar, 2007).
Besides from which uncertainties actually play a role in the assessment, theuncertainties that should be reported depend on the PDI layer and the informationneeds of the audiences regarding the topics. In outer PDI layers the uncertaintiesto be reported are mainly those that may affect the policy advice given, as well as
those that are subject to (political and societal) debate, and controversies. Detailed background reports (inner PDI layers) require a systematic account of theuncertainties in the assessment (in order to make the assessment procedurestransparent and reproducible). (I; 1)
Pay additional attention to reporting uncertainties if:o they highly influence the policy advice given (II; 3.2)o the indicator outcomes are close to a policy goal, threshold or standard
set by policy (II; 3.2)o the indicator outcomes point to a possibility of morally unacceptable
harm or catastrophic events (II; 3.2)o being wrong in one direction (of the indicator outcomes) is very
different than being wrong in the other when it comes to policy advice(II; 3.2)
o controversies among stakeholders are involved (II; 3.2)o value-laden choices and assumptions are in conflict with stakeholder
views and interests (II; 3.2)o fright factors/media triggers are involved (II; 2.3; 2)o there are persistent misunderstandings among audiences (II; 2.2.2; 6)o the audiences are expected to distrust outcomes that point to low risks
because the public perception is that the risks are serious (II; 2.3; 3)o the audiences are likely to distrust the results due to low or fragile
confidence in the researchers or the organisation that performed the
assessment (II; 2.3; 4) If conflicting scientific information is reported (with arguments for each of the
positions), indicate how widely a specific interpretation is supported within thescientific community. If lay persons are confronted with conflicting scientificinformation they tend to base their position on the reliability and expertise of thescientists, rather than on arguments.
If a comparison is made between different models or between models and resultsfrom measurements, explain the significance and the consequences of this.
Overexposure or underexposure of uncertainties in the various subjects dealt within the assessment should be avoided. However, the presentation of uncertainty has
to be tuned to the audiences. If the report is written primarily for scientists,
36

8/2/2019 Uncertainty Communication
http://slidepdf.com/reader/full/uncertainty-communication 41/64
uncertainties throughout the assessment need to be reported consistently. If thereport is primarily written for policy related audiences the information has to betuned to their information needs and should discuss the policy relevance of uncertainties identified. Some uncertainties will be more important for theseaudiences than others. A seeming imbalance in the presentation of uncertainties
may be the result.
In a detailed background report for scientific audiences on the deposition of the substancesX and Y, for both substances the main uncertainties are reported systematically throughoutthe calculation steps that lead to the conclusions on the deposition (emission, dispersion,atmospheric chemical processes and atmospheric transport). Let us say that the depositionof substance X is near the threshold set by policy and the deposition of Y exceeds thethreshold for Y by far. In a report for policy makers the uncertainties in the calculation of the deposition of substance X will be more important than those of substance Y: in the caseof Y it is clear to the policy makers that they will have to take policy measures to decreaseits deposition. In case of X they have to take the uncertainties of the assessment intoaccount in their decision on whether to take policy measures or not.
The detail and style of the reported uncertainties depend on the PDI layer.o Outer PDI layers:
implicit integration of knowledge claims and uncertaintyinformation is acceptable
non-technical informationavoid use of jargondetails only when relevantuncertainties ‘translated’ to the political and societal context
o Inner PDI layers:separate and explicit treatment of uncertaintiestechnical informationuse of jargon is acceptabledetails to achieve good scientific accountinguncertainties reported in a ‘literal’ way (e.g., ranges)
When reading uncertainty information in a section, readers should be informed onwhere they can learn more about these uncertainties:
o Refer to other sections in the report or to other MNP/RIVM reports.o State the sources that were used to base the uncertainty information on
o Point readers to other reports, websites or MNP/RIVM employees thatmay be of interest to them in view of the uncertainties discussed. Make sure that the uncertainty information in the summary, main conclusions,
main text, background documents, figures, tables and graphs, etcetera isconsistent. That is, that the content of the uncertainties in these sections are not incontradiction to each other (they may be formulated differently, but they shouldtell the same story).
Strive for a consistent way of communicating uncertainties regarding differenttopics within one report and for a consistent treatment across reports and PDIlayers. The latter is especially important for integral studies, where conceptualharmonisation and consistency is desirable to avoid misunderstandings.
37

8/2/2019 Uncertainty Communication
http://slidepdf.com/reader/full/uncertainty-communication 42/64
Place the main uncertainties in those sections of the report that the audiencesgenerally spend the most reading time on: the summary, introduction andconclusion and recommendation chapter (I; 2.2).
If uncertainties play a major role in a topic and the topic is ‘hot’ in politics and/or society, consider publishing a separate ‘facts and uncertainties report’, providing
an overview of the state of the art knowledge on the subject.
Because of political developments and as a result of MNP/RIVM communication on thesubject of Particulate Matter (PM), in 2005 there was a lot of political and media attentionto this subject. The debates showed considerable confusion on the facts and uncertainties onPM. The MNP published a new report (‘Fijn stof nader bekeken/A closer look at PM’). Itcontained no new information, but provided an overview of ‘what we know for sure aboutPM’, ‘what the uncertainties are regarding PM’ and ‘where to go from here’.
- Uncertainty information may be presented in a separate section (for example, in atext box or appendix). As parts of the audience will not read these separate
information sections, make sure that this information is not absolutely needed tointerpret the statements in the main text correctly.
- Include a glossary on uncertainty terms used. Refer to the glossary (for example, by printing terms in the main text that can be found in the glossary in italics).
1.4 How uncertainty was dealt with in the analysis
- Indicate explicitly how uncertainty is dealt with, without arousing falseexpectations. Indicate how and why scenarios were used. Indicate how ignoranceand controversies were dealt with.
- Indicate, if applicable, how stakeholders and stakeholder views were involved inthe management of uncertainties.
- If outcomes of quantitative uncertainty analysis are presented, make very clear what uncertainties were included and what uncertainties were excluded from theanalysis and why.
- Indicate how uncertainty is communicated in the report. For example, are scales being used to communicate uncertainties (see part III; section 2)? If detailedinformation on uncertainty is provided in separate sections (for example, boxtexts, appendices), explain this to the reader, and clearly indicate the relation of these separate texts to the main text.
If applicable, explicitly include in (external) reviews the issue of how uncertainty
was managed in the assessment. Explicitly adding the issue of uncertaintymanagement as a criterion to be addressed in external review is particularlyadvisable in cases where there are many uncertainties, and stakeholders or policymakers are prone to exhibit resistance to accepting the outcomes of the assessmentas a basis for decision making. When an external review by independent expertsshows that – in view of the current knowledge on the topic – the uncertaintieswere treated in a correct manner, the credibility and acceptance of the assessmentresults may be increased. Include a reaction of the MNP/RIVM to the reviewfindings.
38
8/2/2019 Uncertainty Communication
http://slidepdf.com/reader/full/uncertainty-communication 43/64
The Dutch manure policy has had a great impact on the agricultural sector in the Netherlands. Farmers had to make a considerable effort to comply to the rules andregulations and a part of the businesses experienced financial problems and had to shutdown. However, despite all efforts, after studying this topic, the RIVM had to conclude that
the policy goals were still not going to be met and that more had to be done. This is amessage that will meet with a lot of resistance from the agricultural sector, and will lead toheavy criticism on the studies. The RIVM commissioned an independent review of their study by a number of renowned scientists from several Dutch universities and institutes. Inthe RIVM report evaluating the Dutch manure policy (‘Mineralen beter geregeld. Evaluatievan de werking van de Meststoffenwet 1998 – 2003’) the findings of this scientificcommittee was included in an appendix. The committee addressed the following questions:
- Are the research methods used accepted and state of the art?- Are the data used the best available data?- Are there any caveats in the studies that can still be addressed?- Are there any caveats in the studies that can only be addressed through further
long term research?- Are the conclusions scientifically sound, and are the conclusions sufficiently
backed by the facts presented and the analysis of these facts?- Have the analyses been correctly and fully conducted in relation to theconclusions?
- Has sufficient attention been paid to uncertainties?Also included in the report was a reaction of the RIVM on the findings of the committee.
1.5 Implications of uncertainties
Uncertainties in assessments (including choices made and assumptions used) haveimplications for the meaning and scope of applicability of the assessment results
and the representativeness of the results and conclusions. In reports mainlyintended for scientific audiences (inner PDI layers), this is usually extensivelydiscussed in the discussion section as part of good scientific practice. In outer PDIlayers the implications of the uncertainties for the policy process and decisionsneed to be at the centre of attention. A translation has to be made of the value andrepresentativeness of the results to the policy context. (I; 1)
Make clear what the uncertainties imply for the main policy relevant conclusions.How robust are the conclusions in view of the choices made, the assumptionsused, and the uncertainties in data, models, and other knowledge used? (II; 3.3)
Often, uncertainty analysis is partial and includes for instance parameter uncertainty and no model structure uncertainty. Use the Uncertainty Matrix (see
Appendix I of the Quickscan Hints & Actions List) to identify and make explicittypes and sources of uncertainty that were not systematically addressed. Reflecton how results might be different if those types and sources of uncertainty thatwere not systematically addressed in the analysis so far, would have beenanalysed systematically.
39
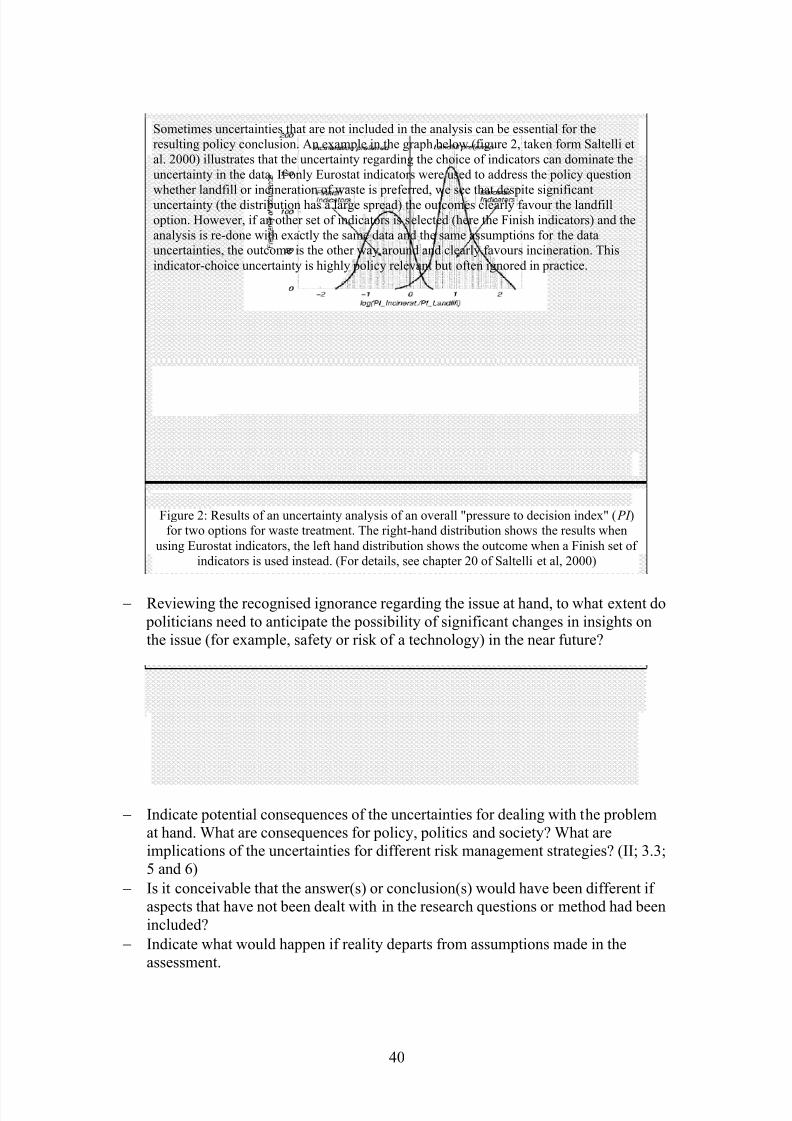
8/2/2019 Uncertainty Communication
http://slidepdf.com/reader/full/uncertainty-communication 44/64
Sometimes uncertainties that are not included in the analysis can be essential for theresulting policy conclusion. An example in the graph below (figure 2, taken form Saltelli etal. 2000) illustrates that the uncertainty regarding the choice of indicators can dominate theuncertainty in the data. If only Eurostat indicators were used to address the policy question
whether landfill or incineration of waste is preferred, we see that despite significantuncertainty (the distribution has a large spread) the outcomes clearly favour the landfilloption. However, if an other set of indicators is selected (here the Finish indicators) and theanalysis is re-done with exactly the same data and the same assumptions for the datauncertainties, the outcome is the other way around and clearly favours incineration. Thisindicator-choice uncertainty is highly policy relevant but often ignored in practice.
Figure 2: Results of an uncertainty analysis of an overall "pressure to decision index" ( PI )for two options for waste treatment. The right-hand distribution shows the results when
using Eurostat indicators, the left hand distribution shows the outcome when a Finish set of indicators is used instead. (For details, see chapter 20 of Saltelli et al, 2000)
Reviewing the recognised ignorance regarding the issue at hand, to what extent do politicians need to anticipate the possibility of significant changes in insights onthe issue (for example, safety or risk of a technology) in the near future?
In case of the BSE case, the Institute of Science in Society and Save British Science arguedthat:“if the Government’s position on BSE up to 1996 had reflected more accurately theuncertainty of the underlying science, both the public and the authorities would have beenbetter prepared for the shift in scientific consensus which prompted the notorious change of policy (ISIS p 339, SBS p 399) ”In: Science and Technology - Third Report. House of Lords. 2000.
Indicate potential consequences of the uncertainties for dealing with the problemat hand. What are consequences for policy, politics and society? What areimplications of the uncertainties for different risk management strategies? (II; 3.3;5 and 6)
Is it conceivable that the answer(s) or conclusion(s) would have been different if aspects that have not been dealt with in the research questions or method had beenincluded?
Indicate what would happen if reality departs from assumptions made in theassessment.
40
8/2/2019 Uncertainty Communication
http://slidepdf.com/reader/full/uncertainty-communication 45/64
1.6 What can be done about uncertainties
Indicate – in outer PDI layers if considered policy relevant – what can be doneabout the uncertainties in the assessment. Indicate which uncertainties arereducible and how, and which ones are not (and therefore should be considered asinevitable). (II; 3.1; 5 and II; 3.1; 6)
Indicate which uncertainty aspects deserve additional attention in the future inview of obtaining insights for the policy problem at hand. This will facilitate theassignment of priorities for future research.
- Indicate whether something can be done about the bottlenecks in the knowledge base. In some cases little can be done about ignorance or a lack of knowledge(think of, for example, the unpredictability of the daily weather more than twoweeks ahead), in some other cases it is a matter of collecting more data andinformation or conducting further research. In the latter case, typically a trade-off will be involved between the costs and efforts of this task and the benefits which
are expected to result from it.
1.7 Educational information on uncertainty
For audiences that are not used to dealing with scientific uncertainties, educationalinformation may be useful. This information could, for instance, be included in anappendix of a report. It should be noted, however, that not many people will readinformation in appendices. Especially if the appendices are not directly related tothe topic of interest.
Explain that there are different aspects to and dimensions of uncertainties(location of uncertainty, level of uncertainty, etcetera; see Appendix A of thedetailed Guidance or Appendix I of the Quickscan Hints & Actions List).
Explain that a ‘high-quality’ assessment does not imply low uncertainty, and, viceversa, that high uncertainty does not imply that the assessment is of poor quality.
Explain that science has its limitations when dealing with complex (societal) problems where there are many system uncertainties, and where facts and valuesare intertwined.
Explain that some uncertainties are irreducible. Explain that further investigatingcomplex problems may bring forward more new uncertainties than that it succeedsin reducing existing uncertainties.
Explain that insights from assessments are not static. Especially where recognisedignorance prevails, insights may change over time as new information becomesavailable. This is especially the case in fields of knowledge that are rapidly
progressing. Pay attention to an explanation of specific types of uncertainties related to a topic.
(For instance, on the topic of emissions, explain that a distinction can be made between monitoring uncertainty (‘diagnosis’) and uncertainty regarding futureemissions (‘prognosis’))
Explain that a statement on the probability of an event (for example, meeting a policy goal) does not provide any information on what the quality and
subsequently the reliability of this estimate is.
41
8/2/2019 Uncertainty Communication
http://slidepdf.com/reader/full/uncertainty-communication 46/64
In the Dutch Environmental Balance 2005, the following is stated: ‘With the planned policies, the Netherlands will very probably not meet the obligations of the NEC-emissionceilings for sulfur dioxide and will probably not meet those for nitrogen dioxide’. Thisinformation was tested in the Utrecht Policy Laboratory on a group of readers. They were
asked to indicate whether they agree with the following statement: ‘We are better able toestimate whether the NEC-emission ceiling of sulfur dioxide will be met, than whether the NEC-emission ceiling of nitrogen dioxide will be met.’ 4 out of the group of 9 readersindicated correctly that this cannot be determined based on the information statement. 1
person disagreed with the statement and 4 persons agreed. A likely explanation for this isthat the persons who agreed on the statement think that ‘very probable’ points to a morereliable estimate than ‘probable’. However, in the text no information was provided withrespect to the quality and reliability of the estimate.
2. Reporting uncertainty information – Forms of
presentationUncertainty information can be presented in a linguistic, graphic or numeric way. Allthree forms have their advantages and disadvantages. In the following sections thesewill be discussed, together with hints and tips on how to present uncertaintyinformation with the use of words, graphs or numbers. Section 2.1 deals with verbalexpressions of uncertainty information, section 2.2 with numeric expressions andsection 2.3 with graphical expressions. Finally, in section 2.4 several remarks aremade with respect to expressing uncertainty using multiple presentation forms.
2.1 Verbal expressions of uncertainty information
Advantages and disadvantages
Most readers are better at hearing, using and remembering uncertainty and risk information in words than in numbers.
Words can better be adapted to the level of understanding of lay audiences. Manylevels of simplification are available. However, in the simplification nuances of uncertainty information may get lost, and the information may be oversimplified.
The use of qualitative expressions will typically lead to different interpretations bydifferent people and/or in different settings. Uncertainty statements can therefore
be understood differently.
42
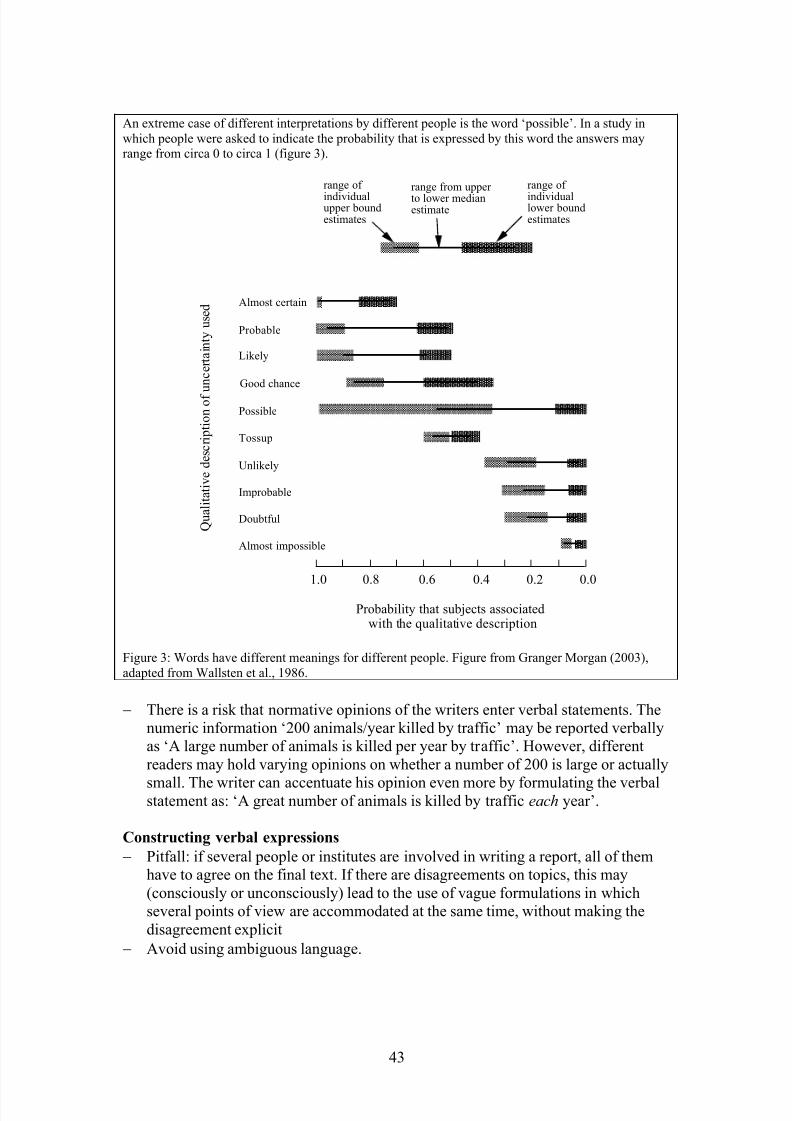
8/2/2019 Uncertainty Communication
http://slidepdf.com/reader/full/uncertainty-communication 47/64
An extreme case of different interpretations by different people is the word ‘possible’. In a study inwhich people were asked to indicate the probability that is expressed by this word the answers mayrange from circa 0 to circa 1 (figure 3).
Probability that subjects associatedwith the qualitative description
0.00.20.40.60.81.0
Almost certain
Probable
Likely
Good chance
Possible
Tossup
Unlikely
Improbable
Doubtful
Almost impossible
range of
individualupper boundestimates
range of
individuallower boundestimates
range from upper
to lower medianestimate
Q u a l i t a t i v e d e s c r i p t i o n o f u n c e r t a i n t y u s e d
Figure 3: Words have different meanings for different people. Figure from Granger Morgan (2003),adapted from Wallsten et al., 1986.
There is a risk that normative opinions of the writers enter verbal statements. Thenumeric information ‘200 animals/year killed by traffic’ may be reported verballyas ‘A large number of animals is killed per year by traffic’. However, differentreaders may hold varying opinions on whether a number of 200 is large or actually
small. The writer can accentuate his opinion even more by formulating the verbalstatement as: ‘A great number of animals is killed by traffic each year’.
Constructing verbal expressions
Pitfall: if several people or institutes are involved in writing a report, all of themhave to agree on the final text. If there are disagreements on topics, this may(consciously or unconsciously) lead to the use of vague formulations in whichseveral points of view are accommodated at the same time, without making thedisagreement explicit
Avoid using ambiguous language.
43

8/2/2019 Uncertainty Communication
http://slidepdf.com/reader/full/uncertainty-communication 48/64
Readers feel that words that appear frequently in a text must be important. Theytend to see this as important information for basing their conclusions on. Usetherefore the same expressions for important returning uncertainty information.
Many words and expressions of common language can be used to expressuncertainties:
o ‘uncertainty wording’ (such as ‘likely’, ‘probably’, ‘not certain’)o auxiliary verbs (such as ‘may’, ‘might’ ‘seem’)o statements that indicate the status of the study (‘preliminary findings’,
‘as a first approximation’, ‘further research is needed’, ‘based oncurrent insights’)
o statements regarding the scientific consensus concerning a claim(‘there is considerable trust in [claim]’, ‘many scientists consider [claim]’, ‘it is widely held that [claim]’)
o if – then constructions (‘if we may assume [assumption], then [claim]’)o constructions with conjunctions (‘however’, ‘although’; [statement],
however [uncertainty]; Example: "To the best of our knowledge it islikely that we will meet the Kyoto target without additional policies,however , our knowledge is limited by .... and that implies that .....")
Make sure that the wording that is used is not contradicting the numbers. Comparethe relationships between numbers and words for different topics, and aim for consistency in their use.
Add quantitative statements to the linguistic description if they make sense andare feasible, and if they indeed have added value.
Use scales or classifications to describe uncertainties. In this case also, everydaylanguage is used, but the words used are clearly defined in the text. A fixed scale’s(fixing probability terms to chance intervals) consistent use of language makes it
easier to remember and consistent messages are perceived as more credible. It alsoenables readers to make comparisons between topics. Be aware of the fact thatreaders may not consult the section (for instance an appendix or a footnote) inwhich the scale or classification is clearly defined.
Table 4: a scale for expressing probability in linguistic terms (as used in theEnvironmental Balance 2005; in Dutch):
Dutch term: English synonym (IPCC) Likelihood: Colour code tables
Nagenoeg zeker Virtually certain >99%Zeer waarschijnlijk Very likely 90% – 99%Waarschijnlijk Likely 66% – 90%Fifty-fifty; circa 50% About as likely as not (new) 33% – 66%
Medium likelihood (old)Onwaarschijnlijk Unlikely 10% – 33%Zeer onwaarschijnlijk Very unlikely 1% – 10% Nagenoeg uitgesloten Exceptionally unlikely <1%
Table 4. Example of ‘Verbal’: IPCC’s ‘likelihood scale’ (IPCC, 2005) as used in theEnvironmental Balance 2005
44

8/2/2019 Uncertainty Communication
http://slidepdf.com/reader/full/uncertainty-communication 49/64
Linguistic scales can not only be used to express uncertainty on the probability of events. Linguistic scales can also be used for making statements on, for example, theevidence or to describe the level of understanding. Examples from the literature aregiven in table 5 and figure 4 below.
Level Legal standard
11 virtually certain10 ‘beyond a reasonable doubt’9 ‘clear and convincing evidence’8 ‘clear showing’7 ‘substantial and credible evidence’6 ‘preponderance of the evidence’5 ‘clear indication’4 ‘probable cause’/’reasonable belief’3 ‘reasonable indication’2 ‘reasonable, articulable grounds for suspicion’1 ‘no reasonable grounds for suspicion’/’inchoate
hunch’/’fanciful conjecture’0 Insufficient even to support a hunch or conjecture
Table 5: A scale for scientific certainty based on legally defined standards of proof (Weiss, 2006)
Figure 4: a scale for assessing the ”qualitatively defined levels of understanding” (IPCC, 2005)
A disadvantage of a fixed scale is that it doesn’t match people’s intuitive use of probability language. People translate such language taking the event magnitude(severity of effects) into account, which may result in an overestimation of the
probability of low magnitude events and an underestimation of the probability of high magnitude events, when a fixed scale is used for communication. Problemsappear to be most pronounced when dealing with predictions of one-time events,where probability estimates result from a lack of complete confidence in the
predictive models. In general, the context of an issue influences the interpretationand choice of uncertainty terms.(Patt and Schrag, 2003; Patt and Dessai, 2005)
Another issue of the use of scales is that they privilege attention to quantifiableand probabilistic uncertainty. It is much harder to address ‘deep uncertainty’ (e.g.,
problem framing uncertainty, methodological unreliability or recognised
ignorance).
45

8/2/2019 Uncertainty Communication
http://slidepdf.com/reader/full/uncertainty-communication 50/64
Try to avoid using words that are part of the ‘uncertainty vocabulary’ in sectionswere information is given where the vocabulary is not specifically meant for. Useother words instead to prevent confusion.
In the Dutch Environmental Balance 2005 probability intervals were used, which were
indicated by names such as ‘Virtually certain’, ‘Likely’, ‘Unlikely’. In the section onammonia emissions a recent study with new insights is mentioned. ‘If this study turns out to
be representative, it becomes less likely that the (...) target in 2010 will be met.’ By usingthe term ‘likely’ readers may associate and confuse this information with the probabilityintervals. An alternative would be for instance: ‘chances that the target will be met will
become lower’.
2.2 Numeric expressions of uncertainty information
Advantages and disadvantages Numbers are more specific than words. Provided that the readers understand the
way in which the numeric information is presented (for example, if they knowwhat a confidence interval is, and know how to interpret this), interpretationdifferences between individuals will be smaller than when the information wasconveyed in a verbal way.
If information is only presented in numbers, some of the readers will translate thisinformation into verbal expressions (either for themselves or whencommunicating the information to other people). If this ‘translation’ is doneincorrectly, this will lead to miscommunication.
Numbers are prone to the pitfalls of suggesting unwarranted precision if usedwithout mastering basic "craft skills with numbers" (Funtowicz and Ravetz,1990).
Constructing numeric expressions
When presenting numbers in inner PDI layers: indicate why the presented numer is of importance (state the significance of the number, compare it to other numbers, if applicable).
Avoid pseudo precision and pseudo imprecision. Pseudo-imprecision occurs whenresults have been expressed so vaguely that they are effectively immune fromrefutation and criticism. Pseudo precision is false precision that occurs when the
precision associated with the representation of a number or finding grosslyexceeds the precision that is warranted by closer inspection of the underlyinguncertainties.
The following joke illustrates an incorrect use of precision level (Funtowicz and Ravetz,1990): A museum visitor asks a museum attendant how old the dinosaur bone is which ison display. ‘It is fifty million and twelve years old.’, replies the museum employee.‘Really?’, is the surprised reaction of the visitor. ‘How can you be this precise?’ ‘Well’,says the employee, ‘When I started working here this fossil was 50,000,000 years old. AndI have been working here for twelve years now’.
46

8/2/2019 Uncertainty Communication
http://slidepdf.com/reader/full/uncertainty-communication 51/64
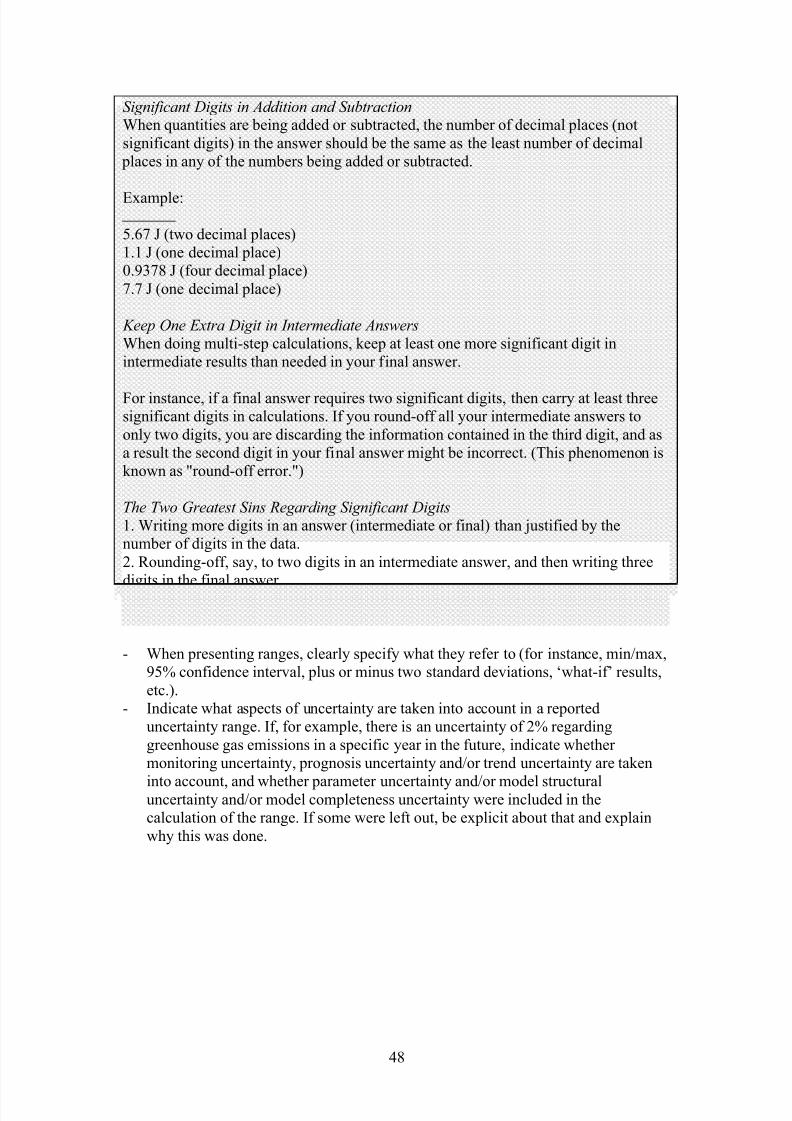
8/2/2019 Uncertainty Communication
http://slidepdf.com/reader/full/uncertainty-communication 52/64
Significant Digits in Addition and SubtractionWhen quantities are being added or subtracted, the number of decimal places (notsignificant digits) in the answer should be the same as the least number of decimal
places in any of the numbers being added or subtracted.
Example:
5.67 J (two decimal places)1.1 J (one decimal place)0.9378 J (four decimal place)7.7 J (one decimal place)
Keep One Extra Digit in Intermediate AnswersWhen doing multi-step calculations, keep at least one more significant digit inintermediate results than needed in your final answer.
For instance, if a final answer requires two significant digits, then carry at least threesignificant digits in calculations. If you round-off all your intermediate answers toonly two digits, you are discarding the information contained in the third digit, and asa result the second digit in your final answer might be incorrect. (This phenomenon isknown as "round-off error.")
The Two Greatest Sins Regarding Significant Digits1. Writing more digits in an answer (intermediate or final) than justified by thenumber of digits in the data.2. Rounding-off, say, to two digits in an intermediate answer, and then writing threedigits in the final answer.
Source: http://www.physics.uoguelph.ca/tutorials/sig_fig/SIG_dig.htm
- When presenting ranges, clearly specify what they refer to (for instance, min/max,95% confidence interval, plus or minus two standard deviations, ‘what-if’ results,etc.).
- Indicate what aspects of uncertainty are taken into account in a reporteduncertainty range. If, for example, there is an uncertainty of 2% regardinggreenhouse gas emissions in a specific year in the future, indicate whether monitoring uncertainty, prognosis uncertainty and/or trend uncertainty are taken
into account, and whether parameter uncertainty and/or model structuraluncertainty and/or model completeness uncertainty were included in thecalculation of the range. If some were left out, be explicit about that and explainwhy this was done.
48

8/2/2019 Uncertainty Communication
http://slidepdf.com/reader/full/uncertainty-communication 53/64
In appendix 3 of the Dutch Environmental Balance 2005 the uncertainties regarding theemission projections of the report are explained. It is explained that for greenhouse gasesthe monitoring uncertainty is neglected, because this uncertainty is assumed to be of equalmagnitude for the first year of analysis and the target year. For other substances, the policy
targets are absolute. Therefore, in these cases the monitoring uncertainty has been takeninto account. This section is clear on what uncertainty was taken into account in theanalyses. However, when this information was tested on a number of lay readers, thisuncertainty information did not turn out to be clear to them. Only after it was explained tothe readers (additional to the text) that the way in which the policy targets were formulatedwas the cause of this difference (explanation why the uncertainties were taken into accountdifferently) they understood the explanation. (In case of greenhouse gases there is a relative
policy target. Uncertainty regarding measurements were assumed to be irrelevant, since inabsolute terms they were assumed to be roughly the same magnitude in both the first year of analysis and in the target year. If the policy target is formulated in an absolute way, bothmonitoring and prognosis uncertainty matter, since they both quantitatively influence theemission projections for the target year.)
- If probability information is presented, indicate whether these are frequentist(probabilities that can be measured) or Bayesian probabilities(probability/reliability as estimated by experts).
- If probability information is presented, be aware of possible distorting effects inthe readers’ interpretation: forgetting baseline probabilities, biases due toavailability, confirmation and overconfidence. In general, formulation in terms of frequencies (e.g., 1 in 1000) instead of percentages is less prone to distortingeffects. (see I; 2.4).
2.3 Graphical expressions of uncertainty information
Advantages and disadvantages
Graphics allows a lot of information to be conveniently summarised. However,many graphical expressions of uncertainty are not straightforward to understand.The reader is required to spend time in retrieving the uncertainty information inthe figure, and – if the method of representation is new to him – has to spend timein understanding the method of representation.
Since conclusions are not stated explicitly in figures (they may be stated in themain text), figures are ‘inviting’ readers to draw conclusions based on what they
see. If they do not adequately study the figure (for example, do not take the timeto look at the scale used) or if they lack the ability to interpret the information inthe figure (for example, because they are not familiar with error bars), they maydraw incorrect conclusions. They may even extract information from the figurethat is not displayed. The crucial point is how to set-up and present your figuressuch that misinterpretations are prevented as much as possible.
Text alone in a report may come across as boring and tedious to readers. Readerswill appreciate a variety in forms of presentation. When presenting various formsone should take care that the implied messages are consistent.
49

8/2/2019 Uncertainty Communication
http://slidepdf.com/reader/full/uncertainty-communication 54/64
Constructing graphical expressions
Figure 5: a few examples of graphical presentations of uncertainty (Ibrekk and Morgan, 1987 cited in: Morgan and
Henrion, 1990)1. Traditional point estimate with an “error bar” that spans a 95% confidence interval2. Bar chart (discretised version of the density function)3. Pie chart (discretised version of the density function)4. Conventional probability density function (PDF)5. Probability density function of half its regular height together with its mirror image6. Horizontal bars of constant width that have been shaded to display probability density using dots7. Horizontal bars of constant width that have been shaded to display probability density using vertical lines8. Tukey box modified to indicate the mean with a solid point9. Conventional cumulative distribution function (CDF), the integral of the PDF.
Figure 5 lists a number of ways to graphically represent probability information.What method of graphical presentation (for example, Probability Density Function(PDF), Cumulative Density Function (CDF), Tukey Box Plot, or pie chart) is most
50

8/2/2019 Uncertainty Communication
http://slidepdf.com/reader/full/uncertainty-communication 55/64
suitable in a situation, depends mainly on the information the writer wants thereaders to extract (for example, 95% confidence interval, the mean). Make surethat the information you want to convey is marked explicitly in the graph. For example, if people are asked to estimate the ‘best estimate’ based on a figure,explicitly mark the mean. People tend to select the mode, if the mean is not
indicated. (Ibrekk and Morgan, 1987)
PDF and CDF
A Probability Density Function represents the relative likelihood with whichvalues of a variable may be obtained. In a graph, it has the values thatvariable may obtain on the X-axis and the relative probability on the Y axis.It can be understood as a histogram with infinitesimal intervals.In mathematical terms, a Probability Density Function (PDF) is any functionf( x) that describes the probability density of the distribution of variable x
such that b
a
b X adx x f ]Pr[)(
It is non- negative for all real x. The integral of the function is one. Unlikeerror bars, which only give a range in which the solution should fall, PDF’sattach a likelihood to each possible value. The probability density functioncan be integrated to obtain the probability that the random variable takes avalue in a given interval a to b.
A Cumulative Density Function (CDF) shows the same information but withon the Y-axis the cumulative probability that the true value (or sampledvalue) of the variable is smaller or equal to x. In fact, a CDF is themathematically integrated version of a PDF.
A CDF alone does not seem to be effective methods for communication. A CDFwith a PDF plotted directly above it (with the same horizontal scale and with thelocation of the mean clearly indicated on both curves) seems to be a goodapproach for displaying probability information. (Ibrekk and Morgan, 1987)
Clearly indicate what the depicted uncertainty represents, which types of uncertainties are displayed, and what is being compared and the significance andconsequences of this.
Do not include too many different aspects in one figure. If possible, distribute theinformation over two figures (for example, one figure concerning developments inthe past and one with developments in the future)
Pay attention to the scale. The magnitude of uncertainty should be easy to read inthe figure. Avoid that a different order of magnitude is suggested by the scale.
Pitfall: especially when writers have been working with a specific type of figuresfor many years, it is hard to imagine that they may not be clear to some of thereaders. Test the figures on a few members of the intended audiences, especiallyon those who are not familiar with the figures.
Be aware of the fact that readers may extract information from figures that is not
even displayed in it. If there is a risk of this happening, state clearly in the textwhat the figure does not show.
51

8/2/2019 Uncertainty Communication
http://slidepdf.com/reader/full/uncertainty-communication 56/64
The figure presented below indicates the effect of policy measures on emissions in the past and indicates what effectsare to be expected in the future.
Figure 5: The effects of Dutch policy and the purchase of emission reduction abroad on reaching the Kyoto-obligation. (source: Erratum Environmental Balance 2005: Greenhouse gas emissions, 2005)
Because the figure already contains a lot of information (or even too much information), it was decided in the writing phase of the report to omit the uncertainty bands. However, when lay readers were asked in a test-situation how theywould characterise the uncertainty regarding the emissions in the year 2010 (based on this figure only) only 2 of the9 readers indicated correctly that this could not be based on the information of the graph. The answers given by theother readers showed a large spectrum of opinions: 1 person answered the uncertainty was small, 2 that is was notsmall/not large, 2 that it was large, and 2 that is was very large. (The answers they could choose from were: verysmall; small; not small/not large; large; very large; cannot be determined based on this information; I do not know).
Be aware of the fact that some elements in figures may be suggestive, such asmagnitudes of surfaces, colors, scales etc.
Besides the construction that uncertainty information is ‘added’ to figuresdepicting results, figures can also be used to display solely the uncertainties.These kind of representations are not necessarily complex, but the readers do needextra information on what is being displayed in figures like these. It requires themto think on a different, more abstract level. Examples of such representations are
given in figure 6.
52

8/2/2019 Uncertainty Communication
http://slidepdf.com/reader/full/uncertainty-communication 57/64
Uncertainty band Box plot
Uncertainty band and box plot (both uncertainty ranges) are commonly-used graphical forms. Easy andsuitable for a non-technical public.Probability density Multi-model ensemble
Probability density functions and multi-model ensembles are more difficult to understand. Additionalinformation is required about the meaning of the figure and, in particular, about theimplications/implications of the differences between model results.Difference map Pedigree chart
Technically speaking, specialised figures such as a difference map (indicates spatial uncertainty, seeVisser et al, 2005) and pedigree chart (indicates ‘level of underpinning’ of a topic; see Wardekker andVan der Sluijs 2006c) are not necessarily complex, but they do require additional information aboutwhat the figure actually represents.Figure 6: Several examples of graphics intended specifically for depicting uncertainty
53
8/2/2019 Uncertainty Communication
http://slidepdf.com/reader/full/uncertainty-communication 58/64
2.4 Combinations for expressing uncertainty information
Uncertainties can be reported in verbal, numeric and graphical form simultaneously:in this case the text of a specific section describes the uncertainties using language,
but also includes numbers, and the section contains a figure in which the uncertaintiesare graphically displayed. This may have the following advantages:
o The repetition may result in a better understanding of the uncertainty,since it is explained in different ways
o Since a description of the uncertainties occurs at several locations in aspecific section of the report, chances are higher that the reader willnotice this information
o Users may have preferences for a specific form of presentation: he may browse through the report and mainly pay attention to the figures or,for instance, scan the text for numbers. If the uncertainty information isreported in all three forms, readers who mainly pay attention to one of these forms will not miss uncertainty information that is only reportedin the presentation forms he does not pay attention to.
Presenting the uncertainty information in several presentation forms will require morespace in the sections of the report where the topic is discussed and requiresconsistency in the messages displayed.
54

8/2/2019 Uncertainty Communication
http://slidepdf.com/reader/full/uncertainty-communication 59/64
References
Brase, G., Cosmides, L., & Tooby, J. (1998). Individuation, Counting, and StatisticalInference: The role of frequency and whole object representations in judgment under uncertainty. Journal of Experimental Psychology: General, 127, 1-19.See http://www.psych.ucsb.edu/research/cep/papers/individnatsamp98.pdf
Cosmides, L. & Tooby, J. (1996). Are humans good intuitive statisticians after all?:Rethinking some conclusions of the literature on judgment under uncertainty.Cognition, 58, 1-73.See http://www.psych.ucsb.edu/research/cep/papers/intuitivestat96.pdf
Department of Health (UK), 1997: “Communicating about Risks to the Public Health:Pointers to Good Practice”; Department of Health, London, United Kingdom
(http://www.dh.gov.uk/assetRoot/04/03/96/70/04039670.pdf);Funtowicz, S.O., and J.R. Ravetz. 1990. Uncertainty and Quality in Science for Policy. Dordrecht, Netherlands: Kluwer.
Gigerenzer, G., 2002. Calculated Risks: How to Know When Numbers Deceive You.Simon& Schuster, New York.
Gigerenzer, G., 2003. Reckoning With Risk : Learning to Live With UncertaintyGardners Books. (March 31, 2003)
Gigerenzer, G., Hertwig, R., van den Broek, E., Fasolo, B., & Katsikopoulos, K.2005."A 30% chance of rain tomorrow." How does the public understand probabilistic weather forecasts? Risk Analysis, Volume 25, Issue 3, Page 623-629.
Gray, P.C.R. and P.M Wiedemann (2000). Risk Communication in Print and on theWeb: A Critical Guide to Manuals and Internet Resources on Risk Communicationand Issues Management. Available online:http://www.fz-juelich.de/inb/inb-mut/rc/inhalt.html (visited August 2007)
Hansen,J., Marx, S., Weber, E. 2004. The Role of Climate Perceptions,Expectations, and Forecasts in Farmer Decision Making. The Argentine Pampas and
South Florida. International Research Institute for Climate Prediction (IRI). The EarthInstitute at Columbia Univeristy. New York. IRI Technical Report 04-01. See alsohttp://iri.columbia.edu/~jhansen/RoleOfClimatePerceptions.pdf
Hoffrage, U, Lindsey, S., Hertwig, R., Gigerenzer, G. 2000. CommunicatingStatistical Information. Science, Vol. 290. no. 5500, pp. 2261 – 2262.
Ibrekk, H. and Morgan, M.G., 1987: Graphical communication of UncertainQuantities to Non-Technical People, Risk Analysis, 7 (4): 519-529.
IPCC, 2004. IPCC Workshop on Describing scientific uncertainties in climate change
to support analysis of risk and of opinions. Workshop report, 138 pp.
55

8/2/2019 Uncertainty Communication
http://slidepdf.com/reader/full/uncertainty-communication 60/64
IPCC, 2005. Guidance Notes for Lead Authors of the IPCC Fourth AssessmentReport on Addressing Uncertainties.
Janssen, P.H.M., A.C. Petersen, J.P. van der Sluijs, J.S. Risbey, J.R. Ravetz , 2003:
RIVM/MNP Guidance for Uncertainty Assessment and Communication: QuickscanHints & Actions List. RIVM/MNP, ISBN 90-6960-105-2.
Janssen, P.H.M., Petersen, A.C., Van der Sluijs, J.P., Risbey, J., Ravetz, J.R. (2005),A guidance for assessing and communicating uncertainties. Water science andtechnology, 52 (6) 125-131.
Kahneman, D., Slovic, P., & Tversky, A. (Eds.) 1982. Judgment under Uncertainty:Heuristics and Biases. New York: Cambridge University Press.
Kloprogge, P., J.P. van der Sluijs, 2006a. Verslag beleidslabsessie
´Onzekerheidsinformatie in de Milieubalans 2005´, Department of Science,Technology and Society, Copernicus Institute, Utrecht University, Utrecht, The
Netherlands. (NWS-E-2006-56)
Kloprogge, P., J.P. van der Sluijs, 2006b. Verslag Expert Meetingonzekerheidscommunicatie rond fijn stof en gezondheid, Department of Science,Technology and Society, Copernicus Institute, Utrecht University, Utrecht, The
Netherlands, 2006. (NWS-E-2006-55)
Krämer, W., & Gigerenzer, G. 2005. How to confuse with statistics: The use andmisuse of conditional probabilities. Statistical Science. 20, no. 3 (2005), 223–230.
Maxim, L. and J.P. van der Sluijs (2007), Uncertainty: cause or effect of stakeholders’debates? Analysis of a case study: the risk for honey bees of the insecticide Gaucho®,Science of the Total Environment , 376, 1 -17.
Michaels D. 2005: Doubt is their product. Scientific American, 292 (6), 96–101.
Morgan, M. G., and M. Henrion. 1990: Uncertainty -- a guide to dealing withuncertainty in quantitative risk and policy analysis. Cambridge: Cambridge UniversityPress.
Morgan, M. G. Characterizing and Dealing With Uncertainty: Insights from theIntegrated Assessment of Climate Change. Integrated Assessment 13, 2003, 4 (1), 46– 55.
Moss, R.H. and Schneider, S.H., 2000: Uncertainties in the IPCC TAR:Recommendations to lead authors for more consistent assessment and reporting. In:Guidance Papers on the Cross Cutting Issues of the Third Assessment Report of theIPCC [eds. R. Pachauri, T. Taniguchi and K. Tanaka], World MeteorologicalOrganisation, Geneva, pp. 33-51.
56

8/2/2019 Uncertainty Communication
http://slidepdf.com/reader/full/uncertainty-communication 61/64
Myhr, A.I., 2005. Stretched peer-review on unexpected results (GMOs). Water Science & Technology 52 (6), 99e106.
Myhr, A.I., Traavik, T., 2003. Genetically modified crops: precautionary science andconflicts of interest. Journal of Agricultural and Environmental Ethics 16, 227e247
Neutelings, R., 1997: De eigenzinnige lezer. Hoe Tweede-Kamerleden en gemeenteraadsleden beleidsteksten beoordelen. Den Haag: SDU Uitgevers.
Nowotny, H. (1999). The place of people in our knowledge. European Review, 7 (2),247–262.
Nowotny, H., Scott, P. and Gibbons, M. (2001). Re-Thinking Science. Knowledge and the Public in an Age of Uncertainty, Polity Press, Cambridge.
Patt, A.G., Dessai, S., 2005. Communicating uncertainty: lessons learned and
suggestions for climate change assessment. C. R. Geoscience 337, 425-441.
Patt, A.G., Schrag, D.P., 2003: Using specific language to describe risk and probability. Climatic Change 61, 17–30.
Pereira, A.G. and Quintana, S.C., 2002:. From technocratic to participatory decisionsupport systems: responding to the new governance initiatives. Journal of GeographicInformation and Decision Analysis 6(2):95-107.
Petersen, A.C., P.H.M. Janssen, J.P. van der Sluijs, J.S. Risbey, J.R. Ravetz, 2003:RIVM/MNP Guidance for Uncertainty Assessment and Communication: Mini-Checklist & Quickscan Questionairre.. RIVM/MNP; ISBN 90-6960-105-1.
Ravetz, J.R., 1973: Scientific Knowledge and its Social Problems, Penguin Books,Harmondsworth, Middlesex.
Refsgaard J-C, Van der Sluijs J.P. Højberg, A.L., Vanrolleghem, P.A. (2007)Uncertainty in the Environmental Modelling Process: A Review, EnvironmentalModelling & Software. 22 (11), 1543-1556.
Risbey, J. and Kandlikar, M. (2007) Expressions of likelihood and confidence in the
IPCC uncertainty assessment process. Climatic Change 85 (1-2), 19-31.Risbey, J., J. van der Sluijs, P. Kloprogge, J. Ravetz, S. Funtowicz, and S. CorralQuintana (2005): Application of a Checklist for Quality Assistance in EnvironmentalModelling to an Energy Model. Environmental Modeling & Assessment Vol. 10 (1),63-79.
Rode, C., Cosmides, L., Hell, W., & Tooby, J. (1999). When and why do peopleavoid unknown probabilities in decisions under uncertainty? Testing some predictionsfrom optimal foraging theory. Cognition, 72, 269-304.See http://www.psych.ucsb.edu/research/cep/papers/optimalforaging99.pdf
57

8/2/2019 Uncertainty Communication
http://slidepdf.com/reader/full/uncertainty-communication 62/64
Saltelli A, Chan K, Scott M. Sensitivity Analysis. John Wiley & Sons Publishers;2000. 475 pp.
Slovic, P.; Fischhoff, B.; Lichtenstein, S., 1981: Perceived Risk: PsychologicalFactors and Social Implications, in: Proceedings of the Royal society of London. Ser.
A, mathematical and physical sciences, Volume: 376, Issue: 1764 (April 30, 1981), pp: 17-34.
Slovic, P.; Fischhoff, B.; Lichtenstein, S., 1984: Behavioral Decision TheoryPerspectives on Risk and Safety; Acta psychologica, Volume: 56, Issue: 1-3 (August1984), pp: 183-203.
Slovic, Paul, 1987: Perception of Risk, Science, 1987, 236, p. 280-285.
Vaessen, A., forthcoming, Omgaan met onzekerheden in adviesrapporten; een analysevan het verwerkingsgedrag van beleidsmakers. Dissertation Technical University
Delft, The Netherlands.
Vaessen, A., 2003, Onzekerheid in de tekst. In: Van Asselt, M., Petersen, A.C. (eds) Niet bang voor onzekerheid. RMNO-reeks Voorstudies en achtergronden. nr. V.01.
Vaessen, A., M.G.M. Elling, 2000: Selectief leesgedrag van beleidsmakers bij hetlezen van adviesrapporten. In: Over de grenzen van de taalbheersing. Onderzoek naar taal, tekst en communicatie. VIOT 99 congres (Delft, 20, 21, 22 dec. 1999), SduUitgevers, Den Haag, p. 453-466. ISBN: 90 12 08994 8.
Van Asselt, M. B. A., Langendonck, R., van Asten, F., van der Giessen, A., Janssen,P., Heuberger, P., and Geuskens, I., 2001: Uncertainty & RIVM's EnvironmentalOutlooks. Documenting a learning process, ICIS/RIVM, Maastricht/Bilthoven, The
Netherlands.
Van der Sluijs, J.P. (2005), Uncertainty as a monster in the science policy interface:four coping strategies. Water science and technology, 52 (6), 87-92.
Van der Sluijs, J.P. (2007), Uncertainty and Precaution in EnvironmentalManagement: Insights from the UPEM conference, Environmental Modelling and
Software, 22, (5), 590-598.
Van der Sluijs, J.P., J.S. Risbey, P. Kloprogge, J.R. Ravetz, S.O. Funtowicz, S.CorralQuintana, Â Guimarães Pereira, B. De Marchi, A.C. Petersen, P.H.M. Janssen, R.Hoppe, and S.W.F. Huijs, 2003: RIVM/MNP Guidance for Uncertainty Assessmentand Communication: Detailed Guidance Utrecht University & RIVM.
Van der Sluijs, J.P, P.H.M. Janssen, A.C. Petersen, P. Kloprogge, J.S. Risbey, W.Tuinstra, M.B.A. van Asselt, J.R. Ravetz, 2004. RIVM/MNP Guidance for Uncertainty Assessment and Communication: Tool Catalogue for UncertaintyAssessment Utrecht University & RIVM.
58
8/2/2019 Uncertainty Communication
http://slidepdf.com/reader/full/uncertainty-communication 63/64
Van der Sluijs, J.P., Craye, M. Funtowicz, S., Kloprogge, P., Ravetz, J. and Risbey, J.(2005) Combining Quantitative and Qualitative Measures of Uncertainty in Model
based Environmental Assessment: the NUSAP System, Risk Analysis, 25 (2). p. 481-492.
Van der Sluijs, J.P., J. Risbey and J. Ravetz (2005), Uncertainty Assessment of VOCemissions from Paint in the Netherlands, Environmental Monitoring and Assessment,105, p. 229-259
Van de Vusse, A.C.E (Editor), 1993: Risicocommunicatie: verslag studiedag 17 juni1993 wetenschapswinkels, Wetenschapswinkel Technische Universiteit Delft, Delft.
Visser, H., A.C. Petersen, A.H.W. Beusen, P.S.C. Heuberger, P.H.M. Janssen, 2005.Leidraad voor Omgaan met Onzekerheden: Checklist Onzekerheden in RuimtelijkeInformatie en Visualisaties van Ruimtelijke Onzekerheid, MNP, Bilthoven.
Wallsten, T. S., Budescu, D. V., Rapoport, A., Zwick, R., & Forsyth, B. H., 1986:Measuring the vague meanings of probability terms. Journal of Experimental
Psychology: General , 115, 348-365.
Wardekker, J.A., 2004: Risk communication on Climate Change, MSc Thesis, UtrechtUniversity, Department of Science Technology and Society.
Wardekker, J.A. and J.P. van der Sluijs, 2005. Report of the Expert Meeting UncertaintyCommunication, Utrecht 10 Dec 2004, Utrecht University, Department of ScienceTechnology and Society.
Wardekker, J.A., Van der Sluijs, J.P., 2006a. Onzekerheidscommunicatie in deMilieubalans 2005: Resultaten Gebruikerspanel Beleidsmakers. Report commissioned
by: Netherlands Environmental Assessment Agency (RIVM/MNP), Department of Science, Technology and Society, Copernicus Institute for Sustainable Developmentand Innovation, Utrecht University, Utrecht, The Netherlands. 29 pp + appendices.(NWS-E-2006-16)
Wardekker, J.A., Van der Sluijs, J.P., 2006b. Onzekerheidscommunicatie in deMilieubalans 2005: Resultaten Gebruikerspanel Stakeholders. Report commissioned
by: Netherlands Environmental Assessment Agency (MNP/RIVM), Department of
Science, Technology and Society, Copernicus Institute for Sustainable Developmentand Innovation, Utrecht University, Utrecht, The Netherlands. 31 pp. + appendices.(NWS-E-2006-36)
Wardekker, J.A., J.P. van der Sluijs, 2006c. Evaluatie van Onzekerheidscommunicatiein de Milieubalans 2005. Copernicus Institute for Sustainable Development andInnovation, Utrecht University, Utrecht, The Netherlands.
Weiss, C, 2006. Can there be science-based precaution? Environmental ResearchLetters, 1 (2006) 014003 (7pp)
59

8/2/2019 Uncertainty Communication
http://slidepdf.com/reader/full/uncertainty-communication 64/64
Acknowledgements
Many people contributed – directly or indirectly – to the development of this report,for which we would like to thank them. First of all, we would like to thank Arthur Petersen of the MNP for his input throughout the entire project. The discussions withhim, Peter Janssen and Johan Melse (MNP) proved very valuable for shaping the
project.We very much appreciate the input of the participants of and contributors to theinternational expert workshop on uncertainty communication4 (which formed the startof this project), which provided us with a long list of interesting issues to tackle. Wewould further like to thank all the participants of the communication experiments.Their input led to valuable insights in the process of uncertainty communication. Wethank Eltjo Buringh and Mark van Oorschot (MNP) who delivered substantial inputfor the contents and set up of the communication experiments in the Utrecht PolicyLaboratory.
We thank all the reviewers of an earlier version of this report for their comments andsuggestions, especially Peter Janssen, Anton van der Giessen, Mark van Oorschot,Jerry Ravetz, Charles Weiss, Jean-Marc Douguet and Annemarie Vaessen.Finally we would like to mention here that the sections regarding communication inthe detailed Guidance, and the use of the concept of PDI for communication of uncertainty information were mainly based on the ideas of Ângela Guimarães Pereira,Serafin Corral Quintana and Silvio Funtowicz. Their ideas have been built further upon in this report.
4These were: Matthieu Craye (European Commission Joint Research Centre), Bruna De Marchi
(Institute of International Sociology of Gorizia, Italy), Suraje Dessai (Tyndall Centre for ClimateChange Research & University of East Anglia, UK), Annick de Vries (University of Twente, The
Netherlands), Silvio Funtowicz (European Commission Joint Research Centre), Willem Halffman(University of Twente, The Netherlands), Matt Hare (Seecon Deutschland, Germany), Peter Janssen(MNP, The Netherlands), Penny Kloprogge (Utrecht University, The Netherlands), Martin Krayer von