uncertainties of reverberation time estimation via ... · uncertainties of reverberation time...
TRANSCRIPT

Uncertainties of reverberation time estimation via adaptivelyidentified room impulse responses
Lifu Wua)
Collaborative Innovation Center of Atmospheric Environment and Equipment Technology,Nanjing University of Information Science and Technology, Nanjing, 210044, China
Xiaojun QiuSchool of Electrical and Computer Engineering, RMIT University, Melbourne, Australia
Ian BurnettFaculty of Engineering and IT, University of Technology Sydney, Sydney, Australia
Yecai GuoCollaborative Innovation Center of Atmospheric Environment and Equipment Technology,Nanjing University of Information Science and Technology, Nanjing, 210044, China
(Received 24 August 2015; revised 7 February 2016; accepted 12 February 2016; published online10 March 2016)
This paper investigates the reverberation time estimation methods which employ backward integra-
tion of adaptively identified room impulse responses (RIRs). Two kinds of conditions are consid-
ered; the first is the “ideal condition” where the anechoic and reverberant signals are both known
a priori so that the RIRs can be identified using system identification methods. The second is that
only the reverberant speech signal is available, and blind identification of the RIRs via dereverbera-
tion is employed for reverberation time estimation. Results show that under the “ideal condition,”
the average relative errors in 7 octave bands are less than 2% for white noise and 15% for speech,
respectively, when both the anechoic and reverberant signals are available. In contrast, under the
second condition, the average relative errors of the blindly identified RIR-based reverberation time
estimation are around 20%�30% except the 63 Hz octave band. The fluctuation of reverberation
times estimated under the second condition is more severe than that under the ideal condition and
the relative error for low frequency octave bands is larger than that for high octave bands under
both conditions. VC 2016 Acoustical Society of America. [http://dx.doi.org/10.1121/1.4943547]
[MRB] Pages: 1093–1100
I. INTRODUCTION
Reverberation time (T60) is defined as the time in sec-
onds that is required for a steady-state sound level to decay
60 dB below its initial level after the sound source is abruptly
turned off.1 It is an important parameter not only for charac-
terizing the acoustic properties of a room, but also for
designing a proper dereverberation method in many acoustic
signal processing applications, so significant attention has
been paid to T60 estimation over the past several decades.2–9
Among these methods, the interrupted noise method3 and the
Schroeder’s impulse response backward integration method4
(Schroeder’s method) are two standard approaches. One
problem of these two methods is that the excitation signals
used may disturb or irritate nearby occupants, and the test
rooms need to be unoccupied according to the ISO 3382
standard.3
To accomplish reverberation time measurement without
disturbing audiences, a number of methods attempt to estimate
reverberation time from the reverberant signal naturally pres-
ent in the test room. These methods are referred to as blind
methods in the literature and the maximum likelihood
estimation (MLE) method is the predominant approach.5–7 In
Ref. 9, a reverberation time estimation method based on
single-channel blind room impulse response (RIR) identifica-
tion is introduced, which can be treated as an approximation of
the Schroeder’s method. Most early literature related to these
blind methods only address full band reverberation time esti-
mation5,6,9 and are, thus, not very useful for practical applica-
tions because sound absorption in rooms varies with frequency
and the reverberation time is frequency dependent.7,8
One application of the blind methods in school class-
rooms and hospital wards estimated the reverberation time in
7 octave bands from 125 Hz to 8 kHz.7 In that study, the
MLE method demonstrated similar accuracy to the standard
measurement methods such as balloon bursts or swept-sine
measurements, but it was found that the window length was
a critical parameter in achieving accurate results. In another
study, an all-pass warped filter-bank was employed to esti-
mate frequency dependent reverberation time and this was
shown to result in a more accurate reverberation time esti-
mate at lower frequencies.8
The MLE method can be considered as an extension of
the interrupted noise method and its precision is affected by
factors such as the number of long pause gaps (segments
where a speaker is silent), sharp offsets (the segments that
the speech ceases abruptly), and statistical processing.5,6 In
a)Also at: School of Electrical and Computer Engineering, RMIT
University, Melbourne, Australia. Electronic mail: [email protected]
J. Acoust. Soc. Am. 139 (3), March 2016 VC 2016 Acoustical Society of America 10930001-4966/2016/139(3)/1093/8/$30.00
Redistribution subject to ASA license or copyright; see http://acousticalsociety.org/content/terms. Download to IP: 114.212.232.15 On: Thu, 19 May 2016 08:55:38
comparison with the interrupted noise method, Schroeder’s
method is preferred because it theoretically represents an av-
erage of an infinite number of interrupted noise measure-
ments. Hence, if the RIR is indentified from the reverberant
speech signal, the reverberation time can be estimated from
that identified RIR using Schroeder’s method.9
Taking the two aforementioned factors into considera-
tion, the main objective of this paper is to evaluate reverber-
ation time estimation performance in different octave bands
on the basis of backward integration of the adaptively identi-
fied RIR. The RIR is identified under two different condi-
tions, namely, (1) where the anechoic (also referred to as
“clean” or “dry” in some literature) and reverberant signals
are known a priori (i.e., the ideal condition), and the RIR
can be identified using the well-established system identifi-
cation scheme; (2) the anechoic signal is unknown and only
the reverberant speech signal is available. In this case, blind
identification of the RIR is used to establish a reverberation
time estimate.9 In the remainder of this paper Sec. II
describes the proposed approaches to reverberation time esti-
mation, while details of the simulations and experiments are
given in Sec. III. The results are summarised and the paper
is concluded in Sec. IV.
II. METHOD
The reverberant signal x(n) received in a room free from
noise can be modeled by the convolution of the anechoic sig-
nal s(n) with the RIR h(n),
xðnÞ ¼XN�1
k¼0
hðkÞsðn� kÞ; (1)
where h(n) is an N-tap finite impulse response (FIR) filter.
An ideal condition is considered first, where the
anechoic and reverberant signals are known a priori, i.e.,
x(n) and s(n) are known in Eq. (1) and the RIR h(n) can be
obtained using well-established system identification meth-
ods. There are many techniques for system identification, in
such a case the normalized least mean square (NLMS) algo-
rithm is used to identify the RIR due to its easy implementa-
tion and good performance.9 The RIR estimation, hðnÞ, is an
M-tap FIR filter which is updated by the NLMS algorithm
according to9
h nþ 1ð Þ ¼ h nð Þ þ l1
s nð ÞsT nð Þs nð Þ
e nð Þ; (2)
where l1 is the step size and s(n)¼ [s(n), s(n � 1),…, s(n�Mþ 1)]T. e(n) is the difference between the observed
reverberant signal x(n) and the estimated reverberant signal
xðnÞ, i.e., e(n)¼ x(n) – xðnÞ. The NLMS algorithm is a vari-
ant of the least mean square (LMS) algorithm and it solves
the problem that the LMS algorithm is sensitive to the scal-
ing of its input [s(n)] by normalizing with the power of the
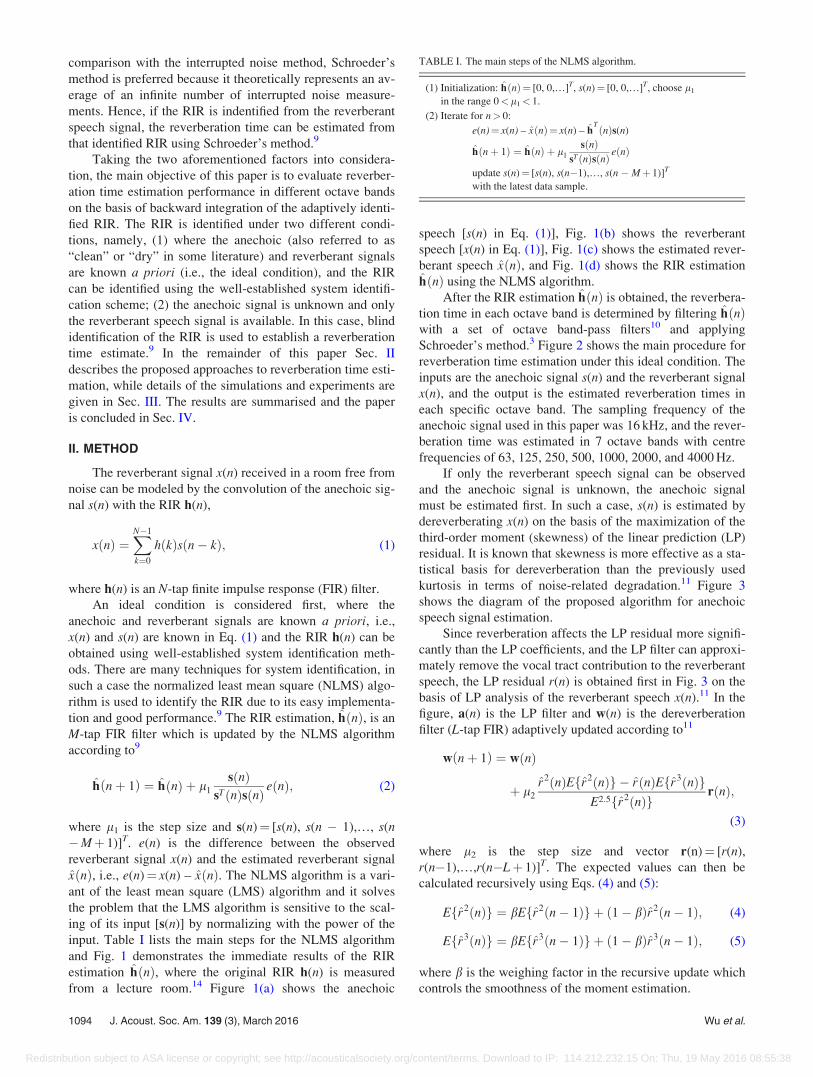
input. Table I lists the main steps for the NLMS algorithm
and Fig. 1 demonstrates the immediate results of the RIR
estimation hðnÞ, where the original RIR h(n) is measured
from a lecture room.14 Figure 1(a) shows the anechoic
speech [s(n) in Eq. (1)], Fig. 1(b) shows the reverberant
speech [x(n) in Eq. (1)], Fig. 1(c) shows the estimated rever-
berant speech xðnÞ, and Fig. 1(d) shows the RIR estimation
hðnÞ using the NLMS algorithm.
After the RIR estimation hðnÞ is obtained, the reverbera-
tion time in each octave band is determined by filtering hðnÞwith a set of octave band-pass filters10 and applying
Schroeder’s method.3 Figure 2 shows the main procedure for
reverberation time estimation under this ideal condition. The
inputs are the anechoic signal s(n) and the reverberant signal
x(n), and the output is the estimated reverberation times in
each specific octave band. The sampling frequency of the
anechoic signal used in this paper was 16 kHz, and the rever-
beration time was estimated in 7 octave bands with centre
frequencies of 63, 125, 250, 500, 1000, 2000, and 4000 Hz.
If only the reverberant speech signal can be observed
and the anechoic signal is unknown, the anechoic signal
must be estimated first. In such a case, s(n) is estimated by
dereverberating x(n) on the basis of the maximization of the
third-order moment (skewness) of the linear prediction (LP)
residual. It is known that skewness is more effective as a sta-
tistical basis for dereverberation than the previously used
kurtosis in terms of noise-related degradation.11 Figure 3
shows the diagram of the proposed algorithm for anechoic
speech signal estimation.
Since reverberation affects the LP residual more signifi-
cantly than the LP coefficients, and the LP filter can approxi-
mately remove the vocal tract contribution to the reverberant
speech, the LP residual r(n) is obtained first in Fig. 3 on the
basis of LP analysis of the reverberant speech x(n).11 In the
figure, a(n) is the LP filter and w(n) is the dereverberation
filter (L-tap FIR) adaptively updated according to11
w nþ 1ð Þ ¼ w nð Þ
þ l2
r2 nð ÞEfr2 nð Þg � r nð ÞEfr3 nð ÞgE2:5fr2 nð Þg
r nð Þ;
(3)
where l2 is the step size and vector r(n)¼ [r(n),
r(n�1),…,r(n�Lþ 1)]T. The expected values can then be
calculated recursively using Eqs. (4) and (5):
Efr2ðnÞg ¼ bEfr2ðn� 1Þg þ ð1� bÞr2ðn� 1Þ; (4)
Efr3ðnÞg ¼ bEfr3ðn� 1Þg þ ð1� bÞr3ðn� 1Þ; (5)
where b is the weighing factor in the recursive update which
controls the smoothness of the moment estimation.
TABLE I. The main steps of the NLMS algorithm.
(1) Initialization: hðnÞ¼ [0, 0,…]T, s(n)¼ [0, 0,…]T, choose l1
in the range 0<l1< 1.
(2) Iterate for n> 0:
e(n)¼ x(n) – xðnÞ¼ x(n) – hTðnÞs(n)
hðnþ 1Þ ¼ hðnÞ þ l1
sðnÞsTðnÞsðnÞ eðnÞ
update s(n)¼ [s(n), s(n�1),…, s(n � Mþ 1)]T
with the latest data sample.
1094 J. Acoust. Soc. Am. 139 (3), March 2016 Wu et al.
Redistribution subject to ASA license or copyright; see http://acousticalsociety.org/content/terms. Download to IP: 114.212.232.15 On: Thu, 19 May 2016 08:55:38

The optimal parameters such as the weighing factor b,
the step size l1 and l2 in each algorithm are difficult to select,
and were chosen by trial and error in the paper to ensure that
the algorithms were stable, converged rapidly, and provided
satisfactory performance. The values used in the following
evaluations were b¼ 0.9, l1¼ 0.1, and l2¼ 1� 10�5. The
LP residual was calculated using a 20 tap LP filter where a(n)
was computed with the Levinson-Durbin algorithm. The
frame length and frame shift were 32 and 16 ms, respectively,
and a Hamming window was used as the window function.
Figure 4 illustrates the immediate results of the dere-
verberation by maximizing skewness of the LP residual,
where the data are the same as the data in Fig. 1. Figure 4(a)
shows the LP residual of the reverberant speech [r(n) in Fig.
3], Fig. 4(b) shows the LP residual after maximizing the
skewness [rðnÞ in Fig. 3], and Fig. 4(c) shows the estimated
anechoic speech sðnÞ.After the anechoic speech signal sðnÞ was estimated and
substituted for s(n) in the ideal condition, the reverberation
time in each octave band can be obtained. However, the
presence of background noise is inevitable in real environ-
ments, under the “Idea” condition, the background noise
degrades the performance of the NLMS algorithm, under the
second condition, the background noise not only deteriorates
the performance of the NLMS algorithm but also the per-
formance of the dereverberation algorithm. It has been found
that the background noise alters the positions of the station-
ary points of the skewness-based dereverberation approach
since additive noise shifts the speech signals towards a
Gaussian probability density function.11 Thus the estimation
errors caused by the background noise are larger than that
under the Idea condition. It is known that single-channel der-
everberation technologies can hardly provide errorless
anechoic speech signals, so there might be more bias in the
estimation.
Since the background noise and single-channel dere-
verberation technologies both bring in the errors of RIR esti-
mation, these estimation errors can be treated as noise in the
measured RIR that distorts the reverberation time estimates.
Several noise compensation methods have been proposed
and a simplified version of the Lundeby method was
employed in this paper and is described in Table II.12 The
optimal h in Table II is difficult to determine. A large value
for h excludes the noise distorted part in hðnÞ and truncates
hðnÞ too much resulting in insufficient data for backward
integration; on the contrary, a small value of h provides
more data for reverberation time estimation but with more
noise, resulting in overestimated reverberation time.
Simulations show that h¼ 5–8 is a good choice, and
h¼ 6.5 is used in the rest of the paper. Figure 5 illustrates
the main steps of reverberation time estimation under the
second condition. The length of the adaptive filter w(n) was
chosen to be the same length as that of hðnÞ, which depends
directly on the RIR length and relates to the reverberation
time. It is not easy to select the correct tap length for differ-
ent reverberation times and a small tap length is insufficient
to cover the exponential decay sections of RIRs with high
reverberation time. Thus, a large tap length (32 000) was
selected because this value gives coverage of reverberation
time up to 2.0 s. The truncation method described in Table II
FIG. 1. (Color online) Illustration of RIR estimation under the ideal condition, (a) the anechoic speech, (b) the reverberant speech, (c) the estimated reverber-
ant speech, (d) the estimated RIR.
J. Acoust. Soc. Am. 139 (3), March 2016 Wu et al. 1095
Redistribution subject to ASA license or copyright; see http://acousticalsociety.org/content/terms. Download to IP: 114.212.232.15 On: Thu, 19 May 2016 08:55:38

was used to choose the suitable RIR part for the reverbera-
tion time estimation.
Under the ideal condition, two kinds of anechoic sig-
nals, i.e., white noise and speech, were used for the evalua-
tions. White noise was chosen as it is the commonly used
signal in system identification and the results obtained can
thus provide a comparative reference. Speech was selected
from the TIMIT corpus which contains English sentences
spoken by different male and female speakers and has been
frequently used in the reverberation time estimation litera-
ture.13 As the duration of the original sentences from the
TIMIT corpus are only several seconds, sentences from each
speaker are concatenated to form utterances of 90 s. For the second condition, only speech from the TIMIT corpus is
used. The RIR dataset used in the simulations were real
world measured RIRs from the Aachen Impulse Response
database and included 5 spaces: lecture room, office room,
meeting room, stairway, and Carolina Aula (a renovated
monastery church).14 For the Aachen Impulse Response
database, the positions of the loudspeaker and microphone
are different, for example, the RIRs of the lecture room has
been measured with typical auditorium furniture like desks
and chairs, and the loudspeaker was placed at the lectern and
the microphone was at different rows with increasing
distance to the loudspeaker. Therefore the results shown in
Sec. III have covered the effects of the positions of the loud-
speaker and microphone, which is the average reverberation
time of the room.
FIG. 2. (Color online) Summary of the procedure for reverberation time
estimation under the ideal condition (both anechoic and reverberant signals
are known a priori).
FIG. 3. Diagram of algorithm for anechoic speech estimation based on LP
residual skewness maximization.
FIG. 4. (Color online) Illustration of anechoic speech estimation based on
LP residual skewness maximization, (a) the LP residual of the reverberant
speech, (b) the LP residual after maximizing the skewness, (c) the estimated
anechoic speech.
1096 J. Acoust. Soc. Am. 139 (3), March 2016 Wu et al.
Redistribution subject to ASA license or copyright; see http://acousticalsociety.org/content/terms. Download to IP: 114.212.232.15 On: Thu, 19 May 2016 08:55:38

III. RESULTS AND DISCUSSIONS
The estimation results are presented in Fig. 6, where in
the legends, “Benchmark” represents the correct value calcu-
lated directly from the original RIRs of the Aachen Impulse
Response database and “Speech” indicates the values under
the ideal condition with the anechoic signal being speech,
“White noise” indicates the values under the ideal condition
with the anechoic signal being white noise and “Proposed”
identifies values obtained under the second condition with
only the reverberant speech being known. These graphs
show the mean values along with the error bars calculated on
the basis of 240 independent trials.
The absolute value of relative error (absolute relative
error) er between the “Benchmark” value and the estimated
value is listed in Table III, and was calculated by
er ¼jT60 � �T60j
T60
� 100 %; (6)
where “T60” is the value marked as “Benchmark” bar in Fig.
6 and “ �T60” is the average value of the estimated T60 marked
as “Speech,” “White noise,” and “Proposed” bars in Fig. 6.
Under the ideal condition, white noise was used as the
anechoic signal. For the lecture room and the stairway, the
absolute relative errors are no greater than 0.3%; for the
office room, the absolute relative error at 63 Hz octave band
is 1.1%, the other absolute relative errors are all less than or
equal to 0.3%; for the meeting room, the absolute relative
error at 63 Hz octave band is 2.7%, the other absolute rela-
tive errors are all less than or equal to 0.4%; for the Carolina
Aula, the absolute relative error at 4000 Hz octave band is
0.8%, the other absolute relative errors are within the range
1.3%�6.0%. Therefore, the performance with the white
noise as the anechoic signal is quite accurate and the abso-
lute relative errors are mostly less than 6%.
Under the ideal condition when speech is used as the
anechoic signal, the performance deteriorates. For the lecture
room, the absolute relative error in the 63, 250, 500, 1000,
and 4000 Hz octave bands are less than 1%, but the absolute
relative error at 125 Hz octave band is 19.4%; for the office
room, the absolute relative error for the 63, 250, 500, 1000,
and 4000 Hz octave bands are less than 1.5%, the absolute
relative error at 125 and 2000 Hz octave bands are 5.0%, and
7.3%, respectively; for the meeting room, the absolute rela-
tive error in the 63, 250, 500, and 1000 Hz octave bands are
less than 2.5%, the absolute relative error at 125 and
2000 Hz octave bands are 20.5% and 17.9%, respectively;
for the stairway, the absolute relative errors for the 125, 250,
500, 1000, and 2000 Hz octave bands are less than 9%, the
absolute relative error at 63 and 4000 Hz octave bands are
51.4% and 12.8%, respectively; for the Carolina Aula, the
absolute relative error from 125 to 4000 Hz octave band is
within the range 1.3%�7.5%, while the absolute relative
error at 63 Hz octave band is 16.1%. The performance that
uses speech as the anechoic signal is somehow acceptable
with most absolute relative errors less than 10%.
The error bars in Fig. 6 show that the variance of the
estimated reverberation time using speech is greater than
that using white noise under the ideal condition because the
statistical characteristics of white noise are stationary while
the speech signal is non-stationary and the randomly selected
sentences from TIMIT database lead to larger variance in the
estimation. The results from Fig. 6 and Table III confirm that
if the anechoic and reverberant speech signals are known apriori, reverberation time estimation based on the RIR iden-
tification is feasible and reliable.
Under the second condition where only reverberant
speech is used, the maximum absolute relative errors of the
five different rooms all occurred at the 63 Hz octave band
and the absolute relative errors are more than 80%. For the
lecture room, the absolute relative errors in the 125, 250,
1000, 2000, and 4000 Hz octave bands are all less than 25%;
for the office room, the absolute relative errors excepting
that of the 63 Hz octave band are all less than 25% and the
TABLE II. A simplified Lundeby room impulse response truncation method for noise compensation.
(1) Calculate the squared amplitude of hðnÞ and translate it to the logarithmic scale, i.e., vðnÞ ¼ 10 log10h2ðnÞ.
(2) Segment v(n) into frames of length 30 ms and compute the average [�vðkÞ, k is the frame index] of each frame.
(3) Estimate the noise level of the last 10% frames because the amplitude of noise-free RIR tail is very small and the estimation errors dominate the tail of the
impulse response hðnÞ.(4) Find the frame index k from tail to the head where �vðkÞ exceeds that of the estimated noise level by a certain amount (defined h dB here).
(5) Utilize the truncated part from the first frame to the kth frame of hðnÞ as the input of the standard Schroeder method to estimate reverberation time.
FIG. 5. (Color online) Approach to reverberation time estimation under the
second condition (only the reverberant signal is known a priori).
J. Acoust. Soc. Am. 139 (3), March 2016 Wu et al. 1097
Redistribution subject to ASA license or copyright; see http://acousticalsociety.org/content/terms. Download to IP: 114.212.232.15 On: Thu, 19 May 2016 08:55:38

absolute relative errors in the 500, 1000, and 2000 Hz octave
bands are even less than 3.0%; for the meeting room, the
absolute relative errors in the 250 and 4000 Hz octave bands
are less than 12% and the others are within the range
30%�48%; for the stairway, the absolute relative errors for
the 250, 500 1000, and 2000 Hz octave bands are less than
15%; for the Carolina Aula, the absolute relative errors in
the 125, 250, 500, and 1000 Hz octave bands are within the
range 20%�40%. In comparison with the error bars in Fig.
6, the estimation variance under the second condition is
much larger than that under the ideal condition, therefore, a
larger number of estimations should be carried out and aver-
aged to obtain a reliable reverberation time in practical
measurements.
The average of the absolute relative errors over the five
spaces in 7 octave bands is calculated and plotted in Fig. 7.
The average of the absolute relative errors under the ideal con-
dition with white noise are all less than 2%, but become less
than 15% when the anechoic signal is speech. The largest error
occurs in the low frequency bands (such as the 63 and 125 Hz
bands) and the high frequency band (4000 Hz). The reason for
this is that the energy of speech signals is predominantly in the
range 300�3400 Hz so there is insufficient signal for identify-
ing the RIR accurately in the frequency bands outside that
range. Under the second condition, the average of the absolute
relative errors is generally larger than 20%. This is because
there is insufficient information from the single-channel RIR
identification, hence the precision of the estimated RIR is lim-
ited and the relative error under the second condition is larger
than that achieved under the ideal condition.
To further verify the performance under the second con-
dition, the reverberation time of two different meeting rooms
FIG. 6. (Color online) Reverberation time estimation for 5 different spaces: (a) lecture room, (b) office room, (c) meeting room, (d) stairway, and (e) Carolina
Aula.
1098 J. Acoust. Soc. Am. 139 (3), March 2016 Wu et al.
Redistribution subject to ASA license or copyright; see http://acousticalsociety.org/content/terms. Download to IP: 114.212.232.15 On: Thu, 19 May 2016 08:55:38

in RMIT University were measured. The first meeting room
was a normal “shoe-box” shape with 4.7 m (long)� 2.9 m
(wide)� 2.7 m (high), and the second measured room,
named “Fabpod,” is a non-regular meeting pod with an open
ceiling.15 The walls of the approximately 4 m� 4 m� 3 m
Fabpod are curved and made of a number of hyperboloid
cells. The experimental settings are shown in Fig. 8 and the
height of both the sound source and the microphone for the
measurements are 1.2 m. The system is first calibrated at
94 dB at 1000 Hz with a B&K type 4231 calibrator. The
impulse response was measured using the exponential
sweep frequency approach and the B&K Dirac 6.0 software.
The signal was generated by that software package, and
reproduced through a power amplifier (Nor 280) and omni-
directional sound source (Norsonic Nor 276). The reverber-
ant signal was captured using a B&K type 4189 microphone
and analysed by the Dirac software. The measurements were
repeated 30 times and the impulse responses were recorded
with reverberation times then computed from the impulse
responses in the individual octave bands from 63 to 4000 Hz.
The reverberation time obtained from the measurements
and the proposed method is shown in Fig. 9. From the error
bars, it can be seen that the fluctuation of measurement values
in the 63 Hz octave band is larger than that of the other 6
octave bands. The error between the measurement and pro-
posed method for the 63 Hz octave band is also larger than
that in the remaining bands; as mentioned previously, this is
predominantly caused by the main energy of speech signal
being concentrated above 300 Hz and it is thus difficult to esti-
mate the RIR component reliably in the 63 Hz octave band. In
comparison with the measurements, the error bars show that
the estimation fluctuation of the proposed method is larger
than that of the measurements. The absolute relative errors of
the 7 octave bands in the shoe-box shape meeting room are
61.5%, 6.3%, 19.2%, 19.4%, 8.5%, 8.6%, and 13.4%, respec-
tively, while those in the Fabpod are 64.3%, 5.0%, 4.2%,
8.5%, 21.9%, 4.6%, and 11.1%, respectively. Because there is
no explicit statement for the acceptable error margin when
estimating T60 in the standards such as ISO 3382, it is hard to
claim whether the estimation error is too large or not.3 The
results show that for the environments with medium-range
reverberation times such as the office room in Figs. 6(b), 6(d),
and 9(a), the proposed method is able to provide reasonable
estimation for the 250, 500, 1000, and 2000 Hz octave bands
with an absolute relative error less than 20%.
TABLE III. Absolute relative error (%) for speech, white noise, and the pro-
posed cases (reverberant speech only).
Octave band centre frequency (Hz) 63 125 250 500 1000 2000 4000
Lecture room Speech 0.9 19.4 0.4 0.0 0.2 3.5 0.7
White noise 0.3 0.3 0.2 0.2 0.2 0.2 0.2
Proposed 85.9 15.2 21.4 40.2 23.8 25.0 7.3
Office room Speech 1.5 5.0 0.0 0.0 0.1 7.3 1.2
White noise 1.1 0.3 0.3 0.1 0.1 0.1 0.3
Proposed 78.7 24.4 15.7 2.1 0.5 3.0 7.0
Meeting room Speech 2.3 20.5 0.3 0.0 0.1 17.9 6.8
White noise 2.7 0.4 0.2 0.2 0.2 0.3 0.3
Proposed 77.7 33.6 11.3 43.8 47.5 40.0 2.9
Stairway Speech 51.4 8.9 0.1 0.0 0.0 5.4 12.8
White noise 0.2 0.3 0.1 0.1 0.1 0.1 0.1
Proposed 81.7 41.4 16.1 9.6 14.8 11.9 51.8
Carolina Aula Speech 16.1 3.8 3.6 6.0 2.2 1.3 7.5
White noise 5.9 2.5 3.5 6.0 2.6 1.3 0.8
Proposed 94.6 32.4 38.8 28.8 21.5 45.9 53.8
FIG. 7. (Color online) Frequency dependent relative error under the two
conditions (averaged over five spaces).
FIG. 8. (Color online) Reverberation time measurement setup in (a) “shoe-
box” shape meeting room and (b) Fabpod.
J. Acoust. Soc. Am. 139 (3), March 2016 Wu et al. 1099
Redistribution subject to ASA license or copyright; see http://acousticalsociety.org/content/terms. Download to IP: 114.212.232.15 On: Thu, 19 May 2016 08:55:38

IV. CONCLUSIONS
Under the ideal condition where both the anechoic and
reverberant signals are known a priori, a system identification
scheme can be used to identify the RIR and then reverberation
time can be estimated. If only the reverberant speech signal is
observed and available, an approach to identify RIR blindly
based on the skewness of LP residual maximization has been
presented for reverberation time estimation. Simulations show
that under the ideal condition, using speech and white noise
as the anechoic signal the technique can estimate the reverber-
ation time reliably, and the average relative error in 7 octave
bands are mainly less than 15%. Under the second condition,
where only the reverberant speech signal is available, the esti-
mation accuracy is worse than that under the ideal condition.
The average relative error in the 63 Hz octave band is greater
than 80%, the other relative errors are mainly within the inter-
val 20%�30%, and the fluctuation of the estimated reverbera-
tion time from the proposed method is larger than those
achieved under the ideal condition. The relative error in low
frequency octave bands is usually larger than that in high
octave bands. Reverberation time measurements in real rooms
verified these findings.
There are still some challenges that require further
work. For example, define an effective measure to evaluate
the mismatch between the estimated room impulse responses
and the idea ones, this measure will help to remove the big
outliers of the reverberation time estimation; Improve the
blind reverberation time estimation performance with back-
ground noise, if the background noise is seen as the additive,
then some speech enhancement methods may be used to
remove the background noise to a certain extent, i.e., a noise
cancelling can be carried out before the dereverberation.
ACKNOWLEDGMENTS
This project was funded by National Science
Foundation of China (11504176, 11474163) and the Priority
Academic Program Development of Jiangsu Higher
Education Institutions. This research was also supported
under Australian Research Council’s Linkage Projects
funding scheme (LP140100987). Thanks for Sipei Zhao’s
help on the measurements in RMIT University.
1H. Kuttruff, Room Acoustics, 5th ed. (Taylor & Francis, New York, 2009),
Chap. 3, pp. 67�100.2N. R. Shabtai, B. Rafaely, and Y. Zigel, “The effect of reverberation on
the performance of cepstral mean subtraction in speaker verification,”
Appl. Acoust. 72, 124�126 (2011).3ISO 3382:1997, Acoustics—Measurement of the reverberation time ofrooms with reference to other acoustical parameters, 2nd ed. (International
Organization for Standardization, Geneva, Switzerland, 1997).4R. Dragonetti, C. Ianniello, and R. A. Romano, “Reverberation time mea-
surement by the product of two room impulse responses,” Appl. Acoust.
70, 231�243 (2009).5R. Ratnam, D. L. Jones, B. C. Wheeler, W. D. O’Brien, Jr., C. R. Lansing,
and A. S. Feng, “Blind estimation of reverberation time,” J. Acoust. Soc.
Am. 114(5), 2877�2892 (2003).6H. W. L€ollmann, E. Yilmaz, M. Jeub, and P. Vary, “An improved algo-
rithm for blind reverberation time estimation,” in Proceedings of Int.Workshop Acoust. Echo Noise Control, Tel Aviv, Israel (2010).
7P. Kendrick, N. Shiers, R. Conetta, T. J. Cox, B. M. Shield, and C.
Mydlarz, “Blind estimation of reverberation time in classrooms and hospi-
tal wards,” Appl. Acoust. 73, 770�780 (2012).8H. W. L€ollmann and P. Vary, “Estimation of the frequency dependent
reverberation time by means of warped filter-banks,” in Proceedings ofthe IEEE International Conference on Acoustics, Speech, and SignalProcessing, Prague, Czech Republic (2011).
9L. Wu, X. Qiu, I. Burnett, and Y. Guo, “Reverberation time estimation
from speech signals based on blind room impulse response identification,”
J. Acoust. Soc. Am. 138(2), 731�734 (2015).10ANSI S1.11-1986, Specification for Octave-Band and Fraction-Octave-
Band Analog and Digital Filters (American National Standards Institute,
Washington, DC, 1986).11S. Mosayyebpour, H. Sheikhzadeh, T. A. Gulliver, and M. Esmaeili,
“Single-microphone LP residual skewness-based inverse filtering of the
room impulse response,” IEEE Trans. Audio Speech Lang. Process. 20(5),
1617�1632 (2012).12A. Lundeby, T. E. Vigran, H. Bietz, and M. Vorlander, “Uncertainties of
measurements in room acoustics,” Acustica 81(4), 344�355 (1995).13J. S. Garofolo, Getting Started with the DARPA TIMIT CD-ROM: An
Acoustic-Phonetic Continuous Speech Database (National Institute of
Standards and Technology, Gaithersburg, MD, 1993).14M. Jeub, M. Schafer, and P. Vary, “A binaural impulse response database
for evaluation of dereverberation algorithms,” in Proceedings of Intl.Conf. Digital Signal Process., Santorini, Greece (2009).
15S. Zhao, X. Qiu, E. Cheng, I. Burnett, N. Williams, J. Burry, and M.
Burry, “Sound quality inside small meeting rooms with different room
shape and fine structures,” Appl. Acoust. 93, 65�74 (2015).
FIG. 9. (Color online) Performance comparison between the real reverbera-
tion time measurements and the proposed method in (a) “shoe-box” shape
meeting room and (b) Fabpod.
1100 J. Acoust. Soc. Am. 139 (3), March 2016 Wu et al.
Redistribution subject to ASA license or copyright; see http://acousticalsociety.org/content/terms. Download to IP: 114.212.232.15 On: Thu, 19 May 2016 08:55:38