unc teacher quality research
TRANSCRIPT

UNC Teacher Quality Research
Teacher Preparation Program
Effectiveness Report
April 2015
Authors:
Kevin C. Bastian
Tina M. Patterson
Yi Pan

UNC Teacher Quality Research
2015 Teacher Preparation Program Effectiveness Report
Kevin C. Bastian
University of North Carolina at Chapel Hill
Education Policy Initiative at Carolina
Tina M. Patterson
University of North Carolina at Chapel Hill
Education Policy Initiative at Carolina
Yi Pan
University of North Carolina at Chapel Hill
Frank Porter Graham Child Development Institute

Contents
Acknowledgements ........................................................................................................................................ i
Introduction ................................................................................................................................................... 1
Data and Sample ........................................................................................................................................... 2
Coding of UNC System Initially-Prepared Teachers ................................................................................ 2
Research Sample ....................................................................................................................................... 3
Full Sample ........................................................................................................................................... 3
Teacher Value-Added ........................................................................................................................... 5
Teacher Evaluation Ratings .................................................................................................................. 6
Dependent Variables ................................................................................................................................. 6
Teacher Value-Added ........................................................................................................................... 6
Teacher Evaluation Ratings .................................................................................................................. 6
Covariates ................................................................................................................................................. 6
Analysis Plan ................................................................................................................................................ 7
Value-Added Analyses ............................................................................................................................. 7
Evaluation Rating Analyses ...................................................................................................................... 8
Selection vs Preparation Analyses ............................................................................................................ 8
Results ......................................................................................................................................................... 11
Value-Added Results .............................................................................................................................. 11
Appalachian State University (ASU) .................................................................................................. 23
East Carolina University (ECU) ......................................................................................................... 23
Elizabeth City State University (ECSU) ............................................................................................. 23
Fayetteville State University (FSU) .................................................................................................... 23
North Carolina A&T State University (NCAT) .................................................................................. 23
North Carolina Central University (NCCU) ....................................................................................... 24
University of North Carolina – Asheville (UNCA) ............................................................................ 24
University of North Carolina – Chapel Hill (UNCCH) ...................................................................... 24
University of North Carolina – Charlotte (UNCC) ............................................................................. 25
University of North Carolina – Greensboro (UNCG) ......................................................................... 25
University of North Carolina – Pembroke (UNCP) ............................................................................ 25
University of North Carolina – Wilmington (UNCW) ....................................................................... 25

Western Carolina University (WCU) .................................................................................................. 26
Winston-Salem State University (WSSU) .......................................................................................... 26
Selection vs Preparation ...................................................................................................................... 26
Evaluation Rating Results ....................................................................................................................... 28
Appalachian State University (ASU) .................................................................................................. 36
East Carolina University (ECU) ......................................................................................................... 36
Elizabeth City State University (ECSU) ............................................................................................. 36
Fayetteville State University (FSU) .................................................................................................... 37
North Carolina A&T State University (NCAT) .................................................................................. 37
North Carolina Central University (NCCU) ....................................................................................... 37
North Carolina State University (NCSU) ........................................................................................... 37
University of North Carolina – Asheville (UNCA) ............................................................................ 37
University of North Carolina – Chapel Hill (UNCCH) ...................................................................... 37
University of North Carolina – Charlotte (UNCC) ............................................................................. 38
University of North Carolina – Greensboro (UNCG) ......................................................................... 38
University of North Carolina – Pembroke (UNCP) ............................................................................ 38
University of North Carolina – Wilmington (UNCW) ....................................................................... 38
Western Carolina University (WCU) .................................................................................................. 38
Winston-Salem State University (WSSU) .......................................................................................... 38
Selection vs Preparation ...................................................................................................................... 39
Conclusion .................................................................................................................................................. 40
Appendix ..................................................................................................................................................... 42

i
Acknowledgements
We wish to recognize Dan Cohen-Vogel and Eric Zwieg with the University of North Carolina
General Administration (UNC-GA) for their vital contributions in providing data.
We also wish to thank Alisa Chapman, Vice President of Academic and University Programs at
the UNC-GA, and the deans and department heads from the colleges, schools, and departments
of education at the 15 UNC system institutions engaged in teacher education for their valuable
input and continued collaboration. Finally, we wish to acknowledge the editing and formatting
work done by Elizabeth D’Amico, who is responsible for the overall look and polish of the
report. All authors accept responsibility for any remaining errors.
Education Policy Initiative at Carolina (EPIC)
University of North Carolina at Chapel Hill
Abernethy Hall, CB #3435, Chapel Hill, NC 27599-3435
919-962-0668 publicpolicy.unc.edu

1
Introduction
This report, produced in collaboration with the UNC General Administration (UNC-GA),
presents the fourth1 set of results assessing the performance of North Carolina public school
(NCPS) teachers who received their initial preparation at UNC system institutions. The UNC-
GA established this research agenda in 2009 to quantify the impact of UNC system teacher
preparation programs on student and teacher outcomes and to assist UNC system institutions in
the evaluation and improvement of their teacher education programs. Generating quantitative
estimates of program effectiveness allows UNC system institutions to see where their program
graduates perform well, identifies programs that need improvement, provides a starting point for
inquiry about program characteristics that impact teacher performance, and encourages teacher
preparation programs to become better consumers of data and to undertake data-driven reforms.
This program effectiveness analysis fits into the larger body of research undertaken by the
Education Policy Initiative at Carolina (EPIC) and the UNC-GA designed to assess the impact of
teacher preparation and to provide evidence for program improvement. Furthermore, this body
of research is well-aligned with the current efforts of both the Council for the Accreditation of
Educator Preparation and the federal government to strengthen teacher preparation programs.
Consistent with past analyses, the main purpose of this report is to estimate the adjusted
average test score gains for North Carolina public school students taught by teachers initially
prepared at UNC system institutions. To best inform programs, we estimate these value-added
models across grade levels/subject areas, with multiple analysis methods, for subgroups of
academically at-risk students, and controlling for a measure of teacher academic ability, to
separate the impact of selection into teacher preparation programs from the quality of preparation
received therein. For the first time, this report also estimates the adjusted average evaluation
ratings for UNC system institution initially prepared teachers. These evaluation ratings are
available for a large percentage of teachers and measure important aspects of teaching—
demonstrating leadership, establishing a respectful classroom environment, content knowledge,
facilitating student learning, and reflecting on practice—that are not fully captured by student
test score gains. These two outcomes are policy relevant and together, they provide a more
comprehensive view of teacher performance.
We estimated two sets of models for this program effectiveness research: (1) overall
models comparing the performance of initially prepared graduates from UNC system institutions
to all other, non-UNC system prepared teachers in the state and (2) institution specific models
comparing the performance of initially prepared graduates of each UNC system institution to 11
other categories of teacher preparation, including teachers prepared at North Carolina private
colleges and universities, teachers prepared out-of-state, Teach For America corps members, and
teachers entering the profession alternatively. These two approaches serve different purposes.
The first set of models allows comparisons between each UNC system institution and a common
1 For prior program effectiveness reports, please see:
http://publicpolicy.unc.edu/files/2014/02/ImpactTeacherPrepPro_Jan2010_Final.pdf
http://publicpolicy.unc.edu/files/2014/02/TeacherPrepEffectRpt_Final_2011.pdf
http://publicpolicy.unc.edu/files/2013/11/UNC_TQR_OverallProgramReport_Final.pdf

2
reference group representing the average of all other types of teacher preparation. This analysis
is the focus of this report. The second set of models specifies each UNC system institution as a
reference group and makes direct comparisons between initially prepared graduates of the
reference institution and teachers entering the profession through one of 11 other categories of
preparation. We provide results from this second set of models to each UNC system institution
in a separate institution specific report.
In the following sections, we first detail our coding of UNC system initially prepared
teachers, our research sample, and the variables used in analyses. Next, we describe our analysis
plan for value-added and evaluation rating models. Finally, for each UNC system institution, we
present value-added and evaluation rating results and conclude with a summary of the findings.
Data and Sample
Coding of UNC System Initially-Prepared Teachers
To identify graduates/completers of UNC system teacher preparation programs we relied
on undergraduate, graduate level, and licensure completion data from the UNC-GA. These files
detail individuals’ enrollment and graduation status, academic major(s), and whether they
completed requirements for licensure. For our analyses we sought to identify those individuals
who were initially prepared to teach—at the undergraduate, graduate, or licensure only levels—
by a UNC system institution prior to entry into the teaching profession. Initially prepared
teachers include: (1) those graduating with an undergraduate education degree or those earning a
teaching licensure concurrent with a non-education undergraduate degree; (2) those graduating
with a graduate level education degree resulting in an initial licensure (e.g. Master of Arts in
Teaching) or those earning an initial teaching licensure concurrent with a non-education graduate
degree; and (3) those completing their initial requirements to teach through a licensure only
program. This coding structure differs from earlier versions of our program effectiveness
research, which only classified initially prepared undergraduates as UNC system prepared
teachers. We prefer the new coding structure, as it allows for a more comprehensive assessment
of the performance of institutions’ graduates. However, to maintain consistency with prior
program effectiveness research, we report results for UNC system institutions limited to their
initially prepared undergraduates in the appendix. Table 1 identifies each of these institutions and
their corresponding abbreviations used throughout this report.

3
Table 1: UNC System Institution Abbreviations
UNC System Institution Abbreviation
Appalachian State University ASU
East Carolina University ECU
Elizabeth City State University ECSU
Fayetteville State University FSU
North Carolina Agricultural and Technical State University NCAT
North Carolina Central University NCCU
North Carolina State University NCSU
University of North Carolina – Asheville UNCA
University of North Carolina – Chapel Hill UNCCH
University of North Carolina – Charlotte UNCC
University of North Carolina – Greensboro UNCG
University of North Carolina – Pembroke UNCP
University of North Carolina – Wilmington UNCW
Western Carolina University WCU
Winston-Salem State University WSSU
Research Sample
Full Sample: Our full teacher sample consists of all North Carolina public school
(NCPS) teachers with less than five years of experience in the 2008-09 through 2012-13
academic years. We limit our sample to these early-career teachers to assess the performance of
recent program graduates and because the impact of teacher preparation diminishes over time, as
teachers learn from classroom experience, principal and peer feedback, and professional
development.
Initially prepared UNC system institution graduates comprise approximately one-third of
the full teacher sample. To provide additional information about these UNC system institution
graduates, Table 2 displays characteristics of the schools in which these early-career teachers
work during our study period. Overall, this table shows that, across institutions, there are
pronounced differences in the types of schools in which graduates work. For example, relative
to other UNC system institutions: (1) initially prepared graduates from NCSU are highly
concentrated in high schools; (2) initially prepared graduates from FSU, NCAT, NCCU, UNCP,
and WSSU work in schools with high concentrations of racial/ethnic minority students; and (3)
initially prepared graduates from ASU, NCSU, UNCA, and UNCCH work in schools with higher
student performance composites.

4
Table 2: School Characteristics for UNC System Initially Prepared Teachers (2008-09 through 2012-13) School
Characteristic ASU ECU ECSU FSU NCAT NCCU NCSU UNCA UNCCH UNCC UNCG UNCP UNCW WCU WSSU
School Size 709.46 686.49 508.87 702.30 786.09 725.06 1159.44 710.96 841.17 776.51 708.46 663.12 715.43 607.11 626.12
% Free or Reduce-
Price Lunch 56.08 62.08 65.74 65.04 65.63 64.42 43.14 55.05 47.34 55.03 61.55 73.12 57.05 59.07 74.98
Minority
Percentage 36.22 56.41 55.65 68.60 68.76 73.61 48.05 32.14 52.21 49.57 54.03 68.07 46.85 28.76 71.77
Short-Term
Suspension Rate 14.50 22.38 25.55 26.94 24.52 19.51 22.68 14.91 13.10 15.91 14.94 26.88 16.62 14.06 31.00
Violent Acts Rate 7.59 6.93 5.84 9.65 11.96 8.51 11.82 10.74 7.46 7.45 7.41 6.52 5.98 7.82 12.66
Per-Pupil
Expenditures 8541.04 9478.21 9731.66 9124.77 9412.22 9322.79 7850.19 8691.51 8643.75 8953.86 8826.66 8933.79 8550.05 8999.09 10790.93
Novice Teacher
Percentage 20.65 23.81 20.87 27.50 24.22 25.05 21.65 19.91 23.88 23.24 22.37 24.85 22.64 20.33 23.91
NBC Teacher
Percentage 15.02 12.73 13.53 6.43 10.95 10.75 15.39 18.11 15.78 13.94 12.39 8.19 13.14 17.06 9.40
Returning Teacher
Percentage 82.79 80.33 80.06 78.33 78.92 77.25 81.34 83.51 81.07 80.51 81.47 79.06 81.39 83.43 77.50
AYP Percentage 52.86 52.02 51.32 48.78 50.11 46.19 58.00 53.17 52.62 54.47 52.37 49.19 50.95 55.69 51.35
Performance
Composite 70.34 64.63 61.47 63.13 60.27 60.78 70.96 70.45 71.34 68.59 64.74 61.13 68.79 69.51 55.52
Principal
Experience 5.78 5.47 5.25 5.54 6.03 5.43 6.33 5.85 5.86 5.85 5.89 5.52 5.67 5.86 5.89
Urbanicity
City 21.73 18.11 6.24 48.53 61.73 57.77 43.51 20.94 41.92 34.66 42.46 16.61 33.96 12.37 68.48
Suburb 15.49 4.53 1.22 10.36 6.34 8.90 8.95 30.30 20.34 15.43 7.90 4.70 12.02 21.82 3.92
Town 8.64 14.85 19.22 10.87 5.81 6.11 8.28 9.36 5.77 5.54 10.61 23.56 8.58 9.51 6.81
Rural 54.14 62.51 73.32 30.24 26.11 27.23 39.26 39.41 31.96 44.37 39.03 55.13 45.45 56.30 20.78
School Type Elementary/Elem-
Middle Combo 53.61 61.86 59.95 57.11 42.59 58.60 19.62 46.01 54.10 66.68 60.55 64.27 61.79 54.66 61.62
Middle School 18.82 15.61 17.48 18.55 18.30 18.67 26.25 15.83 15.87 15.61 17.08 11.57 16.17 17.08 16.67
High School 26.87 21.97 22.09 23.90 38.17 22.73 54.00 37.67 29.72 16.84 21.85 23.99 21.56 26.05 20.20
Other 0.70 0.57 0.49 0.45 0.95 0.00 0.13 0.49 0.31 0.88 0.52 0.17 0.48 2.21 1.52
Teacher-by-
School Year
Count
8984 9861 824 1569 951 1157 3935 815 2621 5797 6682 2376 4986 3443 594
Note: This table displays school-level characteristics for all UNC system initially prepared teachers with less than five years’ experience in the 2008-09 through 2012-13 academic years.

5
As detailed in the sections below, not all of these initially prepared UNC system
institution teachers will be included in our value-added or evaluation rating analyses—due to not
teaching a tested grade/subject area or not being evaluated by their school administrator during
the study period. Therefore, for the 2012-13 school year, Table 3 provides a snapshot, by UNC
system institution, of the total number of initially prepared teachers working in NCPS, the total
number of initially prepared teachers with less than five years of experience, the total number of
those early-career teachers evaluated by a school administrator, and the total number of those
early-career teachers teaching a tested grade/subject area. Overall, 91 percent of the initially
prepared teachers with less than five years of experience were evaluated by a school
administrator and 37 percent of these initially prepared teachers taught in a tested grade/subject
area.
Table 3: Counts of UNC System Initially Prepared Teachers for the 2012-13 School Year
UNC
Teacher
Preparation
Program
All Initially Prepared Teachers in 2012-13
All Teachers
Less than 5
Years’
Experience
Less Than 5
Years’ Experience
and a Teacher
Evaluation Rating
Less Than 5 Years’
Experience and
Teaching a Tested-
Grade/Subject-Area
ASU 6209 1810 1648 665
ECU 6175 2022 1858 745
ECSU 621 171 155 59
FSU 1013 277 257 113
NCAT 635 197 186 57
NCCU 751 219 186 79
NCSU 2014 934 856 359
UNCA 443 179 166 74
UNCCH 1714 481 446 207
UNCC 3273 1201 1085 472
UNCG 3868 1357 1263 469
UNCP 1603 480 426 156
UNCW 3053 970 904 402
WCU 2338 752 681 261
WSSU 538 144 135 51 Note: By UNC system institution, this table displays unique teacher counts in the 2012-13 school year.
Teacher Value-Added: To estimate the impact of teachers initially prepared by UNC
system institutions on adjusted average student test score gains, we analyzed the five most recent
years of available data, 2008-09 through 2012-13. Further, we limited our value-added analyses
to teachers with less than five years of experience during the study period. We report results
from 10 grade level/subject area value-added models: End-of-Grade (EOG) exams in elementary
grades mathematics, reading (grades 4 and 5), and science (grade 5 only); EOG exams in middle
grades mathematics, reading (grades 6-8), and science (grade 8 only); an End-of-Course (EOC)
exam for algebra I taken in middle grades (grades 6-8); and EOC exams for high school algebra

6
I, biology, and English I/II.2 Due to the elimination of several EOC exams in North Carolina, we
no longer report value-added results for the following high school subject-areas: algebra II,
geometry, chemistry, physical science, physics, U.S. history, and civics.
Teacher Evaluation Ratings: To assess the impact of UNC system teacher preparation
programs on the evaluation ratings of their initially prepared teachers, we used North Carolina
Educator Evaluation System (NCEES) data from 2010-11 through 2012-13. As with our value-
added analyses, we limited these models to all teachers with less than five years of experience
during the study period. We report evaluation rating results for the five North Carolina
Professional Teaching Standards (NCPTS) that are directly assessed by school administrators:
teachers demonstrate leadership (Standard 1), teachers establish a respectful environment for a
diverse group of students (Standard 2), teachers know the content they teach (Standard 3),
teachers facilitate learning for their students (Standard 4), and teachers reflect on their practice
(Standard 5). For these analyses we estimated an evaluation rating model across all school
levels, combined, and then performed analyses for elementary, middle, and high schools,
separately.
Dependent Variables
Teacher Value-Added: The outcome variable for these analyses is students’ current test
score performance on EOG exams in elementary grades mathematics, reading (grades 4 and 5),
and science (grade 5 only); EOG exams in middle grades mathematics, reading (grades 6-8) and
science (grade 8 only); and EOC exams in algebra I, biology, and English I/II. To remove any
temporal trends we standardized all EOG exam scores within subject, grade, and year and all
EOC exam scores within subject and year.
Teacher Evaluation Ratings: The outcome variable for these analyses is teachers’
evaluation ratings on the five NCPTS directly assessed by school administrators. To evaluate
teachers, school administrators use formal classroom observations and paper-based evidences to
document key teaching behaviors and rate teachers at one of five performance levels: not
demonstrated, developing, proficient, advanced, or distinguished.3
Covariates
The focal variables in our value-added and evaluation rating analyses are a set of 15
indicators identifying whether an individual was initially prepared to teach at a specific UNC
system institution. To adjust for factors influencing teacher performance outside of the control
of these teacher preparation programs, we used a rich set of covariates. For both our value-added
and evaluation rating analyses we included year fixed effects to adjust for temporal trends in the
data. In our value-added models we controlled for the student, classroom, teacher, and school
characteristics shown in Table 4. For our evaluation rating models, we included teacher
experience variables and all of the school characteristics listed in Table 4.
2 In 2008-09 through 2011-12 North Carolina assessed high school students with an End-of-Course exam in English
I (typically taken by students in 9th
grade). In 2012-13 North Carolina assessed high school students with an EOC
exam in English II (typically taken by students in 10th
grade). 3For these analyses, Not demonstrated=1; Developing=2; Proficient=3; Advanced=4; and Distinguished=5.

7
Table 4: Covariates Used in Models
Student Classroom & Teacher School 1. Prior test scores in math
and reading
2. Classmates prior test
scores
3. Days absent
4. Structural mobility
5. Between-year mobility
6. Within-year mobility
7. Gender
8. Race/ethnicity
9. Poverty
10. Gifted
11. Disabled
12. Currently limited English
proficient
13. Previously limited English
proficient
14. Overage for grade
15. Underage for grade
16. Years of teaching experience
17. Teaching out-of-field
18. Number of students
19. Advanced curriculum (MS
and HS only)
20. Remedial curriculum (MS and
HS only)
21. Dispersion of prior test scores
22. School size
23. School size squared
24. Suspension rate
25. Violent acts rate
26. Total per-pupil expenditures
27. District teacher salary
supplements
28. Racial/ethnic composition
29. Concentration of poverty
Note: We include these covariates in our value-added models—both multi-level models and school fixed effects models. We
control for teaching experience and all school characteristics in our teacher evaluation rating models.
Analysis Plan
Value-Added Analyses
To estimate the impact of teachers initially prepared by UNC system institutions on the
adjusted average test score gains of NCPS students, we specified multi-level (student, classroom,
and school-by-year levels) models—which adjust for dependence in the data at both the
classroom and school-by-year levels—with a rich set of student, classroom/teacher, and school
covariates (Table 4). In these models all non-UNC system initially prepared teachers4 are the
reference group and we include 15 indicator variables for initially prepared graduates from each
UNC system institution. Coefficients for these UNC system indicators show the adjusted
average difference in achievement between students taught by initially prepared graduates of a
specific UNC system institution and students taught by non-UNC system initially prepared
teachers.
We prefer these rich covariate adjustment multi-level models because they allow us to
make statewide teacher effectiveness comparisons. However, to adjust for unmeasured school
characteristics and regional teacher labor markets that may bias teacher preparation program
estimates, we specified additional models with school fixed effects. These models limit teacher
effectiveness comparisons to teachers working in the same school during the study period.
While this approach may appropriately account for bias in the multi-level model estimates, there
are two concerns with school fixed effects: (1) schools without non-UNC system initially
4 This includes teachers prepared at North Carolina private and independent colleges and universities, out-of-state
prepared teachers, Teach For America corps members, Visiting International Faculty, and alternative entry teachers.

8
prepared teachers do not contribute to the teacher effectiveness estimates and schools without
graduates of a specific UNC system institution do not contribute to the results for that institution
and (2) if a school employs teachers of similar effectiveness there will be little within-school
variation with which to estimate differences in teacher performance. To allow for direct
comparisons of the results, we display our multi-level model estimates in the body of this report
and our school fixed effects estimates in the appendix.
In addition to our main value-added results, which detail the impact of UNC system
institution initially prepared teachers on all the students in their classes, we estimated a series of
models focusing on three student subgroups: (1) free and reduced-price lunch students; (2) racial
and ethnic minority students; and (3) low-performing students—defined as students with prior
scores more than one standard deviation below the statewide mean in the analyzed subject
area.5, 6
For these analyses we kept observations for students in the specified subgroup and then
compare the adjusted average achievement gains for students taught by UNC system institution
initially prepared teachers versus students taught by non-UNC system initially prepared teachers.
Results from these models address concerns regarding success with academically at-risk students
and importantly, may provide teacher preparation programs with finer grained evidence to
inform program improvement efforts.
Evaluation Rating Analyses
Since only a minority of teachers teach in a tested grade/subject area and many important
aspects of teaching will not be fully captured by teachers’ value-added to student achievement,
we estimated the impact of UNC system institutions on the evaluation ratings of their initially
prepared teachers. For each NCPTS, we specified an ordered logistic regression model with
standard errors clustered at the school-by-year level and controls for teacher experience and
school characteristics. These models compare the adjusted average evaluation ratings of non-
UNC system initially prepared teachers (reference group) with those of initially prepared
graduates from each UNC system institution. Coefficients for the UNC system indicators report
the odds of being rated higher on the evaluation standard relative to non-UNC system initially
prepared teachers. To ease the interpretability of these results, we also display predicted
probabilities for rating at Levels II-V (developing to distinguished) of the NCPTS.
Selection vs Preparation Analyses
Our value-added and evaluation rating estimates reflect both the knowledge and skills
that teachers develop while they are teaching candidates at a particular university and the
capacity/academic ability that teaching candidates bring with them into the preparation program.
While this combined effect is most relevant to policy and hiring decisions, separating the effect
of selection into a program from the quality of preparation received therein is an important
source of information for programs seeking to make evidence-based reforms. Therefore, we
5 We use prior EOG mathematics scores to define low-performing students in 5
th and 8
th grade science and for high
school biology. 6 We do not present a graph for low-performing students in middle grades algebra I, since very students taking
algebra I in middle grades scored more than one standard deviation below the statewide mean on their prior
mathematics test.

9
took the following steps to uniquely identify the effect of preparation quality on the value-added
and evaluation ratings of initially prepared UNC system institution teachers.
First, we identified a set of five academic ability measures—SAT scores, ACT scores,
high school GPA, high school class rank, and Praxis I scores—that occur prior to candidates’
entry into teacher preparation programs. Our goal is to use these measures to control for
teaching candidates’ academic ability prior to entry into preparation programs. Through data
provided by the UNC-GA, these measures are readily accessible for teachers prepared at UNC
system institutions but are not widely available for those entering teaching through other routes
of preparation. As a result we limited the sample for these selection vs preparation analyses to
UNC system institution initially prepared teachers working in NCPS during the 2008-09 through
2012-13 school years with less than five years of teaching experience. Second, we performed
multiple imputation to address missingness in these academic ability measures. Specifically, we
imputed 20 datasets using these academic ability measures, teacher demographics and
credentials, and sets of classroom and school characteristics from a teacher’s first appearance in
NCPS.7 Third, post-imputation, we used factor analysis, on each of the 20 imputed datasets, to
examine the underlying structure of the five academic ability variables. These analyses revealed
a single factor of academic ability prior to entry into a teacher preparation program which we
standardized in each imputed dataset. Finally, to separate the effect of selection into UNC
system institution teacher preparation programs from the preparation received therein, we
included this academic ability measure in our value-added and evaluation rating analyses. In
these analyses we compare the performance of initially prepared graduates from a single UNC
system institution with that of initially prepared graduates from all other UNC system
institutions, combined, and perform separate regressions for each UNC system institution and for
each of the 20 imputed datasets.8 Coefficients from these models report adjusted average
differences in student achievement or evaluation ratings net of the academic ability teachers
bring with them into their preparation program.
Table 5 presents the mean standardized factor values, by institution, for all of the UNC
system institution initially prepared teachers in our study sample and for all of the teachers in the
value-added and evaluation rating analyses.
7 To impute we used the SAS proc mi command. The variables in the imputation included academic ability
measures (SAT scores, ACT scores, Praxis I scores, high school GPA, high school class rank, collegiate GPA, and
Praxis II scores), teacher demographics and credentials (gender, ethnicity, age, advanced degree status, and
indicators for UNC system institutions), classroom characteristics (average class size, grade taught, the percentage
of students who were white, disabled, gifted, qualifying for subsidized school meals, and limited English proficient),
and school characteristics (Title I status, calendar type, urbanicity, school type, school size, per-pupil expenditures,
percentage of AYP goals met, percentage of students passing standardized exams, percentage of minority students
and students qualifying for subsidized meals, and the percentages of teachers who are fully licensed, Nationally
Board Certified, and holding an advanced degree). 8 We use the SAS proc mianalyse (value-added models) and Stata mi estimate (evaluation rating models) commands
to combine regression coefficients and standard errors into a single estimate.

10
Table 5: Mean Academic Ability Measure Values
University Overall ES
Math
ES
Read
ES
Science
MS
Math
MS
Read
MS
Science
HS
Algebra
HS
Biology
HS
English Evaluation
ASU 0.105 0.114 0.123 0.133 0.262 0.119 0.162 0.702 0.420 0.347 0.121
ECU -0.282 -0.402 -0.426 -0.421 -0.244 -0.343 -0.288 0.403 0.206 0.301 -0.285
ECSU -0.646 -0.474 -0.423 -0.248 -0.753 -0.873 -0.602
FSU -0.827 -0.721 -0.725 -0.773 -0.599 -0.872 -0.206 -0.563 -0.782 -0.883
NCA&T -0.687 -0.834 -0.848 -0.934 0.083 -0.568 0.227 -0.336 -0.631
NCCU -0.717 -0.660 -0.651 -0.550 -0.697 -0.834 -0.207 -0.232 -0.705
NCSU 0.615 0.535 0.540 0.597 0.532 0.387 0.720 0.985 0.836 0.842 0.621
UNCA 0.764 0.742 0.734 0.758 1.043 0.809 0.947 0.747 1.200 0.777
UNCCH 1.193 1.183 1.172 1.169 1.274 1.214 1.437 1.379 1.364 1.414 1.272
UNCC -0.047 -0.142 -0.112 -0.136 0.124 -0.066 0.137 0.562 0.924 0.378 -0.028
UNCG 0.047 0.053 0.054 0.097 0.225 0.003 0.106 0.796 0.412 0.233 0.032
UNCP -0.388 -0.391 -0.376 -0.325 -0.383 -0.525 -0.089 0.255 -0.272 -0.396
UNCW 0.071 0.054 0.058 0.111 0.201 0.111 0.211 0.509 0.759 0.575 0.098
WCU -0.019 -0.157 -0.169 -0.114 0.070 0.015 0.230 0.709 0.065 0.339 0.001
WSSU -0.918 -0.919 -0.923 -0.984 -0.648 -0.583 -0.895
Note: This table displays mean values for our academic ability measure (standardized within the full sample of UNC system initially prepared teachers) for all UNC system initially
prepared teachers and the UNC system initially prepared teachers in our value-added and evaluation rating models. Highlighted cells have fewer than ten teachers and therefore
do not have any results reported.

11
Results
Value-Added Results
We present value-added results in a graphical format that displays the reference group,
initially prepared teachers from non-UNC system institutions, at zero (the mid-point of the
graph) and UNC system institutions above or below the reference group, corresponding to their
effectiveness estimates. These graphs provide an accessible visual presentation of the results but
introduce the need for some explanatory notes. First, we only report effectiveness results for
preparation programs that have at least 10 teachers in the value-added model. Table 6 presents
the unique teacher counts, by preparation program, for all of our value-added models. Second,
we bold and mark with an asterisk—one asterisk for significance at the 0.05 level and two
asterisks for significance at the 0.01 level—results that are statistically significantly different
from the reference category. All statistically insignificant results appear in grey. Finally, in our
results graphs, we report estimates as a percentage of a standard deviation unit. Below, Table 7
provides a summary of the overall value-added model results. Figures 1-10 display results from
our overall and student subgroup value-added models and Appendix Tables A-D show the
graphed results in tabular format. Appendix Table E shows school fixed effects results for all
initially prepared graduates and Appendix Tables F-G display multi-level model and school fixed
effects results for UNC system institution initially prepared undergraduates only.
Table 6: Unique Teacher Counts in Value-Added Models
ES
Math
ES
Read
ES
Science
MS
Math
MS
Read
MS
Science
MS
Algebra
HS
Algebra
HS
Biology
HS
English
ASU 516 536 252 202 214 41 47 106 35 127
ECU 568 597 300 185 181 64 43 94 47 121
ECSU 47 52 26 20 14 2 2 6 4 6
FSU 81 81 33 39 40 9 5 30 10 20
NCA&T 51 51 28 14 14 3 4 12 6 10
NCCU 74 75 35 22 22 4 5 12 3 15
NCSU 78 83 36 101 149 44 34 144 56 84
UNCA 52 53 24 13 30 5 6 19 15 18
UNCCH 136 141 74 58 65 15 17 31 36 64
UNCC 381 387 193 138 111 39 32 61 16 42
UNCG 402 406 191 95 123 22 18 37 17 102
UNCP 127 122 59 42 41 11 7 35 9 19
UNCW 312 323 158 124 112 31 28 51 29 76
WCU 167 184 76 90 88 24 17 46 26 42
WSSU 29 31 17 11 13 1 0 7 0 3
Note: This table displays the number of unique teachers, by UNC system institution, in our value-added models. Highlighted
cells have fewer than ten teachers and therefore do not have any value-added results reported.

12
Table 7: Summary of Overall Value-Added Model Results
Institution Number of Significantly
Higher Value-Added Comparisons
Number of Significantly
Lower Value-Added Comparisons
ASU 0 0
ECU 2
(MS Read & MS Algebra I) 0
ECSU 0 0
FSU 0 0
NCA&T 0 2
(5th Grade Science & MS Math)
NCCU 1
(5th Grade Science)
0
NCSU 2
(ES Math & HS Algebra I) 0
UNCA 0 1
(ES Math)
UNCCH 1
(MS Math) 1
(MS Algebra I)
UNCC 3
(MS Read, HS Biology, & HS English I/II) 0
UNCG 1
(ES Math) 3
(MS Read, HS Biology, & HS English I/II)
UNCP 0 2
(8th Grade Science & HS English I/II)
UNCW 3
(ES Math, 5th Grade Science, & MS Math)
0
WCU 1
(5th Grade Science)
0
WSSU 0 0
Note: For the overall value-added models, this table displays counts of statistically significant results by UNC system institution
(positive and negative) and for which grade level/subject area the results were significant.
13
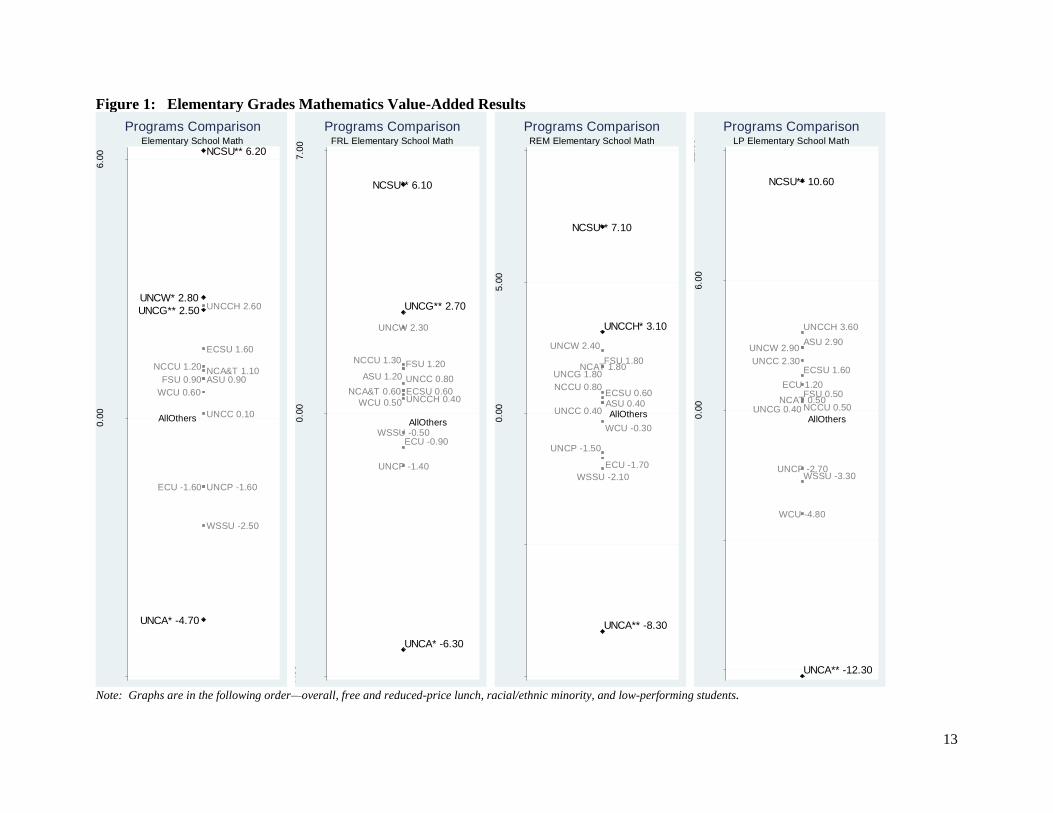
Figure 1: Elementary Grades Mathematics Value-Added Results
Note: Graphs are in the following order—overall, free and reduced-price lunch, racial/ethnic minority, and low-performing students.
AllOthers
UNCA* -4.70
UNCG** 2.50
UNCW* 2.80
NCSU** 6.20
WSSU -2.50
ECU -1.60 UNCP -1.60
UNCC 0.10
WCU 0.60
ASU 0.90FSU 0.90NCA&T 1.10
NCCU 1.20
ECSU 1.60
UNCCH 2.60
-6.0
00.0
06.0
0
Sta
ndard
De
via
tion
Diffe
rences in P
erc
ent
Elementary School Math
Programs Comparison
AllOthers
UNCA* -6.30
UNCG** 2.70
NCSU** 6.10
UNCP -1.40
ECU -0.90WSSU -0.50
UNCCH 0.40WCU 0.50
ECSU 0.60NCA&T 0.60
UNCC 0.80ASU 1.20
FSU 1.20NCCU 1.30
UNCW 2.30
-7.0
00.0
07.0
0
Sta
ndard
De
via
tion
Diffe
rences in P
erc
ent
FRL Elementary School Math
Programs Comparison
AllOthers
UNCA** -8.30
UNCCH* 3.10
NCSU** 7.10
WSSU -2.10
ECU -1.70
UNCP -1.50
WCU -0.30
ASU 0.40UNCC 0.40
ECSU 0.60NCCU 0.80
FSU 1.80NCAT 1.80
UNCG 1.80
UNCW 2.40
-10
.00
-5.0
00.0
05.0
010
.00
Sta
ndard
De
via
tion
Diffe
rences in P
erc
ent
REM Elementary School Math
Programs Comparison
AllOthers
UNCA** -12.30
NCSU** 10.60
WCU -4.80
WSSU -3.30UNCP -2.70
UNCG 0.40
FSU 0.50NCAT 0.50
NCCU 0.50
ECU 1.20
ECSU 1.60UNCC 2.30
ASU 2.90UNCW 2.90
UNCCH 3.60
-12
.00
-6.0
00.0
06.0
012
.00
Sta
ndard
De
via
tion
Diffe
rences in P
erc
ent
LP Elementary School Math
Programs Comparison

14
Figure 2: Elementary Grades Reading Value-Added Results
Note: Graphs are in the following order—overall, free and reduced-price lunch, racial/ethnic minority, and low-performing students.
AllOthers
NCAT -4.10ECSU -3.90
UNCA -1.20
UNCG -0.80
UNCP -0.10 ASU 0.00UNCC 0.00
UNCCH 0.00WCU 0.30
NCCU 0.80 ECU 0.90FSU 1.10
NCSU 1.50UNCW 1.70
WSSU 2.00
-6.0
00.0
06.0
0
Sta
ndard
De
via
tion
Diffe
rences in P
erc
ent
Elementary School Reading
Programs Comparison
AllOthers
ECSU* -5.90
ECU* 1.50
NCA&T -4.50
UNCA -2.00UNCCH -1.80
UNCP -1.20
UNCG -0.50
NCCU -0.10
UNCC 0.30WCU 0.50
ASU 0.80 NCSU 0.90
UNCW 2.20FSU 2.30
WSSU 5.00
-6.0
00.0
06.0
0
Sta
ndard
De
via
tion
Diffe
rences in P
erc
ent
FRL Elementary School Reading
Programs Comparison
AllOthers
NCAT -3.70ECSU -3.50
UNCG -1.50
WCU -1.00
ASU -0.20UNCP -0.10
UNCCH 0.00
NCCU 0.30UNCA 0.50
FSU 0.90UNCC 1.00
ECU 1.10NCSU 1.20UNCW 1.30
WSSU 3.00
-6.0
00.0
06.0
0
Sta
ndard
De
via
tion
Diffe
rences in P
erc
ent
REM Elementary School Reading
Programs Comparison
AllOthers
UNCC* 3.20
UNCA -6.70
NCAT -6.10
WCU -4.60
ECSU -3.70
FSU -2.20
UNCCH -1.40
UNCP -1.40ASU -1.20
UNCW -0.30UNCG -0.20
NCSU 0.70
WSSU 1.00
ECU 1.90
NCCU 2.90
-7.0
00.0
07.0
0
Sta
ndard
De
via
tion
Diffe
rences in P
erc
ent
LP Elementary School Reading
Programs Comparison

15
Figure 3: 5th Grade Science Value-Added Results
Note: Graphs are in the following order—overall, free and reduced-price lunch, racial/ethnic minority, and low-performing students.
AllOthers
NCAT** -13.90
WCU* 6.00
UNCW** 7.70
NCCU** 14.30
ECSU -5.10
ECU -0.80
UNCG 0.60UNCP 0.90
WSSU 1.70ASU 1.90
UNCCH 2.40UNCC 2.70
FSU 4.00NCSU 4.00
UNCA 5.20
-15
.00
-10
.00
-5.0
00.0
05.0
010
.00
15
.00
Sta
ndard
De
via
tion
Diffe
rences in P
erc
ent
5th Grade Science
Programs Comparison
AllOthers
NCA&T* -12.40
ASU** 4.50
UNCW** 9.20
NCCU** 18.10
ECSU -6.20
UNCG -0.40ECU -0.20
WSSU 1.20UNCC 1.60
UNCP 1.80NCSU 2.30
UNCCH 3.10FSU 3.70WCU 4.00
UNCA 4.40
-20
.00
-10
.00
0.0
010
.00
20
.00
Sta
ndard
De
via
tion
Diffe
rences in P
erc
ent
FRL 5th Grade Science
Programs Comparison
AllOthers
NCAT** -14.30
UNCW** 6.80
NCCU** 14.40
ECSU -3.40
UNCP -2.40
UNCG -0.50ECU -0.40
WSSU 0.30
ASU 2.20UNCC 2.90
UNCCH 3.30FSU 3.50
WCU 4.20
NCSU 5.30UNCA 5.70
-15
.00
-10
.00
-5.0
00.0
05.0
010
.00
15
.00
Sta
ndard
De
via
tion
Diffe
rences in P
erc
ent
REM 5th Grade Science
Programs Comparison
AllOthers
NCAT* -15.20
UNCC* 6.30ASU* 6.40
UNCW** 9.70UNCCH* 10.00
NCCU* 14.60
UNCG -2.30
ECSU -1.10
ECU 0.00NCSU 0.60FSU 0.80
UNCA 2.80
WCU 5.00
UNCP 7.50
WSSU 14.40
-16
.00
-8.0
00.0
08.0
016
.00
Sta
ndard
De
via
tion
Diffe
rences in P
erc
ent
LP 5th Grade Science
Programs Comparison

16
Figure 4: Middle Grades Mathematics Value-Added Results
Note: Graphs are in the following order—overall, free and reduced-price lunch, racial/ethnic minority, and low-performing students.
AllOthers
NCAT** -8.80
UNCCH* 4.60 UNCW** 4.70
UNCA -4.50
ECSU -1.30FSU -0.90
WSSU -0.70NCSU -0.20
UNCG 0.20UNCP 0.20
UNCC 0.40NCCU 0.70
ASU 1.00ECU 1.60
WCU 2.70
-10
.00
-5.0
00.0
05.0
010
.00
Sta
ndard
De
via
tion
Diffe
rences in P
erc
ent
Middle School Math
Programs Comparison
AllOthers
NCA&T* -6.70
ECU* 2.80
UNCCH* 4.70
UNCW** 5.10
UNCA -5.20
ECSU -2.50
FSU -1.40
NCCU -0.50
UNCC 0.00UNCG 0.00
WSSU 0.80
UNCP 1.20NCSU 1.40
ASU 1.80
WCU 2.70-6
.00
0.0
06.0
0
Sta
ndard
De
via
tion
Diffe
rences in P
erc
ent
FRL Middle School Math
Programs Comparison
AllOthers
NCAT** -8.80
UNCW** 4.70
UNCA -2.70
ECSU -1.60
FSU -0.90NCCU -0.30
NCSU -0.30
UNCG -0.10
UNCP 0.60
ASU 1.70UNCC 2.00WSSU 2.00ECU 2.10
WCU 3.20UNCCH 3.30
-10
.00
-5.0
00.0
05.0
010
.00
Sta
ndard
De
via
tion
Diffe
rences in P
erc
ent
REM Middle School Math
Programs Comparison
AllOthers
UNCW* 3.60
UNCCH** 8.50
ECSU -4.00NCAT -4.00
FSU -3.80
WSSU -1.10
UNCG -0.90NCSU -0.50
ASU 0.00
UNCA 0.90NCCU 1.20
UNCC 1.60WCU 2.00
ECU 2.50
UNCP 4.30
-10
.00
-5.0
00.0
05.0
010
.00
Sta
ndard
De
via
tion
Diffe
rences in P
erc
ent
LP Middle School Math
Programs Comparison

17
Figure 5: Middle Grades Reading Value-Added Results
Note: Graphs are in the following order—overall, free and reduced-price lunch, racial/ethnic minority, and low-performing students.
AllOthers
UNCG* -1.90
ECU* 1.40
UNCC* 1.90
NCAT -3.30
WCU -1.30
ASU -0.70ECSU -0.70 NCCU -0.70
NCSU -0.40
UNCP 0.00UNCCH 0.20
UNCA 0.40 WSSU 0.40
FSU 0.70
UNCW 1.00
-6.0
00.0
06.0
0
Sta
ndard
De
via
tion
Diffe
rences in P
erc
ent
Middle School Reading
Programs Comparison
AllOthers
ECU** 2.60
NCA&T -3.60
UNCG -1.30
NCSU -0.80ASU -0.70
UNCA -0.40 WCU -0.40NCCU -0.20UNCP 0.00
WSSU 0.30
ECSU 0.90
UNCW 1.30UNCCH 1.40
FSU 2.30UNCC 2.30
-6.0
00.0
06.0
0
Sta
ndard
De
via
tion
Diffe
rences in P
erc
ent
FRL Middle School Reading
Programs Comparison
AllOthers
UNCG* -2.40
ECU* 1.60
NCAT -4.10
WCU -2.70
UNCP -0.70NCSU -0.50
UNCA -0.30ASU -0.20
NCCU -0.10
UNCCH 0.40WSSU 0.40
FSU 0.80
UNCW 1.10UNCC 1.30
ECSU 1.50
-6.0
00.0
06.0
0
Sta
ndard
De
via
tion
Diffe
rences in P
erc
ent
REM Middle School Reading
Programs Comparison
AllOthers
ECU* 2.40
NCAT -4.90
UNCG -2.60
WSSU -1.20
NCSU -0.60
UNCP -0.20
FSU 0.10
ASU 1.00
UNCC 1.90WCU 2.00UNCW 2.10UNCCH 2.20
UNCA 2.90ECSU 3.00
NCCU 3.60
-6.0
00.0
06.0
0
Sta
ndard
De
via
tion
Diffe
rences in P
erc
ent
LP Middle School Reading
Programs Comparison

18
Figure 6: 8th Grade Science Value-Added Results
Note: Graphs are in the following order—overall, free and reduced-price lunch, racial/ethnic minority, and low-performing students.
AllOthers
UNCP** -12.10
WCU -7.10
ECU -5.00
ASU 1.50
UNCG 2.70UNCCH 2.80
UNCW 3.80
NCSU 4.40
UNCC 5.20
-12
.00
-6.0
00.0
06.0
012
.00
Sta
ndard
De
via
tion
Diffe
rences in P
erc
ent
8th Grade Science
Programs Comparison
AllOthers
UNCP* -11.90
WCU -7.50 WSSU -7.50
ECU -5.20
ASU 0.00
UNCG 1.90UNCCH 2.10
UNCW 3.50NCSU 4.20
UNCC 6.90
-12
.00
-6.0
00.0
06.0
012
.00
Sta
ndard
De
via
tion
Diffe
rences in P
erc
ent
FRL 8th Grade Science
Programs Comparison
AllOthers
UNCP* -10.20
NCSU* 5.50
ECU -4.90
WCU -3.50
UNCG 0.80
ASU 2.10
UNCW 2.60
UNCC 4.70UNCCH 4.70
-12
.00
-6.0
00.0
06.0
012
.00
Sta
ndard
De
via
tion
Diffe
rences in P
erc
ent
REM 8th Grade Science
Programs Comparison
AllOthers
WCU -7.10
ASU -3.70
ECU -2.30
UNCP -1.20
UNCCH -0.60
UNCG 0.00
NCSU 3.20
UNCW 5.50
UNCC 7.80
-8.0
0-4
.00
0.0
04.0
08.0
0
Sta
ndard
De
via
tion
Diffe
rences in P
erc
ent
LP 8th Grade Science
Programs Comparison

19
Figure 7: Middle Grades Algebra I Value-Added Results
Note: Graphs are in the following order—overall, free and reduced-price lunch, and racial/ethnic minority students.
AllOthers
UNCCH** -11.00
ECU* 6.50
UNCC -5.30
ASU -0.30
UNCW 0.40NCSU 1.10
WCU 3.80
UNCG 6.90
-12
.00
-6.0
00.0
06.0
012
.00
Sta
ndard
De
via
tion
Diffe
rences in P
erc
ent
Middle School Algebra
Programs Comparison
AllOthers
UNCCH -10.70
UNCC -6.30
UNCG -1.70
ASU 1.90
WCU 3.40
NCSU 4.60UNCW 4.70
ECU 6.90
-12
.00
-6.0
00.0
06.0
012
.00
Sta
ndard
De
via
tion
Diffe
rences in P
erc
ent
FRL Middle School Algebra
Programs Comparison
AllOthers
UNCCH** -9.40
UNCC -4.80
UNCW -2.40
NCSU 0.60
ASU 1.50
WCU 4.70
ECU 6.10
UNCG 7.30
-12
.00
-6.0
00.0
06.0
012
.00
Sta
ndard
De
via
tion
Diffe
rences in P
erc
ent
REM Middle School Algebra
Programs Comparison

20
Figure 8: High School Algebra I Value-Added Results
Note: Graphs are in the following order—overall, free and reduced-price lunch, racial/ethnic minority, and low-performing students.
AllOthers
NCSU* 2.80
NCCU -8.50
UNCA -7.30
UNCG -2.30
ASU -1.90
ECU -1.60NCAT -1.60
UNCP 1.30
UNCC 1.70UNCW 1.70
FSU 2.20WCU 2.50UNCCH 2.70
-10
.00
-5.0
00.0
05.0
010
.00
Sta
ndard
De
via
tion
Diffe
rences in P
erc
ent
High School Algebra
Programs Comparison
AllOthers
NCSU* 3.60
NCCU -9.10
UNCA -5.30
ASU -3.10
ECU -2.40
NCA&T -0.90
UNCW -0.10 UNCG 0.00
UNCC 0.80WCU 0.80
FSU 1.40UNCP 1.40
UNCCH 2.00
-10
.00
-5.0
00.0
05.0
010
.00
Sta
ndard
De
via
tion
Diffe
rences in P
erc
ent
FRL High School Algebra
Programs Comparison
AllOthers
NCCU* -11.90
ASU* -4.20
NCSU** 4.20
UNCA -6.50
UNCG -5.20
ECU -3.30NCAT -2.70
UNCW 0.60
FSU 2.10UNCC 2.10
WCU 2.70UNCP 3.10
UNCCH 3.40
-12
.00
-6.0
00.0
06.0
012
.00
Sta
ndard
De
via
tion
Diffe
rences in P
erc
ent
REM High School Algebra
Programs Comparison
AllOthers
NCCU** -16.20
ECU -4.10ASU -3.80UNCG -3.10
UNCA -2.20
NCAT -1.00WCU -0.60
UNCP 0.70NCSU 1.60 UNCW 1.70UNCC 2.10
UNCCH 3.80
FSU 5.80
-18
.00
-9.0
00.0
09.0
018
.00
Sta
ndard
De
via
tion
Diffe
rences in P
erc
ent
LP High School Algebra
Programs Comparison
21
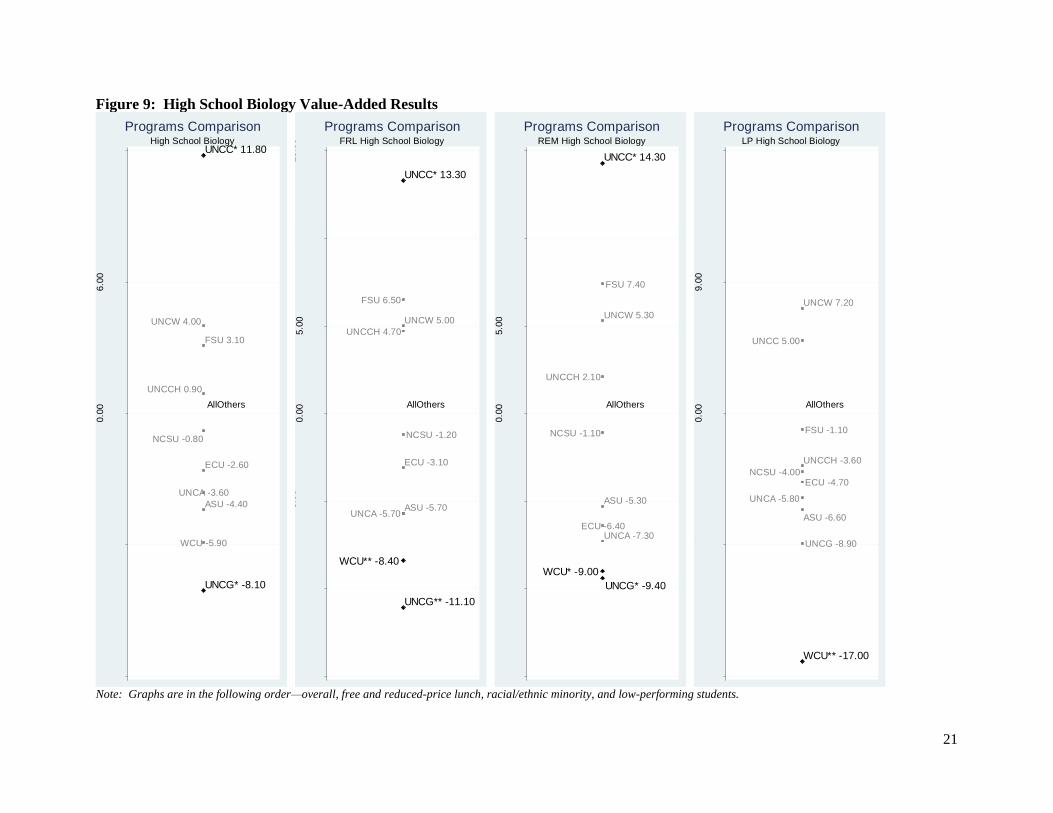
Figure 9: High School Biology Value-Added Results
Note: Graphs are in the following order—overall, free and reduced-price lunch, racial/ethnic minority, and low-performing students.
AllOthers
UNCG* -8.10
UNCC* 11.80
WCU -5.90
ASU -4.40
UNCA -3.60
ECU -2.60
NCSU -0.80
UNCCH 0.90
FSU 3.10
UNCW 4.00
-12
.00
-6.0
00.0
06.0
012
.00
Sta
ndard
De
via
tion
Diffe
rences in P
erc
ent
High School Biology
Programs Comparison
AllOthers
UNCG** -11.10
WCU** -8.40
UNCC* 13.30
ASU -5.70UNCA -5.70
ECU -3.10
NCSU -1.20
UNCCH 4.70
UNCW 5.00
FSU 6.50
-15
.00
-10
.00
-5.0
00.0
05.0
010
.00
15
.00
Sta
ndard
De
via
tion
Diffe
rences in P
erc
ent
FRL High School Biology
Programs Comparison
AllOthers
UNCG* -9.40
WCU* -9.00
UNCC* 14.30
UNCA -7.30ECU -6.40
ASU -5.30
NCSU -1.10
UNCCH 2.10
UNCW 5.30
FSU 7.40
-15
.00
-10
.00
-5.0
00.0
05.0
010
.00
15
.00
Sta
ndard
De
via
tion
Diffe
rences in P
erc
ent
REM High School Biology
Programs Comparison
AllOthers
WCU** -17.00
UNCG -8.90
ASU -6.60
UNCA -5.80
ECU -4.70NCSU -4.00
UNCCH -3.60
FSU -1.10
UNCC 5.00
UNCW 7.20
-18
.00
-9.0
00.0
09.0
018
.00
Sta
ndard
De
via
tion
Diffe
rences in P
erc
ent
LP High School Biology
Programs Comparison

22
Figure 10: High School English I/II Value-Added Results
Note: Graphs are in the following order—overall, free and reduced-price lunch, racial/ethnic minority, and low-performing students.
AllOthers
UNCP** -4.90
UNCG** -4.00
UNCC* 3.30
NCCU -3.10 UNCA -3.10
ASU -1.20NCAT -1.10
NCSU 0.50UNCW 0.70
UNCCH 0.80
ECU 1.30
FSU 1.90
WCU 3.10
-6.0
00.0
06.0
0
Sta
ndard
De
via
tion
Diffe
rences in P
erc
ent
High School English
Programs Comparison
AllOthers
UNCG** -4.30UNCP* -4.10
WCU* 5.20
NCCU -4.70
UNCA -2.60
NCA&T -0.50ASU -0.30
NCSU 0.30UNCW 0.40
ECU 0.60
FSU 1.60 UNCCH 1.60
UNCC 2.00
-6.0
00.0
06.0
0
Sta
ndard
De
via
tion
Diffe
rences in P
erc
ent
FRL High School English
Programs Comparison
AllOthers
UNCG** -4.40UNCP* -4.30
WCU* 6.80
NCCU -5.50
UNCA -3.30
ASU -1.60
NCAT -0.80
UNCCH -0.50
ECU 1.00UNCW 1.00
NCSU 1.20
UNCC 2.10
FSU 2.30
-8.0
0-4
.00
0.0
04.0
08.0
0
Sta
ndard
De
via
tion
Diffe
rences in P
erc
ent
REM High School English
Programs Comparison
AllOthers
UNCG* -4.30
NCAT -3.10
UNCP -2.90
NCCU -1.90
ASU -1.80ECU -1.30
UNCW 0.40
UNCA 0.60
FSU 2.20 NCSU 2.20
UNCCH 2.70
UNCC 4.90
WCU 6.60
-8.0
0-4
.00
0.0
04.0
08.0
0
Sta
ndard
De
via
tion
Diffe
rences in P
erc
ent
LP High School English
Programs Comparison

23
Appalachian State University (ASU): Overall, initially prepared graduates of ASU
performed similarly to all non-UNC system initially prepared teachers in all ten value-added
models—elementary grades mathematics, reading, and 5th
grade science; middle grades
mathematics, reading, 8th
grade science, and algebra I; and high school algebra I, biology, and
English I/II. Examining the results for student subgroups, ASU initially prepared graduates were
more effective than all non-UNC system initially prepared teachers with low-performing
students in 5th
grade science and less effective with racial and ethnic minority students in high
school algebra I.
East Carolina University (ECU): Overall, initially prepared graduates of ECU were
more effective than all non-UNC system initially prepared teachers in two comparisons—middle
grades reading and middle grades algebra I—and no different in the remaining eight
comparisons—elementary grades mathematics, reading, and 5th
grade science; middle grades
mathematics and 8th
grade science; and high school algebra I, biology, and English I/II.
Examining the results for student subgroups, ECU initially prepared graduates were more
effective than all non-UNC system initially prepared teachers with free and reduced-price lunch
students in elementary grades reading and middle grades mathematics and more effective with
free and reduced-price lunch, racial and ethnic minority, and low-performing students in middle
grades reading.
Elizabeth City State University (ECSU): Overall, initially prepared graduates of ECSU
performed similarly to all non-UNC system initially prepared teachers in five value-added
models—elementary grades mathematics, reading, and 5th
grade science and middle grades
mathematics and reading. There were insufficient ECSU initially prepared graduates (less than
10 teachers) to make comparisons in 8th
grade science, middle grades algebra I, high school
algebra I, high school biology, and high school English I/II. Examining the results for student
subgroups, ECSU initially prepared graduates were less effective than all non-UNC system
initially prepared teachers with free and reduced-price lunch students in elementary grades
reading.
Fayetteville State University (FSU): Overall, initially prepared graduates of FSU
performed similarly to all non-UNC system initially prepared teachers in eight value-added
models—elementary grades mathematics, reading, and 5th
grade science; middle grades
mathematics and reading; and high school algebra I, biology, and English I/II. There were
insufficient FSU initially prepared graduates (less than 10 teachers) to make comparisons in 8th
grade science and middle grades algebra I. Examining the results for student subgroups, FSU
initially prepared graduates performed similarly to all non-UNC system initially prepared
teachers.
North Carolina A&T State University (NCAT): Overall, initially prepared graduates of
NCAT were less effective than all non-UNC system initially prepared teachers in two
comparisons—5th
grade science and middle grades mathematics—and no different in five
comparisons—elementary grades mathematics and reading; middle grades reading; and high
school algebra I and English I/II. There were insufficient NCAT initially prepared graduates
(less than 10 teachers) to make comparisons in 8th
grade science, middle grades algebra I, and
high school biology. Examining the results for student subgroups, NCAT initially prepared

24
graduates were less effective than all non-UNC system initially prepared teachers with free and
reduced-price lunch, racial and ethnic minority, and low-performing students in 5th
grade science
and less effective with free and reduced-price lunch and racial and ethnic minority students in
middle grades mathematics.
North Carolina Central University (NCCU): Overall, initially prepared graduates of
NCCU were more effective than all non-UNC system initially prepared teachers in one
comparison—5th
grade science—and no different in six comparisons—elementary grades
mathematics and reading; middle grades mathematics and reading; and high school algebra I and
English I/II. There were insufficient NCCU initially prepared graduates (less than 10 teachers)
to make comparisons in 8th
grade science, middle grades algebra I, and high school biology.
Examining the results for student subgroups, NCCU initially prepared graduates were more
effective than all non-UNC system initially prepared teachers with free and reduced-price lunch,
racial and ethnic minority, and low-performing students in 5th
grade science and less effective
with racial and ethnic minority and low-performing students in high school algebra I.
North Carolina State University (NCSU): Overall, initially prepared graduates of NCSU
were more effective than all non-UNC system initially prepared teachers in two comparisons—
elementary grades mathematics and high school algebra I—and no different in the remaining
eight comparisons—elementary grades reading and 5th
grade science; middle grades
mathematics, reading, 8th
grade science, and algebra I; and high school biology and English I/II.
Examining the results for student subgroups, NCSU initially prepared graduates were more
effective than all non-UNC system initially prepared teachers with free and reduced-price lunch,
racial and ethnic minority, and low-performing students in elementary grades mathematics, more
effective with free and reduced-price lunch and racial and ethnic minority students in high school
algebra I, and more effective with racial and ethnic minority students in 8th
grade science.
University of North Carolina – Asheville (UNCA): Overall, initially prepared graduates
of UNCA were less effective than all non-UNC system initially prepared teachers in one
comparison—elementary grades mathematics—and no different in seven comparisons—
elementary grades reading and 5th
grade science; middle grades mathematics and reading; and
high school algebra I, biology, and English I/II. There were insufficient UNCA initially
prepared graduates (less than 10 teachers) to make comparisons in 8th
grade science and middle
grades algebra I. Examining the results for student subgroups, UNCA initially prepared
graduates were less effective than all non-UNC system initially prepared teachers with free and
reduced-price lunch, racial and ethnic minority, and low-performing students in elementary
grades mathematics.
University of North Carolina – Chapel Hill (UNCCH): Overall, initially prepared
graduates of UNCCH were more effective than all non-UNC system initially prepared teachers
in one comparison—middle grades mathematics—and less effective than all non-UNC system
initially prepared teachers in one comparison—middle grades algebra I. Initially prepared
UNCCH teachers performed similarly to all non-UNC system initially prepared teachers in the
remaining eight comparisons—elementary grades mathematics, reading, and 5th
grade science;
middle grades reading and 8th
grade science; and high school algebra I, biology, and English I/II.
Examining the results for student subgroups, UNCCH initially prepared graduates were more

25
effective than all non-UNC system initially prepared teachers with free and reduced-prince lunch
and low-performing students in middle grades mathematics, more effective with low-performing
students in 5th
grade science, and more effective with racial and ethnic minority students in
elementary grades mathematics. UNCCH initially prepared graduates were less effective than all
non-UNC system initially prepared teachers with racial and ethnic minority students in middle
grades algebra I.
University of North Carolina – Charlotte (UNCC): Overall, initially prepared graduates
of UNCC were more effective than all non-UNC system initially prepared teachers in three
comparisons—middle grades reading, high school biology, and high school English I/II—and no
different in the remaining seven comparisons—elementary grades mathematics, reading, and 5th
grade science; middle grades mathematics, 8th
grade science, and algebra I; and high school
algebra I. Examining the results for student subgroups, UNCC initially prepared graduates were
more effective than all non-UNC system initially prepared teachers with free and reduced-price
lunch and racial and ethnic minority students in high school biology and more effective with
low-performing students in elementary grades reading and 5th
grade science.
University of North Carolina – Greensboro (UNCG): Overall, initially prepared
graduates of UNCG were more effective than all non-UNC system initially prepared teachers in
one comparison—elementary grades mathematics—and less effective in three comparisons—
middle grades reading, high school biology, and high school English I/II. Initially prepared
UNCG teachers performed similarly to all non-UNC system initially prepared teachers in the
remaining six comparisons—elementary grades reading and 5th
grade science; middle grades
mathematics, 8th
grades science, and algebra I; and high school algebra I. Examining the results
for student subgroups, UNCG initially prepared graduates were more effective than all non-UNC
system initially prepared teachers with free and reduced-price lunch students in elementary
grades mathematics. UNCG initially prepared graduates were less effective than all non-UNC
system initially prepared teachers with free and reduced-price lunch, racial and ethnic minority
and low-performing students in high school English I/II, less effective with free and reduced-
price lunch and racial and ethnic minority students in high school biology, and less effective with
racial and ethnic minority students in middle grades reading.
University of North Carolina – Pembroke (UNCP): Overall, initially prepared graduates
of UNCP were less effective than all non-UNC system initially prepared teachers in two
comparisons—8th
grade science and high school English I/II—and no different in six
comparisons—elementary grades mathematics, reading, and 5th
grade science; middle grades
mathematics and reading; and high school algebra I. There were insufficient UNCP initially
prepared graduates (less than 10 teachers) to make comparisons in middle grades algebra I and
high school biology. Examining the results for student subgroups, UNCP initially prepared
graduates were less effective than all non-UNC system initially prepared teachers with free and
reduced-price lunch and racial and ethnic minority students in 8th
grade science and high school
English I/II.
University of North Carolina – Wilmington (UNCW): Overall, initially prepared
graduates of UNCW were more effective than all non-UNC system initially prepared teachers in
three comparisons—elementary grades mathematics, 5th
grade science, and middle grades

26
mathematics—and no different in the remaining seven comparisons—elementary grades reading;
middle grades reading, 8th
grade science, and algebra I; and high school algebra I, biology, and
English I/II. Examining the results for student subgroups, UNCW initially prepared graduates
were more effective than all non-UNC system initially prepared teachers with free and reduced-
price lunch, racial and ethnic minority, and low-performing students in 5th
grade science and
middle grades mathematics. UNCW initially prepared graduates were less effective than all non-
UNC system initially prepared teachers with low-performing students in middle grades algebra I.
Western Carolina University (WCU): Overall, initially prepared graduates of WCU were
more effective than all non-UNC system initially prepared teachers in one comparison—5th
grade science—and no different in the remaining nine comparisons—elementary grades
mathematics and reading; middle grades mathematics, reading, 8th
grade science, and algebra I;
and high school algebra I, biology, and English I/II. Examining the results for student
subgroups, WCU initially prepared graduates were more effective than all non-UNC system
initially prepared teachers with free and reduced-price lunch and racial and ethnic minority
students in high school English I/II. WCU initially prepared graduates were less effective than
all non-UNC system initially prepared teachers with free and reduced price-lunch, racial and
ethnic minority, and low-performing students in high school biology.
Winston-Salem State University (WSSU): Overall, initially prepared graduates of WSSU
were no different than all non-UNC system initially prepared teachers in five comparisons—
elementary grades mathematics, reading, and 5th
grade science and middle grades mathematics
and reading. There were insufficient WSSU initially prepared graduates (less than 10 teachers)
to make comparisons in 8th
grade science, middle grades algebra I, and high school algebra I,
biology, and English I/II. Examining the results for student subgroups, WSSU initially prepared
graduates performed similarly to all non-UNC system initially prepared teachers.
Selection vs Preparation: The value-added results summarized above represent a
combination of selection into teacher preparation programs and the quality of preparation
received therein. To separate these two effects, we included a measure of pre-teacher
preparation program academic ability in our value-added models.9 Table 8 displays these results,
which compare the adjusted average test scores of students taught by teachers with similar values
for the academic ability measure.
9 Unlike our overall value-added models, the sample for these models only includes initially prepared UNC system
institution teachers. For each UNC system institution we specify all other initially prepared UNC system institution
teachers as the reference category and run value-added models for 10 different grade levels/subject areas.

27
Table 8: Results from Value-Added Models Controlling for a Measure of Academic Ability
ES
Math
ES
Read
5th
Science
MS
Math
MS
Read
8th
Science
HS
Algebra
HS
Biology
HS
English
ASU 0.009
(0.010)
0.006
(0.008)
0.012
(0.018)
-0.017
(0.014)
-0.008
(0.007)
-0.017
(0.031)
-0.028
(0.020)
-0.018
(0.035)
-0.008
(0.010)
ECU -0.024
**
(0.009)
0.008
(0.007)
-0.023
(0.020)
0.026
(0.015)
0.013
(0.008) -0.066
*
(0.031)
-0.033
(0.018)
0.001
(0.035)
0.007
(0.011)
ECSU 0.022
(0.027)
-0.037
(0.022)
-0.089
(0.048)
-0.009
(0.030)
-0.022
(0.028)
FSU 0.018
(0.027)
0.015
(0.017)
0.087
(0.054)
-0.024
(0.029)
0.022
(0.013)
0.026
(0.037)
-0.025
(0.084)
0.038
(0.020)
NCA&T -0.014
(0.027)
-0.044
(0.023) -0.229
**
(0.048) -0.123
**
(0.039)
-0.029
(0.031)
0.050
(0.039)
-0.002
(0.032)
NCCU 0.010
(0.021)
0.002
(0.019) 0.166
**
(0.048)
-0.024
(0.034)
-0.005
(0.023)
0.022
(0.066)
-0.053
(0.031)
NCSU 0.059
**
(0.022)
0.012
(0.016)
-0.004
(0.046)
-0.012
(0.019)
-0.013
(0.007)
0.059
(0.035) 0.033
*
(0.016) -0.070
*
(0.033)
0.021
(0.011)
UNCA -0.074
**
(0.025)
-0.017
(0.018)
0.037
(0.049) -0.119
**
(0.040)
0.013
(0.012)
-0.075
(0.049)
-0.046
(0.037)
-0.034
(0.020)
UNCCH -0.004
(0.017)
0.004
(0.014)
-0.011
(0.029) 0.058
**
(0.022)
0.010
(0.010)
-0.013
(0.056)
0.006
(0.027)
0.033
(0.042)
0.000
(0.015)
UNCC -0.011
(0.010)
-0.003
(0.009)
0.019
(0.023)
0.007
(0.018) 0.029
**
(0.010)
0.025
(0.033)
0.012
(0.026) 0.203
**
(0.074) 0.036
*
(0.016)
UNCG 0.013
(0.010) -0.025
**
(0.008)
-0.032
(0.021)
-0.028
(0.018) -0.025
**
(0.009)
0.045
(0.046)
-0.028
(0.027) -0.079
*
(0.040) -0.047
**
(0.013)
UNCP -0.040
(0.023)
-0.006
(0.018)
-0.037
(0.043)
0.008
(0.033)
-0.006
(0.017)
-0.081
(0.043)
-0.039
(0.029)
-0.044
(0.026)
UNCW 0.020
(0.013) 0.021
*
(0.010)
0.039
(0.026)
0.023
(0.019)
0.011
(0.009)
0.053
(0.052)
-0.012
(0.020)
0.076
(0.046)
0.018
(0.014)
WCU 0.006
(0.017)
0.000
(0.013)
0.000
(0.034)
0.029
(0.019)
-0.006
(0.012) -0.117
*
(0.050) 0.053
*
(0.027) -0.075
*
(0.035)
0.032
(0.021)
WSSU -0.024
(0.038)
0.020
(0.031
-0.080
(0.055)
0.040
(0.038)
0.008
(0.032)
Note: Each cell in this table displays results from a separate value-added model which specifies all other initially
prepared UNC system teachers as the reference group and includes the academic ability measure. Due to the
small sample of teachers, we do not report selection model results for middle grades algebra I.
Note:* and ** indicate statistical significance at the 0.05 and 0.01 levels, respectively.
Due to differences in the analytical sample between the overall value-added and the
selection vs preparation value-added models, it is difficult to directly compare results. However,
across grade levels/subject areas, many of the significant results in Table 8 were also significant
in the overall value-added models (summarized in Table 7). For example, UNCC initially
prepared teachers were more effective than all non-UNC system institution initially prepared
teachers in middle grades reading, high school biology, and high school English I/II; after
controlling for the academic ability measure, UNCC initially prepared teachers were also more
effective than all other UNC system institution initially prepared teachers in the same three
comparisons. Results for some UNC system institutions differed when controlling for the
academic ability measure. For example, after controlling for the academic ability measure, ECU
initially prepared teachers were less effective than all other UNC system institution initially
prepared teachers in elementary grades mathematics and 8th
grade science and NCSU initially

28
prepared teachers were less effective than all other UNC system institution initially prepared
teachers in high school biology.
Overall, the academic ability measure was rarely significant in these value-added models
and UNC system institutions with high values for the academic ability measure (shown in Table
5) did not consistently return significantly positive value-added results; likewise, those with low
values for the academic ability measure did not consistently return significantly negative value-
added results.10
While it is unknown how well this academic ability measure accounts for
selection into teacher preparation programs, these results show that in certain grade
levels/subject areas initially prepared teachers from UNC system institutions differ significantly
in their effectiveness from other UNC system institution peers with comparable levels of pre-
teacher preparation program academic ability. This suggests that certain UNC system institutions
are ‘adding value’ to the performance of their initially prepared teachers through the quality of
their preparation components.
Evaluation Rating Results
We present our overall evaluation rating results in two graphical formats. Like our value-
added results, the first graph displays the reference group, non-UNC system institution initially
prepared teachers, at one (the mid-point of the graph indicating equivalent odds of rating higher
on the evaluation standard) and UNC system institutions above or below the reference group,
corresponding to their odds of having higher evaluation ratings. Because the odds ratios from
our evaluation rating models are not straightforward to interpret, we also include a bar graph
which displays, by UNC system institution, predicted probabilities for rating at Level II
(developing), Level III (proficient), Level IV (advanced), and Level V (distinguished). Table 9
presents unique teacher counts, by UNC system institution, for our evaluation rating models,
Table 10 summarizes the main evaluation rating results, Figures 11-15 display the evaluation
rating results in both graphical formats, and Tables 11-13 present evaluation rating results by
school level (elementary, middle, and high). Finally, Appendix Table H shows the graphed
evaluation results in tabular format and Appendix Table I displays results for UNC system
institution initially prepared undergraduates only.
10
The coefficient for the academic ability measure was positive and statistically significant in elementary grades
mathematics models and was positive and significant at the p<0.10 level in some 5th
grade science and high school
biology models. While the academic ability measure did not consistently predict higher value-added, these results
are only for UNC system institution initially prepared teachers and do not support wider inferences that academic
ability is unimportant to teacher effectiveness.

29
Table 9: Unique Teacher Counts in Evaluation Rating Models
University Standard 1:
Leadership
Standard 2:
Classroom
Environment
Standard 3:
Content
Knowledge
Standard 4:
Facilitating
Student Learning
Standard 5:
Reflecting on
Practice
ASU 2241 2226 2227 2241 2227
ECU 2572 2552 2552 2572 2552
ECSU 203 203 203 203 203
FSU 369 367 367 369 367
NCA&T 253 252 252 253 252
NCCU 267 265 265 267 265
NCSU 1127 1124 1124 1127 1124
UNCA 217 214 214 217 214
UNCCH 662 659 658 662 658
UNCC 1464 1455 1455 1464 1455
UNCG 1708 1696 1695 1708 1695
UNCP 589 581 581 589 581
UNCW 1292 1283 1283 1292 1283
WCU 915 904 902 915 903
WSSU 170 170 170 170 170 Note: This table displays the number of unique teachers, by UNC system institution, in our evaluation rating models.
Table 10: Summary of Overall Evaluation Rating Results
University Number of Significantly
Higher Evaluation Ratings
Number of Significantly
Lower Evaluation Ratings
ASU 5
(Standards 1-5) 0
ECU 0 0
ECSU 0 1
(Standard 3)
FSU 0 0
NCA&T 0 3
( Standards 1, 4, and 5)
NCCU 0 0
NCSU 5
(Standards 1-5) 0
UNCA 5
(Standards 1-5) 0
UNCCH 5
(Standards 1-5) 0
UNCC 4
(Standards 1, 2, 4, and 5) 0
UNCG 0 0
UNCP 0 2
(Standards 1 and 5)
UNCW 5
(Standards 1-5) 0
WCU 0 0
WSSU 0 4
(Standards 2-5) Note: For the overall evaluation rating models, this table displays counts of statistically significant results by UNC system
institution (positive and negative) and for which standards the results were significant.

30
Figure 11: Evaluation Rating Results for Standard 1—Leadership
Note: The left graph displays the odds of rating higher than non-UNC system initially prepared teachers for Standard 1. The right graph displays
predicted probabilities, by UNC system institution, for rating at Developing, Proficient, Advanced, and Distinguished.
AllOthers
NCAT* 0.72
UNCP* 0.85
ASU* 1.11
UNCW* 1.17
UNCC* 1.25
UNCA* 1.71NCSU* 1.72
UNCCH* 1.80
WSSU 0.81
FSU 0.89
ECSU 0.98 UNCG 0.99ECU 1.00
NCCU 1.03
WCU 1.09
0.0
01.0
02.0
0
Odd
s R
atio
s
Standard 1
Programs Comparison
0
10
20
30
40
50
60
70
80
90
100
ASU ECU ECSU FSU NCAT NCCU NCSU UNCA UNCCH UNCC UNCG UNCP UNCW WCU WSSU
Probability of Rating at Level II-Level V
Level II Level III Level IV Level V

31
Figure 12: Evaluation Rating Results for Standard 2—Classroom Environment
Note: The left graph displays the odds of rating higher than non-UNC system initially prepared teachers for Standard 2. The right graph displays
predicted probabilities, by UNC system institution, for rating at Developing, Proficient, Advanced, and Distinguished.
AllOthers
WSSU* 0.80
UNCC* 1.14
UNCW* 1.19
UNCA* 1.26
NCSU* 1.58
UNCCH* 1.88
NCAT 0.84 ECSU 0.85
UNCP 0.91FSU 0.96
UNCG 0.98
ECU 1.01WCU 1.02 ASU 1.03
NCCU 1.05
0.0
01.0
02.0
0
Odd
s R
atio
s
Standard 2
Programs Comparison
0
10
20
30
40
50
60
70
80
90
100
ASU ECU ECSU FSU NCAT NCCU NCSU UNCA UNCCH UNCC UNCG UNCP UNCW WCU WSSU
Probability of Rating at Level II-V
Level II Level III Level IV Level V

32
Figure 13: Evaluation Rating Results for Standard 3—Content Knowledge
Note: The left graph displays the odds of rating higher than non-UNC system initially prepared teachers for Standard 3. The right graph displays
predicted probabilities, by UNC system institution, for rating at Developing, Proficient, Advanced, and Distinguished.
AllOthers
WSSU* 0.66
ECSU* 0.77
ASU* 1.10
UNCW* 1.19
UNCA* 1.82
NCSU* 1.94
UNCCH* 2.06
UNCP 0.87FSU 0.90 NCAT 0.91
ECU 0.97UNCG 0.99
UNCC 1.04WCU 1.06
NCCU 1.08
0.0
01.0
02.0
0
Odd
s R
atio
s
Standard 3
Programs Comparison
0
10
20
30
40
50
60
70
80
90
100
ASU ECU ECSU FSU NCAT NCCU NCSU UNCA UNCCH UNCC UNCG UNCP UNCW WCU WSSU
Probability of Rating at Level II-V
Level II Level III Level IV Level V

33
Figure 14: Evaluation Rating Results for Standard 4—Facilitating Student Learning
Note: The left graph displays the odds of rating higher than non-UNC system initially prepared teachers for Standard 4. The right graph displays
predicted probabilities, by UNC system institution, for rating at Developing, Proficient, Advanced, and Distinguished.
AllOthers
WSSU* 0.74
NCAT* 0.79
ASU* 1.09
UNCC* 1.17
UNCW* 1.26
UNCA* 1.69
NCSU* 1.75
UNCCH* 1.92
UNCP 0.87
ECSU 0.94FSU 0.99UNCG 1.00NCCU 1.02ECU 1.04
WCU 1.09
0.0
01.0
02.0
0
Odd
s R
atio
s
Standard 4
Programs Comparison
0
10
20
30
40
50
60
70
80
90
100
ASU ECU ECSU FSU NCAT NCCU NCSU UNCA UNCCH UNCC UNCG UNCP UNCW WCU WSSU
Probability of Rating at Level II-V
Level II Level III Level IV Level V

34
Figure 15: Evaluation Rating Results for Standard 5—Reflecting on Practice
Note: The left graph displays the odds of rating higher than non-UNC system initially prepared teachers for Standard 5. The right graph displays
predicted probabilities, by UNC system institution, for rating at Developing, Proficient, Advanced, and Distinguished.
AllOthers
NCAT* 0.68
UNCP* 0.77WSSU* 0.79
ASU* 1.10
UNCC* 1.15UNCW* 1.17
UNCA* 1.64
NCSU* 1.79
UNCCH* 1.95
FSU 0.90
ECSU 0.95UNCG 0.95
NCCU 1.03ECU 1.04 WCU 1.04
0.0
01.0
02.0
0
Odd
s R
atio
s
Standard 5
Programs Comparison
0
10
20
30
40
50
60
70
80
90
100
ASU ECU ECSU FSU NCAT NCCU NCSU UNCA UNCCH UNCC UNCG UNCP UNCW WCU WSSU
Probability of Rating at Level II-V
Level II Level III Level IV Level V

35
Table 11: Elementary School Evaluation Rating Results
University
Standard 1:
Leadership
Standard 2:
Classroom
Environment
Standard 3:
Content
Knowledge
Standard 4:
Facilitating
Student
Learning
Standard 5:
Reflecting on
Practice
ASU 1.176** 1.081 1.192** 1.193** 1.168**
ECU 0.942 0.969 0.986 1.006 1.018
ECSU 1.282 1.055 1.121 1.263 1.298
FSU 0.812 0.935 0.879 0.921 0.863
NCAT 0.742 0.865 0.788 0.806 0.562**
NCCU 1.222 1.099 1.365* 1.036 1.209
NCSU 1.982** 2.059** 2.270** 2.332** 2.134**
UNCA 1.688** 1.368 1.718** 2.043** 1.528*
UNCCH 2.002** 2.107** 2.089** 2.273** 2.102**
UNCC 1.206** 1.123 1.094 1.135 1.122
UNCG 0.916 0.887 0.949 0.912 0.877*
UNCP 0.842 0.908 0.883 0.829 0.727**
UNCW 1.111 1.154 1.136 1.193* 1.097
WCU 1.069 0.911 1.027 1.111 0.948
WSSU 0.850 0.795 0.744* 0.796 0.841 Note: This table displays odds ratios for receiving higher evaluation ratings relative to the comparison group of non-UNC
system initially prepared teachers. Statistically significant odds ratios above 1 indicate greater odds of receiving higher
evaluation ratings; statistically significant odds ratios below 1 indicate lesser odds of receiving higher evaluation ratings.
Note: * and** indicate statistical significance at the 0.05 and 0.01 levels, respectively.
Table 12: Middle School Evaluation Rating Results
University Standard 1:
Leadership
Standard 2:
Classroom
Environment
Standard 3:
Content
Knowledge
Standard 4:
Facilitating
Student
Learning
Standard 5:
Reflecting on
Practice
ASU 1.006 0.924 0.905 0.955 0.909
ECU 1.299** 1.282** 1.106 1.222* 1.204*
ECSU 0.954 0.727 0.665 0.727 0.840
FSU 0.898 0.909 0.936 1.027 0.915
NCAT 0.594* 0.745 0.759 0.715 0.713
NCCU 0.771 0.951 0.806 0.885 0.828
NCSU 1.945** 1.774** 2.313** 1.984** 1.957**
UNCA 1.412 1.062 1.421 1.693* 1.311
UNCCH 1.302 1.236 1.553* 1.122 1.208
UNCC 1.468** 1.228 1.172 1.383** 1.208
UNCG 0.901 0.933 0.901 1.021 0.959
UNCP 0.893 1.009 0.818 0.961 0.844
UNCW 1.208 1.371* 1.197 1.355* 1.242
WCU 1.248 1.176 1.101 1.205 1.224
WSSU 1.027 0.894 0.650 0.649* 0.983 Note: This table displays odds ratios for receiving higher evaluation ratings relative to the comparison group of non-UNC
system initially prepared teachers. Statistically significant odds ratios above 1 indicate greater odds of receiving higher
evaluation ratings; statistically significant odds ratios below 1 indicate lesser odds of receiving higher evaluation ratings.
Note: * and** indicate statistical significance at the 0.05 and 0.01 levels, respectively.

36
Table 13: High School Evaluation Rating Results
University Standard 1:
Leadership
Standard 2:
Classroom
Environment
Standard 3:
Content
Knowledge
Standard 4:
Facilitating
Student
Learning
Standard 5:
Reflecting on
Practice
ASU 0.979 0.963 1.050 0.954 1.047
ECU 1.070 1.049 1.098 1.092 1.134
ECSU 0.569** 0.596* 0.392** 0.556* 0.519*
FSU 1.003 1.065 0.971 1.121 0.921
NCAT 0.717* 0.798 1.016 0.737 0.724
NCCU 0.845 1.006 0.749 1.095 0.747
NCSU 1.497** 1.316** 1.542** 1.436** 1.594**
UNCA 1.718** 1.117 1.768** 1.277 1.755**
UNCCH 1.587** 1.746** 2.210** 1.678** 1.951**
UNCC 1.351** 1.196 1.195 1.278* 1.341**
UNCG 1.211* 1.237* 1.114 1.209* 1.081
UNCP 0.847 0.881 0.952 0.943 0.828
UNCW 1.403** 1.195 1.603** 1.427* 1.408*
WCU 0.976 1.110 1.003 0.992 1.065
WSSU 0.514* 0.640 0.387** 0.598** 0.417** Note: This table displays odds ratios for receiving higher evaluation ratings relative to the comparison group of non-UNC
system initially prepared teachers. Statistically significant odds ratios above 1 indicate greater odds of receiving higher
evaluation ratings; statistically significant odds ratios below 1 indicate lesser odds of receiving higher evaluation ratings.
Note: * and** indicate statistical significance at the 0.05 and 0.01 levels, respectively.
Appalachian State University (ASU): Overall, initially prepared teachers from ASU had
significantly higher evaluation ratings than non-UNC system initially prepared teachers for four
NCPTS—Leadership, Content Knowledge, Facilitating Student Learning, and Reflecting on
Practice. Initially prepared teachers from ASU and non-UNC system institutions were rated
similarly on the Classroom Environment standard. Examining the results by school level, Tables
11-13 show that initially prepared teachers from ASU had significantly higher evaluation ratings
in elementary schools but were rated no differently than the comparison group in middle and
high schools.
East Carolina University (ECU): Overall, initially prepared teachers from ECU and non-
UNC system institutions were rated similarly on all five NCPTS. Examining the results by
school level, Tables 11-13 show that initially prepared teachers from ECU had significantly
higher evaluation ratings for four NCPTS in middle schools—Leadership, Classroom
Environment, Facilitating Student Learning, and Reflecting on Practice—but were rated no
differently than the comparison group in elementary and high schools.
Elizabeth City State University (ECSU): Overall, initially prepared teachers from ECSU
had significantly lower evaluation ratings than non-UNC system initially prepared teachers for
one NCPTS—Content Knowledge—and were rated similarly on the remaining four standards.
Examining the results by school level, Tables 11-13 show that initially prepared teachers from
ECSU had significantly lower evaluation ratings than non-UNC system initially prepared
teachers for all five NCPTS in high schools. Initially prepared teachers from ECSU and non-
UNC system institutions were rated similarly in elementary and middle schools.

37
Fayetteville State University (FSU): Overall, initially prepared teachers from FSU and
non-UNC system institutions were rated similarly on all five NCPTS. Examining the results by
school level, Tables 11-13 show that initially prepared teachers from FSU and non-UNC system
institutions were rated similarly in elementary, middle, and high schools.
North Carolina A&T State University (NCAT): Overall, initially prepared teachers from
NCAT had significantly lower evaluation ratings than non-UNC system initially prepared
teachers for three NCPTS—Leadership, Facilitating Student Learning, and Reflecting on
Practice—and were rated similarly on the Classroom Environment and Content Knowledge
standards. Examining the results by school level, Tables 11-13 show that initially prepared
teachers from NCAT had significantly lower evaluation ratings for one NCPTS in elementary
schools—Reflecting on Practice—and one NCPTS in middle and high schools—Leadership.
North Carolina Central University (NCCU): Overall, initially prepared teachers from
NCCU and non-UNC system institutions were rated similarly on all five NCPTS. Examining the
results by school level, Tables 11-13 show that initially prepared teachers from NCCU had
significantly higher evaluation ratings for one NCPTS in elementary schools—Content
Knowledge—and were rated similarly to non-UNC system initially prepared teachers for the
remaining standards in elementary, middle, and high schools.
North Carolina State University (NCSU): Overall, initially prepared teachers from
NCSU had significantly higher evaluation ratings than non-UNC system initially prepared
teachers for all five NCPTS—Leadership, Classroom Environment, Content Knowledge,
Facilitating Student Learning, and Reflecting on Practice. Examining the results by school level,
Tables 11-13 show that initially prepared teachers from NCSU had significantly higher
evaluation ratings for all five NCPTS in elementary, middle, and high schools.
University of North Carolina – Asheville (UNCA): Overall, initially prepared teachers
from UNCA had significantly higher evaluation ratings than non-UNC system initially prepared
teachers for all five NCPTS—Leadership, Classroom Environment, Content Knowledge,
Facilitating Student Learning, and Reflecting on Practice. Examining the results by school level,
Tables 11-13 show that initially prepared teachers from UNCA had significantly higher
evaluation ratings for four NCPTS in elementary schools—Leadership, Content Knowledge,
Facilitating Student Learning, and Reflecting on Practice—significantly higher evaluation ratings
for one NCPTS in middle schools—Facilitating Student Learning—and significantly higher
evaluation ratings for three NCPTS in high schools—Leadership, Content Knowledge, and
Reflecting on Practice.
University of North Carolina – Chapel Hill (UNCCH): Overall, initially prepared
teachers from UNCCH had significantly higher evaluation ratings than non-UNC system initially
prepared teachers for all five NCPTS—Leadership, Classroom Environment, Content
Knowledge, Facilitating Student Learning, and Reflecting on Practice. Examining the results by
school level, Tables 11-13 show that initially prepared teachers from UNCCH had significantly
higher evaluation ratings for all five NCPTS in elementary and high schools and significantly
higher evaluation ratings for one NCPTS in middle schools—Content Knowledge.

38
University of North Carolina – Charlotte (UNCC): Overall, initially prepared teachers
from UNCC had significantly higher evaluation ratings than non-UNC system initially prepared
teachers for four NCPTS—Leadership, Classroom Environment, Facilitating Student Learning,
and Reflecting on Practice—and were rated similarly on the Content Knowledge standard.
Examining the results by school level, Tables 11-13 show that initially prepared teachers from
UNCC had significantly higher evaluation ratings for one NCPTS in elementary schools—
Leadership—significantly higher evaluation ratings for two NCPTS in middle schools—
Leadership and Facilitating Student Learning—and significantly higher evaluation ratings for
three NCPTS in high schools—Leadership, Facilitating Student Learning, and Reflecting on
Practice.
University of North Carolina – Greensboro (UNCG): Overall, initially prepared teachers
from UNCG and non-UNC system institutions were rated similarly on all five NCPTS.
Examining the results by school level, Tables 11-13 show that initially prepared teachers from
UNCG had significantly lower evaluation ratings for one NCPTS in elementary schools—
Reflecting on Practice—and significantly higher evaluation ratings for three NCPTS in high
schools—Leadership, Classroom Environment, and Facilitating Student Learning.
University of North Carolina – Pembroke (UNCP): Overall, initially prepared teachers
from UNCP had significantly lower evaluation ratings than non-UNC system initially prepared
teachers for two NCPTS—Leadership and Reflecting on Practice—and were rated similarly on
the Classroom Environment, Content Knowledge, and Facilitating Student Learning standards.
Examining the results by school level, Tables 11-13 show that initially prepared teachers from
UNCP had significantly lower evaluation ratings for one NCPTS in elementary schools—
Reflecting on Practice—and were rated similarly to non-UNC system initially prepared teachers
for all other standards in elementary, middle, and high schools.
University of North Carolina – Wilmington (UNCW): Overall, initially prepared teachers
from UNCW had significantly higher evaluation ratings than non-UNC system initially prepared
teachers for all five NCPTS—Leadership, Classroom Environment, Content Knowledge,
Facilitating Student Learning, and Reflecting on Practice. Examining the results by school level,
Tables 11-13 show that initially prepared teachers from UNCW had significantly higher
evaluation ratings for one NCPTS in elementary schools—Facilitating Student Learning—
significantly higher evaluation ratings for two NCPTS in middle schools—Classroom
Environment and Facilitating Student Learning—and significantly higher evaluation ratings for
four NCPTS in high schools—Leadership, Content Knowledge, Facilitating Student Learning,
and Reflecting on Practice.
Western Carolina University (WCU): Overall, initially prepared teachers from WCU and
non-UNC system institutions were rated similarly on all five NCPTS. Examining the results by
school level, Tables 11-13 show that initially prepared teachers from WCU and non-UNC system
institutions were rated similarly in elementary, middle, and high schools.
Winston-Salem State University (WSSU): Overall, initially prepared teachers from
WSSU had significantly lower evaluation ratings than non-UNC system initially prepared
teachers for four NCPTS—Classroom Environment, Content Knowledge, Facilitating Student

39
Learning, and Reflecting on Practice—and were rated similarly on the Leadership standard.
Examining the results by school level, Tables 11-13 show that initially prepared teachers from
WSSU had significantly lower evaluation ratings for one NCPTS in elementary schools—
Content Knowledge—significantly lower evaluation ratings for one NCPTS in middle schools—
Facilitating Student Learning—and significantly lower evaluation ratings for four NCPTS in
high schools—Leadership, Content Knowledge, Facilitating Student Learning, and Reflecting on
Practice.
Selection vs Preparation: The evaluation rating results summarized above represent a
combination of selection into teacher preparation programs and the quality of preparation
received therein. To separate these two effects, we included a measure of pre-teacher
preparation program academic ability in the evaluation rating models.11
Table 14 displays these
results, which compare evaluation ratings from teachers with similar values for the academic
ability measure.
Table 14: Results from Evaluation Rating Models Controlling for a Measure of Academic Ability
University Standard 1:
Leadership
Standard 2:
Classroom
Environment
Standard 3:
Content
Knowledge
Standard 4:
Facilitating
Student
Learning
Standard 5:
Reflecting on
Practice
ASU 0.958 0.926 0.969 0.935 0.956
ECU 0.962 0.982 0.938 0.973 1.036
ECSU 1.039 0.872 0.827 0.953 1.030
FSU 0.941 0.982 0.973 1.011 0.947
NCAT 0.690** 0.817 0.915 0.742** 0.668**
NCCU 1.034 1.042 1.130 0.996 1.055
NCSU 1.343** 1.313** 1.535** 1.386** 1.432**
UNCA 1.300* 1.022 1.380** 1.294* 1.243
UNCCH 1.225** 1.423** 1.390** 1.329** 1.352**
UNCC 1.151** 1.067 0.943 1.053 1.064
UNCG 0.832** 0.855** 0.838** 0.836** 0.803**
UNCP 0.777** 0.821* 0.800* 0.771** 0.684**
UNCW 1.024 1.076 1.047 1.087 1.024
WCU 0.991 0.959 0.979 0.993 0.942
WSSU 0.844 0.822 0.692** 0.739** 0.831 Note: Each cell in this table displays odds ratios from a separate evaluation rating model which specifies all other initially
prepared UNC system teachers as the reference group and includes the academic ability measure. Statistically significant odds
ratios above 1 indicate greater odds of receiving higher evaluation ratings; statistically significant odds ratios below 1 indicate
lesser odds of receiving higher evaluation ratings.
Note: * and ** indicate statistical significance at the 0.05 and 0.01 levels, respectively.
11
Unlike our overall evaluation rating models, the sample for these models only includes initially-prepared UNC
system institution teachers. For each UNC system institution we specify all other initially-prepared UNC system
institution teachers as the reference category and run models for each of the five NCPTS.

40
Overall, the measure of pre-teacher preparation program academic ability significantly
predicted higher evaluation ratings across all five NCPTS. Initially prepared teachers from
NCSU and UNCCH had significantly higher evaluation ratings than initially prepared graduates
from all other UNC system institutions across all five NCPTS and initially prepared teachers
from UNCA had significantly higher evaluation ratings for three NCPTS. Despite controlling
for a measure of pre-teacher preparation program academic ability, these positive results are for
the UNC system institutions with the highest average academic ability values (shown in Table
5). Conversely, initially prepared teachers from UNCG and UNCP had significantly lower
evaluation ratings than initially prepared graduates from all other UNC system institutions across
all five NCPTS and initially prepared teachers from NCAT and WSSU had significantly lower
evaluation ratings for three and two NCPTS, respectively. These negative evaluation rating
results are generally for UNC system institutions with negative values for the academic ability
measure—UNCG being the exception. However, other institutions with negative academic
ability values, such as ECSU, FSU, and NCCU, had evaluation rating results comparable to all
other UNC system institutions. Taken together, these results show that initially prepared
graduates from some UNC system institutions receive evaluation ratings that are significantly
higher or lower than the evaluation ratings of peers from other UNC system institutions with
comparable levels of pre-teacher preparation program academic ability. This suggests that
certain UNC system institutions are ‘adding value’ to the performance of their initially prepared
teachers through the quality of their preparation components.
Conclusion
There is no single outcome measure that completely captures the quality of a teacher
preparation program. Just as individual teacher performance is better identified through multiple
outcomes—e.g. student achievement, classroom observations, student surveys—the evaluation
and improvement of teacher preparation programs is better served by considering teacher
preparation program effectiveness across multiple measures. Therefore, in this report, we
assessed the performance of UNC system institution teacher preparation programs by examining
the adjusted average student test scores and evaluation ratings of their initially prepared teachers.
These outcomes are policy relevant, more comprehensive—both in terms of sample and
capturing multiple facets of teaching quality—than either approach alone, and provide UNC
system institutions with more evidence about the quality of teachers they produce.
An important question for teacher preparation programs considering this evidence for
programmatic reforms is the degree to which value-added estimates and evaluation ratings (or
additional outcome measures) correspond with each other. While teacher preparation programs
can act on either piece of evidence alone—or other evidences, such as surveys of recent program
graduates—when results are consistent across outcome measures teacher preparation programs
can more confidently identify program quality and pursue programmatic changes. This report
shows consistency for many UNC system institutions. For example: (1) ECU initially prepared
teachers are more effective in middle grades reading and algebra I and receive higher evaluation
ratings for four NCPTS in middle schools; (2) UNCC initially prepared teachers are more
effective in middle grades reading and high school biology and English I/II and receive higher
evaluation ratings for two NCPTS in middle schools and three NCPTS in high schools; (3)
NCSU initially prepared teachers are more effective in elementary grades mathematics and high

41
school algebra I and receive higher evaluation ratings for all five NCPTS in elementary and high
schools; and (4) UNCW initially prepared teachers are more effective in elementary grades
mathematics, 5th
grade science, and middle grades mathematics and receive higher evaluation
ratings for one NCPTS in elementary schools and two NCPTS in middle schools. By contrast,
there are also several UNC system institutions with differing value-added and evaluation rating
results. For example: (1) UNCA initially prepared teachers are less effective in elementary
grades mathematics but receive higher evaluation ratings for four NCPTS in elementary schools
and (2) UNCG initially prepared teachers are less effective in high school biology and English
I/II but receive higher evaluation ratings for three NCPTS in high schools. While multiple
factors may contribute to these differences—changes in sample between value-added and
evaluation rating models or a lack of alignment between teaching skills beneficial to student test
scores and classroom observations—such discrepancies complicate the process of teacher
preparation program accountability and reform.
Overall, many UNC system institutions are performing as well as or better than non-UNC
system sources of initially prepared teachers. Eight UNC system institutions have at least one
positive and statistically significant impact on student achievement gains; four other programs
perform no differently than non-UNC system institution initially prepared teachers. Nine UNC
system institutions have at least one instance of significantly higher evaluation ratings—in the
school-level specific evaluation rating models—and initially prepared teachers from two other
programs are evaluated comparably to non-UNC system initially prepared teachers. Beyond
these results, whose primary purpose is program accountability, this report extended previous
analyses by estimating separate value-added models for subgroups of students—free and
reduced-price lunch, racial and ethnic minority, and low-performing students—and estimating
value-added and evaluation models that included a measure of pre-teacher preparation program
academic ability. With the student subgroup models, we provide data on success with
academically at-risk students and finer grained evidence to inform program improvement. Now,
UNC system institutions can better connect programmatic elements—e.g. course content and
sequencing or fieldwork and student teaching placements—to success with specific groups of
students. While it is unknown how well the measure of academic ability accounts for selection
into teacher preparation programs, our selection vs preparation models allow UNC system
institutions to begin to isolate their unique ‘value-added’ to teacher performance. This evidence
may be particularly important as teacher preparation programs work to identify programmatic
elements predicting teaching effectiveness.

42
Appendix
Table A: Multi-Level Models for UNC System Initially Prepared Teachers
University ES
Math
ES
Read
5th
Science
MS
Math
MS
Read
8th
Science
MS
Algebra
HS
Algebra
HS
Biology
HS
English
ASU 0.009
(0.008)
0.000
(0.006)
0.019
(0.014)
0.010
(0.012)
-0.007
(0.006)
0.015
(0.030)
-0.003
(0.043)
-0.019
(0.017)
-0.044
(0.033)
-0.012
(0.010)
ECU -0.016
(0.008)
0.009
(0.006)
-0.008
(0.015)
0.016
(0.012) 0.014
*
(0.007)
-0.050
(0.030) 0.065
*
(0.033)
-0.016
(0.017)
-0.026
(0.032)
0.013
(0.010)
ECSU 0.016
(0.022)
-0.039
(0.020)
-0.051
(0.035)
-0.013
(0.024)
-0.007
(0.029)
FSU 0.009
(0.022)
0.011
(0.015)
0.040
(0.048)
-0.009
(0.022)
0.007
(0.013)
0.022
(0.027)
0.031
(0.053)
0.019
(0.018)
NCA&T 0.011
(0.025)
-0.041
(0.023) -0.139
**
(0.053) -0.088
**
(0.032)
-0.033
(0.027)
-0.016
(0.038)
-0.011
(0.025)
NCCU 0.012
(0.019)
0.008
(0.018) 0.143
**
(0.036)
0.007
(0.027)
-0.007
(0.024)
-0.085
(0.056)
-0.031
(0.024)
NCSU 0.062
**
(0.020)
0.015
(0.014)
0.040
(0.037)
-0.002
(0.015)
-0.004
(0.006)
0.044
(0.030)
0.011
(0.036) 0.028
*
(0.013)
-0.008
(0.026)
0.005
(0.009)
UNCA -0.047
*
(0.023)
-0.012
(0.017)
0.052
(0.040)
-0.045
(0.031)
0.004
(0.012)
-0.073
(0.043)
-0.036
(0.051)
-0.031
(0.019)
UNCCH 0.026
(0.014)
0.000
(0.012)
0.024
(0.025) 0.046
*
(0.018)
0.002
(0.009)
0.028
(0.028) -0.110
**
(0.042)
0.027
(0.030)
0.009
(0.030)
0.008
(0.013)
UNCC 0.001
(0.008)
0.000
(0.007)
0.027
(0.017)
0.004
(0.014) 0.019
*
(0.009)
0.052
(0.033)
-0.053
(0.029)
0.017
(0.018) 0.118
*
(0.057) 0.033
*
(0.014)
UNCG 0.025
**
(0.009)
-0.008
(0.007)
0.006
(0.016)
0.002
(0.015) -0.019
*
(0.009)
0.027
(0.032)
0.069
(0.052)
-0.023
(0.028) -0.081
*
(0.039) -0.040
**
(0.011)
UNCP -0.016
(0.020)
-0.001
(0.015)
0.009
(0.033)
0.002
(0.029)
0.000
(0.016) -0.121
**
(0.042)
0.013
(0.044)
-0.049*
(0.019)
UNCW 0.028
*
(0.012)
0.017
(0.009) 0.077
**
(0.021) 0.047
**
(0.016)
0.010
(0.008)
0.038
(0.032)
0.004
(0.044)
0.017
(0.022)
0.040
(0.039)
0.007
(0.014)
WCU 0.006
(0.016)
0.003
(0.012) 0.060
*
(0.027)
0.027
(0.015)
-0.013
(0.011)
-0.071
(0.044)
0.038
(0.045)
0.025
(0.025)
-0.059
(0.037)
0.031
(0.022)
WSSU -0.025
(0.034)
0.020
(0.029)
0.017
(0.052)
-0.007
(0.039)
0.004
(0.027)
Note: The reference group for these models is non-UNC system initially prepared teachers.
Note: * and ** indicate statistical significance at the 0.05 and 0.01 levels, respectively. Highlighted cells have fewer than ten teachers and therefore do not have any results
reported. These results are graphed in Figures 1-10.

43
Table B: Multi-Level Models for UNC System Initially Prepared Teachers Teaching Free and Reduced Price Lunch Students
University ES
Math
ES
Read
5th
Science
MS
Math
MS
Read
8th
Science
MS
Algebra
HS
Algebra
HS
Biology
HS
English
ASU 0.012
(0.010)
0.008
(0.008) 0.045**
(0.016)
0.018
(0.014)
-0.007
(0.008)
0.000
(0.027)
0.019
(0.053)
-0.031
(0.019)
-0.057
(0.037)
-0.003
(0.012)
ECU -0.009
(0.009) 0.015
*
(0.007)
-0.002
(0.017) 0.028
*
(0.012) 0.026
**
(0.008)
-0.052
(0.030)
0.069
(0.038)
-0.024
(0.019)
-0.031
(0.034)
0.006
(0.011)
ECSU 0.006
(0.025) -0.059
*
(0.023)
-0.062
(0.035)
-0.025
(0.027)
0.009
(0.036)
FSU 0.012
(0.024)
0.023
(0.017)
0.037
(0.051)
-0.014
(0.022)
0.023
(0.014)
0.014
(0.029)
0.065
(0.052)
0.016
(0.019)
NCA&T 0.006
(0.029)
-0.045
(0.028) -0.124
*
(0.053) -0.067
*
(0.028)
-0.036
(0.026)
-0.009
(0.035)
-0.005
(0.026)
NCCU 0.013
(0.023)
-0.001
(0.021) 0.181
**
(0.042)
-0.005
(0.027)
-0.002
(0.026)
-0.091
(0.061)
-0.047
(0.040)
NCSU 0.061
**
(0.023)
0.009
(0.021)
0.023
(0.051)
0.014
(0.016)
-0.008
0.008)
0.042
(0.029)
0.046
(0.035) 0.036
*
(0.016)
-0.012
(0.028)
0.003
(0.013)
UNCA -0.063
*
(0.027)
-0.020
(0.021)
0.044
(0.042)
-0.052
(0.034)
-0.004
(0.013)
-0.053
(0.047)
-0.057
(0.053)
-0.026
(0.021)
UNCCH 0.004
(0.017)
-0.018
(0.017)
0.031
(0.035) 0.047
*
(0.020)
0.014
(0.012)
0.021
(0.031)
-0.107
(0.057)
0.020
(0.033)
0.047
(0.034)
0.016
(0.017)
UNCC 0.008
(0.010)
0.003
(0.010)
0.016
(0.020)
0.000
(0.015)
0.023
(0.012)
0.069
(0.036)
-0.063
(0.050)
0.008
(0.021) 0.133
*
(0.061)
0.020
(0.015)
UNCG 0.027
**
(0.01)
-0.005
(0.009)
-0.004
(0.018)
0.000
(0.016)
-0.013
(0.010)
0.019
(0.038)
-0.017
(0.060)
-0.000
(0.033) -0.111
**
(0.041) -0.043
**
(0.014)
UNCP -0.014
(0.021)
-0.012
(0.017)
0.018
(0.033)
0.012
(0.031)
0.000
(0.018) -0.119
*
(0.046)
0.014
(0.043)
-0.041*
(0.017)
UNCW 0.023
(0.013)
0.022
(0.012) 0.092
**
(0.023) 0.051
**
(0.018)
0.013
(0.009)
0.035
(0.037)
0.047
(0.052)
-0.001
(0.025)
0.050
(0.039)
0.004
(0.016)
WCU 0.005
(0.018)
0.005
(0.015)
0.040
(0.031)
0.027
(0.017)
-0.004
(0.012)
-0.075
(0.046)
0.034
(0.080)
0.008
(0.029) -0.084
**
(0.032) 0.052
*
(0.023)
WSSU -0.005
(0.035)
0.050
(0.028)
0.012
(0.059)
0.008
(0.035)
0.003
(0.035)
Note: The reference group for these models is non-UNC system initially prepared teachers.
Note: * and ** indicate statistical significance at the 0.05 and 0.01 levels, respectively. Highlighted cells have fewer than ten teachers and therefore do not have any results
reported. These results are graphed in Figures 1-10.

44
Table C: Multi-Level Models for UNC System Initially Prepared Teachers Teaching Racial/Ethnic Minority Students
University ES
Math
ES
Read
5th
Science
MS
Math
MS
Read
8th
Science
MS
Algebra
HS
Algebra
HS
Biology
HS
English
ASU 0.004
(0.01)
-0.002
(0.009)
0.022
(0.018)
0.017
(0.014)
-0.002
(0.008)
0.021
(0.034)
0.015
(0.054) -0.042
*
(0.020)
-0.053
(0.040)
-0.016
(0.012)
ECU -0.017
(0.009)
0.011
(0.007)
-0.004
(0.016)
0.021
(0.012) 0.016* (0.008)
-0.049
(0.031)
0.061
(0.035)
-0.033
(0.017)
-0.064
(0.034)
0.010
(0.011)
ECSU 0.006
(0.024)
-0.035
(0.02)
-0.034
(0.034)
-0.016
(0.024)
0.015
(0.032)
FSU 0.018
(0.023)
0.009
(0.019)
0.035
(0.049)
-0.009
(0.022)
0.008
(0.013)
0.021
(0.026)
0.074
(0.055)
0.023
(0.020)
NCA&T 0.018
(0.027)
-0.037
(0.025) -0.143
**
(0.055) -0.088
**
(0.031)
-0.041
(0.033)
-0.027
(0.038)
-0.008
(0.025)
NCCU 0.008
(0.021)
0.003
(0.019) 0.144
**
(0.036)
-0.003
(0.027)
-0.001
(0.024)
-0.119*
(0.052)
-0.055
(0.028)
NCSU 0.071
**
(0.022)
0.012
(0.017)
0.053
(0.040)
-0.003
(0.015)
-0.005
(0.007) 0.055
*
(0.028)
0.006
(0.033) 0.042
**
(0.015)
-0.011
(0.028)
0.012
(0.012)
UNCA -0.083
**
(0.029)
0.005
(0.021)
0.057
(0.057)
-0.027
(0.035)
-0.003
(0.013)
-0.065
(0.051)
-0.073
(0.046)
-0.033
(0.026)
UNCCH 0.031
*
(0.016)
0.000
(0.014)
0.033
(0.028)
0.033
(0.019)
0.004
(0.011)
0.047
(0.027) -0.094
**
(0.045)
0.034
(0.032)
0.021
(0.034)
-0.005
(0.017)
UNCC 0.004
(0.009)
0.010
(0.009)
0.029
(0.018)
0.020
(0.015)
0.013
(0.011)
0.047
(0.041)
-0.048
(0.039)
0.021
(0.023) 0.143
*
(0.065)
0.021
(0.019)
UNCG 0.018
(0.010)
-0.015
(0.008)
-0.005
(0.018)
-0.001
(0.015) -0.024
*
(0.010)
0.008
(0.032)
0.073
(0.044)
-0.052
(0.032) -0.094
*
(0.040) -0.044
**
(0.013)
UNCP -0.015
(0.021)
-0.001
(0.016)
-0.024
(0.033)
0.006
(0.032)
-0.007
(0.016) -0.102
*
(0.046)
0.031
(0.053)
-0.043*
(0.018)
UNCW 0.024
(0.013)
0.013
(0.011) 0.068
**
(0.024) 0.047
**
(0.017)
0.011
(0.009)
0.026
(0.037)
-0.024
(0.052)
0.006
(0.026)
0.053
(0.039)
0.010
(0.017)
WCU -0.003
(0.020)
-0.010
(0.016)
0.042
(0.038)
0.032
(0.017)
-0.027
(0.015)
-0.035
(0.043)
0.047
(0.059)
0.027
(0.030) -0.090
*
(0.035) 0.068
*
(0.027)
WSSU -0.021
(0.038)
0.030
(0.031)
0.003
(0.056)
0.020
(0.033)
0.004
(0.031)
Note: The reference group for these models is non-UNC system initially prepared teachers.
Note: * and ** indicate statistical significance at the 0.05 and 0.01 levels, respectively. Highlighted cells have fewer than ten teachers and therefore do not have any results
reported. These results are graphed in Figures 1-10.

45
Table D: Multi-Level Models for UNC System Initially Prepared Teachers Teaching Low-Performing Students
University ES
Math
ES
Read
5th
Science
MS
Math
MS
Read
8th
Science
HS
Algebra
HS
Biology
HS
English
ASU 0.012
(0.010)
0.008
(0.008) 0.064
*
(0.026)
0.018
(0.014)
-0.007
(0.008)
0.000
(0.027)
-0.031
(0.019)
-0.057
(0.037)
-0.003
(0.012)
ECU -0.009
(0.009) 0.015
*
(0.007)
0.000
(0.022) 0.028
*
(0.012) 0.026
**
(0.008)
-0.052
(0.030)
-0.024
(0.019)
-0.031
(0.034)
0.006
(0.011)
ECSU 0.006
(0.025) -0.059
*
(0.023)
-0.011
(0.060)
-0.025
(0.027)
0.009
(0.036)
FSU 0.012
(0.024)
0.023
(0.017)
0.008
(0.067)
-0.014
(0.022)
0.023
(0.014)
0.014
(0.029)
0.065
(0.052)
0.016
(0.019)
NCA&T 0.006
(0.029)
-0.045
(0.028) -0.152
*
(0.068) -0.067
*
(0.028)
-0.036
(0.026)
-0.009
(0.035)
-0.005
(0.026)
NCCU 0.013
(0.023)
-0.001
(0.021) 0.146
*
(0.057)
-0.005
(0.027)
-0.002
(0.026)
-0.091
(0.061)
-0.047
(0.040)
NCSU 0.061
**
(0.023)
0.009
(0.021)
0.006
(0.051)
0.014
(0.016)
-0.008
0.008)
0.042
(0.029) 0.036
*
(0.016)
-0.012
(0.028)
0.003
(0.013)
UNCA -0.063
*
(0.027)
-0.020
(0.021)
0.028
(0.082)
-0.052
(0.034)
-0.004
(0.013)
-0.053
(0.047)
-0.057
(0.053)
-0.026
(0.021)
UNCCH 0.004
(0.017)
-0.018
(0.017) 0.100
*
(0.049) 0.047
*
(0.020)
0.014
(0.012)
0.021
(0.031)
0.020
(0.033)
0.047
(0.034)
0.016
(0.017)
UNCC 0.008
(0.010)
0.003
(0.010) 0.063
*
(0.029)
0.000
(0.015)
0.023
(0.012)
0.069
(0.036)
0.008
(0.021) 0.133
*
(0.061)
0.020
(0.015)
UNCG 0.027
**
(0.01)
-0.005
(0.009)
-0.023
(0.027)
0.000
(0.016)
-0.013
(0.010)
0.019
(0.038)
-0.000
(0.033) -0.111
**
(0.041) -0.043
**
(0.014)
UNCP -0.014
(0.021)
-0.012
(0.017)
0.075
(0.045)
0.012
(0.031)
0.000
(0.018) -0.119
*
(0.046)
0.014
(0.043)
-0.041*
(0.017)
UNCW 0.023
(0.013)
0.022
(0.012) 0.097
**
(0.032) 0.051
**
(0.018)
0.013
(0.009)
0.035
(0.037)
-0.001
(0.025)
0.050
(0.039)
0.004
(0.016)
WCU 0.005
(0.018)
0.005
(0.015)
0.050
(0.048)
0.027
(0.017)
-0.004
(0.012)
-0.075
(0.046)
0.008
(0.029) -0.084
**
(0.032) 0.052
*
(0.023)
WSSU -0.005
(0.035)
0.050
(0.028)
0.144
(0.082)
0.008
(0.035)
0.003
(0.035)
Note: The reference group for these models is non-UNC system initially prepared teachers.
Note: * and ** indicate statistical significance at the 0.05 and 0.01 levels, respectively. Highlighted cells have fewer than ten teachers and therefore do not have any results
reported. These results are graphed in Figures 1-10.

46
Table E: School Fixed Effects Models for UNC System Initially Prepared Teachers
University ES
Math
ES
Read
5th
Science
MS
Math
MS
Read
8th
Science
MS
Algebra
HS
Algebra
HS
Biology
HS
English
ASU 0.009
(0.009)
0.005
(0.007)
0.004
(0.016)
0.008
(0.013)
0.000
(0.007)
0.018
(0.041)
0.027
(0.053)
0.001
(0.018)
-0.040
(0.034)
-0.000
(0.012)
ECU -0.017
(0.009)
0.011
(0.007)
0.020
(0.018)
0.010
(0.013) 0.019
**
(0.008)
-0.018
(0.026) 0.127
*
(0.051)
-0.024
(0.018)
-0.006
(0.033) 0.032
*
(0.013)
ECSU 0.014
(0.029)
-0.052
(0.027)
-0.086
(0.056)
-0.011
(0.033)
-0.012
(0.036)
FSU -0.007
(0.022)
-0.012
(0.015)
0.009
(0.049)
-0.002
(0.023)
0.007
(0.014)
0.040
(0.029)
-0.050
(0.041)
0.000
(0.022)
NCA&T 0.005
(0.026)
0.002
(0.022) -0.133
*
(0.064) -0.074
*
(0.031)
-0.014
(0.029)
0.015
(0.041)
0.049
(0.032)
NCCU 0.015
(0.021)
0.010
(0.020) 0.096
*
(0.041)
0.036
(0.029)
0.004
(0.024)
-0.024
(0.053)
-0.068*
(0.026)
NCSU 0.059
**
(0.023)
0.018
(0.015) 0.072
*
(0.035)
-0.008
(0.016)
-0.003
(0.007)
0.037
(0.029)
-0.026
(0.038) 0.042
**
(0.014)
-0.005
(0.025)
0.004
(0.011)
UNCA -0.044
(0.024)
-0.021
(0.018)
0.070
(0.040)
-0.046
(0.033)
0.005
(0.013)
0.022
(0.057)
-0.013
(0.057)
-0.014
(0.036)
UNCCH 0.032
*
(0.014)
0.008
(0.011)
0.020
(0.025) 0.063
**
(0.019)
0.011
(0.010)
-0.037
(0.037)
-0.079
(0.048) 0.076
*
(0.031) 0.074
**
(0.027)
0.017
(0.014)
UNCC -0.002
(0.009)
0.002
(0.007) 0.056
**
(0.017)
-0.003
(0.015)
0.009
(0.010)
0.014
(0.036)
-0.004
(0.039)
0.039
(0.021) 0.143
**
(0.049)
0.028
(0.015)
UNCG 0.025
**
(0.009)
0.014
(0.007)
0.021
(0.018)
0.012
(0.016) -0.021
*
(0.009) 0.098
*
(0.040) 0.123
*
(0.057)
-0.021
(0.028)
-0.071
(0.059) -0.026
*
(0.012)
UNCP -0.035
(0.023)
0.003
(0.016)
-0.004
(0.033)
-0.004
(0.030)
0.007
(0.018)
0.063
(0.082)
0.030
(0.042)
-0.043*
(0.022)
UNCW 0.040
**
(0.012)
0.019
(0.010) 0.060
**
(0.023) 0.045
**
(0.016)
0.001
(0.009) 0.088
*
(0.038)
-0.040
(0.058)
0.022
(0.023) 0.074
*
(0.036)
0.001
(0.016)
WCU 0.008
(0.018)
-0.002
(0.014) 0.066
*
(0.030) 0.048
**
(0.017)
-0.017
(0.012)
-0.012
(0.075)
0.039
(0.054)
0.046
(0.028)
-0.062
(0.044)
0.052
(0.027)
WSSU -0.050
(0.036)
0.000
(0.026)
-0.001
(0.059)
0.002
(0.040)
0.002
(0.027)
Note: The reference group for these models is non-UNC system initially prepared teachers.
Note: * and ** indicate statistical significance at the 0.05 and 0.01 levels, respectively. Highlighted cells have fewer than ten teachers and therefore do not have any results
reported.

47
Table F: Multi-Level Models for UNC System Initially Prepared Undergraduate Teachers
University ES
Math
ES
Read
5th
Science
MS
Math
MS
Read
8th
Science
MS
Algebra
HS
Algebra
HS
Biology
HS
English
ASU 0.009
(0.008)
0.002
(0.007)
0.018
(0.015)
0.010
(0.012)
-0.009
(0.006)
0.017
(0.031)
-0.006
(0.043)
-0.019
(0.017)
-0.049
(0.035)
-0.014
(0.010)
ECU -0.022
**
(0.009) 0.015
*
(0.006)
-0.016
(0.015)
0.016
(0.013)
0.013
(0.007)
-0.030
(0.033)
0.058
(0.034)
-0.015
(0.017)
-0.048
(0.036)
0.005
(0.011)
ECSU 0.020
(0.022)
-0.031
(0.019)
-0.052
(0.035)
-0.004
(0.026)
0.004
(0.028)
FSU 0.013
(0.023)
0.011
(0.015)
0.051
(0.047)
-0.009
(0.022)
0.013
(0.013)
0.043*
(0.019)
0.017
(0.018)
NCA&T 0.009
(0.026)
-0.035
(0.022) -0.139
**
(0.054) -0.091
**
(0.032)
-0.017
(0.038)
NCCU 0.018
(0.022)
0.018
(0.019) 0.128
**
(0.041)
0.015
(0.032)
-0.005
(0.031)
-0.083
(0.060)
-0.047*
(0.022)
NCSU 0.047
*
(0.022)
0.024
(0.016)
0.055
(0.042)
0.006
(0.016)
-0.002
0.007)
0.039
(0.032)
0.011
(0.036) 0.027
*
(0.014)
0.000
(0.027)
0.006
(0.009)
UNCA -0.040
(0.024)
-0.006
(0.017) 0.078
*
(0.039)
-0.046
(0.031)
-0.004
(0.013)
-0.073
(0.043)
-0.084
(0.045)
-0.033
(0.018)
UNCCH 0.026
(0.015)
0.002
(0.012)
0.027
(0.025) 0.045
*
(0.019)
0.003
(0.010)
0.030
(0.031) -0.137
**
(0.043)
-0.022
(0.051)
0.051
(0.043)
UNCC 0.001
(0.008)
0.003
(0.007)
0.028
(0.017)
0.005
(0.014) 0.021
*
(0.010)
0.053
(0.033)
-0.047
(0.029)
0.020
(0.018)
0.101
(0.058)
0.029
(0.016)
UNCG 0.028
**
(0.010)
-0.005
(0.008)
0.023
(0.017)
-0.004
(0.016)
-0.015
(0.009)
0.029
(0.033)
0.092
(0.059)
-0.032
(0.028) -0.099
**
(0.038) -0.042
**
(0.012)
UNCP -0.019
(0.020)
-0.002
(0.015)
0.006
(0.033) 0.003
(0.030)
-0.001
(0.016) -0.151
**
(0.031) 0.021
(0.047)
-0.057**
(0.021)
UNCW 0.029
*
(0.012) 0.020
*
(0.009) 0.078
**
(0.021) 0.049
**
(0.016)
0.009
0.008)
0.034
(0.034)
0.006
(0.043)
0.017
(0.022)
0.061
(0.061)
0.013
(0.016)
WCU 0.001
(0.016)
0.004
(0.012) 0.065
*
(0.027)
0.027
(0.015)
-0.019
(0.013)
-0.050
(0.050)
0.018
(0.045)
0.023
(0.029)
-0.044
(0.053)
0.029
(0.024)
WSSU -0.026
(0.034)
0.021
(0.029)
0.019
(0.052)
0.014
(0.027)
Note: The reference group for these models is non-UNC system initially prepared teachers.
Note:* and ** indicate statistical significance at the 0.05 and 0.01 levels, respectively. Highlighted cells have fewer than ten teachers and therefore do not have any results
reported.

48
Table G: School Fixed Effects Models for UNC System Initially Prepared Undergraduate Teachers
University ES
Math
ES
Read
5th
Science
MS
Math
MS
Read
8th
Science
MS
Algebra
HS
Algebra
HS
Biology
HS
English
ASU 0.011
(0.009)
0.006
(0.007)
0.003
(0.016)
0.008
(0.013)
-0.001
(0.008)
0.015
(0.042)
0.027
(0.053)
-0.003
(0.018)
-0.037
(0.038)
-0.006
(0.012)
ECU -0.024
*
(0.010)
0.013
(0.007)
0.006
(0.019)
0.008
(0.014) 0.016
*
(0.008)
-0.010
(0.029) 0.152
**
(0.053)
-0.024
(0.018)
-0.025
(0.037)
0.023
(0.013)
ECSU 0.027
(0.029)
-0.036
(0.027)
-0.092
(0.057)
-0.015
(0.032)
-0.000
(0.034)
FSU -0.005
(0.022)
-0.013
(0.015)
0.007
(0.050)
-0.003
(0.023)
0.011
(0.015)
0.058*
(0.024)
-0.004
(0.023)
NCA&T 0.003
(0.028)
0.004
(0.021) -0.131
*
(0.064) -0.077
*
(0.031)
0.013
(0.041)
NCCU 0.024
(0.023)
0.024
(0.021)
0.086
(0.045)
0.043
(0.029)
-0.002
(0.031)
-0.038
(0.057)
-0.093**
(0.024)
NCSU 0.023
(0.025)
0.024
(0.017)
0.078
(0.041)
-0.001
(0.017)
-0.003
(0.007)
0.038
(0.031)
-0.030
(0.037) 0.038
**
(0.014)
-0.007
(0.028)
0.006
(0.011)
UNCA -0.043
(0.026)
-0.019
(0.019) 0.091
*
(0.040)
-0.048
(0.033)
-0.002
(0.014)
0.019
(0.058)
-0.066
(0.050)
-0.026
(0.030)
UNCCH 0.033
*
(0.014)
0.008
(0.012)
0.021
(0.026) 0.056
**
(0.019)
-0.009
(0.010)
-0.047
(0.042)
-0.094
(0.052)
0.004
(0.054) 0.129
**
(0.036)
UNCC -0.001
(0.009)
0.004
(0.008) 0.054
**
(0.018)
-0.002
(0.015)
0.011
(0.010)
0.013
(0.036)
-0.005
(0.038)
0.040
(0.021) 0.139
*
(0.053)
0.029
(0.016)
UNCG 0.028
**
(0.010)
0.014
(0.008) 0.038
*
(0.019)
0.004
(0.016)
-0.17
(0.009) 0.090
*
(0.039)
0.116
(0.062)
-0.035
(0.029)
-0.115
(0.063) -0.027
*
(0.012)
UNCP -0.038
(0.023)
0.001
(0.016)
-0.003
(0.033)
-0.007
(0.031)
0.005
(0.018)
-0.039
(0.050)
0.036
(0.042)
-0.053*
(0.023)
UNCW 0.041
**
(0.012) 0.022
*
(0.010) 0.053
*
(0.023) 0.046
**
(0.016)
0.000
(0.009) 0.081
*
(0.042)
-0.036
(0.057)
0.018
(0.023)
0.121
(0.066)
0.008
(0.017)
WCU 0.006
(0.018)
0.000
(0.014) 0.067
*
(0.030) 0.041
*
(0.017)
-0.025
(0.013)
0.002
(0.107)
0.008
(0.055)
0.037
(0.031)
-0.080
(0.056)
0.026
(0.029)
WSSU -0.051
(0.036)
0.000
(0.026)
0.002
(0.059)
0.008
(0.028)
Note: The reference group for these models is non-UNC system initially prepared teachers.
Note: * and ** indicate statistical significance at the 0.05 and 0.01 levels, respectively. Highlighted cells have fewer than ten teachers and therefore do not have any results
reported.

49
Table H: Evaluation Rating Results for UNC System Initially Prepared Teachers
University Standard 1:
Leadership
Standard 2:
Classroom
Environment
Standard 3:
Content Knowledge
Standard 4:
Facilitating Student
Learning
Standard 5:
Reflecting on
Practice
ASU 1.105* 1.032 1.102* 1.093* 1.098*
ECU 1.001 1.013 0.969 1.037 1.044
ECSU 0.985 0.845 0.768* 0.938 0.953
FSU 0.892 0.965 0.903 0.991 0.898
NCA&T 0.716** 0.841 0.911 0.785* 0.677**
NCCU 1.030 1.051 1.080 1.024 1.027
NCSU 1.716** 1.579** 1.937** 1.755** 1.791**
UNCA 1.709** 1.259* 1.821** 1.689** 1.636**
UNCCH 1.797** 1.881** 2.063** 1.915** 1.947**
UNCC 1.249** 1.136** 1.036 1.174** 1.150**
UNCG 0.989 0.982 0.987 1.004 0.952
UNCP 0.851* 0.907 0.873 0.872 0.770**
UNCW 1.175** 1.194** 1.194** 1.256** 1.168**
WCU 1.088 1.015 1.056 1.094 1.036
WSSU 0.812 0.802* 0.657** 0.740** 0.788* Note: This table displays odds ratios for receiving higher evaluation ratings relative to the comparison group of non-UNC system initially prepared teachers. Statistically
significant odds ratios above 1 indicate greater odds of receiving higher evaluation ratings; statistically significant odds ratios below 1 indicate lesser odds of receiving higher
evaluation ratings.
Note: * and** indicate statistical significance at the 0.05 and 0.01 levels, respectively. These results are graphed in Figures 11-15.

50
Table I: Evaluation Rating Results for UNC System Initially Prepared Undergraduate Teachers
University Standard 1:
Leadership
Standard 2:
Classroom
Environment
Standard 3:
Content Knowledge
Standard 4:
Facilitating Student
Learning
Standard 5:
Reflecting on
Practice
ASU 1.081 1.008 1.062 1.078 1.078
ECU 0.974 0.976 0.910* 1.014 1.001
ECSU 0.984 0.812 0.756* 0.906 0.948
FSU 0.878 0.942 0.887 0.971 0.871
NCA&T 0.788* 0.866 0.968 0.825 0.710
**
NCCU 0.982 0.967 1.076 0.931 1.024
NCSU 1.641**
1.456**
1.859**
1.651**
1.695**
UNCA 1.817**
1.281*
1.749**
1.740**
1.732**
UNCCH 1.748**
1.739**
1.761**
1.915**
1.914**
UNCC 1.211** 1.097 0.999 1.156
** 1.124
*
UNCG 0.946 0.933 0.932 0.974 0.917
UNCP 0.846* 0.880 0.844
* 0.842
* 0.740
**
UNCW 1.134*
1.142* 1.098 1.202
** 1.149
*
WCU 0.985 0.903 0.956 1.011 0.945
WSSU 0.818 0.781*
0.640**
0.728**
0.769*
Note: This table displays odds ratios for receiving higher evaluation ratings relative to the comparison group of non-UNC system initially prepared undergraduate teachers.
Statistically significant odds ratios above 1 indicate greater odds of receiving higher evaluation ratings; statistically significant odds ratios below 1 indicate lesser odds of
receiving higher evaluation ratings.
Note: * and** indicate statistical significance at the 0.05 and 0.01 levels, respectively.