un ited nations de opment programme worl healt …
TRANSCRIPT

OPMENT PROGRAMMEUN ITED NATIONS DE
WORL HEALT RGANI A· ION
GOVERNMENT OF SURINAM
.
PUBLIC WATER -SbPPLIES ANDSEWERAGE PROJECT
VOLUM E IV
WATER SUPPLIES AND SEWERAGE
REPORT PREPARED BY THE WORLD HEJLTH ·ORGANIZATION ACTI~G AS ~XECU T I N G · AGENCY
AND THE UNITED NATIONS ACTING AS PARTICIPATING AGENCY FOR
UNITED NAT!ONS DEVELOPMENT PROGRAMME
....

i
I
~.
, '\
.j
GOVERNMENT OF SURINAM .~
PUBLIC WATER SUPPLIES AND SEWERAGE
....
"
VOLUME IV
WATER SUPPLIES AND SEWERAGE
Report prepared by the World Health Organization
acting as Executing Agency and the United Nations acting as Participating Agency for
United Nations Development Programme
,. •

..•. ... .,.'.....1-'. .
'.~r"~..: .
'~/.;
IX;4. a". Yiiif" Hi F # ,
Chapter 1 - WATER SUPPLY - GE~ CONSIl:)ERATIONS
•
.'
Introduction and B~c~groun4 • 0
Objectives .' 0 .·.0 • 0 0 • 0
Present Conditions and Existing N~ed for Improvem.ents 0 0····
Water Supply Facilities •
1 2 3 6
Chapter 2 - BASES FOR DESIGN OF WATER SUfPl-l-ES
General 0 0 • • • 0 0
Domestic Require~~ts
Consumption Analysis Design Criteria • • 0 • 0 •
Construction Cons~4erations
• • •
10 10 12 14 19
Chapter 3 - WATER QUALITY ~QtJl-RE.MENTS
. . .
General • 0 • • • • • •
Quantity Requirements . 0 0 • • • •
Quality Standards 0 • 0
Bacteriological C~aracter;stics
Physical, Chem~cal, anq~s~h~ttc cpa.r~cteristics Virological Characte~istics. • Biological Char8ct.er~stic~ Radiological Characteristtcs
. , .':, '·i \
21 21 21 22 22 26 28 28
Chapter 4 - SOURCES OF SUPPLY
General • • • Rain Water 0 • • 0
Surface Water • Swamp Supplies Ground Water ••• Water Analysis
0
29 30 31 34 34 35
Chapter 5 - WATER TREATMENT
.. Need for Treatment • 0 • 0 •
Treatment of Ground Water • 0
Treatment of Surf~ce Water Slow Sand Filters F1uoridat ion • 0 • • • • •
. . 41 42 44 45 47
..

,.w.
Chapter 6 - INTERIM WATER SUPPLIES
Status of Existing Water Supplies • Present Status of Group 1 Systems . Present Status of Group 11 Systems •••• Present Status of Group 111 Systems • • Standard Design for Slow Sand Filtration ••••
Chapter 7 - RECCMMENDED WATER SUPPLIES PROGRAM
Master Plan 1972-2000 • • • • • • • Priority Listing of Water Supplies Description of Facilities • ~ased Development ••••• Capital Finane ing . • • • •
Chapter 8 - SEWERAGE - GENERAL CONSIDERATIONS
Introduction • • • • • • • . • • . • Existing Facilit ies . • . • • • • • • Present Methods of Domestic Waste Disposal Present Methods of Industrial Waste Disposal Combined and Separate Systems • • • • • • •
Chapter 9 ~ BASES FOR DESIGN OF SEWAGE DISPOSAL SYSTEMS ~
Introduct ion • • • • • • • • • • • • Factors Influencing Waste Discharge Criteria . . . . . Waste Disposal Considerations for Metropolitan
Paramaribo • • • • • • • ••• • Waste Water Reclamation ••• General Sewerage Designs Design of Collection Systems Waste Stabilization Ponds . Septic Tank Design ••••• Sanitary Privies •••••• • • • Design Periods for Sewerage Systems ••
Chapter 10 - PROPOSED SEWERAGE SYSTEMS
~atta-Leidin8en System . Nieuw Nickerie System • • • • Albina System •••
ANNEX 1 - SEWER USE ORDINANCE
ANNEX II - DESIGN BASIS - SURFACE WATER TREA'lMENl' PLANT
ANNEX III - DESIGN BASIS - GROUND WATER TREATMENT PLANT
50 51 52 52 53
55 55 56 68 70
71 7k 74 75 76
77 78
79 82 82 89 91 94 95 99
100 102 105
•
..

TABLES
l. Existing Public Water Supply Systems in Surinam • 7· · · · 2. General Health Statistics . . . . . . . . . 9 ...
3. Mortality Statistics . . . . . . . . 9· · · · 4. Consumption Data 13· · · · 5. Average Daily Domestic Water Demands by Population 15
6. Water Demand for Specific Purposes (Peak Flows) • • • 16
7. Substances and Characteristics Affecting Acceptability of Water for Domestic Uses • • • • • • • • • • • • • • • • 23
8. Tentative Limits for Toxic Substances in Drinking Water • • 27
9. Recamnended Control Limits for Fluorides in Drinking Water 27
10. Filtered Surface Water 36
11. Raw Water at Uitkijk 48
. I

f"" ~" ~~
'"
•
i ..!' ,
I
I
(
I
LIST OF FIGURES
1. Rainfall Patterns (Annual Rainfall)
2. Map of Discharge Measurement Stations
3. Topographical Map and Profile of Lower Suriname River
4. Slow Sand Test Filters
5. Graph Sand Sieve Analyses
6. Graph Sand Sieve Analyses
7. Slow Sand Test Filter
8. Standard Design Slow Sand Filter
9. Standard Design Slow Sand Filter
'10. Standard Design Slow Sand Filter
11- Graph Cost of Treatment Plants
12. Graph Cost of Booster Stations
13. Cost Comparison, Well vs. Surface Water
14. Combined Sewerage - Paramaribo
15. Santo Boma Prison - Sewage Lagoon System
16. Septic Tank Capacities
·, •
f
"" l' * n . n • •
I

•
...
LIST OF PLANS
1. Kwatta-J~eidingen Treatment plant
2. Pad van Wanica Treatment Plant and Well
3. Commewijne Area East of Orleana Kreek
4. Rijsdijkweg System to 1887
5. Rijsdijkweg System to 2000
6. River Crossing at Leonsberg
7. Rijsdijkweg Water Treatment Plant
8. Rijsdijkweg Water Treatment Plant Supply 1987
9. Rijsdijkweg Water Treatment Plant Supply 2000
10. Santigron Water Treatment Plant Supply 1987
11. Santigron Water Treatment Plant Supply 2000
12. Santigron Water Treatment Plant
13. Santigron Water Treatment Plant
14. Santigron Water Treatment Plant
15. Groot en Klein Henar Polder Systems
16. Paradise System
17. Corantijn and van Driumelen Polder Systems
18. Calcutta and Tijgerkreek Systems
19. Sewer Gravity System Lift Station and Sewage Lagoon, Kwatta-Leidingen
20. Cluster Type Septic Tank and Filter Bed System, Kwatta-Leidingen
21. Nieuw Nickerie Sewer System Situation
22. Nieuw Nickerie Sewer System Manhole and Details
23. Nieuw Nickerie Sewer System Pump Station
\ \~

PREFACE
Operations started on the project "Public Water Supplies and Sewerage (NET...4)" with the arrival of the Project Manager in September 1969. The Plan of Operations was signed by the Government of Surinam, the World Health Organizatibn, and the United Nations Development Programme on 30 October 1970. The cooperating government agency was the Ministry of Rural Government and Decentralization. The World Health Organization was named Executing Agency and was assisted by the United Nations in the capacity of Participating Agency, by virtue of a Standard Letter of Agreement which was signed by theag~ncies in July 1970.
It is noted that no provision was made to contract for the consulting engineering services in the preparation of the engineering studies, reports, and designs. In this departure from the usual World Health Organization practice in UNDP(SF) preinvestlnent projects, the responsibility for the above tasks rested with the international professional staff assigned to the field activity of the project.
This final report represents a statement which descriptively, qualitatively, and comprehensively summarizes the findings and recommendations of the project team, incorporating the public water supplies, sewerage, and water resources investigation aspects of the project. It comprises the following four volumes:
Volume I - Summary Report Volume II - Basic Data and Special Studies Volume III -Water Resources (Hydrogeological and Hydrological
Studies) Volume IV ... Water Supplies and Sewerage
The subject volume, Volume IV, covers water supplies and sewerage and includes general considerations, design bases for water supplies, water quality requirements, sources of supply, water treatment, interim water supplies, and the recommended water supply program.
Conferences and discussions were held with and direct assistance obtained from:
Ministry of General Affairs Ministry of Health Ministry of Public Works
• Ministry of Agriculture Mini.s:try of Finance Minis.try of Development Ministry of Rural Government and Decentralization

ii
In March 1970, a mid-project review mission visited the project. The mission included the following:
Ross Milley Assistant Regional Representative, UNDP, Trinidad and Tobago
G. D. Soerdjoesingh Project Coordinator, Ministry of Rural Government and Decentralization
A. Jap Tjoen San Surinam UNTAB Liaison Officer
Paul Bierstein Chief, Preinvestment Planning, WHO, Geneva
Harry G. Hanson Regional Advisor, Engineering and Environmental Sciences, PABO/WHO, Washington
Whitman C. Dimock Technical Advisor, Resources and Transport, Division of Economic and Social Affairs, United Nations, New York
John T. Robinson, Zone Engineer, PABO/WHO, Zone I Office, Chairman Caracas
The field operations were conducted by a team of United Nations specialized agency staff and Surinam Government staff. The team was structured as follows:
Permanent Field Staff Surinam Government
International Staff Counterpart Staff
World Health Organization: G. D. Soerdjoesingh, Project Coordinator
S. G. Serdahely, Project Manager J. G. Copley, Project Manager Engineers J. L. Vincenz, Project Manager C. L. Philipovsky, Sanitary R. Dihal
Engineer (Waste Water) R. Randjietsingh R. J. Pitters, Sanitary Engineer E. T. Tsai Meu Chong
(Water Supply) R. Nanden Mrs. Christina Kambel, Secretary S. Autar
United Nations: Surveyor
V. R. Dixon, Hydrogeologist R. Biharie C. K. Stapleton, Drilling
Superintendent
tt

, iii
Short-term Consultants Non-professionals
C. Clinton Davis, Management A. Ghafoerkhan D. Duha, Hydrology J. Orie C. N. Stutz, Industrial Waste J. Ragoebar L. Huisman, Biological Filtration H. C. Faerber .. Jean L. Vincenz, Management H. Rambalie Donald E. Crum, Water Waste S. Ramdat
H. A. Khodabaks Visiting Specialists
Drilling Supervisors M. Suleiman, PIP, WHO, Geneva W'e C.. Dimock, UN, OTC A. Staphorst E'e El.more~ ES, PAllO, Washington P. Viereck o. Cordero, Fluoridation, PAllO, W. Bouman
Washington S. Ramdas D. J. Wi~~iams, Fluoridation, Canada M. Petricie
J. Doomkamp E. Wilson
All of the agencies listed below, their representatives, and individuals readily contributed to the implementation of this project in an atmosphere of mutual assistance for the benefit of Surinam:
Army of the Kingdom of the Netherlands Center of Agricultural Research in Surinam Surinam Water Company Surinam Aluminum Company Billiton Company of Surinam Marienhurg Sugar Enterprise Bruynzeel Surinam Wood Company Representatives of the Dutch Five-Year Plan Representatives of several United Nations specialized agencies
It is with sincere appreciation that their efforts, as well as those of many others who also brought their ideas, comments, experience, and wisdom in generous and unsparing measure, are gratefully acknowledged.
During the long dry season of 1971, conditions developed in which the water supply system of the city of Paramaribo was unable to meet the demands, and this resulted in loss of production as well as the retrogression of service from continuous to intermittent. Aware of the possibly serious consequences of these developments, the Government requested the
• assistance of the incumbent staff of the UNDP(SF) project in effecting the necessary improvements to the water supply as well as to provide the investigation and p~nning required to meet present and future needs for the city system. As a result, the UNDP(SF) project was extended from the original three-year span to cover a 42-month period. The report incorporating

jiv
the Paramaribo study is a separate and supplementary volume. A second sixmonth extension was requested by the Government for surface drainage studies. The report for these studies is also a separate and supplementary volume.
The metric system of weights and measures is used in Surinam for engineering purposes generally. However, standard practice in the design of water supply systems in the country has been to express pipe sizes in inches and to express pump capacities in U.S. gallons per minute. Accordingly, these units have been used in designs.
In estimating costs the currency used is the Surinam guilder (Sf.). The rate of exchange current when estimates were prepared during project operations was Sf.l.87 to US$l.OO.
All elevations indicated in this report are referenced to the offi cial NSP (Normal Surinam Level) datum. Established in 1958, NSP is based on the average sea level, measured at an automatic sight gage structure on the Suriname River at Purmerend Plantation, located near Paramaribo at Leonsberg. Elevations referred to an earlier datum, SP, are converted by Surinam authorities through the application of a negative 8.00 meter factor.
Acronyms used in this report are included in the glossary at the end of Volume I.
1 1
•

-
CHAPTER 1
WATER SUPPLY - GENERAL CONSIDERATIONS
INTRODUCTION AND BACKGROUND
For several years during the 1950's, the U.S. Agency for International Development through the Surinam-American Technical Cooperation Service (SABTS) conducted a demonstration project for developing rural water supplies through the installation of low-yield, sanitary wells, equipped with hand-operated pumps. This project created considerable interest in water supply development and led to the SABTS program of supplying technical assistance, consultation services, and training measures. The general objective was to encourage the Government of Surinam in assuming the responsibility for water supply development and administration, with technical assistance being provided by USAID and SABTS.
In 1962 the Director of Public Works indicated his interest in establishing a water supply section within his Ministry which would be responsible for promoting or developing water supply improvements throughout the country and requested SABTS assistance in drafting a plan which could be submitted by the Minister of Public Works to the Cabinet of Ministers for consideration and approval. Subsequently, a plan was submitted to the Director of Public Works that provided for establishing within the Ministry a water supply section which eventually might be converted into an autonomous water supply authority. The plan called for the Water Supply Section to receive the benefits of 1) a high-level advisory committee, 2) a health educator whose services would be made available by the Director General of Public Health, 3) experienced personnel and water supply equipment from SABTS, and 4) professional advisory services and assistance in personnel training from USAID.
However, the SABTS assistance as well as that of USAID was phased out during the mid-1960's, and the Government elected to pursue the UNDP(SF) project route for technical assistance in meeting the problems of water supplies as well as sewerage systems in Surinam. Initial efforts to obtain this assistance were commenced in 1964, with the cooperation of the PARO/WHO Zone Office. These efforts eventually led to the fielding of the Preparatory Assistance Mission Team, as previously discussed in the "History of the Project."
The main findings and recODDDendations of the Preparatory Assistance Mission are quoted as follows:
"Currently, the most economical source of potable water supply is ground water. Present evidence indicates that such water of acceptable quality should be available in sufficient quantity to meet the future needs. Some problems of salt water intrusion are, however, already being

r
- 2
, . experienced in certain wells (in the Zorg en Hoop well field in Paramaribo), and other wells may cum saline as the rate of extraction is increased to meet the rapidly growing demands for water. The rates of replenishment of the aquifers have yet to be investigated in detail.
"The withdrawal of additional potable ground water should not adversely affect irrigation, hydropower and navigation development based on surface water, but future impounding of surface water in the basin for hydropower or irrigation storage might, if not coordinated, drastically affect the rate and salinity of recharge to ground water storage. Unified water management is therefore required.
"If, eventually, the ground water supply becomes inadequate, it can be supplemented by surface supplies; but the costs of treatment and transmission of surface supplies would be much higher than those now being incurred for ground water supplies.
"It is inadvisable to cOO1l11it further investment to ground water withdrawal until the characteristics of the aquifers in the lower Suriname River basin have been investigated. This investigation is a prerequisite to the planning of new water supply installations in Group I area. The findings should be helpful in defining the extent of the subsequent investigations required for the provincial coastal areas.
"The progress on the Government's water supply and sewerage development programme is dependent on the progress of these hydrogeological investigations, and only the minimum of specialist expertise is needed to enable investigations to start. Therefore, it is recODlDended that the preparatory work should start not later than 1 July 1969. Additionally, it is hoped that the outcome of the IACB meeting in October 1969 will result in iDIDediate a\lthorization to incur expenditure of Special Fund monies for the remaining equipment required by the lToject, so that the Project can be accelerated to a fully operational basis as soon as possible. The Government of Surinam has allocated US$92,000 from the 1969 budget and has also made all arrangements for the use of equipment and office space."
These findings were endorsed in general principle with minor exceptions by the UNDP(SF) project team, with regard to the scope of activities as well as the geographical areas included. As is the case in studies of this nature, additional investigations became necessary, and these were implemented in addition to the original tasks in order to provide as canprehensive a picture as possible.
OBJECTIVES
The objectives, therefore, of the immediately following sections of this report are to develop engineering proposals leading to the eventual provision of consistently available quantities of potable water to meet all
• s. 4.••
,.

··········r,: ,>,.
- 3
reasonable danestic requirements as well as the concurrent commercial and industrial ne.eds , while providing a degree of fire protection. Volume III Water Resources, delineates the hydrogeological investigation program as well as the ~lydrological studies and findings.
In order to develop the above proposals it was necessary to determine suitable design allowances (on a per capita or area basis) to meet the present and future needs of the Supply Group areas. Following the establishment of destgn criteria, total water quantities and quality requirements were determined to the degree possible and, whenever possible, definite suitable services selected.
Existing water supply and distribution facilities were studied in depth with a view to determining the capabilities for meeting design cri teria and also with respect to eventual standardization of methods.
Finally, the engineering proposals were developed and are presented according to a schedule of priorities which is designed primarily to provide relief in areas of most immediate need, and also to permit prudent phasing of construction.
PRESENT CONDITIONS AND EXISTING WATER SUPPLY FACILITIES
Within the organizational framework of Surinam's central government, the Ministry of Public Works originally had the responsibility for developing sources of potable water and for distributing it for use by the people of Surinam. To accomplish this task, the Ministry depended on appropriations of funds from the national budget, except for those established systems which were operated under contract wherein revenue realized from the sale of water was sufficient to offset the cost of making piped water service available to the consumers.
In spite of the magnitude and importance of its responsibilities in this field, the Ministry did not thoroughly develop within its own organization the technical facilities and trained personnel required to plan, install, operate, and manage water supply systems. In early years projects undertaken directly by Public Works personnel with respect to water supply and distribution were essentially limited to:
1. Constructing rain water catchments and collection reservoirs.
2 • Installation in rural areas of hand-dug wells of the type developed.. by SABTS.
3. Transporting water from available sources to people living in areas where stored quantities of fresh (rain) water were not sufficient to supply the demands of consumers during extended periods of dry weather. This transporting of water during dry seasons, by truck,

- 4
barge, or other available means, became a routine function of government and is still provided for in the budget of the Ministry of Rural Government and Decentralization.
It is acknowledged that this latter method of water distribution is costly; and the methods of handling expose the water to contamination, and thus to the likelihood of disease transmission. At best, it constitutes an emergency measure undertaken for the express purpose of alleviating chronic problems.
Traditionally the Ministry of Public Works is the governmental department for designing and building a wide range of public facilities such as buildings, roads, canals, sluice gates and lock installations, air ports, and hydroelectric plants, but water supply systems and water treatment facilities were not included routinely among the projects justifying direct attention, except those small rainwater systems which in most cases are integral parts of building projects where the roof surfaces are uti lized as catchment areas.
As the population of Paramaribo increased through the years, the need for a suitable community water supply system became more urgent. Non-government interests responded to the growing water demands by creating a water company, which was legally incorporated under the laws of the country. Legislative action in 1929 placed the corporate holdings in the hands of several stockholders which included banks, a trading company, and the Govermnent of the Netherlands. While records indicate that the enterprise was originally initiated many years prior to that date, it is generally recognized that the operations of the Water Company on a substantial scale got under way in 1930 on the basis of the 1929 legislation. In 1948, the Government acquired all shares of corporate stock and became sole owner of the Surinam Water Company.
Following its inclusion as a new Ministry in the Government, the Ministry of Rural Government and Decentralization, established in November 1969 to succeed the Ministry of Public Works in this responsibility, is now the government representative and hence the sole stockholder of the Surinam Water Company. This provides the Ministers with an .implied "veto" authority over actions taken by the Board. However, there is no indication that such authority has ever been exercised. In reality, the relations between the Government, represented by the Minister, and business interests, represented by the members of the Board, are well balanced, and this permits the Company, although totally owned by the Government, to function strictly as an autonomous business enterprise.
The Company plans, designs, constructs, operates, and manages urban water supply facilities. Projects for which the Company has assumed responsibility have been limited to areas with concentrations of population which the Company considers as justifying the installation of community water supply systems, involving pressure systems, treatment works (if indicated), storage facilities, and a piped distribution network.
,.

..
- 5
Since it came into existence, the Surinam Water Company has had total responsibility for all water supply' operations in Paramaribo (supply, distribution, and management). It has also undertaken water supply projects in other centers pursuant to contracts with the Ministry of Public Works.
In 1962 the plan referred to earlier was proposed by the Ministry of Public Works, SABTS, and USAID in which district water supplies would receive greater attention.
The plan provided for the Ministry of Public Works, through a proposed Water Supply Section, to be responsible for:
1. Development, operation, and maintenance of water supplies in rural areas. This would involve continuation of the program of water exploration and sanitary well construction previously carried out by SABTS as a demonstration project.
2. Promotion of improvements in piped water systems and the development of other "urban" systems to serve centers of population in the districts, on the basis of contracts between the Ministry and the Surinam Water Company. Similar contracts would authorize the Water Company to operate and maintain such water systems on a soundly established financial structure whereby revenue for water sold would be used exclusively for operating and improving water works instal lations. The plan foresaw that the Ministry of Public Works would be required to arrange for grants of funds to be used in financing water supply installations made by the Water Company on the basis of contracts with the Ministry. These grants might be available from the "lO-Year Plan," the regular government budget, or from other possible sources, including loans.
In other words, the plan proposed that the Water Supply Section would be the authority within the Government responsible for negotiating contracts with the Surinam Water Company for undertaking development, operation, and management of community (urban) piped water supply systems, and that the rural water development (sanitary well) program would be carried out under the direct administration of the Water Supply Section. In some cases, the Water Supply Section through the Surinam Water Company could arrange to supply water to consumers on the basis of special agreements with others. The two principal bauxite mining companies operate water supply systems which serve their communities at Moengo, Paranam, and Onverdacht.
Small water supply systems are also being operated by the Ministry of Health and the Ministry of Agriculture.
Following formation of the Water Supply Section (now a part of the Ministry of Rural Government and Decentralization), the Surinam Water

- 6
Company has progressively turned over the smaller systems to that Section for maintenance and operation. At present, the Water Company retains the Paramaribo, Nieuw Nickerie, and Albina urban systems.
NEED Fm lMPROVEMENTS
Table IV-l lists the existing non-private water supply systems in Surinam, together with the population served by the supplies. Each system is either being expanded or is under consideration for augmentation.
In most cases, water is supplied on a continuous 24-hour per day basis, but in some of the systems intermittent supply is necessary. The ever-present danger of contaminati~ inherent in intermittent supplies is well known, and the World Health Organization maintains as a basic precept in design the requirement for a continuous supply of potable water.
The present inadequacies in water supplies are considered an tmportant factor in contributing to environmental health problems, particularly in those areas where there tends to be a prevalence of gastrointestinal disease. More than 60% of the population lack safe piped water supplies and have to rely on untreated water. The use of questionable surface sources of water which may be polluted with pathogenic organisms should be reduced through the provision of safe, adequate, and readily available community supplies.
It is difficult to obtain reliable health statistics, and those that can be obtained are not always current. Table IV-2 provides a res~ of general health statistics, which have been collected from several sources. Mortality statistics are shown in Table IV-3.
Economic benefits will also derive through increased productivity following the elevating of standards of health by means of tmproved water supplies, thereby reducing absenteeism in industries, agriculture, and schools.
* c ..

. e. 0.. - . •
- 7
TABLE IV-l
EXISTING PUBLIC WATER SUPPLY SYSTEMS IN SURINAM
Supply Population Source Treatment Storage Distribution
Served
Paramaribo (SWC) 175,000
20 shallow wells and 10 deep wells at Republiek
A,R,S 34,400 m : 4,000 m3:
700 m3: 18,000 m3:
Republiek Zorg en Hoop elevated Blauwgrond
Approx. 400 Ian, mostly asbestos cement, same steel, and 2- to l2-in.
17 deep wells at Zorg en Hoop 1,000 m3: .
and Leysweg Lelydorp
PVC. Also 40 Ian l4-in. transmission from Republiek
4 deep wells at Leysweg (3 operating, 1 standby)
3Koewarasan 2 deep wells A,R 60 m : ground level Approx. 18 km 2-, (D and D) 10 m3: elevated 3-, and 4-in. PVC. 2,000
3Meerzorg 2 deep wells A,R,M 37 m : ground level Approx. 11 Ian of (D and D) 9 sec~dary 2-in. PVC. 6,000 of 8 m each
with hand pump
3Wonoredjo Bulk purchase from Total sur 300 m : ground level Approx. 14 Ian of (D and D) Suralco face water 12 m3: elevated 2-in. PVC. 2,000 treatment
3Albina 2 shallow wells A,R 100 m : ground level .Apprax. 4 Ian of (SWC) 10 m3: elevated 4-in. and 2-in 2,000 PVC.
3Nw. Nickerie 2 deep wells A,R,S 300 m : ground level Approx. 16 Ian of (SWC) 40 m3: elevated 6-in. AC pipe and 10,000 2-in. PVC pipe
3Coronie 1 deep well A,R 70 m : ground level Approx. 20 Ian of (D and D) 8 m3: elevated 4-in. AC and PVC 3,000 and 2-in. PVC.
A =Aeration SWC = Surinam Water CompanyR = Rapid sand filtration D and D = Ministry of Rural Govermnent S = Shell filtration (pH adjustment) and Decentralization M = Manganese filtration ACP =Asbestos-cement pipeC = Chlorination PVC = Polyvinylchloride pipe

l
- 8
TABLE IV-l (cont.)
EXISTING PUBLIC WATER SUPPLY SYSTEMS IN SURINAM
Supply Population Source Treatment Storage Distribution
Served
Groningen 2 deep wells A,R 100 m3: ground level Tambaredjo 10 m3: elevated
I (D and D) 2,200
Approx. 12 Ian of 4-in. and 2-in. PVC.
3Brownsweg Surface (lake) c Four tanks of 180 m 5 km of 2-in. gal• (D and D) combined capacity vanized iron p~pes
: 3,000
Klaaskreek 1 deep well C Reservoir on a hill, 2.5 Ian of 2-in. (D and D) capacity 30 m3 PVC. 1,500
3Brokopondo 1 deep ~ell A,R Two 3 m pressure tanks 3,CD and D) and clear well of 70 m
1,000 capacity
lCampong Baroe 1 deep well A,R 20 m3: ground level (D and D) 10 m3: elevated 2,000
Alliance (Ministry of Agriculture) 450
31 deep well A,S,R Two 1.5 m
Groot Chatlllon (Ministry of
Surface (river) R,C 36 m3 (filled twice a day)
Health) 150
2 Ian of 2-in. and 4-in. PVC
Approx. 11 Ian of 4-in., 3-in., and 2-in. PVC.
1.6 Ian of 4-in., 2-in., and I-in. ACP and PVC.
Approx. 2 Ian of 4-in. and 2-in. asbestos cement
~ L

- 9
TABLE IV-2
GENERAL HEALTH STATISTICS
Population (estimated mid-year 1971) 408,100
Birth rate per 1,000 (1968) 32.8
Death rate per 1,000 (1968) 6.8
Natural growth rate, per cent (1968) 2.6
Infant mortality rate, per 1,000 live births (1968) 39.6
Government expenditure per capita for health sector (1970) US$ 22.55
Per cent of total budget for health (1971) 10.0
TABLE IV-3
MORTALITY STATISTICS (1968)
Disease Rate per 100,000 Deaths
Typhoid, paratyphoid, and other sahoonella infections 353
Bacillary dysentery and amebiasis 471
Enteritis and other diarrheal diseases 294
Bilharziasis (1967) 1,266
or • • ..
- 10
CHAPTER 2
BASES FOR DESIGN OF WATER SUPPLIES
GENERAL
Population studies conducted in the project area emphasize the predominantly residential character of the population zones 0 Because of this, the domestic water demands served as the primary basis for estimating individual water supply requirements. Since there is no substantial requirement for government and commercial establishments and industries, the allowance for these is calculated as a percentage of domestic allowances.
DGmSTIC REQUIREMENTS
It is noted that the Paramaribo metropolitan water supply system continues to be operated and maintained by the Surinam Water Company and is regarded as a separate entity as this report is drafted. As such it is not included in this report, except to provide data which contributes to the whole picture of public water supply in Surinam. The report covering the Paramaribo study is a separate document.
Average per capita requirements of water for small urban or rural communities are usually derived from studies of records of existing supplies and also the population served. The increase in per capita consumption is then projected in order to determine future design allowances.
In Surinam the usage quantities vary widely for the small systems which have been established for several years. For example, the average per capita usage for the Klaaskreek system is 10 l/c/d, while the average peak for Nieuw Nickerie is 204 ltc/d. Conditions other than normal usage tend to cause these extreme values to develop.
In view of the above and also because water consumption data in Surinam tend to be limited in scope and availability, the average per capita usage was estimated on the basis of judgement, conditioning the judgement in accordance with experience gained in other developing countries.
Consumers were divided into three categories as follows:
Category I OCcupants of dwellings supplied with a single Fordilla valve, but without metered service. (These valves are self-closing and will deliver only a certain given quantity of water for each opening of the valve.)
Category II OCcupants of dwellings supplied by a single tap in the dwelling and with metered service. .,
•

- 11
Category III: Occupants of dwellings which contain a variety of plumbing fixtures and have metered service.
It is noted that no special consideration is given to public standpipe usage. While this type of service exists to a minor degree in the country, the Govermnent is seeking to discontinue this approach, providing instead the Fordi11a valve service as the minimum acceptable. The Executing Agency concurs in this procedure, deeming it desirable to provide individual service wherever possible.
Category I - Consumers
This group of consumers is couanon to all small urban and rural supply syste~ in Surinam. A study of the ratio of consumer types showed that approximately 35% of the house services fit in this category.
Estimates for domestic per capita usages for the several years covered by this project are as follows:
Commissioning year - 1972 30 l/c/d lS-year design year - 1987 40 l/c/d Ultimate plan year - 2000 50 l/c/d
Category II - Consumers
Similar to the Category I group, these consumers constitute approximately 35% of the total number of house services in the existing water supply systems.
Estimates for domestic per capita usage are given as follows:
Commissioning year - 1972 50 l/c/d IS-year design year - 1987 70 l/c/d Ultimate plan year - 2000 90 l/c/d
Category III - Consumers
This group of'cons~~s Occupy dwellings which constitute approximately 30% of the total ~umber of house services in the water supply syacems ,
Estimates for domestic per cap~a consumption are as follows:
Commissioning year - 1972 70 l/c/d l5-year design year - 1987 90 l/c/d Ultimate plan year - 2000 110 l/c/d

1!
- 12
CONSUMPrION ANALYSIS
Obviously, not all the systems to be built in Surinam will be commissioned during g72. This datum was established for the initial feasibility studies and served as a standard upon which comparisons for requirements of future system designs could be considered.
In addition to the estimates of the per capita usages for the above planning year categories, further consideration was given with respect to the probable changes within the categories which would obtain subsequent to the experience gained by users. In other words, it was anticipated that the progression from Fordilla valve service to single-tap service to "plumbed-house" service would take place. It was also assumed that, in the average water supply system, the munber of connections would increase, because this pattern is typical for piped water supplies. With regard to the types of service, it was assumed that during the first IS-year period the total of "plumbed" houses would increase from 35 to 40%-a trend which is similar to that in Paramaribo. Thus, the remaining 60% would be fairly evenly divided among the Category I and Category II types of single-tap service. This situation would then be assumed to hold relatively constant until the ultimate plan year.
Further, it was estimated that the percentage of dwellings connected during the first year of operation of the water supply systems would be approximately 25%. This percentage would then be assumed to increase over the first IS-year period until 90% of the dwellings would be connected. Because this represents a practical maximum level, the percentage of houses connected was assumed to remain at 90% throughout the balance of the master planning period.
Per capita consumption including all uses and losses projected through the design cycles are shown in Table rv-4.
As shown in Table IV-4, the values for industrial, commercial, and institutional uses were estimated on the basis of probable growth in these sectors rather than on planned growth. Since no official development plan has been accepted by the Govermnent as yet, the "industrial estate" concept cannot be applied; nor is there strict enforcement of zoning ordinances. Thus, the above values represent estimates only.
Water which is produced and sent into the distribution system but has not been sold, measured, or otherwise tallied is defined as unaccountedfor water and in this study was estimated at 20% of production, based on experience gained in similar countries. This figure is corroborated by Babbitt, Doland, and C1easby, "Water Supply Engineering," McGraw-Hill Book Co., 1967. In the Paramaribo water supply system the amount of unaccountedfor water is estimated at greater than 30%. It is anticipated that this percentage figure can be reduced through the utilization of waste surveys, leak detection, and tighter construction inspection.
..

•

- 14
Table IV-S shows the estimated demands for the Supply Group I and II communities include~ in the UNDP(SF) project study area based on population estimates for the years 1987 and 2000, respectively.
It is noted in connection with this table that the population totals for some of the above conmunities are subject to change in the final design phase. This is because several of the cOIIllIl1nities overlap or, conversely, the interlying populated areas are included in other water supply systems.
DESIGN CRITERIA.
Population Growth
As previously mentioned, the average growth in population was assumed at approximately 4% per year since actual trends or concentrations cannot be accurately -iirophes1ed:- Al1water supply- projects incltided- in the master plan of this UNDP(SF) Project are based on this population increase with an interim design population reached after 15 years. Local industrial expansion is included as a percentage of the interim design figure.
Rate of Water Usage
The apportionment of the domestic demands in individual project areas was taken as proportional to the population served by each main, incorporating actual existing house counts whenever practicable. Population totals in such cases were calculated on the basis of six persons in each house.
The following rates of flow and variations thereof were used in designs :
Average daily usage = 100 liters per capita per day Maxinum daily flow average daily flow = 1. 40: 1 Maxinum hourly flow : average hourly flow = 2.50: 1
The average daily flow of 100 l/c/d was used for design of the production elements of the water supply systems. The peak factot of 2.50:1 was used in the design of distribution system elements.
An investigation was conducted into the water requirements for specific users. The results of this study are listed in Table IV-6.
Distribution system
All systems were designed utilizing the Hazen and Williams formula:

- 15
TABLE IV-5
AVERAGE DAILY DOMESTIC WATER DEMANDS BY POPULATION
Estimated Population
1987 2002
Supply Group I
A. SWC areas of supplY: +) Kwatta Le:ldingen 23,800 Koewarasan 6,000 10,300 Uitkijk and Jarikaba 10,300 17,800 Houttuin 7,100 12,200 Domburg 12,500 21,500 Meerzorg and Peperpot 15,000 26,000 Jagt1ust, Lust and Rust, and Be1waarde 1,100 1,900 Nieuw A1nsterdam and Voorburg 6,430 11,100 Marienburg 18,550 32,000 A1kmaar 4,640 8,000 Spieringshoek-Katwijk and Wederzorg 4,930 8,500 Tamanredjo 5,160 8,850 Le1ienda1 1,600 2,000
B. Surinmn River Industrial Area: Paranmn 3,800 6,550 Bi11iton 1,520 2,650 Sma1ka1den-La Vigi1antia 2,160 3,750
Supply Group II
A. Saramacca Distr.: Groningen and Tambaredjo 4,400 7,600 Calcutta and Tijgerkreek 7,050 12,200 Hl1desheim 2,160 3,750 Kampong Baroe 4,330 7,500
B. Coronie Distr.: Totness 4,860 8,400
c. N1ckerie Distr.: SWC area of supply 18,000 31,800 Wageningen 5,200 9,000
• Groot en Klein Henar 6,300 10,900 Paradise 15,190 26,300 Corantijn and Van Dr1DlDe1en Polder 15,190 26,300
• D. Brokopondo Distr.:
Brokopondo 1,620 2,800 K1aaskreek 3,000 5,150 Brownsweg 3,800 6,550 Lombt! and Mooie Kreek 2,000 3,450
E. Commewijne Distr./ Marowijne Distr.: Alliance 755 1,350 Constantia, Ki11enstetn and l'Esperance 1,730 3,000 Moengo and Wonoredjo 10,800 18,800 swe Area (Albina) 4,860 8,400
+) See Paramaribo study report.
Estimated Daily Water Consumption
1987 2002
(m3)
2,380 5,580 600 1,400
1,030 2,400 710 1,640
1,250 2,900 1,500 3,500
110 260 640 1,500
1,860 4,300 460 1,080 490 1,140 520 1,200 120 270
380 690 150 360 220 380
440 1,020 700 1,650 220 520 430 1,020
490 1,140
1,800 4,300 520 1,220 630 1,470
1,520 3,550 1,520 3,550
160 380 300 700
11 380 880 200 470
70 140 170 400
1,080 2,550 490 1,140

TABLE IV-6
WATER DEMANDS FOR SPECIFIC PURPOSES (PEAK FLOWS)
Type of Consumer
Cinemas
Restaurants
Local shops
Schools
Service stations
Swinming pools
Government offices
Recreation buildings
Medical buildings
Churches
Equipment repair shops
Average Capac ity0Max. Condition)
1,000 persons
35 tables x 4 persons
100 persons/hr.
Varies
Varies
900 m3 volume
40 employees
200 persons
50 visitors - 5 staff
Varies
Varies
Peak Daily Usage (m3)
3.0
6.5
1.0
6.0
21.0
900.0
90.0
2.0
10.0
1.5
0.5/hectare
7.0
Peak Hourly Usage (m3)
0.5
0.65
0.2
0.8
1.3
37.5
3.75
0.3
1.6
0.2
0.9
Remarks
Three performances, 2 hours each
Max. trade between noon Saturday and 1 :00 avm, Sunday
Max. trade 4 hours daily; includes cleaning water
Flows based on investigations at 12 grade schols and four preschools
Sixteen business hours per day; includes car washing ......
0\
For monthly draining and cleaning 24-hour period
Average for 4-week period
Includes cleaning and gardening
Max. usage during 6-hour period on Saturday
Eight-hour day
Calculate on surface area basis
Eight-hour day
.. ,. .. •

- 17
Q = 0.0103 C H 0.54 D 2.63 Q = ra~e of flow, cfs. C = friction coefficient H = h~ad loss per 1,000 ft. of straight pipe D = diameter of pipe, ft. For cast iron pipe, C = 120 For plastic pipe, C = 130 For A.C. pipe, C = 130
In Surinam, the use of plastic (po1yviny1ch10ride) pipe with cemented joints and certified according to ASTM (USA) or KIWA (Netherlands) standards for water supply systems is customary for diameters through six inches. Above six inches asbestos-cement pipe of ISO (International) standard is used. For design purposes in this study, plastic and asbestoscement pipes were specified for distribution systems except in those cases where conditions of installation warranted the need for cast-iron pipe.
Pressures in Distribution Systems
In order to analyze pressures at the junction points of the distri bution systems, the Hardy Cross method of successive approxtmation was utilized. As an audit and also for demonstration purposes, computer analyses were employed on representative systems. This node balancing type of analysis was based on a modified Hardy Cross method. A detailed discussion is included in a later section of this report.
Since most homes and buildings in rural areas do not exceed two stories in height, a minimum residual pressure of 20 psi was maintained in the designs.
Fire Protection
After careful analysis of the local conditions in the rural or semi-urban areas which are typical for this UNDP(SF) Project, it was decided that no special fire-flow provisions need be considered, mainly because the dwellings are widely spaced and hydrants for fire protection could not be economically justified. Actually, most of the dwellings are located along irrigation canals with water readily available at all times in case of fire. However, if fire protection is justified at some time
• in the future in the built-up areas, minimum pressures of 20 psi are available at the fire hydrant locations. Assumptions are made that these areas would be served by pumping engines and that a fire station would be centrally located to serve the community.
Rate of Flow in the Distribution Systems
The systems were designed for peak flows, 2.5 x average flow. The number of users was arrived at by adding the present population and, depending on the area, the estimated future population. To this total were added the miscellaneous flows, such as industrial, commercial, and institutional.
- 18
Storage
A ground storage tank containing 50% of the total average daily flows was designed r.t the supply point. In addition to this reservoir, elevated storage with a volume necessary to provide adequate working pressures in the distribution system was also included in the individual designs.
Pumping Stations
small installations were designed for the average daily flow. The pumps would operate on two eight-hour shifts, since automation of the pumping station was kept to a minimum. The designs included space for a small office, storage space, transformer house, and living space for the caretaker (only if the size of the station warranted his full-time presence). Electricity was used as the main supply of power. Diesel engines were included to provide standby power for the larger stations.
Pipeline Corrosion and Incrustation
It was expected that neither corros ion nor incrustation would constitute a problem since the pipe to be used would be plastic, asbestoscement, or cast-iron, and Surinam water does not affect these materials adversely.
During the early stages of the project, samples of plastic pipe were taken from a six-year old water supply system in order to examine these for deposition, incrustation, or deformation. While there appeared to be a very small amount of iron deposited, no serious problems could be attributed to any of the above sources of difficulty.
Design Periods
(a) Land Requirements
The present situation in Surinam covering land ownership is such that, except in densely populated areas, most of the land is under central government control. Therefore, the procurement of land for major elements in the water supply systems should pose no problem even if these needs are projected over a 40-year period. It was assumed, however, that procurement would proceed within a reasonable length of time, thus precluding the occurrence of later problems.
(b) Major Production Elements
The design period for buildings as well as the concrete structures such as filters and storage was estimated at 40 years. The mechanical equipment design period was 15 years. Elevated storage des ign period was estimated at 25 years. Electrical wiring, controls, and so on were
•
•
•
- 19
designed for a period of 10 years. The design period of wells was esti mated at seven years, when replacement would become necessary.
(c) Distribution Elements
Because the pipe sizes were relatively small, and the unit costs were proportionally not great, the financial considerations were such that the design period could be estimated at 40 years. Similarly, the difference in construction costs between short- and long-term design periods tended to be moderate because of the small sizes involved.
CONSTRUCTION CONSIDERATIONS
Construction Standards
Generally, the standards of quality of construction for proposed water supplies were similar to those already in effect in the country, since extremely divergent applications would not be justified. In the case of concrete construction, for example, it is understood that the actual strengths achieved in concrete produced in Surinam tend to be somewhat less than those of other countries. This is reflected in the structural designs of the filter plant units.
The unavailability in Surinam of European standards for fittings and pumps for design purposes at the time the Project was initiated created the necessity for establishing the U.S. standards for these elements of the water supply projects. For piping, the ASTM and the KIWA standards were adopted. Thus, for construction purposes the equipment and materials specified according to the U.S. standards could be substituted with acceptable European material. The designs are such that any minor differences in dimensions can be compensated for with few problems.
Construction Labor. Materials. and Equipment
The availability of skilled and unskilled labor in the country is such that the construction of the water supply projects should proceed without too much difficulty. A number of projects of cons iderable size and complexity have been completed in Surinam in which local labor took an active part. In connection with the bauxite industry particularly, local labor was used extensively in the construction of plant facilities, roads and bridges, dams, and water installations. Also, the operation of heavy-duty construction equipment was initiated and developed to a great degree. The Surinam Water Company built several systems in which local labor had a large part. The "trainability" of local labor is entirely feasible and has been demonstrated many times.
Generally speaking, the technical and supervisory personnel avail able in the country are already committed to existing organizations.

- 20
Private and government sector organizations compete for services on this level of employees, and therefore the number of technical, supervisory, and professional personnel is limited. However, the staff that is avail able seems to be competent and capable of handling the responsibilities connected with water supply projects.
Cement, aggregates, water for concrete, and lumber are readily obtainable in the country and are in stock. Items such as reinforcing steel, structural steel, hardware, pumps, motors, electrical wiring and switchgear, glass, paint, and piping must be imported and sufficient lead time must be allowed for this importation.
Logistical items such as housing, food, fuel and lubricants, repair facilities, and the like are not likely to pose any serious problems.
Heavy-duty construction equipment and specialized construction equipment is available from several contractors in the metropolitan areas. The maintenance and repair facilities for these are also present.
Subcontracting of some of the branches of the work such as electri cal and mechanical could be possible since there are contractors of this type actively engaged in these fields at present. However, the individual subcontracts might prove to be somewhat expensive since the amount of this specialized work involved on the project is not very great.
Effect of Weather
Construction may be affected by the rainy seasons which normally occur twice during the year. The seasons and rainfall can be shown as follows:
Month J F M A M J J A S 0 N D Year Total
Season Rainy Short dry Long rainy Long dry Rainy
Average Rainfall 193 150 162 232 321 303 226 167 86 87 109 174 2,208 nm
Some delays due to seasonal rains might be anticipated. Although the rains may be heavy, they are of short duration; and the normal practice in construction during the rainy seasons seems to be to work in spite of the rain. Temperatures tend to remain fairly constant, with hlDDidity contrib.. uting to personal discomfort more than does excessive temperature. However, it is expected that no serious construction delays would stem from existing precipitation, temperatures, or weather conditions and that the overall effect on the construction schedules, equipment use, and labor forces would be minimal.
•
..

•
•
- 21
CHAPTER 3
WATER QUALITY REQUIREMENTS
GENERAL
This chapter deals with the development of the future water demands of the project area, princ~pa11y as affected by the water quality requirements for drinking water supplies. Water demands, as used herein, refer to diversion requirements and not to consumptive use, or in other words, the established water demands represent the amounts of water which have to be derived from either ground water or surface sources.
The water quality standards presented represent the minimum requirements for bacteriological, chemical, and physical characteristics of water for domestic use. These standards will be helpful in assess10g the suitability of the various sources of water supply and in determining the type and degree of treatment to be given.
QUANTITY REQUIREMENTS
The total water requirement of the project areas is that quantity which DI.lst be available to meet the estimated future domestic and 1odustrial water demands. Detailed discussions of the determination of the basic domestic and industrial requirements were presented 10 an earlier section.
QUALITY STANDARDS
Standards relating to the quality of public water supply systems are set forth in the World Health Organization's International Drinking Water Standards, 1971 edition. These standards prescribe minimum requirements for the bacteriological, virological, biological, radiological, and physical, chemical, and esthetic characteristics of drinking water supplies. The WHO International Drinking Water Standards are considered to be attainable by all countries throughout the world at the present time. The WHO European Standards for Drinking Water (1970) were also reviewed for possible application to the Surinam water supplies, but it was decided to consider these as a "next seep" in development.
It should be noted that the quality requirements discussed herein are those which, unless stated otherwise, must be maintained within the distribution system or, in other words, reflect water qualities at the point of use. These standards serve as a very useful tool in assessing the relative suitability of various sources of supply, and as such should not be regarded as implying approval of the degradation of an existing source which might be of superior quality to that recommended.

- 22
BACTERIOLOGICAL CHARACTERISTICS
The use of a new source for water supply requires the full bacteri ological examination of the source. Recent contamination by human excrement or animal pollution constitutes the greatest danger. However, pathogenic bacteria cannot be isolated in a practical manner during routine testing; and, therefore, the presence of E. coli and the coliform group as a whole in samples is cOlllDOD.ly interpreted as indication of pollution.
For piped water supplies, the following standards obtain:
Water Entering the Distribution Systems
(1) Chlorinated or otherwise'disinfected supplies:
No coliform organisms in any 100 ml sample.
(2) Non-disinfected supplies:
No E. coli in any 100 ml sample. Not-more than three coliform organisms per 100 ml (occasionally).
Water in the Distribution System
(1) Throughout any year, 95% of samples should not contain any coliform organisms in 100 m.
(2) No sample should contain E. coli in 100 mi.
(3) No sample should contain more than 10 coliform organisms per 100 mI.
(4) Coliform organisms should not be detectable in 100 ml of any two consecutive samples.
For small individual or cODDDJnity supplies the following standard is recommended:
The coliform count should be less than 10 per 100 ml.
PHYSICAL, CHEMICAL, AND ESTHETIC CHARACTERISTICS
Table IV-7 refers to the acceptability of water for domestic use. Examinations for some characteristics should be carried out routinely, with others conducted less frequently. Where a new source is considered, all the tests should be performed.
•

• • •
TABLE IV-7
SUBSTANCES AND CHARACTERISTICS AFFECTING THE ACCEPTABILITY OF WATER FOR DOMESTIC USE
Substance or Undesirable Effect Characteristic that May be Produced
Substances causing discoloration
Substances causing odors
Substances causing taste
Suspended matter
Total solids
pH range
Anionic detergentsc
Mineral oil
Discoloration
Odors
Tastes
Turbidity Possibly gastrointestinal
irritation
Taste Gastrointestinal irritation
Taste Corrosion
Taste and foaming
Taste and odor after
Highest Desirable Level
5 unitsa
Unobjectionable
Unobjectionable
b5 units
500 mg/l
7.0 to 8.5
0.2 mg/l
0.01 mg/l
Maximum Permissible Level
50 unitsa
Unobjectionable
Unobjectionable
b25 units
N UJ
1,500 mg/l
6.5 to 9.2
1.0 mg/l
0.30 mg/l
c a On the platinum-cobalt scale b Turbidity units Different reference substances are used in different countries

TABLE IV-7 (cont.)
SUBSTANCES AND CHARACTERISTICS AFFECTING THE ACCEPTABILITY OF WATER FOR DOMESTIC USE
SUbstance or Undesirable Effect Characteristic that May be Produced
Phenolic compounds (as phenol)
Total hardness
Calcium (as Ca)
Chloride (as C1)
Copper (as Cu)
Iron (total as Fe)
Magnesium (as Mg)
Manganese (as Mn)
Taste, particularly in chlorinated water
Excessive scale formation
Excessive scale formation
Taste; corrosion in hot-water systems
Astringent taste; discoloration and corrosion of pipes, fittings, and utensils
Taste; discoloration; deposits and growth of iron bacteria; turbidity
Hardness; taste; gastrointestinal irritation in the presence of sulfate
Taste; discoloration; deposits in pipes; turbidity
Highest Desirable MaxinlJm Permissible Level Level
0.001 mg/1
2mEq/a, b (100 mg/1 CaC03)
75 mg/1
200 mg/1
0.05 mg/1
0.1 mg/1
Not more than 30 mg/1 if there are 250 mg/1 of sulfate; if there is less sulfate, magnesium up to 150 mg/1 may be allowed
0.05 mg/l
0.002 mg/1
10mEq/1 (500 mg/1 CaC03)
200 mg/1
600 mg/1
1.5 mg/1
N .p.
1.0 mg/1
150 mg/1
0.5 mg/1
a l f the hardness is much less than this, other undesirable effects may be caused; for example, heavy metals may be dissolved out of pipes.
bl mEq/1 of hardness-producing ion = 50 mg CaC031 = 5.0 French degrees of hardness = 2.8 (approx.) German degrees of hardness = 3.5 (approx.) English degrees of hardness.
,. ..•

• • •
TABLE IV-7 (cont.)
SUBSTANCES AND CHARACTERISTICS AFFECTING THE ACCEPTABILITY OF WATER FOR DOMESTIC USE
Substance or Characteristic
Undesirable Effect that May be Produced
Highest Desirable Level
Maximum Permissible Level
SUlfate (as S04) Gastrointestinal irritation when magnesium or sodiwn are present
200 mg/l 400 mg/l
Zinc (as Zn) Astringent taste; opalescence and sand-like deposits
5.0 mg/l 15 mg/l
N VI

- 26
Industries are generally willing to accept for most processes water that meets drinking water standards. Where water of higher quality is needed, for example, for certain electronic equipment manufacture, food and beverage preparation, or for high-pressure boilers, industry must recognize that additional water treatment is the responsibility of the water user.
Some chemicals, when present in certain concentrations in drinking water, are considered to constitute a hazard to health. The International Standards for Drinking Water include limits for these, based on a daily intake of 2.5 liters for a man weighing 70 kg. These are shown in Table IV-B.
Although contamination of drinking water with pesticides, insecticides, herbicides, and fungicides can reach the level of constituting a toxicity hazard, the influence of such contamination on water supplies in Surinam has been limited, because the sources have generally been ground water sources.
While the following chemical substances do not, as yet, constitute problems in the water supply systems of Surinam, it is deemed worthwhile to direct attention toward them since this detection (if necessary) serves to protect the health of the users of drtnking water.
Fluoride concentration in water supplies must be assessed in relation to the individual's total daily fluoride intake, particularly since fluoride-containing foods form part of the diet. The concentrations of fluorides recommended for drinking water for various temperature ranges (five-year average daily temperatures) are listed in Table IV-9.
Certain carcinogenic substances in water supplies are considered as constituting health hazards. Among these are nitrosamines and some polynuclear aromatic hydrocarbons (PAll). Nitrates in concentration greater than 45 mg/l (expressed as N03) can be detrimental to children, especially infants, after the nitrates have been reduced to nitrites and these, after ingestion, produce nitrosamines. In the case of PAIl, the concentration of six PAIl canpounds should not in general exceed 0.2 mg/!.
vmOLOGICAL CHARACTERISTICS
Although viruses can sometimes be found in raw water, the usual transmission occurs through water containing coliform organisms frequently in reclaimed or reused water which is untreated sewage effluent. Sedimentation and slow filtration contribute to virus removal. Inactivation can be achieved by oxidation utilizing a concentration of 0.5 mg/l of free chlorine for one hour.
I.!

- 27
TABLE IV-8
TENTATIVE LIMITS FOR TOXIC SUBSTANCES IN DRINKING WATER
Upper Limit ofSubstance Concentration
Arsenic (as As)
0.05 mg/l
Cadmium (as Cd)
0.01 mg/l
Cyanide (as CN)
0.05 mg/l
Lead (as Ph)
0.1 mg/l
Mercury (total as Hg)
0.001 mg/l
Selenium (as Se)
0.01 mg/l
TABLE IV-9
RECOMMENDED CONTROL LIMITS FOR FLUORIDES IN DRINKING WATER
Recommended Control Limits for Fluorides (as F) in mg/lAnnual Average of Maximum
Daily Air Temperature in °c Lower Upper
10-12 0.9 1.7
12.1 - 14.6 0.8 1.5
14.7 - 17.6 0.8 1.3
17.7 - 21.4 0.7 1.2
21.5 - 26.2 0.7 1.0
26.3 - 32.6 0.6 0.8
WHO International Standards for Drinking Water, 1968.

-.., .. '. • • • 4P'0.
- 28
'*'i
BIOLOGICAL CHARACTERISTICS
Biological qualities of drinking water in Surinam are of main importance in the effects of such characteristics in tastes and odors of water. Generally, biological growths such as slimes, algae, and animalcules can be controlled (if required) through chlorination, particularly in those treatment plants which do not incorporate conventional flocculation and filtration processes. ..
RADIOLOGICAL CHARACTERISTICS
Local conditions in Surinam tend to preclude significant radioactive contamination of water supplies. However, the levels of radioactivity recommended by the International Commission on Radiological Protection (ICRP) are listed below for informational purposes:
Gross alpha activity 3pCi/l Gross beta activity 30pCi/l
These levels apply to the mean of all radioactivity measurements during a three-month period.

•
•
•
..
- 29
CHAPTER 4
SOURCES OF SUPPLY
Concurrent with the determination of the magnitude of existing and anticipated demands for potable water, investigations were undertaken to locate suitable sources. A general discussion of the occurrence of water in Surinam follows.
Surinam receives an apparent abundance of rainfall, most of which falls during the periods April to July and December to February. A large part of this precipitation is carried northward to the sea by the several rivers and their tributaries; the rest, except for losses by evaporation and transpiration, seeps into the earth and may serve to recharge ground water supplies. Unfortunately, surface supplies from streams, from a quality standpoint, are not always suitable for domestic consumption, unless needed conditioning is accomplished through suitable water treatment.
In most areas some rain water is available from catchments, and this is a popular source of water during the wet seasons. However, catchment areas and collection tanks have only limited capacities and supplies are generally depleted well before the rains of the next wet season commence. Thus, during the hot, dry seasons when water is most urgently needed, rain water supplies become exhausted and acute problems develop; and this requires emergency action by government officials, which involves the previously discussed transporting of water over great distances for distribution to the people. These situations show that rain water catchment in the vast majority of cases cannot be depended upon to supply reliable water service throughout the year.
Ground water supplies also present problems; this is true largely from a standpoint of chemical quality. Water from aquifers in the coastal plain, where the larger concentrations of population are found, frequently contains large amounts of chlorides. Further inland, water of lower chloride content may be found in many places but generally it has other objectionable properties due to the presence of iron salts and gases such as hydrogen sulfide, carbon dioxide, and methane. This problem is usually more pronounced in water from the deeper strata. Simple treatment methods can be employed (essentially aeration, pH adjustment, rapid sand filtration, and shell filtration) to effect removal of iron and objectionable gases, but a treatment plant with suitable equipment is required. The treatment process also serves to stabilize water which has a tendency to be corros ive.

- 30
In 1956, SABTS initiated a project for demonstrating practical methods of installing low-yield, shallow, sanitary wells for supplying water for farms and small groups of families. On the basis of 230 wells installed, it was concluded that it is possible in many places in Surinam to develop sanitary wells, the water from which does not contain excessive amounts of iron. Also, it had been observed that some fresh water is generally found in the upper layers of the aquifers, indicating that lowyield wells might be developed to supply water needs of small groups without having to resort to the installation of elaborate treatment facilities. The SABTS demonstration developed valuable information about the ground water supplies, but considerably more exploratory work was needed in all of the districts in order to gain a more comprehensive view of the possibilities for solving the basic problems.
A detailed evaluation of the .available and potential sources of surface and ground water is provided in this report in Volume III - Water Resources (Hydrogeological and Hydrological Studies). The water balance method was selected for source evaluation purposes with emphasis placed upon hydrologic cycle studies. The following elements were included: rainfall, evaporation, evapotranspiration, infiltration and percolation, ground water flow, and stream flow.
RAIN WATER
In its natural state, rain water is almost completely void of chemicals and if collected on clean catchment surfaces may be relatively free of contamination. However, it is difficult from a practical standpoint to maintain good sanitary conditions in catchments and collecting tanks; also, handling methods employed are apt to cause contamination of the water.
Holding of rain water for long periods of time (without replenishing), especially during abnormally long dry seasons, requires extensive storage capacities, making provision of adequate facilities impractical for most cammJnities.
Further, in Surinam rain water collection does not constitute a dependable method of water supply because rainy seasons do not always provide the total precipitation required. Precipitation information gathered over 30 years shows that the west-central coastal area is rather dry, with more precipitation towards the east, the extreme west, and in the higher interior. Comparison of the 30-year information with the 1961 • 1966 data shows that the latter are about 20% (400-500 mm) lower than the figures from the 30-year data. It is not known if this dry period extended ..farther into the interior, but it seems reasonable to assume that the mean values for the 1961-1966 period were below normal (see Figure IV-I).
In a precipitation study covering several Surinam and foreign areas conducted in connection with a river and coastal transportation project,

------------------""""--------------.",..-------- ----------~~----~----......
•
•
•
- 31
' .
it was determined that the most extreme rainfall patterns occur at Georgetown and Cayenne , which have two and one distinct rainy seasons respectively. In Surinam the seasonal variations showed a transition between these two, with a recurring rainy season during April, May, and June, but with a variable intensity of the short rainy period in December and January. It was characteristic of the southwest part of the country that one long dry season lasting about eight months occurred annually. A similar, agriculturally disastrous situation seems to occur in the coastal plain when, in approximate 10-year cycles, rains fail to materialize in the short dry season.
SURFACE WATER
Water from surface supplies compras ang rivers, swamps, lakes, and canals, including those in the more remote, undeveloped sections of the country, can be used for domestic consumption, but requires suitable treatment. High quality water whieh is satisfactory both chemically and bacteriologically can be produced in treatment plants at a relatively nominal cost, provided the system is of such magnitude as to justify the cost of treatment plant installation.
The principal occurrence of surface water in Surinam is in the many rivers and streams which traverse the country. A considerable amount of hydrological and meteorological investigation has been done and is continuing. The Hydraulic Research Division of the Ministry of Public Works conducts a continuing program in the study of the quality and availability of river water in Surinam. Hydrological data reports covering the lower Corantijn River, the Nickerie River, and the lower Marowijne River have been published; and another report which concerns the lower Suriname River is ready for release.
Correlation of river discharges and comparison of precipitation data with discharges have been attempted by the Hydraulic Research Division in order to estimate flows in the main Surinam rivers. One estimate of the mean flow at river mouth is shown as follows:
Discharge Run-offRiver lan3 per Annum m3 per sec. rmn per Annum
Corantijn 2,000 63 950 Nickerie 200 6.3 650 Coppename 470 15 810 Saramacca 240 7.5 735 Suriname 440 14 800 Con:m.ewijne 120 3.8 565 Marowijne 2,000 63 950
Variations in the discharges of Surinam rivers are caused by several factors. The hydrographs of the Corantijn and Coppename Rivers

- 32
show strong variations in consonance with the periods of heavy precipitation. The regimen (If the lower Suriname River is canp1ete1y governed by the operation of the hydroelectric power station in the dam near Afobaka, which started oper~ting in October 1965 following a period of complete cessation of flow during 1964.
The sediment discharges of the rivers are relatively small. This, together with strong tides, causes the estuaries to reflect considerable wear.
The tide along the Surinam coast is diurnal, and the mean tidal range is approximately two meters at the river mouths. Penetration of the tidal wave is deep, and during periods of low flow the tidal influence can in sane cases be detected over 200 Ian inland from the river mouth.
A continual interaction takes place between the more dense ocean water moving upstream along the estuary bottom, reinforced by the tidal currents, and the river discharge which tends to push the "sal.t.-wedge" back into the ocean. River discharge, therefore, tends to control the movement of the sa1t-wedge. In the case of the Suriname River, for example, the so-called "acceptab1efl level of chlorides of 100 mg/1 extends to Torarica (105 km) during periods of minimal discharge.
Several proposals are being considered by the Government which may have a decided effect on river discharges and their control. Principa11y, these are hydroelectric projects which would be associated with the bauxite exploitation and aluminum production.
The initial hydroelectric station, with a capacity of 180 MW, was constructed at Afobaka, approximately 150 kilometers upstream from Paramaribo on the Suriname River. Completed in early 1964, the dam impounds a water storage covering an area of about 1,600 square kilometers. Contro11~d discharge at Brokopondo provides a mean yearly flow of approximately 250 m l eee , A preliminary study and plans have been developed for another dam on the Suriname River. Located at Joden Savanna, the Torarica Dam hydroelectric plant would deliver 18 MW.
The Ministry of Development submitted a nequest; to the United Nations Development PrograIIJDe for a feasibility study covering the Kaba1ebo Hydroelectric Scheme in which the Kaba1ebo River would be danmed at Avanavero Falls and Kaba1ebo Falls, linking the Corantijn River at Frederik Wi11em IV Falls with the upper Kaba1ebo River. Through the diversion of the Corantijn River, hydroelectric power of up to 870 MW could be developed in an average year.
Additional diversion of the Corantijn into the Nanni River reservoir has also been studied from the point of view of providing water for the Wageningen rice polders as needed.

I
•
_.
- 33
Another plan, for a dam at Stondansie on the Nickerie River, was concerned with the regulation of the lower Nickerie River for irrigation purposes.
The possibilities of developing hydroelectric power on the Lawa, Tapanahony, and Marowijne Rivers have been initially investigated with several potential dam sites being considered. The Lawa and Marowijne Rivers, of course, are also of interest to the French Government.
A map, prepared by the Hydraulic Research Division of the Ministry of Public Works, showing the pertinent discharge measurement stations and other stream data collection points for the lower Suriname River, is included as Figure IV-2.
A topographical map with longitudinal profile of the lower Suriname River is provided as Figure IV-3.
Investigation covering the quality of river waters, particularly in the estuaries, was initiated in 1960 by the Bureau for Rural Development, and responsibility for this operation was assumed by the Hydraulics Research Division in 1964. So-called "sal.c-trr tps " are part of this investigation, and 88 sampling tours were conducted fran 1960 to 1970 in order to determine the surface chlorides at given points in the river.
While the ground water sources appeared to be adequate for community water supply demands throughout the master planning period, it was deemed necessary to consider the alternative of providing surface water sources. Thus, early consideration was given in the project to the possibility of utilizing surface water. Among other approaches, research and development of the biological or slow-sand filter was instituted, and a test program was initis ted in several areas in which it might have been feasible to use surface water.
Inherent problems exist in some areas, and these either preclude or severely restrict th~ utilization of surface water.
The most obvious source of large quantities of surface water is, of course, the van B1ommensteinmeer, the large man-made lake which lies approximately 120 km south of Paramaribo and supplies water to the hydroelectric facility at Afobaka Dam. While it appears a not-too-difficu1t task to design a transmission line from this lake to serve the populated areas to the north (including Paramaribo), there are several impelling reasons why this had not been accomplished in the past. First, and most important, the Brokopondo Agreement between the Government of Surinam and the aluminum company stipulates that all the water impounded behind the dam is under the control of the company and is not availab1e for exploitation. Next, even should the water become available for community supplies, the present needs are being met closer to the populated coastal area, thereby obviating the need for a large present investment in

- 50
CHAPTER 6
INTERIM WATER SUPPLIES
•STATUS OF EXISTING WATER SUPPLIES
As of beginning 1972 the following status existed with regard to community water supply systems in Surinam:
Existing Operational Systems
1. Paramaribo, Albina, and Nieuw Nickerie (Surinam Water Company) 2. Koewarasan (Ministry of Rural Government and Decentralization) 3. Meerzorg (Surinam Water Company) 4. Groningen-Tambaredjo (Surinam Water Company) 5. Brokopondo (Surinam Water Company) 6. K1aaskreek (Surinam Water Company) 7. Brownsweg (Surinam Water Company) 8. Alliance (Ministry of Agriculture) 9. Totness (Ministry of Agriculture)
10. Kampong Baroe (Ministry of Agriculture) 11. Groot Chati110n (Ministry of Health) 12. Paranam (Sura1co) 13. Moengo (Sura1co) 14. Afobaka (Suralco) 15. Onverdacht (Bi11iton Mij.) 16. Sma1ka1den (Bi11iton Mij.) 17. Marit!nburg (Cu1tuur and Rubber Mij.) 18. Wageningen (SML) 19. Wonoredjo (Ministry
Systems under Expansion
1. Paramaribo (Surinam Water Company) 2. Groningen 3. Brokopondo 4. Koewarasan
Systems under Planning
1. Brokopondo (expansion) 9. Calcutta-Tijgerkreek West •2. Coronie (elevated storage) 10. Nieuw Lombe-Mooie Kreek
3. Meerzorg and Peperpot 11. Pad van Wanica West (expansion) 12. Uitkijk-Jarikaba
4. Kwatta-Leidengen 13. Jagtlust-Nw. Amsterdam-Voorberg, .5. Kwakoegron Alkmaar Zoelen, Marit!nburg 6. Groot en Klein Henar 14. Spieringshoek-Wederzorg and 7. Corantijn and van Drimmelen Katwyk
Polder 15. 'Iamanredjo 8. Paradise 16. Leliendal

..
•
..
- 33
Another plan, for a dam at Stondansie on the Nickerie River, was concerned with the regulation of the lower Nickerie River for irrigation purposes.
The possibilities of developing hydroelectric power on the Lawa, Tapanahony, and MBrowijne Rivers have been initially investigated with several potential dam sites being considered. The Lawa and Marowijne Rivers, of course, are also of interest to the French Government.
A map, prepared by the Hydraulic Research Division of the Ministry of Public Works, showing the pertinent discharge measurement stations and other stream data collection points for the lower Suriname River, is included as Figure IV-2.
A topographical map with longitudinal profile of the lower Suriname River is provided as Figure IV-3.
Investigation covering the quality of river waters, particularly in the estuaries, was initiated in 1960 by the Bureau for Rural Development, and responsibility for this operation was assumed by the Hydraulics Research Division in 1964. So-called lIs a 1t - t r i ps " are part of this investigation, and 88 sampling tours were conducted fran 1960 to 1970 in order to determine the surface chlorides at given points in the river.
While the ground water sources appeared to be adequate for cOllJlmmity water supply demands throughout the master planning period, it was deemed necessary to consider the alternative of providing surface water sources. Thus, early consideration was given in the project to the possibility of utilizing surface water. Among other approaches, research and development of the biological or slow-sand filter was institute~ and a test program was initia ted in several areas in which it might have been feasible to use surface water.
Inherent problems exist in some areas, and these either preclude or severely restrict th~ utilization of surface water.
The most obvious source of large quantities of surface water is, of course, the van Blonnnensteimneer, the large man-made lake which lies approximately 120 km south of Paramaribo and supplies water to the hydroelectric facility at Afobaka Dam. While it appears a not-too-difficu1t task to design a transmission line from this lake to serve the populated areas to the north (including Paramaribo), there are several impelling reasons why this had not been accomplished in the past. First, and most important, the Brokopondo Agreement between the Government of Surinam and the a1umimun company stipulates that all the water impounded behind the dam is under the control of the company and is not available for exploitation. Next, even should the water become available for community supplies, the present needs are being met closer to the populated coastal area, thereby obviating the need for a large present investment in

- 34
treatment and transmission facilities. Finally, the level in the lake has not retained the height considered more than sufficient for maximum power production, and any large extraction for uses other than hydroelectric power generation lo.~1JU1d not be justifiable.
Also considered were the following: Suriname River, Para Creek, Surnau Creek, Saramacca River, and Or1eana Creek. All were studied in the context of providing raw water for the lower Suriname basin area projects. Although each showed pranise, the frequency of contamination occurrences through high chloride levels in each of these surface water sources caused them to be rejected. A six-month chemical sampling program was conducted, however. In the case of the Suriname and the Saramacca Rivers it is possible to install intakes, but the distances from the coastal area require relatively long transmission mains. Specific utilization of surface supplies is reported in greater detail in later sections of this report.
SWAMP SUPPLIES
The possibility of developing reservoirs of surface water in swampy areas was also given primary consideration, particularly in areas such as Camnewijne where suitable ground water seemed to be virtually nonexistent, but this possibility was rejected for several reasons.
Some experience had been gained in impounding swamp water in connection with the private supply at Mari~nburg serving approximately 4,000 persons, and it was found that aquatic weed growth and algae growth presented serious problems, as did chlorination.
In order to store sufficient quantities of water to provide a continuous supply over the dry seasons, it would be necessary to construct large reservoirs. For example, to serve 10,000 persons at an sverage daily demand of 100 l/c/d for a three-month dry season would require a reservoir containing 90,000 m3 disregarding evaporation. At a depth of 2 meters, a net area of 45,000 sq. meters would be required. Construction of an impervious reservoir of this size would be coatIy and the capital cost would also necessarily hsve to reflect pumping costs, since grsvity flow would be impossible.
Additional treatment beyond the oxidation realized in storage would also be needed because the swamp water tends to contain considerable organic matter and other pollutants.
GRroND WATER
General and specific aspects of ground water as supply are considered in detail in Volume III of this report.
•
•
..

- 35
In connection with ground water, the possibility of utilizing windmills was rev:f.ewed as a low-cost method of supplying water. The conditions for proper operation are set out in a WHO monograph covering water supply for rl'.ral areas and small communities. Of the five conditions listed, the most tmportant requirement is for winds of more than 8 km per hour at least 60% of the time. Because the winds in Surinam are generally weak (approxtmately Beaufort 1.20 ) and furthermore are not consistent,• this approach was not pursued. It is understood that provision for pumping with hand- or animal-power could be substituted for wind energy, but this type of operation is not considered practical in Surinam.
WATER ANALYSIS
Collection and analysis of water samples were performed for both ground and surface water sources. The facilities of the Central Laboratory of the Public Health Departnent were ut ilized for chemical and bacteriological analyses. References to ground water analysis are provided in detail in Volume III of this report.
With regard to surface water sources, chemical sampling was conducted for each potential source, particularly in connection with the biological filtration test program. Typical results are included as Table IV-lO.
In addition to the bacteriological testing perforned by the Central Laboratory, field testing was accomplished employing membrane filter techniques. These methods and chemical testing with field kits were introduced as part of the on-the-job training of the national staff •
.'

Substance or Property
AmDonia NH3
Iron Fe
Manganese Mn
Residue
Chloride Cl
Nitrite N02
Nitrate N03
Sulfate S04
pH
Color
Bie. hardness
Tot. hardness
KMn 04
H2S
Plate counts
Most probable number
Eichmann
TABLE IV-lO
FILTERED SURFACE WATER SOORCE: PROF. DR. IR. W. J. V. BLOOMENSTEIN LAKE
CHEMICAL ANALYSIS
Dry Season Rainy Season 1970 1970
neg.neg.neg.
2.1 1.1
neg. neg.
1.4
neg.
90 45 95
6 8 13
pose neg. neg.
pOSe neg.
neg.
neg.
neg. T.
7.16.0 7.3
CL.CL. CL.
0.6 00.80 0.40
0.6 0
30
0.80 0.80
27 45
neg.
Bacteriological Examination
30 1) * Note:
f . 0
neg.
Dry Season 1970
neg.
0.9
neg.
160
19
neg.
neg.
I
w 0
I
T.
6.5
CL.
0.6 0
0.6 0
25
All samples were light yellow. No color scale was used. CL = Clear, CD = Cloudy, TU = Turbid
,.. ••

• 4
SOURCE:
substance Dry Season I or Property 1970
NH3 Ammonia
Iron Fe
Manganese Mn
Residue
Chloride C1
Nitrite N02
Nitrate N03
Sulfate S04
pH
Color
Bic. hardness D.H.
Tot. hardness D.H.
KMn 04 demand
H2S
Plate counts
Most probable/single number
Eichmann/test ...
TABLE IV-10
SURFACE WATER PARARlVER AT HIGH WAY
CHEMICAL ANALYSIS
llainy Season 1970
neg.neg.neg. neg.
2.7
neg.
1.2 2.0 1.7
neg. neg.
127
neg.
57
42
676 51
27
neg.
3549
neg.
neg.
neg.neg.
neg. neg.neg. I
T. T.T. T.
6.15.97.06.3
CL.CL.TU.CL.
0.500.70 0.6 01.00
0.6 0 1.1 01.101.40
46
neg.
Bacteriological Examination
900
6585
100
pOSe
neg.
3.7
neg.
121
16
neg.
j neg.
• T.
7.0
CL.
0.90
1.00
83
190
1,000
pos ,
'. '.
Dry Season 1970
neg.
2.
neg.
23
11
neg.
neg.
T.
6.0
CL.
0.6 0
0.70
50
I I
neg.
1.4
neg.
330
151
neg.
neg. I
29 w -...l
6.7 I
CL.
0.6 0
3.70
34
1
neg.
3.8
neg.
400
117
neg.
neg.
I 32
6.1
CL.
0.50
3.6 0
25
neg.
>300
pOSe
I
! I i
I !
I
neg.
2.4
neg.
I 374 I \
i 104 ! I , neg.
neg.
41
5.7
CL.
0.50
3.6 0
50
i I
'~300
,
0
0
neg.
3.5 iI neg.
I 231 40
I I neg.
I neg.
16
5.9
TU.
0.70
1.6 0
94
7300
I
0
0
neg.
2.4
neg.
104
21
neg.
neg.
T.
5.8
TU.
0.7 0
1.00
I 67 I I II
1900 I \
40.000
pOSe
1) Note: All samples were light yellow. No color scale was used. CL = Clear, CD = Cloudy, TU = Turbid.

--- --- ---
TABLE IV-10
SURFACE WATER SOURCE: SARAMACCA DOORSTEEK
CHEMICAL ANALYS IS
Substance or Property
NH3 Ammonia
Iron Fe
Manganese Mn
Residue
Chloride Cl
Nitrite 002
neg.
5.9
neg.
510
92
neg.
Nitrate NOJ neg.!
Dry Season 1970
neg.
0.5
neg.
732
55
neg.
neg.
neg.
3.2
neg.
340
30
neg.
neg.
5
7.6
TU.
2.90
3.00
55
pOSe
1.3
neg.
362
55
Str. pos ,
Str , pos ,
19
6.8
TU.
6.80
6.80
59
: IRainy Season i Dry Season
1970 1970I neg.
5.9
neg.
549
31
neg.
neg.
neg.
7.5
2.90
3.7 0
59
neg.
Sulfate S04
pH
Color
Bic. hardness D.H.
Tot. hardness D.H.
KMn 04 demand
H2S
*
I 29I I 7.1
CL.
2.30
5.30
, 39 i neg.
!
It
I 92
7.4 I TU. I 3.10
6.10
55
,
1) Note: All samples were light yellow. No color scale was used.
neg. 4.0
neg.
609
T.
neg.
neg.
T.
6.7
TU.
3. 10 1
4.00
59
neg.
Bacteriological Examination
NIL
! neg.I I 4.4 i neg.!
I
167
1 22
neg. i
I I !
I
neg.
T.
6.8
0.30
0.90
47
neg.
I neg.
! 1.8 I I
neg.
i 142 I
35
neg.
neg.
T.
6.8
2.50 :
2.80
39
neg.
I 4.2 I
0.08
223
I I Ii
I I
65
neg.
neg. w oo
23
8.1
--3.6 0
3.90
40
CL = Clear, CD = Cloudy, TU = Turbid.
,.. .. -"

I,. ....
TABLE IV-lO
SURFACE WATER SOURCE: PARA DOORSTEEK
CHEMICAL ANALYSIS
Substance Dry Season Rainy Season or Property 1970 1970
Ammonia NH3 neg. pOSe neg. neg. neg. neg.
Iron Fe 1.2 1.6 1.1 2.4 2.3 1.3
Manganese Mn neg. neg. neg. neg. neg. neg.
Residue 60 120 152 215 82
Chloride Cl 4 2 13 7 7 14
Nitrite N02 pos , neg. neg. neg. pos , neg.
Nitrate N03 pOSe pOSe neg. neg. pOSe neg.
Sulfate 804 neg. neg. 10 TU. TU. neg.
pH 3.6 6.4 5.0 4.5 7.3 4.3
Color Ct. CL. TU. TU. CL. CL.
Bie. hardness D.H. 0.50 1.00 0.70 0.40 1.00 0.50
Tot. hardness D.H. 3.60 1.00 0.70 0.60 1.10 0.50
KMn 04 demand 25 31 60 85 80 92
H2S neg.
Bacteriological Examination
Plate eounts 71 4 , 300 >330 30 210
Most probable/single number 0 0 5 tOOO 8 tooO 100
Eighmann/test pos. a a pOSe pos , pOSe
*1) Note: All samples were light yellow. No color scale was used. CL = Clear t CD = Cloudy, TU = Turbid.
Dry Season 1970
neg.
1.1
neg.
85
19
neg.
neg.
TU.
6.2
TU.
0.10
0.40
78
neg.
neg.
1.4
neg.
16
neg.
neg.
TU.
5.9
CL.
0.50
0.60
37
neg.
neg.
1.3
neg.
20
neg.
neg.
TU.
5.6
CL.
0.30
0.30
78
neg.
2.1
neg.
71
18
neg.
neg.
neg.
6.4
\.oJ \0
CL.
neg.
1.0
neg.
55
21
neg.
neg.
TU.
6.2
CL.
1.00
1.00
42
neg.
0.45
neg.
67
18
neg.
neg.
neg.
6.4
CL.
0.30
0.30
79

• •
TABLE IV-10
SURFACE WATER SOURCE: TOUT LUI FAUT KANAAL
CHEMICAL ANALYSIS
Rainy SeasonDry Season Dry Season or Property
Substance 19701970 1970
I I neg. neg. neg. neg. neg.neg. neg.Ammonia NH3 neg.neg. neg.
1.8 3.2 7.1 4.0 3.32.0 5.3 3.0 1.5 1.6Iron Fe
neg. neg. neg. neg.neg. neg. 0.4 neg. neg.Manganese Mn neg.
281188 417 301 361 69 309139 96140Residue
22 22 1421 13 16 43 2715 11Chloride C1
neg. neg. neg. neg. neg. neg. neg. neg.neg. neg.Nitrite N02
neg. neg. neg. neg.pOSe neg. neg. neg. neg.pOSeNitrate N03
76 TU. TU.neg. neg. TU. TU. TU. TU.Sulfate S04 6.3 8.0 6.36.8 5.9 3.3 6.3 7.47.4pH 7.4
TU. TU. TU.CL. TU. TU.CL.Color
0.800.90 3.00 0.90 0.90 1.503.10 1.10Bic. hardness D.H. I 2.50
0.910.9 1.00 0.30 0.90 0.90 1.602.60 3.10 1.10 4.00Tot. hardness D.H.
2826 75 3024 60 72 83 59 31KMn 04 demand neg.neg.H2S
Bacteriological Examination
730600200 300300Plate counts
Most probable/single number 10,000 35,0000 00
pOSe pOSepos , 0 0Eichmann/test
1) * Note: All samples were light yellow.No color scale was used. CL = Clear, CD = CloudY, TU = Turbid.
~ o
~ tr

- 41
CHAPTER 5
WATER TREATMENT
NEED FOR TREATMENT
Standards for water quality for public water supplies were discussed in Chapter 3, Water Quality Requirements, and the quality of available water was discussed in Chapter 4, Sources of Supply. This chapter concerns the need for treatment of existing raw water to provide an end product which is hygienically safe, esthetically attractive, and palatable.
In the selection and development of raw water sources for small water supplies, levels of necessary treatment are of prime importance.
The consideration of levels of treatment to be provided is defined in the World Health Organization Monograph Series No. 42, I~ater Supply for Rural Areas· and Small CODmllnit ies. tt Briefly, these are as follows:
Source and Treatment:
First-priority consideration:
Water which requires no treatment to meet bacteriological, physical, and chemical requirements* and which can be delivered to the consumer by a gravity system should be given first c onsiderat ion. This would usually be limited to springs and protected drainage areas. Such a system requires no treatment and no pumping, and is therefore ideal from the point of view of maintenance, which is thus reduced to an absolute minimum.
Second-priority consideration:
Water which requires no treatment to meet bacteriological, physical, and chemical requirements but which must be pumped to consumers would be the second choice. Well supplies fall within this category.
• Third-priority consideration:**
Water which requires simple treatment before it can meet bacteriological, physical, or chemical requirements but which can be delivered to the consumer through a gravity system should be given
* These requirements depend on water quality standards applied by each country, and will vary from one. place to another.
**Depending on local circumstances, this could be a second priority.
- 42
third-priority consideration. Simple treatment is considered to be limited to 1) storage which would provide plain sedimentat ion and some reduction in bacteria; 2) chlorination without the use of a mechanica11; operated chlorinator; and 3) slow sand filtration; or a combination of these.
Fourth-priority consideration
Water which requires simple treatment, as mentioned above, and which must be delivered to the consumers by pumping would obviously be the • most expensive choice to make.*
Because of the limitations imposed by topography, salinity, population concentrations, and the like, the water supplies in the more populated areas of Surinam generally fall into the fourth priority consideration as defined above. Since this is the most expensive choice, it behooves the designer to exercise imagination and ingenuity in effecting as many economies as possible in the design of treatment and distribution facilities in order to keep the water supplies within the financial reach of as many communities as possible.
TREATMENT OF GROUND WATER
The ground water sources supplying the existing systems in Surinam as well as the potential planned systems are of such physical and chemical quality as to require only a relatively simple method of treatment. Bacteriological pollution of ground water has not constituted a major problem as yet.
Principally, the need for treatment, therefore, is limited to aeration, rapid sand filtration, and "shell" filtrat ion or "polishing."
In order to meet the relatively high standard for potable water in Surinam the ground water treatment is related to iron, carbon dioxide, hydrogen sulfide, manganese, and methane, which are found in sufficient quantities to merit special treatment. Iron is removed by revising the originally acidic condition of the water. Carbon dioxide is mainly responsible for causing the acidic condition, and aeration is applied to adjust this condition. During this degassification of the water other 11'
objectionable gases such as H2S and methane are removed, and pH correction is effected to a degree.
Aeration as a method of iron oxidation and degassification is considered useful when applied to typical Surinam ground water because of the following:
*Depending on local circumstances, this could be a second priority.

..
- 43
1) Simplicity
The mechanics of aeration is simple, although the process itself is mu1tivarious. It does not involve chemicals which have to be imported, nor is special feeding equipment required.
2) Composition
Because Surinam ground water has a relatively constant composition and does not contain inhibiting compounds, iron removal by other means would be difficult and would require treatment with chemicals. The dissolved iron present in the raw water is unstable. Ground water which is clear when drawn will turn cloudy and precipitate when the sample is exposed to air for a per iod of time.
3) Standardization
This aeration method is already familiar to treatment plant personnel and has been successfully applied in this country for years, justifying the continuance of this type of application for practical purposes.
4) Maintenance
The well-designed aeration system will operate relatively trouble free for long periods without the need of highly-trained, skilled maintenance workers.
5) Corrosion Control
While providing atmospheric oxygen for the oxidation of iron and the liberation of gases, the aeration process serves to prevent corrosion.
"Shell" filtration or "polishing" is used (in addition to aeration) in Surinam as a final step in the ground water treatment process for several reasons. As a treatment medium it promotes stabilization and effects final reduction of the C02 as well as contributing to pH correction. Shells are readily available in the country in large amounts and need only• washing prior to use. These shells are the residue of countless fresh water mollusks and occur in shell banks in numerous locations in Surinam•
.. Therefore, when treatment by aeration and sand filtration alone tend to be inadequate, "shell" filter is included as an additional means of producing high quality drinking water. "Shell" filtration as a source of calcium carbonate has the following specific advantages:
- adjusts the pH up to a maxUmwm of 7.8 - limits the C02 contents to approximately 2.0 mgt liter

- 44
TREATMENT OF SURFACE WATER
River Supplies
Treatment of surface water in Surinam can be traced to 1926 in which the Surinaamsche Bauxite Maatschappij began treating Cottica River water at Moengo through chlorination and filtration. The need for heavy chlorination in order to produce an acceptable drinking water let to the discontinuance of the treatment plant operation. A new plant was constructed in 1937 but this, too, was discontinued after adequate ground water supplies were developed. However, with the average daily demand reaching approximately 100,000 gallons/day by 1954, the need existed again for treatment of river water. Subsequently a treatment plant was built which incorporated the following steps:
1. Screening at intake 2. Addition of chemical flocculent 3. Mixing 4. Flocculation 5. Sedimentation 6. Rapid sand filtration 7. pH adjustment 8. Chlorination
This plant is still in operation.
In 1958 the water treatment plant for the Ministry of Health Leprosarium at Groot Chati110n was placed in operation by the Public Health Division of SABTS. Serious problems in water transport to the leprosarium by barge had been encountered during dry seasons, and these problems were alleviated by construction of the new plant. The Ministry of Health still operates this small (30 to 40 m3 jday) plant utilizing alum, prech1orination, and rapid sand filtration for treatment of Suriname River water. Pressure is developed through use of a hydrophor.
On only one occasion in the history of operation of the Groot Chati110n plant was the chloride level in the Suriname River of a sufficiently high level and for a sufficiently long period to be troublesome.
In both of the above treatment plants the relatively high color and organic level in the raw water does not seem to pose a problem.
A small rapid sand filtration plant is operated by one of the aluminum companies and utilizes Suriname River water with an intake at a point upstream from Paramaribo (approximately 88 km).
•
•
•

L
- 45
The possibility of utilizing slow-sand filtration for treating surface water was given consideration early in the life of the project. Because slow-sand filters are effective in removing organic substances and are efficient in retaining bacteria and suspended matter, it was felt that the surface water in Surinam would lend itself to this type of treatment.
The decision was based on the need to develop a system of water treatment which would satisfy the following conditions:
1. Economy of construction and operation 2. Requiring little skilled labor for design, construction, opera
tion, and maintenance 3. Strong, simple construction 4. Acceptability of final product
The advantages and disadvantages of slow-sand filters are listed in "Operation and Control of Water Treatment Process," by Charles R. Cox, WHO Monograph Series No. 49; as follows:
SLOW SAND FILTERS
The advantages of slow sand filters may be summarized as follows:
1. There is no need for coagulation facilities.
2. Equipment is simple and does not need to be imported.
3. Suitable sand is readily secured.
4. Supervision is simple.
5. The effluent is less corrosive and more uniform in quality than chemically treated waters.
6. They give effective bacterial removal.
The disadvantages as compared to rapid sand filters are as follows:
1. A large area is required, with correspondingly large structure and volume of sand and higher structural costs.
2. They have less flexibility in operation.
3. They are not economical with raw waters having turbidities over about 30 units for prolonged periods, unless preliminary plain sedimentation will secure such turbidities in the settled water.
4. They are less effective in removing color.
5. They give poor results with water of high algal content, unless pretreatment is practiced.

- 46 -
In view of the above disadvantages, it was decided to construct small, portable test filters which could be installed in several locations in Surinam in which the surface water exhibited different characteristics. Figure IV-4 shows the main features of the test filters. The vertical height of the test filter was determined in such a manner as to approximate the height of an actual slow sand filter. Shortcircuiting was countered by painting the inner surfaces of the test filter with INERTOL, and dusting the wet paint with sand in order to roughen the surface.
Tests were conducted at the following locations: ..
Brownsweg (van Blommenstein Meer) Uitkijk (Saramacca Canal) Saramacca Doorsteek (Saramacca Canal) Groot Chatillon (Suriname River) Blaka Watra (Suriname River)
was the
In all cases in which test runs were initiated, the length of run continued for a maximum of 10 days in order to aliow building-up of "Schmutzdecke" or biological layer.
•
A number of variables were introduced into the test program, including selecting filter sand from several different locations. This allowed variation of grain sizes and uniformity coefficients. Graphs showing typical sieve analyses are included as Figures IV-5 and IV-6. For one series of tests, a mixed-media in which fractured shells were present was utilized. For another series, activated charcoal was used in the filter media.
Because sufficient time and manpower were not available for an exhaustive and definitive test program, the program could not be extended over an unlimited period of time at each test of location, nor could an exact evaluation of all variables be made.
However, the following positive basic results were varying the media:
obtained by
1. Definite reduction in color level 2. Effective filtration of turbid waters 3. Satisfactory pH adjustment 4. Reduction in iron level 5. Reduction of bacteriological counts
It is of interest to note that, although it was not deemed necessary in the process, except as a precautionary measure if slow sand filtration is used in public water supplies, the subsequent chlorination of some of the samples of filtered water in which minimal color was still evident resulted in "bLeach Ing" of the color after a l5-minute retention period.
•
•
- 47
Further testing was conducted with a different type of installation . in order to determine the effect of algal growth resulting from the operation of filters exposed to sunlight vs. covered filters.
Two filters were constructed, both of 15 cm 0 pvc pipe and both containing 1.35 m of Coesewijne sand (see Figure IV-7). This sand has an effective diameter, dID' 10% passing, of 0.2 rom and a 90% passing diameter, d90' of 1.4 mm.
The average chemical analysis of the raw river water is shown on Table rv-rt ,
Although the "uncovered" filter (transparent cover) tended to produce shorter filter-runs due to fi1terbed clogging as a result of algae growth, a beneficial influence on effluent quality was indicated. This was attributed to increased oxygen production by the algae.
The raw water sampling site which was selected for this testing was deliberately chosen for its negative as~cts, particularly the variations in organic matter loading and sediment loading. Although an intake would not be installed at the sampling site, the test program indicated that the river water could be treated through slow sand filtration, utilizing pretreatment and postch1orination.
Reviewing the disadvantages of slQ!W sand filters which were listed earlier, the large areas of land required are readily available in Surinamj flexibility of operation would not be required since the raw water varies little in quality over long periods of time. When the intake is suffi- • cient1y far upstream, the turbidity and color of the raw water does not seem to pose a problem, and the algal content of raw water effects has no seeming detrimental effect.
In view of the encouraging results as demonstrated above, a slowsand filtration plant was installed as part of the Brownsweg water supply.
The incorporation of slow-sand filtration into major water supply systems in SUrinam will depend upon the continuing availability of ground water. Since it appears that supplying g~ound water to communities such as Kwatta-Leidingen and Pad van Wanica West will probably eventually constitute a "miningll operation, the need for utilizing surface water sources will occur in the distant future, but not within the master planning projection period.
FLUORIDATION
Following a PARO seminar in Puerto Rico in 1968, the Government of Surinam created a coomittee on fluoridation. The committee, composed of the Chief, Water Supplies Section, Ministry of Public Works; the Manager,
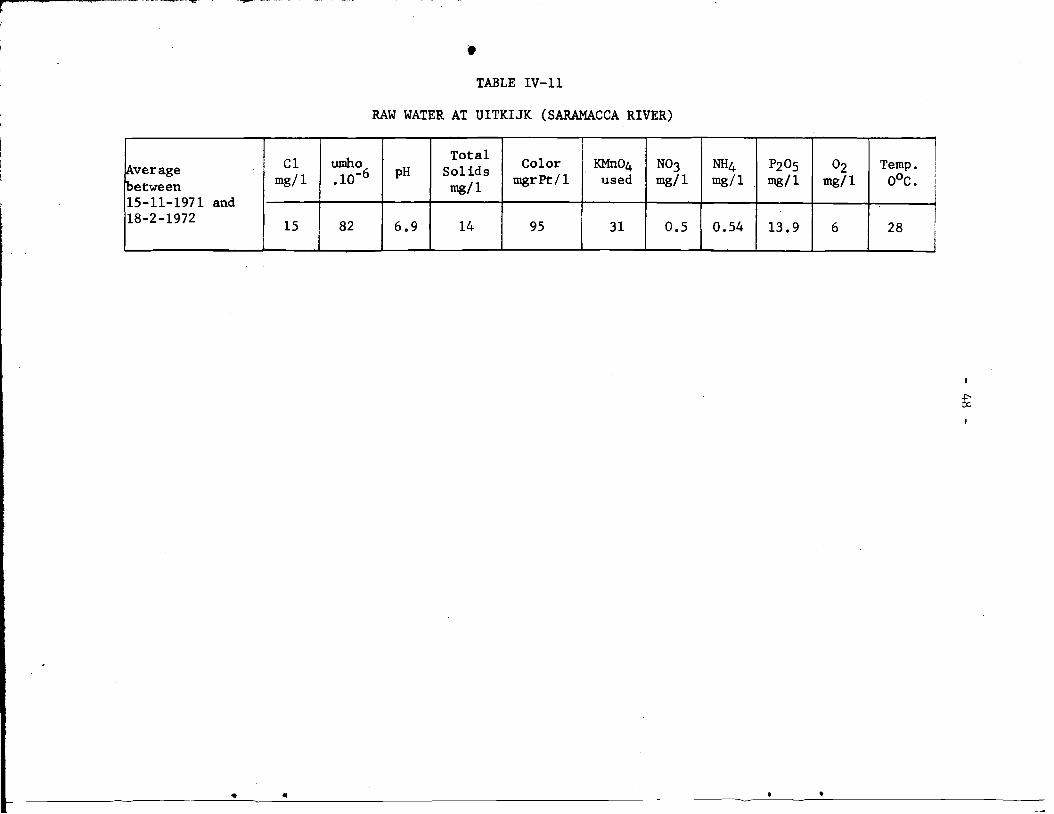
-- --~ -
• •
• TABLE IV-11
RAW WATER AT UITKIJK (SARAMACCA RIVER)
umhoC1!Average pH.10-6mg/1between 15-11-1971 and 18-2-1972 15 82 6.9
Total Solids mg/l
14
Color mgrPt/1
95
. KMn°4 used
31
N03 mg/l
0.5
NH4 rng/1
0.54
P205 mg/1
13 .9
Temp. li°2 OOC. Imgt1
I 28 l6
I
~ 0:
..
- 49
Surinam Water Company; and the Chief Dent ist of the Ministry of Health, was to advise the Government concerning the feasibility of fluoridation in the water supplies of Surinam. Circumstances seem to have developed which have impeded this function of the committee.
Although the study of fluoridation was not a defined task in this • project, close cooperation was provided by project staff during the visits
of two PARD consultants in fluoridation. Attention is drawn to the "Report on Fluoridation of Drinking Water in Urban and Rural Areas of Surinam," which was prepared by the consultants.
Fluoridation equipment was not included in the designs prepared in this project, since the Government is interested in first gaining experience with fluoridation in the smaller water supplies, which are to be built with UNICEF assistance. .
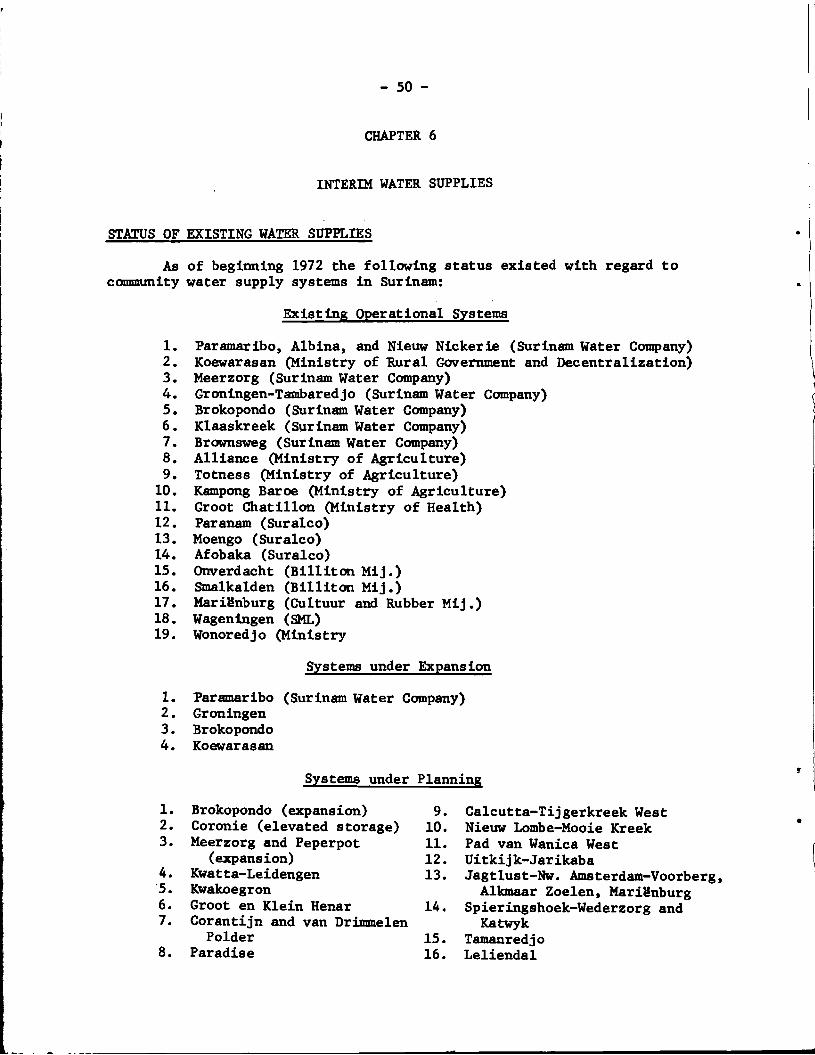
- 50
CHAPTER 6
INTERIM WATER SUPPLIES
STATUS OF EXISTING WATER SUPPLIES •
As of beginning 1972 the following status existed with regard to community water supply systems in Surinam: •
Existing Operational Systems
1. Paramaribo, Albina, and Nieuw Nickerie (Surinam Water Company) 2. Koewarasan (Ministry of Rural Government and Decentralization) 3. Meerzorg (Surinam Water Company) 4. Groningen-Tambaredjo (Surinam Water Company) 5. Brokopondo (Surinam Water Company) 6. Klaaskreek (Surinam Water Company) 7. Brownsweg (Surinam Water Company) 8. Alliance (Ministry of Agriculture) 9. Totness (Ministry of Agriculture)
10. Kampong Baroe (Ministry of Agriculture) 11. Groot Chatillon (Ministry of Health) 12. Paranam (Suralco) 13• Moengo (Suralco) 14. Afobaka (Sura1co) 15. Onverdacht (Bill iton Mij.) 16. Smalkalden (Billiton Mij.) 17. MarH!nburg (Cultuur and Rubber Mij.) 18. Wageningen (SML) 19. Wonoredjo (Ministry
Systems under Expansion
1. Paramaribo (Surinam Water Company) 2 • Groningen 3. Brokopondo 4. Koewarasan
Systems under Planning f
1. 2.
Brokopondo (expansion) Coronie (elevated storage)
9. 10.
Ca1cutta-Tijgerkreek West Nieuw Lombe-Mooie Kreek •
3. Meerzorg and Peperpot 11. Pad van Wanica West
4. .5. 6. 7.
8.
(expansion) Kwatta-Leidengen Kwakoegron Groot en Klein Henar Corantijn and van Drimme1en
Polder Paradise
12. 13.
14.
15. 16.
Uitkijk-Jarikaba Jagtlust-Nw. Amsterdam-Voorberg,
A1kmaar Zoe1en, Mari!nburg Spieringshoek-Wederzorg and
Katwyk Tamanredjo Le1ienda1

- 51
•
•
It was anticipated that, in addition to the above, the Supply Group I Systems would commence to be constructed as the final designs and financing would become available.
PRESENT STATUS OF SUPPLY GROUP I SYSTEMS
The original listing of communities in the Request and Plan of Operation for the UNDP(SF) Project delineated population groups according to existing built-up areas. Based on field experience, a regrouping of supply systems for these communities has been effected according to the following:
Interim (1987) Approximate ProgramSupply System Design Population
Kwatta-Leidingen 25,000 Pad van Wanica West 25,000 Commewijne 50,000
The design populations shown above indicate that, for Supply Group I areas, the systems will be relatively small; but, more important, the systems can be designed on the basis of populations in multiples of 25,000 persons. This, in turn, provides the opportunity to design the community water supply systems on the basis of basic standard design elements.
Further, standardization of treatment methods and operations provides flexibility and promotes efficiency, since operating personnel can be transferred easily from one plant to another, and interchangeability of equiPment allows reduced inventories of spares.
In major urban water supplies, of course, this approach is not easily implemented since each element of a large system presents unique and individual problems. The standardized approach also emphasizes the serious responsibility facing the designer, who cannot sacrifice good engineering judgement for the sake of standardization. Because the Interim Program will consist essentially of a number of similar systems, it follows that many design features will be repeated several times. In the selection of these design features, therefore, the designer must carefully select and compare in order to develop a design which accomplishes the planned objective at the least cost.
In the Supply Group I systems, the standardization is basically connected with the treatment plant elements, because the individual distribution systems tend to differ from each other.
Referring to the Supply Group I areas, the original grouping in Appendix I of the Plan of Operation listed (in addition to Kwatta-Leidingen) Mari~nburg, Tamanredjo, Nieuw Amsterdam and Voorburg, Spieringshoek, Jagtlust, Alkmaar, and Meerzorg. These latter have all been incorporated into

- 52
the Comnewijne supply Group. Houttuin is not being considered, since the area is very scarcely populated and shows little reason for further accelerated expansion during the master planning period. Uitkijk and Jarikaba are considered with the Kwatta-Leidingen Project. Koewarasan is an existing supply undergoing augmentat ion at present which will provide for the next 15 years of growth. Paranam and Onverdacht are "company towns" of the aluminum industries in Surinam, and, although the project staff has worked closely with the water utility and geology staff in the companies, it was made known that the water supply needs of these communities will be met by the aluminum companies themselves.
In the case of Pad van Wanica West, this represents a new population group which was somehow not included in the original request or Plan of Operation and is a relatively large geographical area of medium population concentration.
PRESENT STATUS OF SUPPLY GROUP II SYSTEMS
The communities listed under the Supply Group II designation consist of small semiurban or rural settlements, generally located in the coastal region. The supply systems for these communities are as follows:
InterUn (1987) Program Supply System Design Population
Groot en Klein Henar 6,300 La Vigilantia and Smalkalden 14,660 Paradise 15,190 Corantijn and van Drimmelen Polder 15,190 Calcutta and Tijgerkreek 7,050 Domburg 12,500
It is noted that, except in two cases, the design populations of the above systems can be regarded as multiples of approxUnately 7,000 persons. This, again, provides the designer with the opportunity to apply a standardized approach for the production elements of the systems.
None of the above communities has a piped water supply at present. However, these communities are included in a project which makes use of UNICEF assistance in construction. The UNDP(SF) Project provided the prelUninary engineering and feasibility studies required for securing the UNICEF assistance.
PRESENT STATUS OF SUPPLY GROUP III SYSTEMS
While there are a number of hand-dug wells in use, this group of small communities depends almost entirely upon the use of river water for
..
..
•
t

- 53
domestic needs. None of the Supply Group III communities have either treatment plants or distribution systems. Because surface water sources are utilized, the systems for these villages are included in the model or standard design which follow.
STANDARD DESIGN FOR SLOW SAND FILTRATION (see Figures IV-8, -9, and -10)
Applicability
to 1. As sole treatment of clear water from lakes.
2. When preceded by plain sedimentation as treatment of water with little turbidity from creeks and upland rivers.
3. When preceded by chemical coagulation and followed by chlorination as treatment of more turbid waters from lowland rivers.
Unfit when the raw water has a high turbidity, or when difficult to remove an excessively large amount of color of vegetable origin.
Design Criteria
Des ign rates:
Maximum daily to average daily consumption 1.4Maximum hourly to average hourly 1.8Maximum capacity to average daily 2.5Plant operating time 12 hours Storage as percentage of average daily consumption:
Ground level 50Elevated level 5.5 (or sufficient to
allow constant filtration rate during operation period)
Maximum allowable filtration rate 0.25 m/hourMinimum size filtering unit 210 mMinimum pipe size 2"
Raw water sup~ly by perforated pipe, outflow resistance maximum 0.45 m, + l.m above maxunum wate level settled water discharge via opening 0 8 m
• w~dth, 3r 'discharge 3.8 m /m2/hr. •
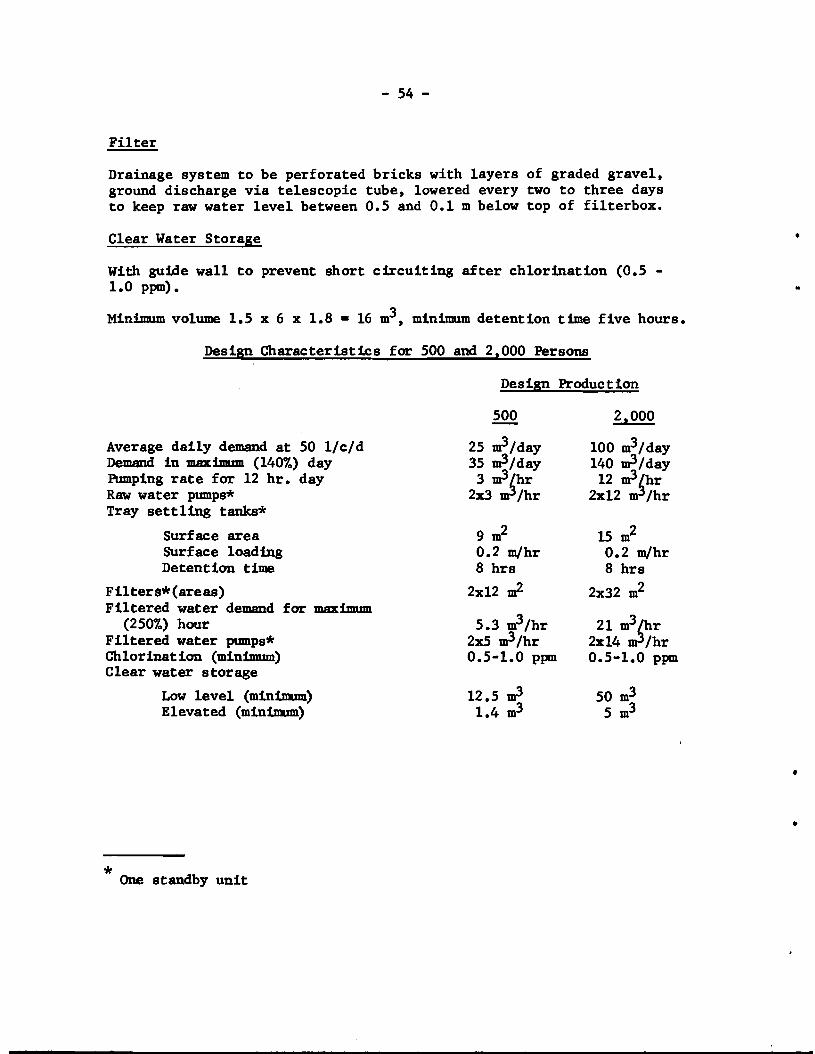
- 54
Filter
Drainage system to be perforated bricks with layers of graded gravel, ground discharge via telescopic tube, lowered every two to three days to keep raw water level between 0.5 and 0.1 m below top of filterbox.
..Clear Water Storage
With guide wall to prevent short circuiting after chlorination (0.5 1.0 ppm). .. Minimum volume 1.5 x 6 x 1.8 .. 16 m3, minimum detention time five hours.
Design Characteristics for 500 and 2,000 Persons
Design Production
Average daily demand at 50 l/c/d Demand in maximum (140%) day Pumping rate for 12 hr. day Raw water pumps* Tray settling tanks*
Surface area Surface loading Detention time
Filters*(areas) Filtered water demand for maximum
(250%) hour Filtered water pumps* Chlorinat ion (minimum) Clear water storage
Low level (miniDlJm) Elevated (miniDlJm)
* One standby unit
500
25 m3/day 35 m3/day
3 ~hr 2x3 /hr
9 m2
0.2 m/hr 8 hra
2x12 TIl3/hr5.3 m
2x5 m3/hr 0.5-1.0 ppm
312.5 m31.4 m
2,000
100 m3/day 140 m3/day 12 m3~hr
2x12 m /hr
15 m2 0.2 m/hr 8 hrs
2x32 m2
21 m:Jhr 2x14 /hr 0.5-1.0 ppm
50 m3 5 m3
•
•

- 55
CHAPTER 7
RECOMMENDED WATER SUPPLIES PROGRAM
• MASTER PLAN 1972-2000
The development of water supply systems for all Supply Group areas through the Interim Planning Period (1972-1987) has been described in general terms in an earlier section. In evolving the master plan the investigation of the needs for water supply systems was conducted in the context of meeting those needs through preliminary identification of optimum plans and organizations.
Scope
The master plan for the provision of water supplies covers the specific time period from 1972 through 2000 and, in the case of Supply Group I systems, covers specific areas.
In developing the master plan, constraining or governing factors which affected long-term programming had to be kept in view. For example, the proposed formation of the water authority did not occur, and the responsibility for municipal supplies continued to be vested in the Surinam Water Company, while the administration of rural water supplies remained with the Ministry of Rural Government and Decentralization.
The financial requirements for the master plan program required a special approach because of the existing governmental structure of the Kingdom of the Netherlands. Thus, the sources of financial assistance were the Netherlands Five-Year Plan, European Economic Community, UNICEF grants, and the Surinam Government budget.
In addition to the governmental and financial aspects of master planning, the relationships between the provision of water supplies and other high priority essentials had to be taken into account since these amenities all affect the social and cultural life of the people.
PRIORITY LISTING OF WATER SUPPLIES
The master plan for the construction of water and sewerage systems in Surinam has been prepared in accordance with an estimate of the relative urgency of need for the proposed systems, taking into account the earlier preliminary planning which has been executed in the UNDP/SF project consistent with the Government's definition of immediate priorities.
The relative priorities established in the Group I water systems are as follows:

- 56
1. Kwatta-Leidingen with Uitkijk and Jarikaba 2. La Vigilantia and Smalkalden 3. Pad van Wanica West 4. Commewijne area, consisting of Meerzorg, Jagtlust, Lust and Rust,
Belwaarde, Voorburg, Nieuw Amsterdam, Zoelen, Mari!nburg, Leliendal, Spieringshoek, Wederzorg, Katwijk, Tamanredjo, and Alkmaar
5. Domburg
The relative priorities established for the Group II water systems are as follows:
1. Nieuw Lombe and Moeje Kreek 2. Groot en Klein Henar 3. Paradise 4. Corantijn and van Drimmelen Polders 5. Calcutta and Tijgerkreek
The water supply systems of Paranam, Moengo, and Onverdacht will be expanded as required by the aluminum industries responsible.
Because of the problem of intermittent supply, the plans for the system of Brownsweg were designed changing the source from Macami Creek to van Blommensteinmeer to reduce the length of the supply main from 7 to 2 km and provide continuous service. The plant design consisted of slow sand filtration and chlorination with gravity flow to existing storage. The treatment plant and supply main construction have been completed. The cost of the completed project was Sf.50,000.
Designs were also completed for the Group II system for Nieuw Lomb~ and Moeje Kreek and construction of this project is also under way. The cost estimate for this project is Sf.40,000.
The Group I system for La Vigilantia was also designed and a product ion well located and drilled about 1 km south of the cODlllUnity to be served. The cost estimate for this project due to the distance of the supply main is Sf.300,000.
In all priority listings it is fully realized that changing conditions, new developments, the location of industrial sites, or housing construction can radically change the relative need for water supply. Therefore, all priority listings should be reviewed annually to determine if the previously planned program is still valid.
DESCRIPTION OF FACILITIES
Group I
The Group I projects as designed under the UNDP/SF program consist of the following elements:
..
,
•

- 57
KWatta-Leidingen System
The final design (see Plan IV-1) for this area consists of a well supply, aeration, sand filtration ground, clear water storage, and ele
3/day for 1987 withvated storage. The designed capacity is for 2,250 mexpansion to 4,450 m3/day for the year 2000. This plant is now under construction.
The distribution system plan calls for the installation of 74 km of line for 1987 and an additional 24.6 km by the year 2000. The plan provides for the eventual supply to Uitkijk and Jarikaba. The Uitkijk• supply will require 6.4 km of main by 1987 with the replacement of 3 km of 4" with 6" main by the year 2000.
Details of the estimate for construction costs are as follows:
Kwatta-Leidingen Treatment Plant and Distribution System
Well Supply /1987/
1. Treatment plant, including reservoirs, pump station (no standby power at site) 400,000
2. Distribution system, including house connections 800,000
Subtotal Sf. 1,200,000
3. Pump station, reservoir, Uitkijk-Jarikaba (no standby power at site) 62,000
4. Distribution system, including house connections (only Uitkijk) 90,000
5. Main to serve Jarikaba project from pump station (distribution system will be installed by others) 40,000
Total for year 1987 Sf. 1,392,000
1. Expansion of eXisting facilities treatment plant, including diesel generator for standby power Sf. 345,000
2. Distribution system, including house connections 590,000
3. Expansion of existing pump station Uitkijk, Jarikaba 20,000
4. Distribution system, including house connections (Uitkijk only) 40,000
Total added for year 2000 Sf. 995,000
N.B. All construction costs based on 1972 unit cost prices.

- 58
Pad van Wanica System
The plans for the Pad van Wanica system (see Plan IV-2) are much the same as previously noted for the KWatta-Leidingen project with treatment plant and well located on Helena Christina Weg. The plant is designed to produce 2,250 m3/ day for the period to 1987, with expansion to 4,450 rrr3/day by the year 2000.
The distribution system plans call for the installation of 130 Ion of main for the period to 1987 with an additional 31.5 Ion for the year 2000. •
Details of the estimate for construction costs are as follows:
Pad van Wan1ca Treatment Plant and Distribution System
Well Supply /1987/
1. Treatment plant, including reservoirs, pump station, with portable diesel generator to also serve K-L project Sf. 480,000
2. Distribution system, including house connections 1,720,000
Total for year 1987 Sf. 2,200,000
1. Expansion of existing facilities treatment plant Sf. 345,000
2. Distribution system, including house connections 540,000
Total for year 2000 Sf. 885,000
N.B. All costs are based on 1972 unit cost prices.
Commewijne System
The population of this area is scattered in small communities over a wide territory mainly along the east bank of the Suriname River from Meerzorg to Nieuw Amsterdam and along the south bank of the Coumewijne River upstream from Spieringshoek. A scattered population along the East-West Highway has its greatest concentration at Tamanredjo. •
Presently a small distribution system supplied by a well provides water to a small part of the Meerzorg area. The demand for water in the • Meerzorg-Peperpot area is estimated to be 1,500 m3/day by 1987. For the
3/day.entire Commewijne area the requirements for 1987 are 5,000 m

- 59
With the exception of the limited supply at Meerzorg no other satisfactory ground water was found in the Commewijne area. As a result three studies of alternate sources were made.
First a ground water source was considered east of the Commewijne supply area. The ground water along the East-West Highway at Orleana Kreek was found to be unsatisfactory. The Zanderij aquifer southward was at least 15 km south of the East-West Highway across intervening swampy terrain with no communication. The ground water at Morico Creek west of the Commewijne River was found to be suitable; thus, the first design (see Plan IV-3) was based on that source and the costs are estimated as follows:
1987 2000
Treatment plant, including standby power Sf. 950,000 500,000
Supply line to Commewijne area 278,000 893,000
Booster station for supply line 162,000 90,000
Distribution system, connections
including house 2,655,000 1,120,000
Meerzorg booster station and reservoirs, including standby power 160,000 106,000
Marienburg booster station and reservoirincluding standby power
s, 182,000 50,000
Belwaarde booster station, including standby power 235,000
Alkmaar booster station, including standby power 237,000
8f.1,387,000 3,231,000
The second study (see Plans IV-4 to -9) was based on a ground water supply found to be available at Rijsdijkweg (see Volume III for details). This plan required a treatment plant and long supply main, including a crossing of the Suriname River. The cost estimates for this proposal are as follows:
1987 2000
Well supply and treatment plant Sf. 1,667,000 970,000
Diesel generators (if no other power available) 100,000 50,000

- 60
Main supply line
River crossing
Booster station at Leiding 9A
Distribution system, Commewijne area, including house connections
4,215,000
185,000
150,000
•2,165,000 275,000
Sf. 8,332,000 1,445,000 •
The third study considered the use of surface water from the Saramacca River at Santigron. This approach (see Plans IV-10 to -14) also required a treatment plant, long supply lines, and a crossing of the Suriname River. The estimates for -this proposal are as follows:
Treatment plant
If no regular power supply add generator (also standby)
Main supply line
River crossing
Booster station at Leiding 9A
Distribution system, Commewijne including house connections
With the relatively high costs
1987 2000
Sf. 1,000,000 515,000
100,000 50,000
3,315,000
185,000
150,000
area, 2,165,000 275,000
Sf. 6,765,000 990,000
involved in all three of the studies, consideration was given to the use of the somewhat limited supply at Meerzorg.
The hydrogeological studies (see Volume III) indicated the availability of 10 million m3 of fresh water from this source which at 1987 consumption rates would be sufficient for Meerzorg for 20 years (average 0.56 million m3/year) or to supply Meerzorg, Lust and Rust, Be1waarde, Nieuw Amsterdam, Voorburg, Marilnburg, Tamanredjo, Le1ienda1, and Zoe1en for 10 years (average 1.4 million m3/year). •
The cost estimates for the use of this source for Meerzorg are as follows:

; 4;
- 61
1987 2000
L Treatment p1.ant, inc1ud ing pumps, ground and elevated storage Sf. 345,000
1972 expansion 90,000
Distribution system 94,700 26,175
House connections 26,175 175,000
sf. 555,875 201,175
In order to expand the system to supply the area north of Meerzorg to Nieuw Amsterdam and Zoelen the following estimated additional costs are required:
!2.§1. 2000
2. Meerzorg-Zoe1en transmiss ion main Sf. 586,300
Sf. 586,300
a) Lust and Rust distribution system 17,250 House connections 4,300 6,000
Sf. 21,550 6,000
b) Be1waarde distribution system 18,000 House connections 8,000
Sf. 8,000 18,000
c) Voorburg distribution system House connections 15,000 23,000
Sf. 15,000 23,000
d) Nieuw Amsterdam distribution system 55,950 2,185
• House connections 14,000 85,000
Sf. 69,950 87,185 .. e) Zoe1en distribution system
House connections 28,000 104,000
Sf. 28,000 104,000

.; 62
1987 2000
3. Zoe1en-Mari~nburg transmission main Sf. 59,500
Sf. 59,500
a) Marienburg distribution system 20,075 15,345 Mari~nburg house connections 6,450 143,000
• Sf. 26,525 158,345
4. Mari~nburg-Leliendal transmission main Sf. 123,750
Sf. 123,750
a) Le1ienda1 distribution system 5,900 House connections 1,480 10,000
Sf. 7,380 10,000
5. Le1ienda1-Spieringshoek transmission main Sf. 85,000
Sf. 85,000
a) Katwijk distribution system 14,000 House connections 20,000 5,000
Sf. 34,000 5,000
b) Wederzorg distribution system 14,325 House connections 6,000 5,000
Sf. 20,325 5,000
c) Spieringshoek distribution system House connections 5,000 5,000
.. Sf. 5,000 5,000
Expa~sion of the system eastward along the East-West Highway would require the following incremental expenditures: ..
1987 2000
6. Meerzorg-Tamanredjo transmission main Sf. 184,800
Sf. 184,800

- 63
1987 2000
a) Tamanredjo distribution system Sf. 22,300 28,850 House connections 6,076 64,000
Sf. 28,376 92,850
The final construction required to complete the master plan provides for transmission mains and house connections with the following estimated costs:
1987 2000
7. Tamanredjo-A1kmaar transmission main Sf. 120,000
a) Alkmaar distribution system 100,000 House connections 30,000
Sf. 250,000
8. Be1waarde-A1kmaar transmission main Sf. 160,000
At that point where the total water withdrawn from the Meerzorg wells results in production of a water of unacceptable quality it will be necessary to make use of one of the more distant supplies. As a first step it would be possible to expand the Kwatta-Leidingen plant and provide for transmission mains to the Commewijne area with the following estimated coats r
1987 2000
Expansion of Kwatta-Leidingen treatment plant Sf. 950,000
Transmission main to river 1,705,000
River crossing 185,000
Booster station at river crossing 330,000
Convert Meerzorg plant to booster station 30,000 65,000
.. Sf • 2,870,000 395,000
When the expansion at the Kwatta-Leidingen plant becomes insuffi cient to meet the needs of the Commewijne area, implementation of a new supply will be required with the following estimated costs:

- 64
Alternate I
Convert part of Kwatta-Leidengen plant to booster station
Santigron transmission main to Kwatta booster station
Santigron surface water treatment plant
Alternate II
Convert part of Kwatta-Leidengen plant to booster station
Rijsdijkweg transmission main to Kwatta booster station
Treatment plant for ground water at
Total
Sf.
Sf.
50,000
1,610,000
1,810,000
3,470,000
•
Sf. 50,000
2,510,000
Rijsdijkweg
A summary of the estimated costs listed as follows:
1. Meerzorg
2. Meerzorg Zoe1en
a. Lust and Rust b. Be1waarde c. Voorburg d. Nieuw Amsterdam e. Zoe1en
Subtotal Sf. 1,284,675 439,360
1,767,000
Total Sf. 4,327,000
for the Commewijne system is
1987 2000
sf. 555,875 201,175
586,300
21,550 6,000 8,000 18,000
15,000 23,000 69,950 87,185 28,000 104,000
•
3. Zoe1en-Mari~nburg transmission main Sf.
a. Mari~nburg distribution system, including house connections
59,500 •
26,525 158,345
Subtotal Sf. 1,370,700 597,705
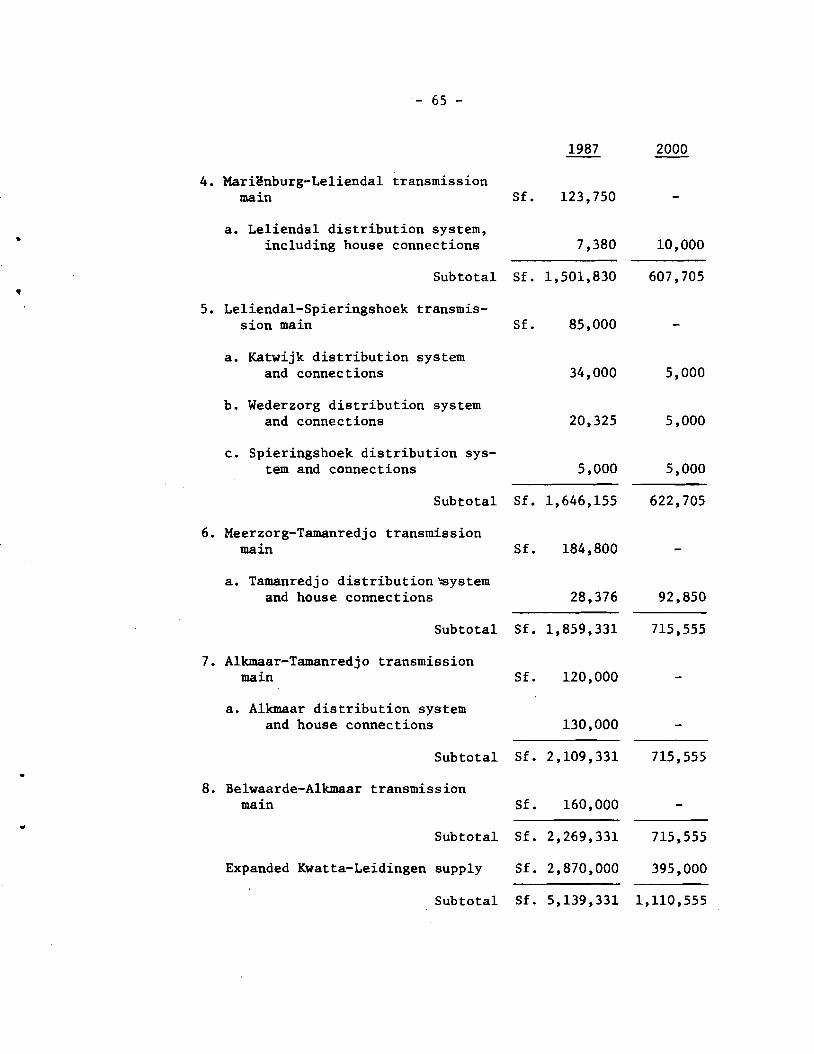
- 65
1987 2000
4. Marienburg-Le1ienda1 transmission main Sf. 123,750
a • Le1ienda1 distribution system,• including house connections 7,380 10,000
Subtotal Sf. 1,501,830 607,705
" 5. Le1ienda1-Spieringshoek transmission main Sf. 85,000
a. Katwijk distribution system and connections 34,000 5,000
b. Wederzorg distribution system and connections 20,325 5,000
c. Spieringshoek distribution system and connections 5,000 5,000
Subtotal Sf. 1,646,155 622,705
6. Meerzorg-Tamanredjo transmission main Sf. 184,800
a. Tamanredjo distribution~ystem
and house connections 28,376 92,850
Subtotal Sf. 1,859,331 715,555
7. A1kmaar-Tamanredjo transmission main Sf. 120,000
a. A1kmaar distribution system and house connections 130,000
Subtotal Sf. 2,109,331 715,555
8. Be1waarde-A1kmaar transmission main Sf. 160,000
.. Subtotal Sf. 2,269,331 715,555
Expanded Kwatta-Leidingen supply Sf. 2,870,000 395,000
Subtotal Sf. 5,139,331 1,110,555

- 66 -
The final move toward the basic and long-term supply, with consideration of the operating costs noted in the next paragraph, will require construction of one of the two alternatives previously noted.
2000
Alternate 1 - Surface water Santigron Sf. 3,470,000 Alternate 2 Ground water from Rijsdijkweg 4,327,000
Detailed studies for the unit costs of producing water from both surface and ground water sources were made. The results of this work indicated that the relative costs were as follows:
Cost per m3
Ground water Surface water
To 1987---Sf. 0.07
0.15
To 2000
0.085 0.165
The comparison is also noted in Figures IV-II, -12, and -13.
The conclusions reached as a result of the studies noted above are that the Meerzorg supply should be used as long as it is available; that reservoirs, distribution and supply mains be installed as shown on the master plan; and that when required the more distant supplies be developed in the most economical manner available at that time, consistent with general development of the area.
Present calculations indicate that the additional capital costs of ground water treatment would be amQrtized in approximately 10 years by the savings in operating costs noted for ground water as compared with operating costs for surface water production.
The use of treatment plants to produce fresh water from brackish water has not been considered in this report because of the high cost involved with the present state of technical development.
However, there are many countries with the same problems of brackish underground supplies as are found in Surinam which are conducting substantial research programs to improve the treatment processes and reduce operating costs. It is possible that by the time that the Meerzorg supply is exhausted, treatment of the brackish water may provide an economic alternative to the long transmission mains and river crossing noted in the Master Plan. Future technical developments in the field of membrane filter treatment or any other method of treating brackish water should be closely followed.
Group II
The Group II systems with partial financing awarded by UNICEF have been designed (see Plan IV-IS) and estimated as follows:
•
•
•
•
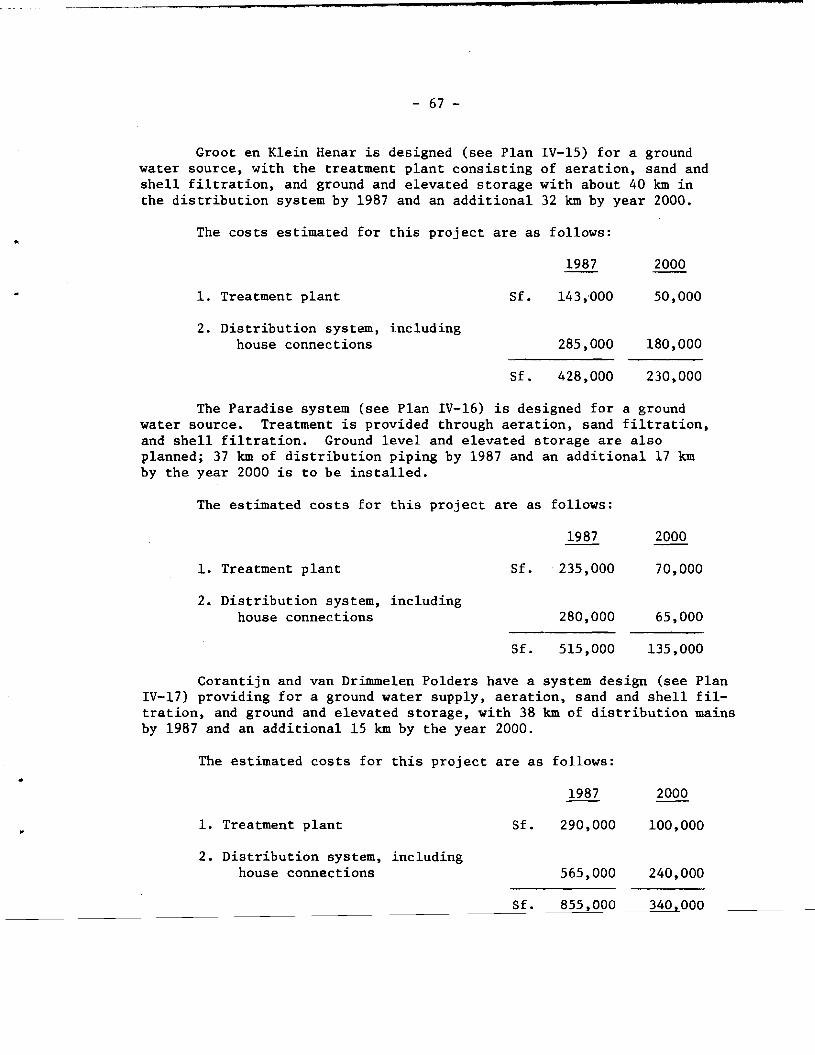
•-------~_._------------------------------
- 67
Groot en Klein Henar is designed (see Plan IV-IS) for a ground water source. with the treatment plant consisting of aeration. sand and shell filtration. and ground and elevated storage with about 40 km in the distribution system by 1987 and an additional 32 km by year 2000.
The costs estimated for this project are as follows:
1987 2000
1. Treatment plant Sf. 143.000 50.000
2. Distribution system, including house connections 285.000 180.000
Sf. 428.000 230.000
The Paradise system (see Plan IV-16) is designed for a ground water source. Treatment is provided through aeration, sand filtration. and shell filtration. Ground level and elevated storage are also planned; 37 km of distribution piping by 1987 and an additional 17 km by the year 2000 is to be installed.
The estimated costs for this project are as follows:
1987 2000
1. Treatment plant Sf. . 235.000 70.000
2. Distribution system. including house connections 280.000 65.000
Sf. 515.000 135.000
Corantijn and van Drimmelen Polders have a system design (see Plan IV-17) providing for a ground water supply. aeration. sand and shell fil tration. and ground and elevated storage. with 38 km of distribution mains by 1987 and an additional 15 km by the year 2000.
The estimated costs for this project are as follows:
1987 2000
1. Treatment plant Sf. 290.000 100,000
2. Distribution system. including house connections 565.000 240,000
Sf. 855.000 340,000

- 68 -
The Calcutta and Tijgerkreek system is also designed (see Plan IV-18) for ground ~ater with aeration, sand and shell filtration, and ground and elevated storage, with 13 km of distribution piping required by 1987 and an additional 12 km by year 2000.
The estimated costs for this project are as follows: ..
1987 2000
1. Treatment plant Sf. 145,000 50,000
2. Distribution system, house connections
including 197,000 65,000
Sf. 342,000 115,000
PHASED DEVELOPMENT
As the Master Plan for water supply has a total cost which, from the standpoint of national priorities and available capital funds, must of necessity be spread out over a long period of time, the following phased development is proposed. The sums ind i.cated are based on a continuation of the Netherlands Five-Year Plan support at the same level as in the present five-year plan, with sufficient help from UNICEF and the Government to provide a total of Sf. 5 million for each five-year period from 1976 to 1987. Since the installation of piped water will make the collection and treatment of sanitary wastes even more pressing from the health standpoint, additional funds have been indicated as needed for the development of sanitary sewers or clustered septic tanks for waste disposal at approximately the same level as for water supply construct ion 0
Construction Program
Phase Period Water Supplies Sewerage
Interim Ultimate
1972-1987 1987-2000
Sf. 16.8 million 14.0 million
Sf. 11.7 mill ion 12.8 mill ion
Totals Sf. 30.8 million Sf. 24.5 million •
Interim Phase 1972-1987
This phase contains works for which detailed construction plans have been prepared, or will be in an advanced planning stage, as a result of the UNDP(SF) project. The projects with estimated costs are as follows:

- 69
Group I
1972-3 Kwatta-Leidingen, and Jarikaba
including Uitkijk Sf. 1.400 million
•
1974
1974
La Vigilantia-Smalkalden
Pad van Wanica West
.300 million
2.300 million
• 1977 Domburg .500 million
1975-1987 Commewijne system, including Kwatta supply 5.000 million
Group II
1972-3 New Lambe and Mooie Kreek .040 million
1973 Groot en Klein Henar .430 million
1974 Paradise .520 million
1975-76 Corantijn and van Drimmelen Polder .860 million
1976-77 Calcutta and Tijgerkreek .350 million
Additional systems with UNICEF assistance 2.600 million
Estimate for expansions of existing systems 15 years x Sf. 0.16 million (approximately) per year 2.500 million
Sf. 16.800 million
Project's new part of the Master Plan with estimated expansion costs through the year 2000 (ultimate phase).
Kwatta-Leidingen Sf. 1. 000 mi11ion Pad van Wanica .900 million Commewijne (Alt. II) 5.500 million Groot en Klein Henar .300 million
• Paradise .200 million Corantijn and van Drimmelen Polder .400 million Calcutta and Tijgerkreek .200 million
Master Plan total Sf. 8.500 million
Master Plan construction 8.500 million Construction Group III system 3.000 million Existing plant expansion 2.500 million
Sf. 14.000 million

- 70
CAPITAL FINANCING
As has been previously noted, the sources of financial assistance are the Netherlands Five-Year Plan, European Economic Community, UNICEF grants, and the Surinam Government budget.
To cover interim phase projects, the sum of Sf.1.2 million has been made available from the first Five-Year Plan 1966-1971 for the Kwatta-Leidingen Project.
From the second Five-Year Plan (1972-1976) the sums of Sf.4.5 million for water supply and 8f.1.7 million for sewerage installations have been made available.
•
•
The UNICEF grants have allocated a total of 8f.420,000 ($238,000) for the purchase of materials for Group II projects, and the Surinam Government has allotted Sf.700,000 for labor and materials not covered by the UNICEF grants.
Thus, the total funds now allotted for interim phase construction are as follows:
1966-1971 Five-Year Plan 1972-1976 Five-Year Plan UNICEF Surinam
Sf. 1.20 million 4.50 million
.42 million
.70 million
Total Sf. 6.82 million
On the basis of funds allotted for the first five years of the interim phase, the following construction is proposed:
Kwatta-Leidingen Pad van Wanica West Uitkijk Commewijne (partial) Groot en Klein Henar (partial) Paradise Corantijn and van Dri.mme1en Polder Ca1cutta-Tijgerkreek La Vigilant ia Completion of Corantijn and van Drimme1en
Polder system
Sf. 1.20 million 2.20 mill ion
.20 million 1.40 mi11ion
.21 million
.25 million
.46 million
.20 million
.30 million
.40 million
Sf. 6.82 million
•

• • 4.J MP
- 71
CRAPI'ER 8
SEWERAGE - GENERAL CONSIDERATIONS
• INTRODUCTION
In Part III of this report, the results of detailed investigations are presented in problems involving the provision of adequate potable water supplies. However, to maintain adequate standards of public health, emphasis should be placed not only upon providing readily available suitable water supplies but also upon the removal of waste waters, largely in the form of domestic sewage and industrial liquid wastes, from populated areas and upon u1t imate disposal by sanitary means. The removal of storm waters from populated areas is also an important requirement, especially under conditions prevailing throughout the Surinam coastal areas, where drainage by natural means is difficult because of the flat terrain.
In pursuance of the overriding objectives of improving environmental sanitary conditions throughout the project area, preliminary investigations have been made into the existing situation with regard to sewerage. Basic data and design criteria for sewerage have been developed within the frame of reference of the population estimates and water supply proposals previously presented.
EXISTING FACILITIES
Within the project area, with the exception of Paramaribo and the private systems in Moengo and Paranam, there is no sanitary sewerage system in operation. The Paramaribo system, in itself, does not constitute a sanitary sewage collection and treatment facility, in that the waste water collected is the effluent from septic tanks rather than raw sewage. A combined system, carrying this effluent as well as storm drainage, transports the waste water to outfall pumping stations for disposal in the Suriname River (see Figure IV-l4). This system has grown with the growth of the city, and because of this it reflects some hydraulic inadequacies.
As Paramaribo continues to expand, the existing combined sewers are sometimes limited in capacity and surcharging results. Further, some of the lines have a definite need for structural rehabilitation.
The use of open canals also creates a problem in that most are hydraulically inefftcient and subject to rapid weed growth, and because of this (together with trash dumping in the canals) serious sanitation problems are created.
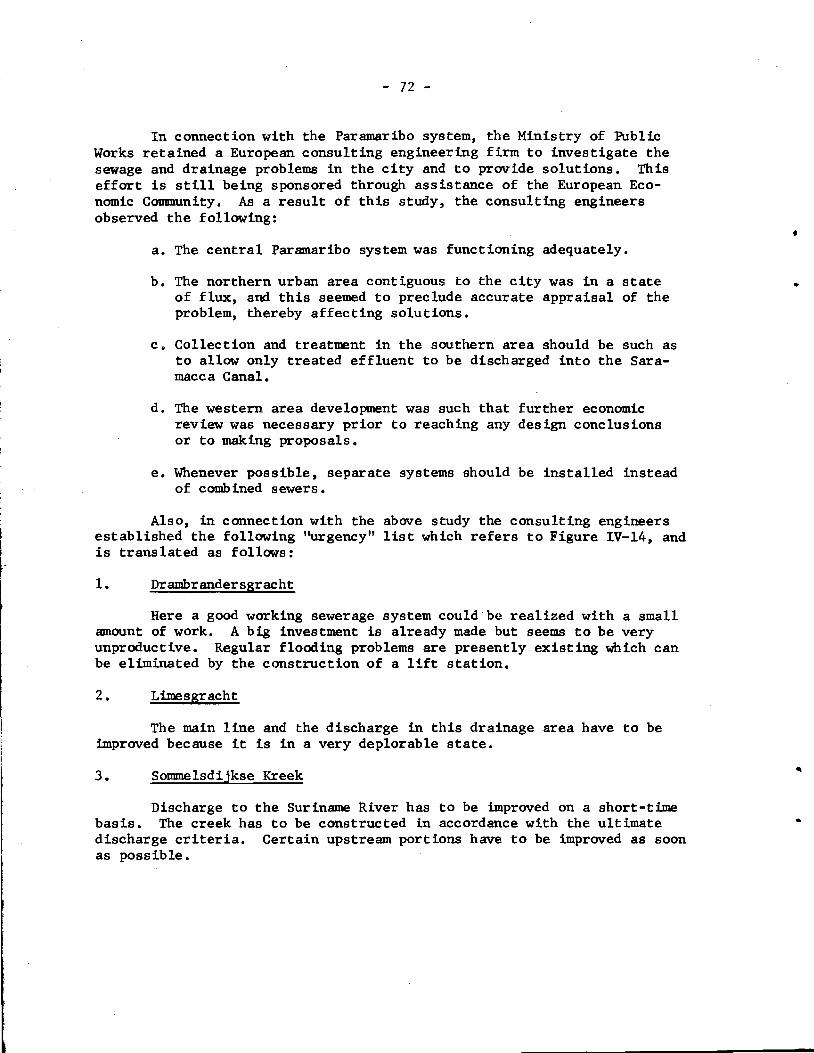
- 72
In connection with the Paramaribo system, the Ministry of Public Works retained a European consulting engineering f:lrm to investigate the sewage and drainage problems in the city and to provide solutions. This effort is still being sponsored through assistance of the European Economic Community. A£. a result of this study, the consulting engineers observed the following:
• a. The central Paramaribo system was functioning adequately.
b. The northern urban area contiguous to the city was in a state • of flux, and this seemed to preclude accurate appraisal of the problem, thereby affecting solutions.
c. Collection and treatment in the southern area should be such as to allow only treated effluent to be discharged into the Saramacca Canal.
d. The western area development was such that further economic review was necessary prior to reaching any design conclusions or to making proposals.
e. Whenever possible, separate systems should be installed instead of combined sewers.
Also, in connection with the above study the consulting engineers established the following "urgency" list which refers to Figure IV-14, and is translated as follows:
1. Drambrandersgracht
Here a good working sewerage system could be realized with a small . amount of work. A big investment is already made but seems to be very unproductive. Regular flooding problems are presently existing which can be eliminated by the construction of a lift station.
2. Limesgracht
The main line and the discharge in this drainage area have to be improved because it is in a very deplorable state.
3. Somme1sdijkse Kreek
Discharge to the Suriname River has to be improved on a short-time basis. The creek has to be constructed in accordance with the ultimate discharge criteria. Certain upstream portions have to be improved as soon as possible.

- 73
4. Overeemkanaal. Zonnebloemkanaal. and Cottica (Flora) Canal
The improvement of these canals is urgent. The improvement of the water quality of these canals by treatment is necessary for hygienic reasons.
• 5. Calcutta Kanaal
A bad discharge resulting in poor hygienic conditions is presently existing. A well designed sewer system has to be planned for this area.
6. Knuffelsgracht
Enclosing of the Picorni and Viotte Creeks is very much desired.
7. Steenbakkersgracht
Enclosing is desired.
8. In the remaining areas the urgency is less acute due to the lesser population density.
The above-mentioned list of projects is given in the order of degree of urgency. We would like to mention the following differences between the grades of urgency.
Point 1 is certainly the most urgent; points 2 through 5 are all very urgent; the remaining points are less urgent.
Future studies will indicate in accordance with which principles the improvement program is to be realized. At the same time a cost price calculation for all the construction projects will be estimated.
In addition to the above study, the consulting engineers proposed a sanitary sewage treatment plant on the Flora Canal for which a preliminary design was provided to the Goverl'Ullent. This advanced secondary treatment plant was designed for an initial population of 10,000 persons with expansion to 30,000 suggested by the consultants. Industrial waste treatment was not included in the plant capability •
• The Government is considering its own alternate design for the Flora Project at present. This design would utilize oxidation ditches with sludge disposal.
The UNDP Preparatory Assistance Mission report recommended that the urban areas contiguous to Paramaribo which were to be included in the detailed designs included in the UNDP(SF) Project would be "only those sewerage systems that will be directly connected to the projected Paramaribo city system (now under investigation by the Government consulting

- 74
•
eng Ineers) ;" It appears that this assumption was optimistic since there are no plans or designs (in preliminary or final stages) for the Paramaribo municipal system nor will any be forthcoming during the life of the UNDP(SF) Project. The unfortunate result of this situation is that the suburban systems will have to be designed independent of any potential connections to a larger urban system.
The only community system in Surinam which collects and treats domestic waste through a piped collection system and a secondary treatment (activated sludge) plant is the small IIVia Bel La" system, which is operated in a small residential subdivision in Paramaribo by Suralco. This system handles the waste water of approximately 50 houses.
At the Santo Boma prison, septic tank effluent is collected and ponded in a series of lagoons which provide approximately 90 days retention (see Figure IV-IS). After post-chlorination the effluent is disposed of in open drainage ditches. A total population of approximately 500 inmates and personnel is served by this system, which is unique in Surinam.
PRESENT METHODS OF DOMESTIC WASTE DISPOSAL
As stated previously, the sanitary sewage treatment in most of the populated areas is effected through the use of septic tanks and effluent collection. In those areas where no piped system exists, the septic tank effluent is discharged into seepage areas or into drainage ditches. During dry seasons, with no storm flows, the total discharge of some of-these ditches is partially treated or untreated sewage.
Ditch systems are generally installed at flat grades and at only a slightly lower elevation than the surrounding terrain. Installation of culverts is not controlled as far as invert elevations are concerned. This, together with debris accumulation and encroachment, creates conditions in which sewage collects and stagnates, frequently becoming septic.
Conversely, during the rainy seasons, the overflows which result from the lack of hydraulic capacity spread heavily polluted water. This is further aggravated by tide-locking of the channels at certain periods.
Obviously, the above conditions create severe health hazards and point up the need for immediate consideration of improvements to the sewer and storm drain systems in order to remove sewage and storm waters frOOl the populated areas.
There is less urgency with regard to sewage treatment. The condition of the Lower Suriname River is such that the disposal of untreated sewage into it in the immediate future should not create hazards to public health.
•
•
•
-

• • •• • • , .. _--~---".--------~_._-----..,..~----------------------"""'-----------
- 75
In the more rural areas and in some built-up areas, pit latrines are used almost exclusively, except when no facilities at all are provided. Occasionally a septic tank is installed, particularly when a larger residence is constructed. In these cases, the installations also generally include seepage areas or drain fields.
• Little regard is given to the sanitary requirements of the latrines. The World Health Organization, in its Monograph series No. 39, "Excreta Disposal for Rural Areas and Small Communities, II by Wagner and Lanoix, recoJIDIlends construction of pit latrines in rural areas, but only if they satisfy the following seven requirements:
a. The surface soil should not be contaminated.
b. There should be no contamination of ground water that may enter springs or wells.
c. There should be no contamination of surface water.
d. Excreta should not be accessible to flies or animals.
e. There should be no handling of fresh excreta; or, when this is unavoidable, it should be kept to a strict minimum.
f. There should be freedom from odors or unsightly conditions.
g. The method used should be simple and inexpensive in construction and operation.
Cleaning of latrines is a necessity if the size is insufficient to develop decomposition of excreta. The Ministry of Health is understandably concerned over this practice, particularly since the operation requires workers to break up solid fecal material by hand followed by water-mixing and pumping •
•
PRESENT METHODS OF INDUSTRIAL WASTE DISPOSAL
Methods of disposal of wastes generated by industries in the Lower Suriname River Bas in were cons idered by a short-term consultant. The consultant's report is included in Volume II of this report •
•

- 76
COMBINED AND SEPARATE SYSTEMS
In a country such as Surinam in which the existing major sewerage system is a combined system and in which much of the "system" consists of open ditches, advocating a·separate system for sanitary sewage may not be simple.
As already stated, the Paramaribo system has been constructed on the combined principle. Although this is a fairly old system and may contain some design defects, these are not sufficient reasons to abandon or extensively modify the system. The system appears to have been well constructed and functions effectively except in periods of heavy, protracted rainfall.
However, it cannot be justified to design combined sewers for new installations. In Surinam, the high rainfall intensities produce an unbalanced ratio of storm water quantities to sanitary sewage quantities. This large ratio induces the requirement for collection lines which have to operate under a wide range of flow conditions. In order to develop self-cleaning velocities under dry weather flow, the conduits nnJst be installed at steep grades; and this, in turn, results in the need for pumping large quantities of storm water. If pumping economy is to be effected through designing for maximum flow conditions with gravity flows predominant, sewer maintenance problems multiply during long dry seasons.
Buried pipelines for handling huge quantities of storm water are expens ive to construct. However, sanitary sewage must be conveyed in this type of system in order to maintain reasonable levels of public health. This, too, would emphasize the need for separate systems.
Treatment of sanitary sewage in municipal plants will become necessary at some future date. Designs of such plants are based not only upon the "atrengtb" of sewage but also upon the hydraulic loading. Plant design and construction in Surinam based upon handling moderate sewage flows during dry seasons and massive flows during rainy seasons is prohibitive in terms of cost and questionable in terms of sound engineering judgement.
..

•
•
..
- 77
CRAPrER 9
BASES FOR DESIGN OF SEWAGE DISPOSAL SYSTEMS
INTRODUCTION
The provision of piped water supplies immediately introduces the requirements for the sanitary removal of the waste water and sewage. In municipalities where a collection and treatment system for sewage is available, connection to the sewer is a minor problem. Where central treatment is not provided or anticipated, special consideration must be given to the proposed method of collect ion, removal, treatment, and disposal of sewage.
In Surinam, in the immediate future, except in the Paramaribo central area, each type of community will suggest different approaches to sewage handling and treatment. It would appear that much of the treatment will be limited to individual privies, individual or "c Ius tier" septic tank disposal in the rural populated areas, small collection systems with 1agooning in those areas where the population concentration justifies this type of treatment, and possibly a few secondary treatment facilities in the built-up areas. The most practical method of treatment of wastes from some of the Paramaribo metropolitan peripheral areas would be in central plants.
One of the basic requirements in the planning of any sewerage system is that of providing a safe, effect ive, and innocuous disposal method for the wastes collected. It is the primary purpose of this section of the report to anticipate and to assess the various factors governing the disposal of the waste effluents of the project area; to establish, in general terms and in the context of present knowledge, reasonable effluent quality criteria for the various waste discharges; and, finally, to determine what degree of treatment will be necessary to meet these criteria.
The design of treatment facilities must be such as to meet the criteria mentioned previously. For this reason, the method of treatment selected must not only maintain the desired quality of the receiving water, but will also depend upon the character of the waste to be treated. In some countries, discharge requirements are developed when requests are made by prospective dischargers into receiving water or when an investigation of an existing waste discharge following treatment shows the existing requirements to be inadequate.
The discharge requirements which determine the level of treatment generally limit the amount of BOD, grease, suspended matter, and coliform organisms that may be contained in the waste discharge, as well as a minimum amount of dissolved oxygen to be found in the discharge. In addition,
•

-, •
depending upon the degree of development in the country, the requirements may include maximum amounts for phosphates, nitrates, phenols, arsenic, color, pH, or any other material or waste characteristic that may have a harmful effect on the receiving water quality.
After the criteria or requirements have been determined, the decision on the waste treatment necessary to meet these criteria must be made. If the area is sewered, existing waste flows will be measured, sampled, and analyzed for BOD, pH, grease, suspended matter, and any other quantity that might influence the selection of the treatment process. If the area is not sewered, other steps are necessary, and the ingenuity and judgement of the designer becomes extremely important.
FACTORS INFLUENCING WASTE DISCHARGE CRITERIA
In developing appropriate discharge criteria, the following basic factors will be taken into account:
a. Beneficial uses made of the receiving waters are the controlling factors in determining water-quality levels that are to be maintained.
b. For every beneficial use, there are certain water-quality requirements which must be met to assure that the water will be suitable for that beneficial use.
c. Receiving waters, which may be canals, rivers, or oceans, have varying degrees of waste assimilative capacity, and the addition of waste materials may change the chemical, physical, and biological characteristics of the water without necessarily creating signifi cant adverse effects on the beneficial water uses.
d. The formulation of waste discharge requirements should be so designed as a) to secure that degree of care in the planning and operation of works for the treatment and disposal of sewage and industrial wastes as will adequately protect the public health and other beneficial uses of waters, and b) at the same time to permit the legitimate planned usage of those waters for receiving suitably prepared wastes so that an orderly growth and expansion of cities and industries may be possible.
Presently, the lower Suriname River and, to a lesser extent, the lower Commewijne and Saramacca Rivers serve. as the receiving bodies for the water-borne wastes of the lower Suriname River basin, and it is anticipated that in the future the Suriname, Commewijne, and Saramacca Rivers will continue to serve as the primary means for dispersion and assimilation of the wastes.
- 78
...
•
..
It

..
..
..
- 79
Although the lower Suriname River is not utilized as a source of water for public use, it is the major navigation facility of the basin area; hence, it is vital to the growth and overall economy of this area. Also, since some use is made of tributary local canal water for potable water needs by the public, it is essential that waste discharge criteria be so formulated that protection of this vital resource for all planned uses, particularly navigation and waste disposal, is guaranteed •
It should be noted that the discharge requirements to be developed must be based on a number of broad assumptions. It must be recognized that in the future there will be changes not only in the magnitude and variety of new substances which will be discharged but also in the qualitative and quantitative character of the receiving bodies. Because of these factors, the status of waste disposal within the Lower Suriname River area is in a state of flux and must be reviewed, from time to time, in the light of changed conditions and increased knowledge of the many problems involved.
As stated earlier in this report, some investigations were conducted by the Hydraulics Research Division of the Ministry of Public Works, particularly in connection with BOD, solids, chemical characteristics, and dissolved oxygen in the Suriname River and in some of the canals in the lower Suriname River basin.
WASTE DISPOSAL CONSIDERATIONS FOR METROPOLITAN PARAMARIBO
Although consideration of sewerage for the central Paramaribo area is not included in the Project activity plan, this brief reference is included for background purposes.
The receiving waters into which the waste water effluents of Paramaribo are discharged include the Suriname River or the canal systems flowing to final discharge in the river.
The primary factors Which must be considered in the disposal of wastes by dilution in surface waters are as follows:
a. The quality level Which must be maintained to protect the various beneficial uses of the receiving waters, such as possible drinking water supplies, industrial water supply, and agricultural uses •
b. The volume and strength of the wastes to be discharged.
c. The capacity of the receiving waters to handle the wastes, which in turn is based on the quality of the receiving water available for diluting and absorbing the waste effluents

- 80
At present or during the interim design period, disposal of Paramaribo wastes will have little effect on the dilution capability of the Sur inarne River.
Quantity of Wastes
A breakdown of the quantities of waste water effluents to be discharged in the Suriname River (including its tributaries) is presented in the table below, based on the assumption that the entire population of Paramaribo is to be sewered (both at interim and for ultimate conditions). The table includes rough estimates of the population tributary to the various disposal points, as well as a very general breakdown of domestic and industrial wastes for the interim and ultimate conditions.
Estimated Quantities of Waste to be Discharged into the Suriname River
Tributary Population
Domestic Flow m3/day
Industrial Flow m3/day
Total Flow m3/day
Interim 400,000 60,000 15,000 75,000
Ultimate 700,000 118,000 28,000 140,000
Notes: a) Interim flows are based on the 1987 estimated population figures and water use.
b) Ultimate flows are based on 2001 conditions.
Waste Characteristics
The waste waters of the Paramaribo area will be derived from two basic sources, domestic sewage and industrial wastes.
Domestic Sewage: In addition to the discussion of the characteristics of domestic sewage presented in the section of this report entitled "Bases for Design" are the following remarks. •
Besides adding organic waste materials, domestic use of water will add dissolved mineral salts. It is estimated that domestic water use will increase the total dissolved solids (TDS) content by about 250 to 300 mg/1.
.. This represents an insignificant contribution to the Suriname River solids content. The table below presents a general list obtained from WHO sources of the additions to various major chemical constituents found in water through domestic use. Domestic wastes, of course, may also contain biological pathogens including bacteria and viruses.

- 81
Constituent Additions After Domestic Water Use
Constituent Added Amounts (mgj1)
Total dissolved solids 250 to 300 •
Boron 0.1 to 0.4
Sodium 40 to 70
Potassium 7 to 15
Magnesium (as CaC03) 15 to 40
Calcium (as CaC03) 15 to 40
Total nitrogen 20 to 40
Sulfate 15 to 30
Ihosphate 20 to 40
Chloride 20 to 50
Alkalinity (as CaC03) 100 to 150
Industrial Wastes: Industrial waste matters of varying kinds are contained in the spent process waters of manufacturing establishments and are produced in washing, flushing, extracting, and impregnating operations. Like domestic sewage, industrial wastes contain suspended, colloidal, and dissolved solids of mineral and organic origin. Pathogenic organisms are rarely found in industrial waste waters.
The strength of industrial waste waters varies widely from industry to industry and with changing manufacturing procedures within the same industry. Hence, it is not feasible to attempt to assign definite values to the characteristics of industrial wastes to be produced in Paramaribo, until a comprehensive review of all major industrial wastes is performed.
Effective control of the discharges of industrial wastes into the sewerage system is best accomplished by regulations through which existing and proposed discharges may be reviewed in order to evaluate their effects, and by which reasonable pretreatment can be required if needed. Such industrial waste regulations should be based on the philosophy that the sewerage should afford maximum service for industry, and hence should receive and handle wastes or treated wastes to the extent possible without impairment of the sewerage system's capacities for receiving and handling

- 82
domestic wastes. On this basis a sample of typical regulations submitted by the WHO short-te~1m consultant for industrial wastes has been supplied to the Government of Surinam.
WASTE WATER RECLAMATION
At the writing of the report, no consideration had been given to studying waste water reclamation. In some countries in which chronic shortages of water for community supplies or for agricultural purposes are experienced, the practice of waste water reclamation is pursued in order to meet these demands. However, th is frequent ly impl ies the need for additional investment in treatment elements, an approach which would be difficult to implement in Surinam, where the needs for agriculture are not on the same scale as the discharge which would be available from treatment plants. Depending upon public contact with the irrigated area, or with the produce grown in the irrigated area, more or less rigorous disinfection criteria would need to be applied.
Some standards proposed by the California Department of Heal th (USA) are:
Max. MPN
For irrigation of parks, playgrounds, etc. 5/100 ml
For irrigation of golf courses 23/100 ml
For vegetable and raw foods 0/100 ml
For certain other crops Partial disinfection
Further, if it is desired to reuse effluent for drinking water, public health standards and esthetics would practically demand tertiary treatment. The tertiary treatment chosen would have to be justified by an economic analysis. In other words, the reclaimed or tertiary treated effluent would have to cost less than the cost of hauling fresh water or treating raw water. This, in turn, would require a comparative investigation of the costs of desalination of water of extremely high chloride content.
GENERAL SEWERAGE DESIGN
Introduction
The design of collection, treatment, and disposal facilities for waste water is primarily controlled by the estimated BOD and hydraulic
•
•
- 83
loadings to be handled, as well as the method of collection and treatment which is justified. In developing cost estimates, it is necessary to determine on a unit basis not only the flow or volume of waste but also its strength and composition. With respect to flow in collection systems, peak flow rates must be known in order to determine the required hydraulic capacities of sewers, pumping stations, treatment plants, and effluent disposal facilities. Similarly, strength and composition must be known in• order to determine the degree and type of treatment required to produce an effluent of acceptable quality. Thus, a study of waste volumes and characteristics is a necessary preliminary step to the develOPment of design criteria.
Waste Water Quantities
There are three important components of waste water volume: the first consists of sanitary sewage; the second, of industrial waste; and the third consists both of subsurface water, which enters a sewer system through joints and other openings, and of storm water, which enters through manhole openings and illicit drain connections. The third component is generally termed infiltration.
Because the major portion of infiltration occurs during periods of heavy rainfall, it is necessary to consider sewage volume in terms of both dry weather and wet weather flow. Dry weather flow consists of waste water occurring during periods of zero or minimal rainfall. Similarly, wet weather flow consists of waste water plus infiltration and storm water inflow. Dry weather flow usually determines the normal loading to be imposed on major units of a treatment plant, whereas wet weather flow indicates the hydraulic capacity required for sewers, pumping stations, and force mains.
Domestic Sewage
Unit or per capita sewage flows are conventionally determined from a study of recorded flow data and population served. Then, with the basic data of present flow at hand, future changes are projected and suitable future design allowances are determined.
In Surinam, as previously stated, only one fairly extensive sewerage system is presently in operation: the Paramaribo system, which is designed on the combined basis. Because the average per capita water supply (hence per capita sewage flow) is restricted by limitations in the present water supply system, metering of water flows within the Paramaribo system does not provide a reliable guide to the per capita waste water flows of the population served. In view of the above factors, and the necessity for establishing unit sewage flows for use in the design of separate sewerage systems, per capita sewage flows have been determined by estimation. For design purposes, therefore, the quantity of sewage obtatned from residential areas is estimated to be 80% of the established

- 84
per capita water allowances (as noted in Part III). This percentage gener .. ally corresponds to conventional practice for metropolitan areas of this size.
Industrial Waste
Because of the varied nature (type and size) of the existing anticipated future industries within Surinam, industrial waste flows are difficult to predict with any degree of accuracy. Hence, only general estimates of the industrial contribution are possible. Certain types of industrial wastes will require pretreatment prior to being discharged into the public sewers, in order to provide proper protection to the sewerage system. The extent of such pretreatment will be indicated in the suggested ordinance inc 1uded as Annex I.
It is expected that 50% of the industrial water consumption can be estimated as being discharged to the sewerage system. This value has been found in general to be a reasonable allowance for industrial areas where suitable regulatory controls are applied.
In areas served by combined sewers, it is estimated that 80% of the industrial water consumption is discharged to the public sewers.
Infiltration
In areas served by combined sewers, no consideration has been given to infiltration because the quantities involved are generally insignificant in relation to total hydraulic capacities of the sewers.
For areas with separate sewers, an infiltration allowance of metric equivalent to 1,900 liters per centimeter of diameter of sewer per kilometer per day will be assumed, corresponding to general practice elsewhere where ground water is prevalent and sewers reasonably well constructed. The purpose of this procedure will be to obtain a reasonable estimate of infiltration on a per acre basis which can properly be used for estimating total infiltration in the future.
Design Flows
The design of sewers is based on maximum rather than average flow, and the ratio of maximum to average flow varies according to location within the sewerage system-that is, on the extent of the tributary from which sewage is being collected. For design purposes, estimates will be made of this peaking factor (rate of maximum to average flow), but is tentatively assumed as a factor of 2.0.
Basis of Design for Sewerage Systems in Rural Areas
Population Growth: The average growth in population for areas to be served by sewerage has been assumed at approximately 4% per year.
•
•
•

•
..
•
- 85
Additional assumptions were covered in this report in the sections on water system design.
Rate of Sewage Flows: The number of persons in a home in areas to be served is assumed to be six. As stated earlier, flow can only be predicted, since no existing sanitary sewer systems are presently in service .
Average daily flow: 70 l/person Peak daily flow 140 l/person
This includes effluent from sinks, toilets, bathrooms, and so on.
Peak Sewage Flows From Specific BUildings - Movie Houses: Average capacity 1,000 persons, with three performances on Saturdays, each lasting two hours. All other days two performances per day.
- For septic tanks and drain field design:
Daily : 2.4 m3 m3Hourly: 0.4
- For overall treatment and gravity system design:
Daily : Hourly:
Restaurants: Average capacity 35 tables, four persons per table. Greatest usage from 12:00 noon on Saturdays to 1:00 Sunday morning. Also included is kitchen cleaning effluent.
- For septic tank and drain field design:
Daily : 0.6 m3 3Hourly: 0.1 m
- For overall treatment and gravity system design:
3Daily : 4.8 mm3Hourly: 0.5
Local Shops: Average 100 persons passing through every hour at peak time. Peak period lasts four hours per day.
- For septic tank and drain field design:
Daily : 0.5 m3 Hourly: 0.1 m3

- 86
- For overall treatment and gravity system design:
Daily: Hourly:
Schools: Flow based on 12 grade-school and four preschool classes:
- For septic tank and drain field design: .,
3Daily : 3.0 m3Hourly: 0.4 m
- For overall treatment and gravity system design:
3Daily : 0.4 m3Hourly: 0.5 m
Service Stations: Stations are open 16 hours per day. Included are car washing outflows (only for overall system design).
- For septic tank and drain field design:
3Daily : 0.8 m3Hourly: 0.1 m
- For overall treatment and system design:
3Daily : 20.0 mHourly: 1.2 m3
Government Offices: Utilized for local administration tasks. Forty employees per eight-hour day.
- For septic tanks and drain field design:
3Daily : 0.7 m3Hourly: 0.1 m
- For overall treatment and gravity system design: •
Daily : Hourly:
• Recreation Buildings: Capacity 200 persons on Saturday, and build
ing is used for a six-hour period. Also includes effluent from kitchen facilities, except for septic tank design:
-For septic tank and drain field design:
Daily : 8.0 m3 3Hourly: 1.0 m

- 87
- For overall treatment and gravity system design:
Daily: Hourly:
Medical Buildings (polikliniek): Capacity 50 visitors per day and five professional staff. Buildings open for eight hours per day.
- For septic tank and drain field design:
• 3Daily : 0.5 m3Hourly: 0.1 m
- For overall treatment and gravity system design:
Daily : Hourly:
Medical Building and Small Hospital: Hospital with a capacity of 20 beds and kitchen facilities. Included are seven employees, two employees each on a three-shift program.
- For septic tank and drain field design:
Daily: 1.9 m~ Hourly: 0.2 m
- For overall treatment and gravity system design:
Daily : Hourly:
Shop for Maintenance Eguipment: Flows based on a shop which serves an agricultural community of approximately 1,000 persons. Includes wash rack effluent only for overall treatment and gravity system design. Shop open eight hours per day.
- For septic tank and drain field design:
Daily : Hourly:
- For overall treatment and gravity system design: •
Daily ~
Hourly:
Note: All above-mentioned sewage flows are only for specific purposes and should only apply to the rural areas located outside the metropolitan area of Paramaribo.

- 88
Collect ion System: MinitrnJm size of pipe used is 6".
Sewage Characteristics
Sewage characteristics are significant in that they determine both the type and the degree of treatment which DUst be provided to meet estab
•lished discharge criteria, and also may affect the design of sewers and other sewerage facilities.
In a comprehensive study of this type, data obtained from representative samples collected at various existing facilities are analyzed to determine present waste water characteristics. After the present character of the waste water is established, this information will be used as a basis for estimating future design loadings. Some BOD sampling has been made by the Government, but this reflects only the receiving water in the Suriname River. Sampling and analyses for evaluating per capita BOD have been performed in Moengo by proj ect staff.
Preltminary Design Loadings
The waste water of the project area will be derived from predominantly domestic sewage and smaller industrial discharges. Since industries of various types could be located throughout the project area, it is hardly possible to estimate the exact magnitude and nature of the industrial loadings. However, it is assumed that industrial loadings will be regulated' to comply with the provisions contained in suitable future industrial waste ordinances • The design factors adopted for various stages of development are presented below:
Design Factors for Waste Characteristics
Factor 1987 Value
lbs/cap/day g/cap/day
BOD, 5 day 200C
Suspended sol ids
0.17
0.20
78
90 •
The above design concentrations of BOD and suspended solids esti • mated for the year 1987 are probably higher than existing values to allow for the increases in living standards and in industrial loads on the municipal systems.
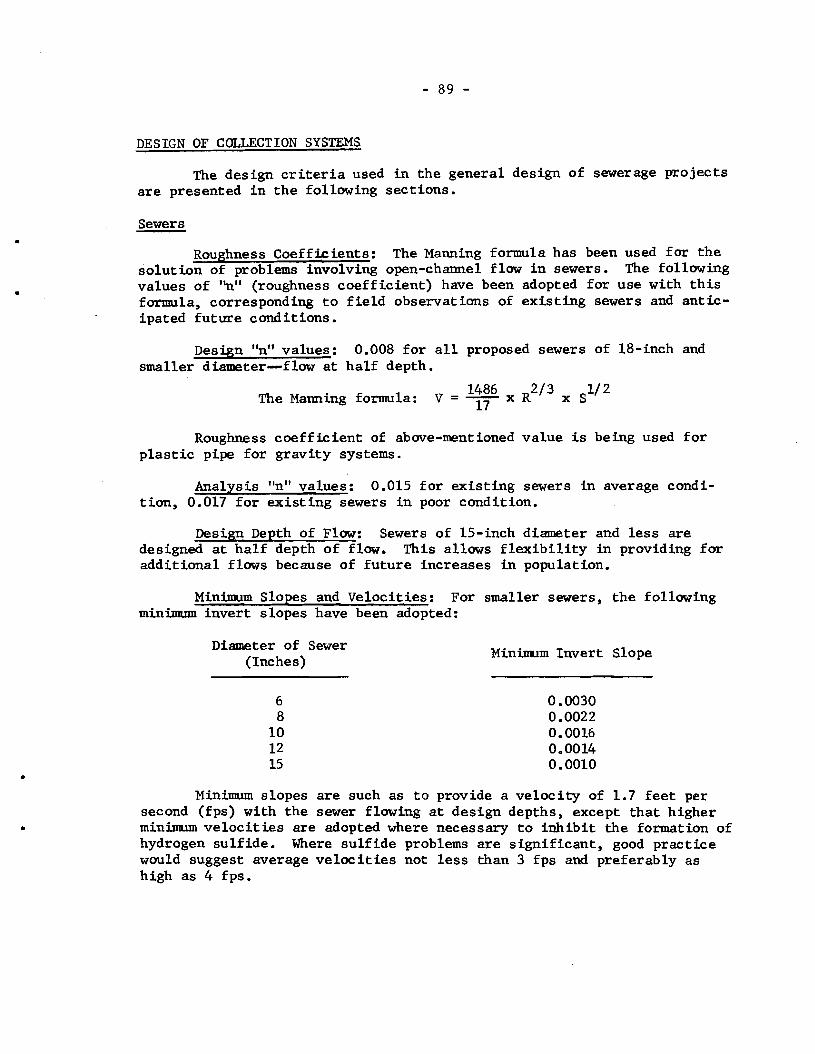
•
•
•
- 89
DESIGN OF COLLECTION SYSTEMS
The design criteria used in the general design of sewerage projects are presented in the following sections.
Sewers
Roughness Coefficients: The Manning formula has been used for the solution of problems involving open-channel flow in sewers. The following values of "n" (roughness coefficient) have been adopted for use with this formula, corresponding to field observations of existing sewers and anticipated future conditions.
Design "n" values: 0.008 for all proposed sewers of 18-inch and smaller diameter---f1ow at half depth.
The Manning formula: V = 1486 x R2/3 x s1/ 2 17
Roughness coefficient of above-mentioned value is being used for plastic pipe for gravity systems.
Analysis "n" values: 0.015 for existing sewers in average condition, 0.017 for existing sewers in poor condition.
Design Depth of Flow: Sewers of lS-inch diameter and less are designed at half depth of flow. This allows flexibility in providing for additional flows because of future increases in population.
Minimum Slopes and Velocities: For smaller sewers, the following minimum invert slopes have been adopted:
Diameter of Sewer Minimum Invert Slope(Inches)
6 8
10 12 15
0.0030 0.0022 0.0016 0.0014 0.0010
second Minimum slopes (fps) with the
are such sewer
as to provide flowing
a velocity of 1.7 feet per at design depths, except that higher
minimum velocities are adopted where necessary to inhibit the formation of hydrogen sulfide. Where sulfide problems are significant, good practice would suggest average velocities not less than 3 fps and preferably as high as 4 f ps ,

- 90
Manhole Location: Placing of the manholes is based on maintenance procedures: for sewers 6" to ·15" in diameter the maximum distance between manholes is 400 ft (122 m). Manholes will be placed at changes of grade, direction, and diameter.
Elevation Difference in Manhole Inverts: The vertical drop across manholes (minimum drop of invert) for small sewers (15" and smaller) with straight-through flow is adopted as 0.10 foot (3 cm). For a side inlet, the minimum drop of invert is 0.20 foot (6 cm). For straight-through flow ,across manholes with different sizes of pipes with matched water surfaces see the following table:
Drop in Feet (Diameter of inlet in inches)
Diameter of Outlet 6" 8" 10" 12"
Feet Meters Feet Meters Feet Meters Feet Meters
8" 0.008 (.02)
10" 0.17 (.05) .08 ( .02)
12" 0.25 ( ~08) .17 ( .05) 0.08 (0.02) 0.02 (0.005)
15" 0.38 ( .11) .29 ( .09) 0.21 (0.06) 0.13 (0.04)
The maximum drop for straight-through flow is 0.60 ft (0.18) and for side inlet 1.0 ft (0.30 m).
For manhole structures with side inlets (confluence structures) the drop of inverts is calculated using the principle of the conservation of momentum (pressure + momentum).
Lift Stations
Capacity of wet wells and pump stations are designed to handle the average sewage flow. Piping is designed for peak flows; pumps and motors
•can be replaced and reused to handle future increased flows. Wet wells are designed to handle a flow of five minutes' time between successive starts of a pump (where possible). Enough flexibility is available to accommodate future increased flows which decrease the time lapse to 2 1/2 minutes, set as a minimum between pump starts. Wet wells are poured-inplace reinforced concrete structures. Slab thickness is considerable

- 91
since the maximum gravity sewer depth would be kept at approximately 5.5 m below the existing ground. Ground water level, as stated earlier, is at an average of approximately 0.50 to 1.00 m below the existing ground level, causing uplift, which has to be carefully examined in station design. Each pump station has a standby pumping capacity equal to the required pump and power capacity to handle the flow. Pumps are of the submersible type driven by electric motors.
Each station operates fully automatically on the sewage level in the wet well. Alarms are provided for high water, malfunction of pumps, and power failures. A standby power plant is provided to operate the pump in case of power failure.
For pump station discharge force mains, underground plastic pipe is used. Above-ground materials for bridge crossings are made of cast-iron pipe. Velocities are kept to a maximum of 10 ft/sec and a minimum of 2.5 ft/sec.
Hydraulic calculations are based on the Hazen-Williams formula with a friction coefficient of C = 120.
WASTE STABILIZATION PONDS
Waste stabilization ponds provide a useful method of waste water treatment and disposal in small communities where both funds and trained personnel are in short supply. In these ponds, beneficial organisms stabilize the waste water into a liquid that can be released to the environment without endangering man directly or affecting the environment adversely.
Due to the uniformly distributed sunshine and warm temperatures prevailing in Surinam, the type of stabilization pond treatment adopted was that of anaerobic ponds in series with facultative ponds and, where required, maturation ponds for reduction of the algal concentration in the effluent.
Basis of Design
1. Anaerobic ponds
a. Area and loading: The anaerobic ponds shall be designed for a daily loading of 700 kg of BOD per hectare.
b. Pond shape: The shape of the ponds should be such that there are no narrow or elongated portions, preferably rectangular, with a width-to-1ength ratio of 1:4. Dikes should be rounded at the corners to minimize accumulations of floating materials.

- 92
2. Facultative ponds
a. Area and loading: The facultative ponds shall be designed for a daily loading of 150 kg of BOD per hectare.
b. Pond shape: The recommendations for the anaerobic ponds about shape apply also to facultative ponds, except that the width-tolength ratio should not exceed 1:3.
3. Maturation ponds
Maturation ponds are designed in a similar manner to the facultative ponds but with half of the area.
Pond Location
a. Distance from habitation: A pond site should be as far as practicable from habitation or any area which may be built up within a reasonable future period.
b. Prevailing winds: If practicable, ponds should be located so that local prevailing winds will be in the direction of uninhabited areas.
c. Surface run-off: Location o~ ponds in watersheds receiving significant amounts of run-off water is discouraged unless adequate provisions are made to divert storm water around the ponds and otherwise protect pond embankments.
Pond Construction Details
1. Embankments and dikes
Embankments and dikes should be constructed of relatively impervious materials and compacted sufficiently to form a stable structure. Vegetation should be removed from the area upon which the embankment is to be placed. Where a high ground water problem exists, the limiting cut in the existing ground shall be kept at a maximum of 1.0 m. Surrounding dikes are built on compacted fill to the required height above the existing ground. The minimum embankment top width should be 2.50 m to permit access of construction and maintenance vehicles.
Embankments shall be seeded above the water level. A perennial type, low growing, spreading grass which withstands erosion and which can be kept mowed is most satisfactory for seeding of embankments.
a. Slopes - Embankment slopes should be:
- Inner: three horizontal to one vertical
•
•
•
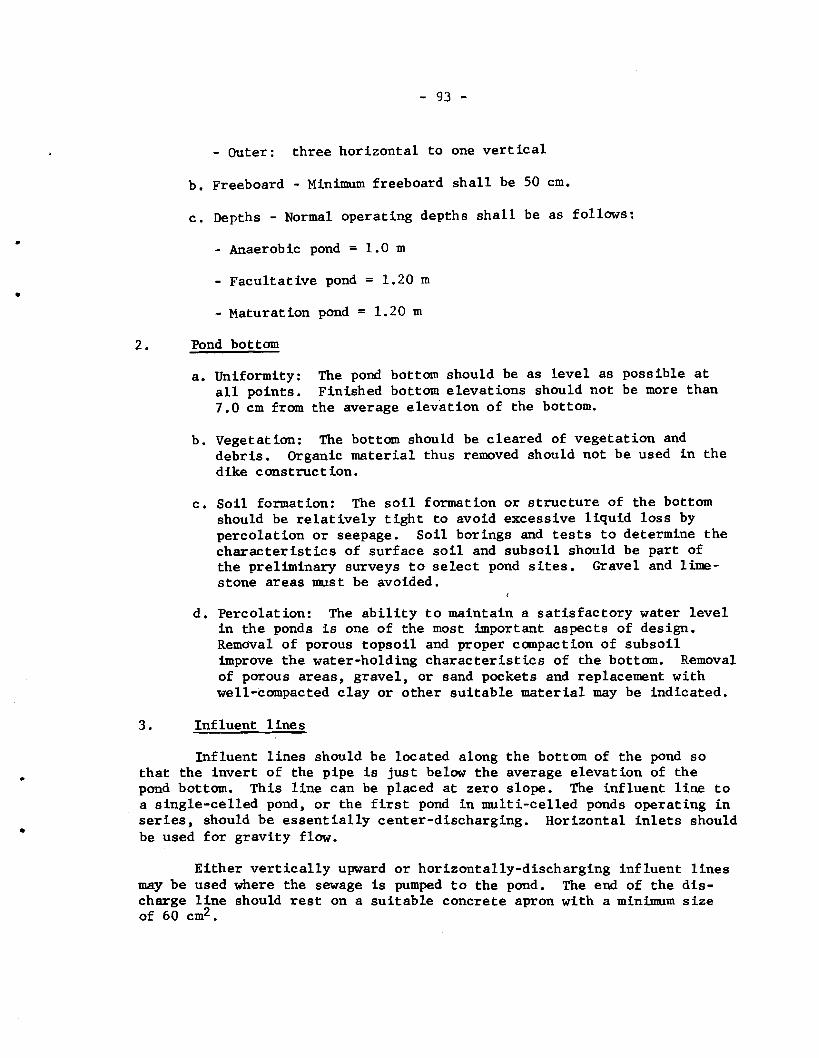
- 93
•
•
- Outer: three horizontal to one vertical
b. Freeboard - Minimum freeboard shall be 50 cm.
c. Depths - Normal operating depths shall be as follows:
- Anaerobic pond = 1.0 m
- Facultative pond = 1.20 m
- Maturation pond = 1.20 m
2. Pond bottom
a. Uniformity: The pond bottom should be as level as possible at all points. Finished bottom elevations should not be more than 7.0 cm from the average elevation of the bottom.
b. Vegetation: The bottom should be cleared of vegetation and debris. Organic material thus removed should not be used in the dike construction.
c. Soil formation: The soil formation or structure of the bottom should be relatively tight to avoid excessive liquid loss by percolation or seepage. Soil borings and tests to determine the characteristics of surface soil and subsoil should be part of the preliminary surveys to select pond sites. Gravel and limestone areas must be avoided.
d. Percolation: The ability to maintain a satisfactory water level in the ponds is one of the most important aspects of design. Removal of porous topsoil and proper compaction of subsoil improve the water-holding characteristics of the bottom. Removal of porous areas, gravel, or sand pockets and replacement with well-compacted clay or other suitable material may be indicated.
3. Influent lines
Influent lines should be located along the bottom of the pond so that the invert of the pipe is just below the average elevation of the pond bottom. This line can be placed at zero slope. The influent line to a single-celled pond, or the first pond in multi-celled ponds operating in series, should be essentially center-discharging. Horizontal inlets should be used for gravity flow.
Either vertically upward or horizontally-discharging influent lines may be used where the sewage is pumped to the pond. The end of the discharge line should rest on a suitable concrete apron with a minimum size of 60 cm2•

- 94
4. Overflow structures and interconnecting piping
Overflow structures should consist of a manhole or box equipped with mu1tiva1ved pond draw-off lines or an adjustable overflow device so that the liquid level of the pond can be adjusted to permit operat ion at depths of 60 cm to 1.20 m. The lowest of the draw-off lines to such structures should be 30 cm off the bottom to control erodtng velocities and avoid pickup of bottom deposits. The overflow from the pond should be taken near, but below, the water surface to release the best effluent and insure retention of floating solids.
When possible, the outlet structure should be located on the windward side to prevent short-circuiting.
Interconnecting piping for multiple unit installations operating in series should discharge horizontally near the secondary pond bottom to minimize the need for erosion control measures and should be located as near the dividing dike as construction permits.
5. Miscellaneous
The pond area shall be enclosed with a suitable fence to exclude livestock and discourage trespassing. All access gates should be provided with locks.
Appropriate signs should be provided along the fence to designate the nature of the facility and advise against trespassing.
Provisions for flow measurement should be provided. Facilities for the installation of inlet and outlet weirs should be adequate for most installations. If required, the final effluent should be chlorinated before being discharged into a drainage ditch or watercourse.
SEPTIC TANK DESIGN
The common method for sewage treatment and disposal, generally in rural areas, including those of "developed" countries, consists of an adequate septic tank for the settling and treatment of the sewage together with a subsurface leaching system for the disposal of the overflow. In Paramaribo, as previously stated, the effluent is collected in the combined system and disposed of in the Suriname River.
In the coastal area, specifically in that part of the project area for which the Supply Group I systems are planned, the relatively high water table elevations (40 to 80 cm below surface level. generally) generates problems in the design of leaching fields or drainage areas. The design of leaching fields usually is based on the ability of the soil from a depth of one meter up to three meters (and in some cases up to six or eight meters when permeable strata are deep) to absorb water.
•
•
e

- 95
A number of factors, in addition to the ground water table location, affect the "treatment" of septic tank effluent. The soil structure, earthworm presence, and root penetration have a definite effect on the aerobic oxidizing bacteria and antma1 organisms, liquids, or gases. A waterlogged soil tends to destroy these effective organisms and, in turn, preserve the organic matter in the effluent. The use of well-drained, artif ic ia1 leaching fields may be used in lieu of a conventional leaching system, but this generally results in disposal of the effluent into ditches, canals, or other water sources •
• Septic Tank Design Characteristics
For design purposes, a number of six persons for each house is used, which is an average and a relatively accurate figure for these rural areas. Project staff have conducted several house counts in order to verify this figure. Only toilet effluent is considered.
1 home (6 persons) - septic tank dimensions:
1.00 m inside diameter with a depth of 1.00 m, drain field 3.70 m x 2.00 m, depth 1.00 m
4 perforated rows of 4" pipe 6" pipe for the distribution structure 6" effluent pipe - 4" diameter collection
system
2 and 3 homes (12-18 persons) - cluster type septic tank dimensions:
1.00 m inside diameter with a depth of 2.00 m, drain field max. 6.00 m x 2.00 m, depth 1.00 m
4 rows of perforated 4" pipe 6" pipe for the distribution structure 6" effluent pipe - 4" collect ion system
(A graph of septic tank volumetric requirements is attached as Figure IV-16.)•
SANITARY PRIVIES
Where people cannot afford the construction of a septic tank system, the sanitary privy is the means of disposal of human excreta.
Due to their significance in the protection of health in the rural areas, the construction of privies I1USt be made an integral part of the general plan for collection and disposal of sanitary wastes.

- 96
Privies are composed of two parts: the superstructure and substructure. Privacy and protection against the elements are insured by the superstructure, and the sanitary requirements by the substructure. Both components should be held as simple as possible to meet the economic needs of the population that they must serve.
Of all types of privies the most widely used is the pit privy. With a minimum of attention to location and construction, there will be no soil pollution and no surface or ground water contamination. The excreta ..will not be accessible to flies if the hole is kept covered, but even when the hole is left open, the fly problem will not be very great since flies are not attracted to dark holes and surfaces. A good superstructure helps to keep the light from the pit. There is no handling of the material; odors are negligible; and feces are normally out of sight. The pit privy is simple in design, easy to use, and does not require operation. The life span will vary from five to 15 years depending upon the capacity of the pit and the use and abuse to which it is put. Its chief advantage is that it can be built cheaply, utilizing indigenous labor.
1. Pit privy
The pit privy consists of a hand-dug hole in the ground covered with either a squatting plate or a floor slab provided with a riser and seat. A superstructure or house is then built around it. The privy is installed on a mound in order to prevent flooding.
The pit is usually round or square for the individual family installation and rectangular for the public latrine. Its dimensions vary
2from 90 em in diameter to 1.20 m . Common figures for family latrines are 90 cm diameter or 1.0 m2 • The depth is usually about 2.50 m, but may vary from 1.80 to 5.0 m,
It is often necessary to provide a pit lining to prevent the sides from caving in. This is true especially in rainy climates where the privies are dug in fine-grained alluvial soils, sandy soils, or similar formations, or when the pit penetrates deeply into ground water. Materials commonly used for this purpose include brick, stones, concrete blocks, lumber, rough-hewn logs, split cane, and bamboo.
The base serves as a solid, impervious foundation upon which the • floor can rest. Properly made of hard durable material, it helps to prevent the entrance of burrowing rodents and of surface water into the pit. The foundation should be at least 10 cm wide on top in order to provide a good surface for the floor to rest upon, and 20 cm at the bottom to give a stable contact with the ground. The base should be tight enough to raise the floor 15 cm above the level of the surrounding ground to protect the pit from possible flooding.
The following materials may be used in the construction of the base:
- 97
a. Plain or reinforced precast concrete, utilizing the same mix as for floors
b. Soil cement, 5 to 6% cement mixed with sandy clay soil and tamped at optimum moisture content
c. Tight clay, well tamped at optimum moisture content
d. Brick .. e. Stone masonry
f. Rough cut logs, termite resistant hardwood
The floor supports the user and covers the pit. It should be constructed so as to fit tightly on the base, and extend to the superstructure walls. Materials commonly employed include:
a. Reinforced concrete
b. Reinforced concrete with brick filler
The squat type slab for pit privies had been found more suitable for rural conditions. However, in certain cases a slab provided with a riser and seat may be found more acceptable.
All factors considered, appropriate dimensions for the concrete slab may be 1.0 x 1.0 m in overall size. The thickness of slabs varies a great deal in practice. In order to reduce weight, the tendency has been to reduce the thickness to a minimum consistent with safety. In this respect, however, much depends on the quality of the concrete and the reinforcement available. When these factors are favorable, the slab may be of uniform thickness throughout and not less than 6.0 cm thick.
The function of the mound is to protect the pit and base from surface run-off which otherwise might enter and destroy the pit through flooding. It should be built up to the level of the floor and be very well tamped, and should extend 50 cm beyond the base on all sides. In exceptional cases, such as in flood plains and tidal areas, the mound may be built up considerably above the ground for protection against tides and flood waters. The mound is normally built with the earth excavated from the pit.
't
2. The house or superstructure
The house or superstructure affords privacy and protects the user and the installation from the weather. A properly built superstructure conforms to the following characteristics:

- 98
a. Size should be the dimensions of the floor slab
b. Ventilation should be provided through openings 10-15 cm wide at the top of the house wells to facilitate constant ventilation.
c. The roof should cover the house ccmp1ete1y and have a large overhang to protect the ground and walls from rain and roof drainage. The height of the roof over the slab near the entrance door should be 2.0 m or more.
d. Natural light should be available. However, the superstructure should provide sufficient shade over an uncovered seat or hole in order not to attract flies. Materials used in the construction of the superstructure include the following, among others:
- Cut 1mnber - Asbestos cement sheets - Sheet metal - PaLm or grass thatch - Brick
3. Location of the pit privy
Regarding the location of pr~v~es with respect to sources of water supply, experience has shown that in average soil condit ions a privy should be separated from a house well by a distance of not less than 10.0 m.
Regarding the locat ion of privies with respect to dwellings, it has been observed that the distance between the two is an important consideration in the acceptability of the sanitary facilities. A privy will be more readily used and more likely will be kept clean if it is reasonably close to the house which it serves. However, on the other hand, the privy should not be too close to the house. It should preferably be built at a nominal distance of 6.0 m or more from the dwelling.
4. Care and maintenance
The pit privy needs little maintenance, but there are same simple requirements which must be satisfied in order to guarantee acceptance as well as to ensure its lasting for the design period.
The superstructure should be kept c lean at all times. When not cleaned regularly it becomes objectionable, with the result that the users will prefer to defecate in the area around the privy or in a neighboring bush. The door and walls should be kept in a good state of repair.
Because the mound has a tendency to be eroded by heavy rains, it should be repaired immediately. For esthetic reasons and to make it more acceptable, the superstructure should be painted a light color or 'Whitewashed." The immediately surrounding vegetation should be kept trimmed.
..
•
..

- 99
DESIGN PERIODS FOR SEWERAGE SYSTEMS
The following des ign period criteria are provided to allow for an orderly expansion in capacities of sewerage systems.
Land Requirements
Similar to the situation for water supplies, most land is under central govermnent control. Therefore, it should be no problem to acquire
• ample acreage in the first instance to meet anticipated ultimate requirements (i.e., for a design period of 40 years or more). Inadequate initial acreage can severely inhibit expansion at a later date. Wherever possible, a margin of land around sewage treatment plants should remain permanently undeveloped as a "buffer zone" to prevent early development of residential property.
Outfall Structures, such as OCean Outfalls
A design period of 40 years or more.
Major Structures, such as Pumping Stations
The design period should be 40 years or more. The mechanical and electrical equipment within pumping stations should be designed for periods of 15 years or less with provisions for later modifications or additions.
Major Sewage Treatment Plant Elements
The des i811 period should be 15 years or less, with provis ions for parallel expansions.
Collection Systems
The design period for trunk sewers and secondary sewers should be 40 years or more .
•

- 100
CHAPI'ER 10
PROPOSED SEWERAGE SYSTEMS
KWATTA-LEIDINGEN SYSTEM
General ,f
The proposed piped sewerage system and the cluster type septic tank system for the Kwatta-Leidingen area are included as Plan IV-19.
The Kwatta-Leidingen system has been investigated on the basis of two a1ternate methods of collection and disposal: 1) a piped system of collection with treatment and disposal through lagooning and 2) a cluster type septic tank system with small drainage areas.
Any sewerage collection system in the Kwatta-Leidingen area as well as in most of the coastal region of Surinam will be expensive to build and maintain, regardless of the method used. The factors which develop this condition are 1) the extremely high ground water table and 2) the method of road construction in which native material is scraped from both sides of the road right-of-way to build the fill for the road-bed, thus creating wide irrigation and drainage channels along each side of the right-of-way. House services must cross these channels, either on supports or by use of siphons, or parallel lines must be constructed. Another effect of this method of road/dike construction is to develop a height of crown in the road which is considerably above the first floor elevation of houses adjoining the roadway, thereby impelling the need for deep excavation in the roadway for gravity sewer lines.
Location. Boundaries. and Description of Area
The Kwatta-Leidingen sewerage project is located in the same area previously described to be served by the Kwatta-Leidingen water supply system. The area is characteristic of the rural areas contiguous to Paramaribo, with the typical density of housing.
The boundaries of the sewerage zone encompass a somewhat larger •service area than was included in the water supply project, and this was based on the assumption that piped water would be available in the southeasterly section through another system of supply.
Population Served
The design population for the sewer service area was based on the similar design population for the water supply system and this, in turn,

- 101
was projected from an actual present day house count. For estimating and design purposes the total population was projected to 1987 and is estimated at 25,000.
Design Analyses
• Piped collection system
As stated earlier, the average flow was estimated at 80 liters per • capita per day, and this includes domestic, commercial, and industrial
contributions. A peaking factor of 2.0 is utilized for the collection system design.
This would develop an average daily flow of 2 million 1pd and a peak flow of 4 million 1pd. Infiltration, based on an approximate value of 1,900 liters per day per centimeter of diameter per kilometer of pipe and averaged over the total collection system represents approximately 10% of the peak flow. Design criteria for sewerage design were discussed in an earlier section.
Collection system design was based on establishing initial depths of invert at 1.0 meter and installing pumping stations when a 6.s-meter depth was reached.
Following are the pipe sizes and lengths included in the collection system. Pipe used would be vitrified clay, asbestos-cement, or plastic (PVC or high density polyethylene).
6-in diameter 21,200 m 8-in diameter 39,100 m
10-in diameter 6,200 m 12-in diameter 3,000 m ls-in diameter 2,500 m
Because of the flat terrain, a total of 19 pumping stations will be required. It is proposed to use package-type lift stations complete with two self-priming, horizontal centrifugal pumps; valves; internal piping; motor control center; and liquid level control system. The pumps would be required to handle solids up to four inches in diameter.
The pumping stations will be above ground with wet wells installed as shown on Plan IV-19 •
• Also shown on the above drawing are the location and details of the sewage lagoon system for the sewerage projects. Immediate needs would compel the initial construction of two lagoons of approximately 100 x 300 m size, in order to provide 90-day retention of the sewage. At an intermediate phase, during 1978, a third lagoon would be needed and a fourth would be built by 1987. Discharge, after chlorination, would be into canals.

- 102
Cost Esttmates for Kwatta-Leidingen Systems
Piped sewerage system
Collection system Sf. 3,604,000 Lift stations 190,000 Stabilization ponds 317,000 •
Sf. 4,111,000 •
Cluster septic tanks
Piping Sf. 747,000 Septic tanks 226,000 Filters 527,000
Sf. 1,500,000
Cluster Septic Tank System
The design of the septic tank system (see Plan IV-20) was based on serving either one, two, three, four, or five houses in a cluster. The limits are reached when the limit of gravity flow is reached, and the situation in the Kwatta-Leidingen area is such that the maximum number of houses which can conceivably be served is five, because of the flat terrain.
Again, a flow of 80 l/c/d was used. Detention time in the septic tank was assumed to be 12 hours. Because of the high water table and the waterlogged condition of the existing soil, it is proposed to include an open sand filter with each septic tank. Design of the filters is based on a loading rate of 100,000 gallons per acre/day. After filtration the effluent will be discharged into canals.
The septic tank construction is to be in two stages with the final stage to include the construction of an open sand filter for each septic tank. The design of the filters is based on a loading rate of 100,000 gallons per acre/day. As the effluent from the septic tanks will be discharged into canals, the filter construction will be required as soon as the water in the existing canals is improved to a higher quality than now exists.
NIEUW NICKERIE SYSTEM
General
The drawings for the proposed Nieuw Nickerie sewerage system are included as Plans IV-2l to -34.

- 103
•
•
•
•
Nieuw Nickerie has a piped water supply system which is operated by the Surinam Water Company.
At the present, sewage is discharged into the ditches of the storm drainage system. Sullage water is discharged directly, and flush toilet effluent is discharged after treatment in septic tanks •
The open canals create a problem in that most are hydraulically inefficient and subject to rapid weed growth; because of this, together with trash dumping into the c ana Ls, serious sanitation problems are created. During the rainy season the canals overflow as a result of the lack of hydraulic capacity, spreading heavily polluted water. This situation is further aggravated by occasional tide locking of the channels. Obviously, the above conditions create severe health hazards and point up the need for tmmediate consideration of improvements to the sewer and storm drain systems. A separate sewage collection system will be expensive to build and to maintain regardless of the method used. Two factors create this condition: 1) the drainage ditches running on both sides of the· streets and 2) the height of the crown of the streets that are considerably above the first floor elevation of the houses fronting the street, thereby impelling the need for deep excavation in the roadway for sewer lines.
Nieuw Nickerie is located on the east bank of the Nickerie River near its mouth in the Atlantic Ocean. The topography of the region is typical of the coastal plain presenting a flat swampy terrain. The soil consists of a top layer of impervious sandy clay 30 to 40 m thick with sand underneath. The boundaries of the sewerage zone encompass the area served by the water supply system.
POpulation Served
The design population was estimated on the basis of the saturation of the area within the city limits. A population of 16,000 was obtained by this method, and it corresponds to the projection to 1976 of the present population of 11,000 at the growth rate of the last 10 years. After 1976 the excess population will be taken care of by the development of a new area adjacent to the present city limits. This development is now under study by the Planning Office of the Ministry of Public Works •
Design Ana1ys is
Collection system
Based on data furnished by the Surinam Water Company on water consumption in Nieuw Nickerie, the average design flow was estimated at 150 liters per capita per day; this includes domestic, commercial, and industrial contributions. A peaking factor of 2.5 was adopted for the collection system design. From this will result in an average daily flow of

- 104
32,400 m or 28.7 l/sec and a peak flow of 70 l/sec. Infiltration, based on an approximate ya1ue of 1,900 liters per centimeter of diameter per kilometer of pipe and averaged over the total collection system represents approxtmate1y 10% of the peak flow.
Design criteria for sewerage design were discussed in an earlier section.
In the design of the collection system all. initial depth of 1.50 m was used in order to assure that the crown of the sanitary sewers would be at a lower e1evat ion than the invert of the ditches of the storm drainage system. Pumping stations were installed when a depth of 5.50 m was reached.
Following are the pipe sizes and lengths included in the collection system force main and outfall. Pipe to be used will be either PVC or high density polyethylene.
6-in diameter 18,300 m 8-in diameter 400 m
10- in diameter 870 m l2-in diameter 580 m
Lift stations
Due to the flat terrain two lift stations were required, one in the eastern and other in the western sectors of town. Each lift station is preceded by a cODmlUnitor with a by-pass containing hand-cleaned bar screens. The wet wells were designed for 10-minute detention at average flow. Submersible pumps driven by electric motors will be used. The lift stations will be underground and will be installed as shown on Plan IV-23. Motor control center and liquid level control will be provided. A stand-by power plant with capacity to supply both lift stations will be installed.
Sewage outfall
As shown on Plan IV-30, the sewage will be pumped from the two wet wells to a l2-inch force main that ends in a manhole at the river bank from where it will flow by gravity to the outfall. The 12" f/J outfall line of PVC or high density polyethylene will advance 50 m into the river discharging through 10 diffusers set 3.0 m apart in the last 30 m of pipe.
Treatment
No treatment will be provided to the sewage prior to the discharge into the river for the following reasons:
a. The salinity of the Nickerie River at the point of discharge is such as to preclude the use of the water for irrigation or domestic purposes.
•
•
•

•
"
•
- 105
b. The muddy nature of the banks and bottom of the river makes it unattractive for recreational purposes.
c. There are no fishing or shellfish banks downstream fran the outfall.
d. There is an average dilution of the sewage in the order of magnitude of 1:50,000.
e. The only beneficial use of the river at this point is navigation, which is not affected by sewage at this rate of dilution.
Cost Estimate
The estimated cost of the project is 5f.875,000 distributed as follows:
Collection system Lift stations Force main and outfall Cont ingenc ies, etc.
Sf. 666,500 including house services 85,000 20,000
103,500
Sf. 875,000
ALBINA SYSTEM
The draWings for the Albina proposed sanitary sewerage system are included as Plans IV-35 to -42. Due to the fact that the progress of the city is based on the development of the river side as a resort area using the beaches for recreation, only a very high quality effluent may be discharged into the river. For this reason treatment by stabilization ponds was inc luded in the system. The city is served by a water supply system owned and operated by the Surinam Water Company. At present, the sewage is disposed of by means of septic tanks discharging either into infiltration fields or drainage ditches.
Location, Boundaries, and Description of the Area
Albina, the capital city of the District of Marowijne, is located on the left bank of the Marowijne River about 30 km from its mouth in the Atlantic OCean. The area is very flat; the city is built on slightly higher ground than the adjacent areas that stay flooded during the rainy season. The present design covers the area served by the water supply system. Extensions will be possible in the future to serve areas of residential and industrial expansion outside the present city limits.

- 106
Population Served
The design population was estimated on the basis of the saturation of the area within the city limits. A population of 4,300 was obtained by this method and corresponds to the projection of 1988 of the present population of 3,000 at the growth rate of the last 10 years.
The development of a resort area on the riverside downstream from Albina is under study in the Planning Bureau of the Ministry of Pub1 ic Works. This area is called Bamboo City and in the future will take care of the overflow population from Albina after urban saturation is reached in that town. Bamboo City will have its own independent sewerage system.
Des ign Analyses
Collection system
Based on data furnished by the Surinam Water Company on water consumption in Albina, the average design flow was estimated at 150 liters per capita per day, this includes domestic, commercial, and industrial contributions. A peaking factor of 2.0 was adopted for the collection
3,system design. From this will result an average daily flow of 675 m or 7.8 l/s and a peak flow of 15.6 l/s.
Design criteria for sewerage design were discussed in an earlier section.
In the design of the collection system an initial depth of 1.0 m was adopted to give adequate protection to the pipes.
Following are the pipe sizes and lengths included in the collection system and force main. Pipe to be used will be either PVC or high density polyethylene:
6-in diameter 8,500 m 8-in diameter 1,100 m
Lift station
Due to the flat terrain a lift station was required. The wet well was designed for 10 minutes' detention at average flow. Submersible pumps driven by electric motors will be used. The lift station will be underground and will be installed as shown on Plan IV-42. Motor control center and liquid level control will be provided. To ensure the reliability of operation a standby power plant will be installed.
Sewage treatment
A stabilization pond system was adopted as the means of sewage treatment. As shown in Plan IV-39, four ponds will be built-two anaerobic, one facultative, and one maturation.
..
•
..
•

4 UP
- 107
For reasons of improving the operating conditions of the ponds they were designed for the present population instead of the future population, but the design has a built-in expansion capacity of 50%, bringing it up to the future needs with little construction work.
The treated effluent will be discharged into a ditch leading to the.. Anjoemara Creek, from which it goes to the Marowijne River.
Cost Estimate for Albina System•
The estimated cost of the project is Sf.294,OOO, distributed as follows:
Collection system Sf. 159,000 Lift station 55,000 Force main 19,000 Stabilization ponds 8,000 Contingenc ies, etc. 53,000
Total Sf. 294,000
"
III

•
•
•
•

ANNEX 1
SEWER USE ORDINANCE
The responsible Government agency should adopt a sewer use ordinance which, with supporting regulations, will control the use of the public sewerage system and the private disposal of sewage and other liquid within its
• area of jurisdiction •
Article I - Definitions
Unless the context specifically indicates otherwise, the meaning of terms used in this ordinance shall be as follows:
Sec. 1. BOD (denoting Biochemical Oxygen Demand) shall mean the quantity of oxygen utilized in the biochemLca1 oxidation of organic matter
200C,under standard laboratory procedure five days at expressed in milligrams per liter.
Sec. 2. Building drain shall mean that part of the lowest horizontal piping of a drainage system which receives the discharge from soil, waste and/or other drainage pipes inside the walls of the build ing and conveys it to the building sewer, beginning one and half (1.5) meters outside the inner face of the building wall.
Sec. 3. Building sewer shall mean the extension from the building drain to the public sewer or other place of disposal.
Sec. 4. Combined sewer shall mean a sewer receiving both surface run-off and sewage.
Sec. 5. Garbage shall mean solid wastes from the domestic and commercial preparation, cooking, and dispensing of food, and from the handling, storage, and sale of products.
Sec. 6. Industrial wastes shall mean the liquid wastes from industrial manufacturing processes, trade, or business, as distinct from sanitary sewage.
Sec. 7. Natural outlet shall mean any outlet into a watercourse, pond, ditch, lake, or other body of surface or ground water ••
Sec. 8. Person shall mean any individual, firm, company, associate, society, corporat ion, or group.
Sec. 9. Public sewer shall mean a sewer in which all owners of adjoining properties have equal rights and which is controlled by public authority.
(AI-I)
Sec. 10. Sanitary sewer shall mean a sewer which carries sewage and to which storm, surface, and ground waters are not intentionally admitted.
Sec. 11. Sewage shall mean a combination of the water-carried wastes from residences, business buildings, institutions, and industrial establishments together with such ground, surface, and storm water as may be present.
Sec. 12. Sewage treatment plant shall mean any arrangement of devices and !t
structures used for treating sewage.
Sec. 13. Sewage works shall mean all facilities for collecting, pumping, treating, and disposing of sewage.
Sec. 14. Sewer shall mean a pipe or conduit for carrying sewage.
Sec. 15. Shall is mandatory; may is permissive.
Sec. 16. Slug shall mean any discharge of water, sewage, or industrial waste which in concentration of any given constituent or in quantity of flow exceeds for any period of duration longer than fifteen (15) minutes more than five (5) times the average twentyfour (24) hour concentration or flow during normal operation.
Sec. 17. Storm drain (sometimes called storm sewer) shall mean a sewer that carries storm and surface water and drainage, but excludes sewage and industrial wastes other than unpolluted cooling water.
Sec. 18. Superintendent shall mean the Superintendent of Sewage Works or his authorized deputy, agent, or representative.
Sec. 19. Suspended solids shall mean solids that either float on the surface of, or are in suspension in, water, sewage, or other liquid and which are removable by laboratory filtering.
Sec. 20. Watercourse shall mean a channel in which a flow of water occurs, either continuously or intermittently.
Article II - Use of Public Sewers Required .. Sec. 1. It shall be unlawful for any person to place, deposit, or permit
to be deposited in any unsanitary manner on public or private •property, any human or animal excrement, garbage, or other objec
tionable waste.
Sec. 2. It shall be unlawful to discharge to any natural outlet any sewage or other polluted waters, except where suitable treatment has been provided in accordance with subsequent provisions of this ordinance.
(Al-2)

Sec. 3. Except as hereinafter provided, it shall be unlawful to construct or maintain any privy, privy vault, septic tank, cesspool, or other facility intended or used for the disposal of sewage.
•
Sec. 4. The owner of all houses, buildings, or properties used for human occupancy, employment, recreation, or other purposes, abutting on any street or right-of-way in which there is now located or may in the future be located a public sanitary or combined sewer, is hereby required, at his expense, to install suitable toilet facilities therein, and to connect such facilities directly with the proper public sewer in accordance with the provisions of this ordinance, within ••• days after date of official notice to do so, provided that said public sewer is within thirty (30) meters of the property line.
Article III - Private Sewage Disposal
Sec. 1. Where a public sanitary or combined sewer is not available under the provisions of Article II, Section 4, the building sewer shall be connected to a private sewage disposal system complying with the provisions of this article.
Sec. 2. Before commencement of construction of a private disposal system the owner shall first obtain a written permit signed by the Superintendent. The application for such a permit shall be made on a form furnished by the responsible Government agency which the applicant shall supplement by any plans, specifications, and other information as are deemed necessary by the Superintendent. A permit and inspection fee of Sf ••••• shall be paid to the agency at the time the application is filed.
Sec. 3. A permit for a private sewage disposal system shall not become effective until the installation is completed to the satisfaction of the Superintendent. He shall be allowed to inspect the work at any stage of construction and, in any event, the applicant for the permit shall notify the Superintendent when the work is ready for final inspection, and before any underground portions are covered. The inspection shall be made within hours of the receipt of the notice by the Superintendent.
•
Sec. 4. The type, capacities, location, and layout of a private sewage disposal system shall comply with all recommendations of the responsible public agency. No permit shall be issued for any private sewage disposal system employing subsurface soil absorption facilities where the area of the lot is less than ••• square meters. No septic tank or cesspool shall be permitted to discharge to any natural outlet.
(Al-3)

Sec. 5.
Sec. 6.
Sec. 7.
Sec. 8.
Sec. 1.
Sec. 2.
Sec. 3.
Sec. 4.
At such a time as a public sewer bec omas available to a property serviced by a private sewage disposal system as provided in Article III, Sec. 4, a direct connection shall be made to the public sewer in compliance with this ordinance, and any septic tanks, cesspools, and similar private sewage disposal facilities shall be abandoned and filled with suitable material.
The owner shall operate and maintain the private sewage disposal facilities in a sanitary manner at all times, at no expense to the agency.
No statement contained in this article shall be constructed to interfere with any additional requirements that may be imposed by the Health Officer.
When a public sewer becomes available, the building sewer shall be connected to said sewer within ••• days and the private sewage disposal system shall be cleaned of sludge and filled with clean gravel or dirt.
Article IV - Building Sewers and Connections
No unauthorized person shall uncover, make any connections with or opening into, use, alter, or disturb any public sewer or appurtenance thereof without first obtaining a written permit from the Superintendent.
There shall be two (2) classes of building sewers permits: a) for residential and commercial service, and b) for service to establishments producing industrial wastes. In either case, the owner, or his agent, shall make application on a special form furnished by the agency. The permit application shall be supplemented by any plans, specifications, or other information considered pertinent in the judgement of the Superintendent. A permit and inspection fee of Sf ••••• for an industrial building sewer permit shall be paid to the agency at the time the application is filed.
All costs and expense incident to the installation and connection of building sewer shall be borne by the owner. The owner shall indemnify the city from any loss or damage that may directly or indirectly be occasioned by the installation of the building sewer.
A separate and independent building sewer shall be provided for every building; except where one buildtng stands at the rear of another on an interior lot and no private sewer is available or can be constructed to the rear building through an adjoining alley, court, yard, or driveway, the building sewer from the
(Al-4)
•
•
•
________l..

front building may be extended to the rear building and the whole considered as one building sewer.
Sec. 5. Old building sewers may be used in connection with new buildings only when they are found, on examinat ion and test by the Superintendent, to meet all requirements of this ordinance.
Sec. 6. The size, slope, alignment, materials of construction of a building sewer, and the methods to be used in excavating, placing the
;f' pipe, jointing, testing, and backfilling the trench shall all conform to the requirements of the building and plumbing code or other applicable rules and regulations of the agency.
Sec. 7. Whenever possible, the building sewer shall be brought to the building at an elevation below the basement floor. In all buildings in which any building drain is too low to permit gravity flow to the public sewer, sanitary sewage carried by such building drain shall be lifted by an approved means and discharged to the building sewer.
Sec. 8. No person shall make connection of roof downspouts, exterior foundation drains, or other sources of surface run-off or ground water to a building sewer or building drain which in turn is connected directly or indirectly to a public sanitary sewer.
Sec. 9. The connection of the building sewer into the public sewer shall conform to the requirements of the building and plumbing code or other applicable rules and regulations of the agency. All such connections shall be made gastight and watertight. Any deviation from the prescribed procedures and materials must be approved by the Superintendent.
Sec. 10. The applicant for the building sewer permit shall notify the Superintendent when the building sewer is ready for inspection and connection to the pub lic sewer. The connect ion shall be made under the supervision of the Superintendent or his representat ive.
Sec. 11. All excavations for building sewer installation shall be adequately guarded with barricades and lights so as to protect the public from hazard. Streets, sidewalks, parkways, and other public properties disturbed in the course of the work shall be restored in a manner satisfactory to the agency.
Article V - Use of Public Sewers
Sec. 1. No person shall discharge or cause to be discharged any storm water, surface water, ground water, roof run-off, subsurface drainage, uncontaminated cooling water, or unpolluted industrial process water to any sanitary sewer.
(Al-5)

Sec. 2. Storm water and all other unpolluted drainage shall be discharged to such sewers as are specifically designated storm sewers or combined sewers, or to a natural outlet approved by the Superintendent. Industrial cooling water or unpolluted process water may be discharged, on approval of the Superintendent, to a storm sewer, combined sewer, or natural outlet. -
Sec. 3. No person shall discharge or cause to be discharged any of the following described waters or wastes to any public sewers:
a. Any gasoline, benzene, naphtha, fuel oil, or other flammable or explosive liquid, solid, or gas.
b. Any waters or wastes containing toxic or poisonous solids, liquids, or gases in sufficient quantity, either singly or by interaction with other.wastes, to injure or interfere with any sewage treatment process, to constitute a hazard to humans or animals, create a public nuisance, or create any hazard in the receiving waters of the sewage treatment plant, including but not 1nnited to cyanides in excess of two (2) milligrams per liter as CN in the wastes discharged to the public sewer.
c. Any water or wastes having a pH lower than 5.5 or having any other corrosive property capable of causing damage or hazard to structures, equipment, and personnel of the sewage works.
d. Solid or viscous substances in quantities or of such size capable of causing obstruction to the flow of sewers, or other interference with the proper operation of the sewage works such as, but not limited to, ashes, cinders, sand, mud, straw, shavings, metal, glass, rags, feathers, tar, plastics, wood, garbage, whole blood, paunch manure, hair and entrails, paper dishes, cups, milk containers, etc.
Sec. 4. No person shall discharge or cause to be discharged the following described substances, materials, waters, or wastes if it appears likely in the opinion of the Superintendent that such wastes can harm either the sewers, sewage treatment process, or pumps and equipment, have an adverse effect on the receiving stream, or otherwise endanger life, limb, public property, or • constitute a nuisance. In forming his opinion as to the acceptability of these wastes, the Superintendent will give consideration to such factors as the quantities of subject wastes in relation to flows and velocities in the sewers, material of construction of the sewers, nature of the sewage process treatment, capacity of the sewage treatment plant, and other pertinent factors. The substances prohibited are:
a. Any liquid or vapor having a temperature higher than sixtyfive (65)OC.
(Al-6)

Sec. 5.
•
b. Any water or waste containing fats, wax, grease, or oils, wh~ther emulsified or not in excess of one hundred (100) mg/1, or containing substances which may solidify or become viscous at temperatures between zero (0) and sixty-five (65)oC.
c. Any garbage.
d. Any waters or wastes containing strong acid iron pickling wastes or concentrated plating solutions, whether neutralized or not.
e. Any waters having a pH higher than 9.5.
f. Any waters or wastes containing iron, chromium, copper, zinc, and similar objectionable or toxic substances, or wastes exerting an excessive chlorine requirement, to such degree that any such material received in the composite sewage at the sewage treatment plant exceeds the limits established by the Superintendent for such materials.
g. Materials that exert or cause:
1. Unusual concentrations of inert suspended solids (such as, but not limited to, Fullers' earth, lime slurries, and lime residues) or of dissolved solids (such as, but not limited to, sodium chloride and sodium sulfate).
2. Excessive discoloration (such as, but not limited to, dye wastes and vegetable tanning solutions).
3. Unusual volume of flow or concentration of wastes consti tuting "slugs" as defined herein.
If any wastes are discharged, or are proposed to be discharged to the public sewers, which waters contain the substances or possess the characteristics enumerated in Sec. 4 of this Arti cle, and which, in the judgement of the Superintendent, may have a deleterious effect upon the sewage works, equipment, or receiving waters or which otherwise create hazard to life or constitute a public nuisance, the Superintendent may:
a. Reject the wastes •
b. Require pretreatment to an acceptable condition for discharge to the public sewers.
c. Require control over the quantities and rates of discharge.
If the Superintendent permits the pretreatment or equalization of waste flows, the design and installation of the plants and
(Al-7)

Sec. 6.
Sec. 7.
Sec. B.
Sec. 9.
equipment shall be subject to the review and approval of the Superintendent, and subject to the requirements of all applicable codes, ordinances, and laws.
Grease, oil, and sand interceptors shall be provided when, in the opinion of the Superintendent, they are necessary for the proper handling of liquid wastes containing grease in excessive amounts, or any flammable wastes, sand, or other harmful ingredients; except that such interceptors shall not be required for private living quarters or dwelling units. All interceptors shall be of a type and capacity approved by the Superintendent, and shall be located as to be readily and easily accessible for cleaning and inspection.
Where preliminary treatment or flow-equalizing facilities are provided for any waters or wastes, they shall be maintained continuously in satisfactory and effective operation by the owner at his expense.
When required by the Superintendent, the owner of any property serviced by a building sewer carrying industrial wastes shall install a suitable control manhole together with such necessary meters and other appurtenances in the building sewer to facilitate observation, sampling, and measurement of the wastes. Such manhole when required shall be accessibly and safely located and shall be constructed in accordance with plans approved by the Superintendent. The manhole shall be installed by the owner at his expense, and shall be maintained by him so as to be safe and accessible all the time.
All measurements, tests, and analyses of the character is tics of waters and wastes to which reference is made in this ordinance shall be determined in accordance with the latest edition of "Standard Methods for the Examination of Water and Waste Water," published by the American Public Health Association, and shall be determined at the control manhole provided, or upon suitable samples taken at said control manhole. In the event that no control manhole has been required, the control manhole shall be considered to be the nearest downstream manhole in the public sewer to the point at which the building sewer is connected. Sampling shall be carried out by customarily accepted methods to reflect the effect of constituents upon the sewage works, and to determine the existence of hazard to life, limb, and property. (The particular analyses involved will determine whether a twenty-four (24) hour composite of all outfalls of a premise is appropriate or whether a grab sample or samples should be taken. Normally, but not always, BOD and suspended solids analyses are obtained from 24-hour composite of all outfall, whereas pH's are determined from periodic grab samples.)
(AI-B)
, <
...
•
•
.
Article VI - Protection from Damage
Sec. 1. No unauthorized person shall maliciously, willfully, or negligently break, damage, destroy, uncover, deface, or tamper with any structure, appurtenance, or equipment which is a part of the sewage works. Any pers on violat ing this provis ion shall be subject to immediate arrest under charge of disorderly conduct.
Article VII - Power and Authority of Inspectors
Sec. 1. The Superintendent and other duly authorized employees of the agency bearing proper credentials and identification shall be permitted to enter all properties for the purposes of inspection, observation, measurement, sampling, and testing, in accordance with the provisions of this ordinance.
Article VIII - Penalties
Sec. 1. Any person found to be violating any provision of this ordinance except Article VI shall be served by the agency with written notice stating the nature of the violation and providing a reasonable time limit for the satisfactory correction thereof. The offender shall within the period of time stated in such notice, permanently cease all violations.
Sec. 2. Any person who shall continue any violation beyond the time limit provided for in Article VIII, Section 1, shall be guilty of a misdemeanor, and on conviction thereof shall be fined in the amount not exceeding Sf•.••• for each violation. Each day in which any such violation shall continue shall be deemed a separate offense.
Sec. 3. Any person violating any of the provisions of this ordinance shall become liable to the agency for any expense, loss, or damage caused the agency by reason of such violation.
Article IX
.. Sec. 1. All by-laws
repealed • or parts of by-laws in conflict herewith are hereby
Sec. 2. The invalidity of any section, clause, sentence, or provision of this ordinance shall not affect the validity of any other part of this ordinance which can be given effect without such invalid part or parts.
(Al-9)

ANNEX 2
DESIGN BASIS - SURFACE WATER TREATMENl' PLANT (SANTIGRON)
TOTAL FLCltl FOR MASTER PLAN STUDY
For flow design a constant figure of 100 l/cap/day has been used as an average during a 2(j.-hour period.
Q far 1987 .. 10,000 m3/day (24-hour pumping rate) Q for 1987 = 15,000 m3/ day (16-hour pumping rate) = 4,150 gpm Q for 2001 • 17,000 m3/day (24-hour pumping rate) Q for 2001 .. 25,500 m3/day (16-hour pumping rate) .. 7,050 gpm
a. Overload Factor: The plant has been designed with an overload factor of 25%.
Rating Overload
Year Mgd Gpm Cfs Mgd Gpm Cfs
Stage I 1987 4.0 4,150 6.2 5.0 6,200 7.7
Stage II 2001 6.8 7,050 10.5 8.5 8,810 12.6
b. Clarifier Rating: 1.0 gpm/ft2
Detention time: 2 hrs .. 120 min
c. Flash Mixer: Detention time: 1/2 min
d. Rapid Gravity Filters: Loading rate : 2.0 gpm/ft2
Backwash rate: 20.0 gpm/ft2
e. Sludge Drying Beds: Loading rate: 2.0 mgd/acre (if used)
f. Backwash Rate Beds: Loading rate: 3.0 mgd/acre (if used)
(A2-1)
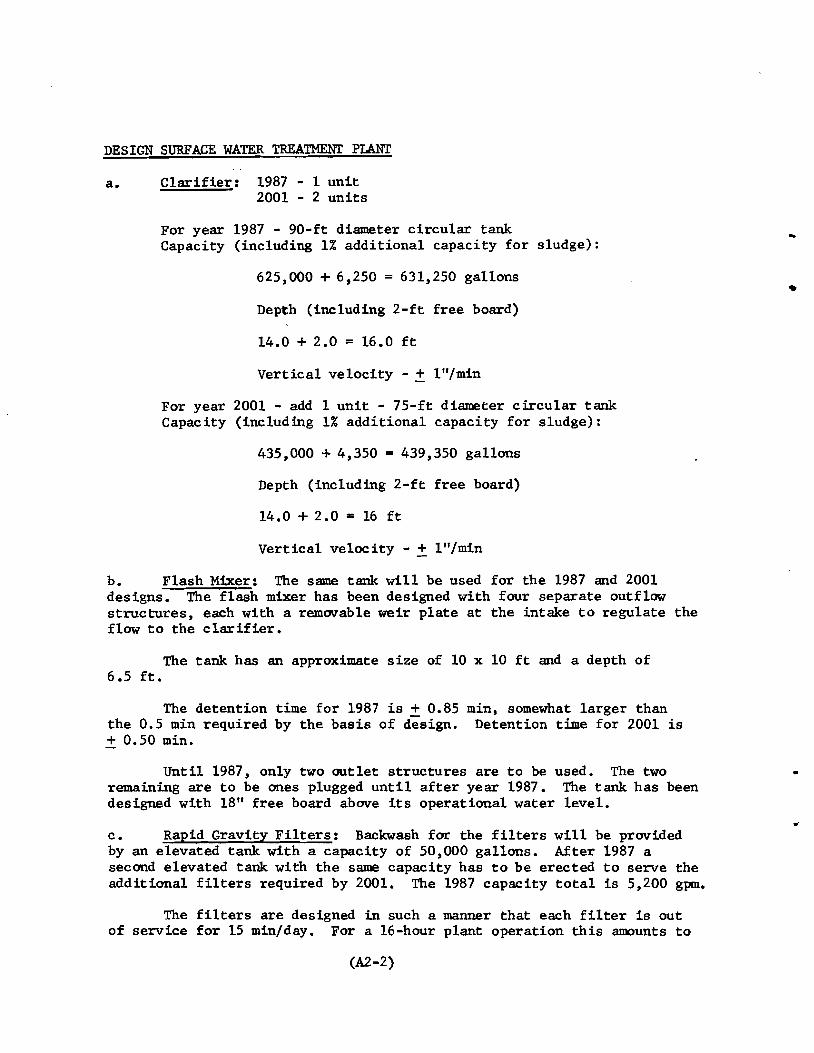
DESIGN SURFACE WATER TREATMENT PLANT
a. Clarifier: 1987 2001
- 1 unit - 2 units
For year 1987 - 90-ft diameter circular tank Capacity (including 1% additional capacity for sludge):
.. 625,000 + 6,250 = 631,250 gallons
Depth (including 2-ft free board) •
14.0 + 2.0 = 16.0 ft
Vertical velocity - ± I"/min
For year 2001 - add 1 unit - 75-ft diameter circular tank Capacity (including 1% additional capacity for sludge):
435,000 + 4,350 = 439,350 gallons
Depth (including 2-ft free board)
14.0 + 2.0 .. 16 f t
Vertical velocity - + I"/min
b. Flash Mixer: The same tank will be used for the 1987 and 2001 designs. The flash mixer has been designed with four separate outflow structures, each with a remOV'able weir plate at the intake to regulate the flow to the clarifier.
The tank has 6.5 ft.
an approximate size of 10 x 10 ft and a depth of
The detention time for 1987 is + 0.85 min, somewhat larger than the 0.5 min required by the basis of design. Detention time for 2001 is + 0.50 min.
Until 1987, only two outlet structures are to be used. The two remaining are to be ones plugged until after year 1987. The tank has been designed with 18" free board above its operational water level.
c. Rapid Gravity Filters: Backwash far the filters will be provided by an elevated tank with a capacity of 50,000 gallons. After 1987 a second elevated tank with the same capacity has to be erected to serve the additional filters required by 2001. The 1987 capacity total is 5,200 gpm.
The filters are designed of service for 15 min/day. For
in such a manner that each filter is out a l6-hour plant operation this amounts to
(A2-2)

•
,
16 x 4 = 64 quarter hours of time, or 1/64 x 100% = 1.5% of a l6-hour run.
Five filters are planned, and, if washed every day, the total sur
face area has to be enlarged by 155 0.3%.
Area of each filter (including 0.3% additional total area):
22,600 + 8 = 2,608 ft = 522 ft2 = 49 m2, use 5 x 10 m 5 5
The backwash flow for each filter = 522 x 20.0 = 10,440 gpm
The elevated tank capacity is 50,000 gallons. Time to empty tank • 50,000 _
10 440 - 4.8 min, say 5.0 min., The backwash volume required/day is 5 x 50,000 = 250,000 gallons.
Two main gutters are designed for each filter, with dimensions of 1.5 x 2.85 ft (including 0.25 ft of free board). The capacity of each is 5,220 gpm. Five side gutters are designed for each filter, with dimensions of 1.0 x 1.40 ft (including 0.25-ft free board). The capacity of each is 1,045 gpm.
Five additional filters are planned for the year 2001 requirement, necessitating provision of another 50,000-gallon elevated tank.
The additional capacity required is 8,810 - 5,200 gpm = 3,610 gpm.
The area of each filter (including 0.3% additional total area):
1,805 + 5.4 = 362 ft2 = 34 m2, use 5 x 7 m 5
The backwash flow for each filter = 362 x 20.0 = 7,240 gpm with the elevated tank capacity of 50,000 gallons, the time required to empty tank
50,000= 7,240 = 6.9 min, say 7.0 min.
The backwash volume required/day is 5 x 50,000 = 250,000 gallons.
Two main wash gutters are designed for each filter, with dimensions of 1.5 x 2.30 ft (including 0.25-ft free board). The capacity of each is 3,620 gpm, Four side gutters are designed for each filter, with dimensions of 1.0 x 1.55 ft (including 0.25-ft free board). Capacity each 905 gpm.
(A2-3)

1
d. Chemicals: Assumptions were made of the chemical requirements in lb/day. Actual t~sting of the Saramacca River water was limited to that performed at Uitkijk and only for pH, Cl, and Fe. Project staff found that during the raonths of May and June 1970, the average pH was approximately 6.0, Cl was approximately 17 ppm, and Fe was approximately 0.15 ppm. An extensive laboratory testing program will have to be initiated by the Government at Santigron should conditions develop which require the selection of this surface water treatment plant to supply the rural areas in the manner defined in this master plan study.
The following approximate chemical requirements were utilized in order to arrive at operational cost estimates. Exact requirements would, of course, be available following extensive analysis of the raw water.
..
•
Chemical Max. Dosage ppm
19B7 Q = 5.0 mgd
2001 Q = B.5 mgd
Chlorine
pre 5.0 5x5xB.33=2l0 lb 5xB.5xB.33=355 lb
post 1.5 1.5x5xB.33-62.5 Ib 1.5xB.5xB.33=107 lb
Alum 35 35x5xB.33=1,460 lb 35xB.5xB.33=2,4BO 1
Lime
Flocculation 15 l5x5xB.33=625 lb l5xB.5xB.33=1,070 1
Corrosion control 20 2Ox5xB.33=B33 lb 2OxB.5xB.33=1,420 1
1 ppm = B.33 lb/million gallons
(1) For year 19B7 the alum L-A12 (804) 3.14 H2~_/ requirement is as follows:
The required 1,460 pounds is to be applied in 24 hours since projec •staff assumed only 16 hours operation (two work shifts):
2416 x 1,460 lb = 2,200 lb to be applied in 16 hours
Liquid alumL~12 (804) 3.14 H20_/ with a concentration of 35% dry aluminum sulfate contains 3.85 lb.
At 2,200 lb/day x 30 x 1 gal = 17,200 gallons dry aluminum sulfate 3.B5 lb
required/month.
(A2-4)

Since one gallon of dry aluminum sulfate weighs 11.3 1b, the total required per month is 17,200 x 11.3 1b = 194,000 lb.
Alum is available in 50-kg bags. Therefore, the total required per month is approximately 1,760 bags of 50 kg each.
For year 2001 the alum requirement is as follows:
For a 16-hour-per-day operation the requirement is 24 x 2,480 1b• 16 = 3,700 1b/day.
Dry aluminum sulfate required per month:
1 gal3,700 1b/day x 30 x 3.85 1b- 28,800 gallons
Total additional volume required: 28.800 - 17,200 = 11,600 gallons per month.
11,600 x 11.3 1b = 131,000 1b/month
Additional number of 50-kg bags required - 1,200/month
(2) For year 1987 the chlorine requirement is as follows:
Chlorination (use 1-ton containers)
The requirement for prech1orination is 210 1b and for postch1orination is 62.5 1b per 24 hours since project staff assumed only 16 hours operation (two work shifts) for prech1orination:
24Prechlorinat ion: 16 x 210 1b = 315.0 1b
Postch1orination: 62.5 1b Total 377.5 1b/day
If six one-ton containers are used, the supply will last 13,200 1b 371.5 1b/day
= 35 days. Approximate one-month supply.
For year 2001, the chlorine requirement is as follows:
- same requirement on operational time as 1987.
24Prechlorinat ion: 16 x 355 1b = 530 1b
(A2-5)

i
Postch1orination: 107 1b Total 637 1b/day
If ten one-ton containers are used, supply will last 22,000 1b 637 1b/day
• 34.5 days. Approximate one month supply.
(3) For year 1987 the lime requirement is as follows:
Lime (quick lime)
The requirement for flocculation is 625 1b and for corrosion control 833 1b per 24 hours stnce project staff assumed only 16 hours operation (two work shifts) for flocculation.
24Flocculation: 16 x: 625 Ib = 940 1b
Corrossion control: 833 1b
Total 1,773 1b/day
The weight of dry lime is 40 1b/ft3 with a density of 96%
Quick lime density is approximate 73%
Total volume required is 1,773 .73 = 34 0 ft3/d40 x .96 • ay
Total storage volume for one month: 30 x 34 = 1,020 ft3
For year 2001 the lime requirement is as follows:
Same requirements on operational time as 1987
24Flocculation: 16 x 1,070 1b • 1,600 1b
Corrosion control: 1,420 1b
Total 3,020 1b/day
Total additional volume required:
(3,020-1,773) .73 = 23 7 ft3/day40 x .96 •
Total additional volume for one month: 30 x 23.7 = 711 ft3
(A2-6)
..
•

e. Ground and Elevated Storage: In order to establish the required storage at the filter plant, the entire master plan area had to be examined. Following are the required storage volumes for the major areas to be served:
1987 1987 2001 20011987
Ground Elevated Ground ElevatedArea Supply
Stor~e Storage Storage Stor~ge.. m3Jday m3 m3 m3 m
r.,. Pad van Wanic a 2,500 1,250 125 2,100 210
CODIIleWijne 5,000 2,500 250 4,200 420
Future developments 2,500 1,250 125 2,100 210
Total 10,000 5,000 500 8,400 840 500 840
5,500 9,240
Total for 1987: 5,500 Total for 2001: 9,240
Storage for 1987
Since no reservoirs were planned at the sites to be developed in the future due to their scattered locations, storage was planned at the filter plant. In the Commewijne area only a small ground storage reservoir was planned for 1987 at Meerzorg, with a capacity including the elevated tank of approximately 845 m3.
Total storage volume has been planned at the filter plant of 60% x 5,500 m3 = 3,330 m3. Three separate reservoirs of 12.0 x 18.5 x 5.0 m should be able to handle this storage requirement. No elevated tanks were planned. Booster pumps were chosen to maintain the pressure in the main feeder serving the master plan areas.
Storage for 2001
• After 1987 the pressure in the main feeder would drop considerably because of the higher water demands. A booster station has been planned at the existing Kwatta-Leidingen treatment plant to increase the pressure in order to provide adequate flows in the Commewijne area. By this time enough storage capacity will have been built in Commewijne to provide an adequate factor of safety in the water supply in case of power or equipment failures. Therefore, no additional storage tanks are to be built at the filter plant site.
(A2-7)

It is planned that the Pad van Wanica area will have its own storage reservoir with a year 2001 expansion possibility. Project staff gave special emphasis to the need for backup in case of failure at the boosterplant location of the surface water treatment plant.
..
..
(A2-8)

ANNEX 3
DESIGN BASIS - GROUND WATER TREATMENT PLANT (KWATTA-LEIDINGEN)
SOURCE
.. Ground water has been used as a source for this treatment plant.
Elevation of ground water before pumping is approximately 2.0 meters below the ground surface. Drawdown at the maximum allowable pumping rate for this well is approximately 500 meters.
Chemical quality was found as follows:
Residue
7 162 ppm 3.0 179 770
pH C1- Fe +++
FLCM DESIGN
The following basis has been used for flow design:
Period Average Daily Consumption Population Growth (%)
1973
1980
1987
- 1980
- 1987
- 2002
80 l/c/d
100 l/c/d
125 l/c/d
4
4
4
SCHEDULE FOR INSTALLATION
Stage 1 to be installed in 1973 (present) Stage 2 to be installed in 1980 Stage 3 to be installed in 1987
DESIGN POPULATION
Stage 1 is design for population in 1980 Stage 2 is design for population in 1987 Stage 3 is design for population in 2002
(A3-1)

Total PopulationDesign Year % ConnectedPopulation Connected
Stage 1 (present) 1980 17,000 60 10,200
Stage 2 (1980) 1987 *25,000 95 23,800
Stage 3 (1987) 2002 45,000 100 45,000
*Includes 2,500 for possible Jarikaba extension
Water Consumption Year Average Daily Consumption
Rating 18 Hours of Pumping m 3/hr Mgd gpm cfs
Stage 1
Stage 2
Stage 3
1973
1980
1987
820 m 3
32,380 m
35,600 m
45.5
132
310
.29 200
.83 575
1.95 1,350
.45
1.29
3.02
DESIGN OF WELL PUMP
Stage 1
Q OIl 200 gpm
T.D.H 55 ft. n = 0.60OIl
P 200 x 55 = 4.6 ( 7 5 H P ) H.. 3,970 x 0.60 . use. ••
This pump is capable of delivering 200 gpm with H = 90 ft. (+ 35 ft over pressure).
Stage 2
Q = 575 gpm
T.D.H .... 70 ft. n ... 0.74
H.P. 575 x 3,970 x
70 0.74 = 13.5 (use 15 H.P.)
(A3-2)
•
..

TREATMENl' PLANT PROCESS
Aeration is used to reduce the iron concentration from the unacceptable level of approximately 3.0 ppm to a level of approximately 0.3 ppm. It also removes the dissolved gases such as C02 and H2 S wh~h are present in small quantities. With the typical aeration approach used on this fil ter plant the taste and odor of the ground water will be improved considerably.
Spray aeration of the water has been applied on this project using spray nozzles with a pressure at the nozzles of approximately 8 psi. The diameters of the nozzles are kept in the 1" range in order to prevent clogging. The nozzles are located some 4 feet above the maximum water level in the aeration chambers. The chambers have an operating depth of approximately 6 feet. The aeration structure has been fitted with louvers to allow air circulation and containment of the water.
After ox idat ion of iron and removal of the gases, the effluent is discharged into sand filters (rapid gravity sand filters). These sand filters are essential in order to remove the iron particles remaining in suspension after the aeration process. The filter bed for this treatment plant will have sand with a uniformity coefficient of approximately 1.6 and a depth of 3 feet. Total gravel depth has been kept at 1 1/2 feet. The filters have been designed with an underdrain system consisting of main drain with laterals for each filter compartment. All underdrains are perforated at the bottom, ensuring uniform withdrawal of the water and uniform distribution of the wash water without excessive loss of head.
It was found that after sand filtration the pH dropped somewhat in most treatment plants in the country. It is therefore a general practice to "po'lLsh " the filtered effluent by discharging the sand-filtered water in shell filters. This brings the pH up again and improves the overall quality of the water, including taste. The size of the shell filters is kept the same as designed for the sand filters. Shells for this purpose are readily available in the country and therefore are relatively cheap for this ·purpose. Backwash capabilities are the same for both sand and shell filters. It is the intention to use only one sand filter first and make complete chemical analyses of its effluent. After this is known, decisions will be made to use a second sand filter or a shell filter instead.
There is enough flexibility in the plant to make all necessary adjustments as far as filtration is concerned.
All filtered water will be stored in ground storage tanks located adjacent to the filters. From here the water will be pumped into an elevated storage tank which provides the distribution system with reliable pressures and flows.
(A3-3)

Water levels in the plant are electronically controlled by electrodes which are also c~lnected to the source of electrical supply. The electrodes in the filter and aeration units control the well pumps. The electrodes in the elevated tank control the ground storage pumps.
The electrical system has been designed in such a manner that it can be connected to a portable generator in case of electrical line system failure.
AERATION UNITS
The aeration units have been designed for a flow based on an l8-hour pumping rate in stage 2 (1987).
Use 24 nozzles No. 15 B nozzles Capacity each nozzle = 24 gpm Total Q = 575 gpm
After 1987 an additional capacity of 775 gpm will be required.
Space for extension for this future aeration room is provided in front of existing aeration room.
SAND AND SHELL FTI.TERS
The rapid sand filters have been designed for a flow based on an l8-hour pumping rate in stage 2 (1987).
Loading rate 2 gpm/sq. ft. Backwash rate 22.5 gpm/sq. ft.
575Area required --2-- = 290 sq. ft.
Two filters were recommended (one sand filter and one shell filter)
Area each filter 320 sq. ft.
After 1987 an additional area of 355 sq. ft. will be required. Space for extension is allowed in the design.
Future area will be 640 sq. ft. 1350Load ing rate 640 ... 2.14 gpm/sq. ft.
BACKWASHING
Backwash ing should be done in offpeak hours us ing water from the elevated storage tank.
(A3-4)
..
•
•

Washtng time approximately 5 min. (washing each filter at a different time).
Capacity of elevated storage tank is 40,000 gallons.
Total volume of water required for backwashing is 36,000 gallons.
In offpeak hours the total capacity of the elevated storage tank can be used without refilling the tank.
Wash gutters were designed using the empirical formula: Q=1.9l BZ 1.5
CLEAR WATER STORAGE
a) Ground storage tank
The capacity of the ground storage tank has been based on 50% of the average daily consumption in 1987.
3 3 3)50% of 2,380 m = 119 m (use 40,000 gallons = 150 m
For year 2002:
3 35% of 5,600 = 280 m (use additional 150 m )
Space for extension is provided behind existing elevated storage.
CLEAR WATER PUMPS
Turbine pumps were recommended for pumping from clear water storage to the elevated storage.
Capacity based on an l8-hour pumping rate:
Stage 1
Q = 200 gpm
T.D.H. = 160 ft. n = 0.68
200 x 160 H.P. = 3,970 x 0.68 = 11.8 (use 12 H.P.)
Stage 2
Q '" 575 gpm
(A3-5)

I
I
>
f T.D.H. = 160 ft.
575 x 160 H.P. • 3,970 x 0.68 m 34 (use 35 H.P.)
DISTRIBUTION SYSTEM
Analysis of the distribution system for pipe size determination was made on the basis of the Hardy Cross method.
Rough calculations were made using the following criteria:
1 Peak flow = 1, 150 gpm* 2 No pipe size smaller than 3" was used.
3 Pressure at the most distant point is 20 psi. (at one junction 30 psi)
4 C = 120 (roughness coefficient for A.C. and PVC pipe)
Computer analysis was used to check preliminary calculations.
The computer program used was a node-balancing type of analysis, based on a modified Hardy Cross method.
PVC pipe was recommended from 3-in to 6-in diameter and A.C. pipe for 8-in to 10-in diameter.
* Peak factor:
Peak flow :
2 1/2
= 2,300 x 2 1/2 • 250 m3/hr 24
= 1,100 gpm (1,150 gpm was used)
(A3-6)
..
•
..

•
o C E A N c
L
T
z
N
A
A
R
LT
B
KEY TO 1931 -1.'0 lMl -1961
RAINFALL 1965FIGURES 1966
~
Z ~
~ Z
::)
~ t!)
> J :::I: ~ U
Z
lLJ a: u,
ANNUAL RAINFALL (mm) SURINAM (PERIODS 1931- 1960.1961 - 1966, 1965 AND 1966),
AND Lo.CATION OF THE MAIN DISCHARGE GAUGING STATIONS (e)
ANNUAL RAINFALL SURINAM
FIG.I1l-1

•
AT ."'"
LE6END:
41' DISCHAR6E MEASUREMENT ./ STATION
• AUTOMATIC WATERLEVEL RECORDER
o STAFF GAU6E
( VILLA6E OR TOWN
jJ. FALLS OR RAPIDS
_.- WATERSHED
~ KILOMETRAGE, ZERO AT 15 m L WS DEPTH CONTOUR (11&5)
D DAILY WATER SAMPLIES
o 10 20 !I
KILOMETERS « l£l .> a:
l£la: > 4( a: u·
l£lu z4(
X ~
~4( l£la:
4( X• XVI o
4( o l£l a: 4(
l£l CD 4( Z 4( a: 0
-- ""''"t'»> ( / 4.~ . ...~
} . p'
1/.I \
Ai K E (,...1 II
If J I
t' , f. r oJ
---...'./-., '
70
FIG. Dr-2 SOURCE: HYD. RES. DIY. MIN. OF PUBLIC WORKS