,u·m·i - open...
TRANSCRIPT

Freeze-drying and solubility studies.
Item Type text; Dissertation-Reproduction (electronic)
Authors Patel, Suresh Dahyabhai.
Publisher The University of Arizona.
Rights Copyright © is held by the author. Digital access to this materialis made possible by the University Libraries, University of Arizona.Further transmission, reproduction or presentation (such aspublic display or performance) of protected items is prohibitedexcept with permission of the author.
Download date 04/07/2018 07:02:10
Link to Item http://hdl.handle.net/10150/184399

INFORMATION TO USERS
'rhe most advanced technology has been used to photograph and reproduce this manuscript from the microfilm master. UMI films the original text directly from the copy submitted. Thus, some dissertation copies are in typewriter face, while others may be from a computer printer.
In the unlikely event that the author did not send UMI a complete manuscript and there are missing pages, these will be noted. Also, if unauthorized copyrighted material had to be removed, a note will indicate the deletion.
Oversize materials (e.g., maps, drawings, charts) are reproduced by sectioning the original, beginning at the upper left-hand corner and continuing from left to right in equal sections with small overlaps. Each oversize page is available as one exposure on a standard 35 mm slide or as a 17" x 23" black and white photographic print for an additional charge.
Photographs included in the original manuscript have been reproduced xerographically in this copy. 35 mm slides or 6" x 9" black and white photographic prints are available for any photographs or illustrations appearing in this copy for an additional charge. Contact UMI directly to order.
,U·M·I Accessing the World's Information since 1938
300 North Zeeb Road, Ann Arbor, M148106-1346 USA


Order Number 8814267
Freeze-drying and solubility studies
Patel, Suresh Dahyabhai, Ph.D.
The University of Arizona, 1988
U·M·I 300 N. Zeeb Rd Ann Arbor, MI 48106


FREEZE-DRYING
SOLUBILITY STUDIES
by
Suresh Dahyabhai Patel
A Dissertation Submitted to the Faculty of the
DEPARTMENT OF PHARMACEUTICAL SCIENCES
In Partial Fulfillment of the Requirements For the Degree of
DOCTOR OF PHILOSOPHY
In the Graduate college
THE UNIVERSITY OF ARIZONA
1 9 8 8
1

THE UNIVERSITY OF ARIZONA GRADUATE COLLEGE
As members of the Final Examination Committee, we certify that we have read
the dissertation prepared by ____ Su_r_e_s_h __ D_a_h_y_a_h_h_a_i __ p_a_t_e_l ____________________ _
entitled FREEZE-DRYING AND SOLUBILITY STUDIES -----------------------------------------------------------------
and recommend that it be accepted as fulfilling the dissertation requirement
for the Degree of ____ ~D~o~c~t~o~r~o~f_P~h~1~·I~o~s~o~p~h~y~ ______________________________ _
L/"/ext Michael MaYer hn, Ph. D • Date
g:1t~. Date
Thomas Peterson, Ph.D. Date
~ L ileQZ1 ~~e,,' rishna Vemulapal11, Ph.D.
c:ttJls- 75. ~ Date
Walter Miller, Ph.D. Date
Final approval and acceptance of this dissertation is contingent upon the candidate's submission of the final copy of the dissertation to the Graduate College.
I hereby certify that I have read this dissertation prepared under my direction and recommend that it be accepted as fulfilling the dissertation requirement.
tion Director Date Samuel H. Yalkowsky, Ph.D.

2
STATEMENT BY AUTHOR
This dissertation has been submitted in partial fulfillment of requirements for an advanced degree at the University of Arizona and is deposited in the University Library to be made available to borrowers under rules of the Library.
Brief quotations from this dissert~tion are allowable without special permission, provided that accurate acknowledgement of source is made. Requests for permission for extended quotation from or reproduction of this manuscript in whole or in part may be granted by the head of the major department or the Dean of the Graduate College when in his or her judgment the proposed use of the material is in the interests of scholarship. In all other instances, however, permission must be obtained from the author.
SIGNED:_S_~ ___ :()_. _p_a._w ___ _

3
To my parents

4
ACKNOWLEDGEMENTS
I wish to express my deepest appreciation and thanks to the members of my Advisory Committee: Dr. Samuel Yalkowsky, Dr. Nair Rodriguez, Dr. Michael Mayersohn, Dr. G.K. Vemulapalli, Dr. Walter Miller, and Dr. Thomas Peterson.
Words are not adequate to describe the debt of gratitude lowe Dr. Yalkowsky, Dissertation Director, for his excellent guidance, training, encouragement, and sincere interest that he has shown in my development as a scientist and my research project.
Dr. Arne Pearlstein, and Dr. Michael Pikal of Eli Lilly and Company for sharing their expertise in the area of heat transfer and mathematical modeling.
I am indebted to my parents and brothers for their constant support and encouragement.
Lastly, I would like to thank my wife Smita for bearing with me these past few years.
1.
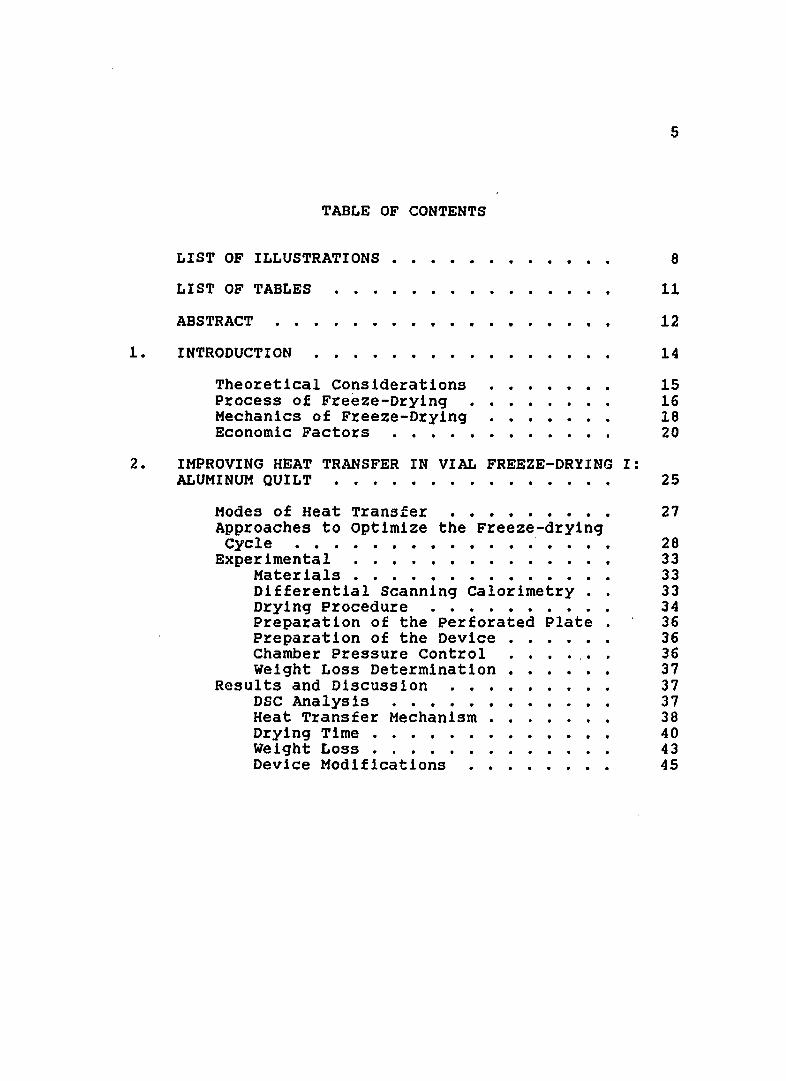
TABLE OF CONTENTS
LIST OF ILLUSTRATIONS . . . . . . . . . . LIST OF TABLES
ABSTRACT . . . . . . . . . . . . . . . . . . INTRODUCTION . . . . . .
Theoretical Considerations Process of Freeze-Drying Mechanics of Freeze-Drying Economic Factors •• . • •
. . . . . . .
. . . . . . . 2. IMPROVING HEAT TRANSFER IN VIAL FREEZE-DRYING I:
5
8
11
12
14
15 16 18 20
ALUMINUM QUILT • . . . • • • • . . • • • •• 2S
Hodes of Heat Transfer ••••. • • • • Approaches to optimize the Freeze-drying
Cycle . . . . . . . . . . . . . . . . . Experimental • • • . • • • • . • • •
Materials • • . • • • • • • • • • Differential Scanning Calorimetry • . Drying Procedure • . • • Preparation of the Perforated Plate Preparation of the Device • • • • • • Chamber Pressure Control ..•. " . weight Loss Determination • • • .
Results and Discussion • • . DSC Analysis • • • • • • Heat Transfer Mechanism . . Drying Time • . • • • Weight Loss . . . • . Device Modifications
. . .
27
28 33 33 33 34 36 36 36 37 37 37 38 40 43 4S

6
TABLE OF CONTENTS-- Continued
3. IMPROVING HEAT TRANSFER IN VIAL FREEZE-DRYING II: FLUID CUSHION DEVICE . • • •. •••••• 63
Experimental • • ••••.•.•. Mater ials . •. ••..•.•.•• Preparation of the Device • ••• • Drying Procedure •.• •.•.• • Weight Loss . • . • • • • • • • Vial to Vial Uni formi ty . .•• Vial Size and Type • • • • • • Spill Experiment .•• ••.... Boat Experiment ••••• •• • • Product Evaluation . •• •••
Results and Discussion • • • • •••• Heat Transfer Mechanism • . • • • • . . Theoretical Calculation • • • • • • • . Drying Time . • • • • • • • • . . • • . Weight Loss • . • • • • • • • • Vial to Vial Uniformity ..... . Vial Size and Type . • • • • • Spill Experiment . • . . .. . .. Boat Experiment • • • • . • • Product Evaluation . • . . . •
64 64 65 65 66 67 67 67 68 68 69 70 .. ~ I.J.
74 76 77 79 80 81 82
4. IMPROVING HEAT TRANSFER IN VIAL FREEZE-DRYING III:
5.
SALT SOLUBILITY •••.•...••••.•. 96
Experimental . . . · · · · · · Materials . . . . . · · · . . · · · sample Preparation · · · · · · Sodium Chloride Determination . . · · · Potassium Chloride Determination · · · Results and Discussion · · · . . . . · · · LOW TEMPERATURE SOLUBILITY OF ANTIBIOTICS: OXACILLIN SODIUM . • •. .•••
Experimental • • Materials . • .. . ....... . Solubility Determination • . • Differential Scanning Calorimetry .
Results and Discussion . • . • . • • •
98 98 98 99
100 101
113
114 114 114 115 116

6.
7
TABLE OF CONTENTS-- Continued
SUMMARY • • • • . . • • • . . . . . . . . . . . 130
APPENDIX. PHYSICOCHEMICAL PROPERTIES OF SOME MATERIALS OF INTEREST • • • • • • • • • • • • 133
REFERENCES . . . . . . . . . . . . . . . . 137

Figure
1.1
1.2
2.1
LIST OF ILLUSTRATIONS
Typical Freeze-Drying System . . . . . . Binary Phase Diagr.am of Drug in water
Heat Transfer Resistances . . . . . . . 2.2 Heat Transfer Resistances Using Bottomless
8
Page
23
24
48
Tray . . . . . . . . . . . . . . . . . .. 49
2.3 Arrangement of Vials Inside Freeze-Drying chamber . • • . • , • • • . • • . • • • .. 50
2.4 DSC Thermogram of 10\ w/v Mannitol Solution Cooled and Heated at 2 Degrees per Minute 51
2.5 Mechanism of Heat Transfer through Device (Aluminum Quilt) • . • . • • • • • • • . .. 52
2.6 Chamber Pressure during Freezing and Drying for the Product with and without Device 53
2.7 Temperature Profile for the Product with and without Device (Aluminum Quit) . • . . . .• 54
2.8 Temperature Profile at 20, 270, and 1000 Micron Chamber Pressures without the Device . . 55
2.9 Temperature Profile at 165 and 550 Micron Chamber Pressures without the Device • . .. 56
2.10
2.11
Weight Loss versus Time Plots
Pressure versus Weight Loss
2.12 Temperature Profile for the Device with Horizontally Placed Steelwool Fibres . .
2.13 Temperature Profile for the Device with Vertically Placed Steelwool Fibres .
3.1 Fluid Cushion Device • • • • • • • •
3.2 Heat Transfer between Two Surfaces.
57
58
59
60
83
84

Figure
3.3
3.4
3.5
3.6
LIST OF ILLUSTRATIONS-Continued
Natural Convection Plot for an Actual case and a Hypothetical Case .•••••••••
Temperature Profile for Fluid Cushion Device at 20 Micron Pressure . • • • • • • • • • .
Intervial Variation in Product Temperature .
Spill Experiment without the Device
9
Page
85
86
87
88
3.7 Spill Experiment with Fluid Cushion Device 89
3.8 Spill Experiment with and without Fluid Cushion Device •••••••••••• 90
4.1 Solubility of Sodium Chloride in Polyol-Water Mixtures •..••••••.•..•• 105
4.2 Solubility of Sodium Chloride in Hydro-alcoholic Mixtures .•.•.••••• 106
4.3 solubility of Sodium Chloride in DMA, DMF, and DMSO-Water Mixtures •• • . • • . • •. 107
4.4 Solubility of Potassium Chloride in Polyol-water Mixtures ••••••..•..•.. 108
4.5 Solubility of Potassium Chloride in Hydro-alcoholic Mixtures ......•... 109
4.6 Solubility of Potassium Chloride in DMA, DMF, and DMSO-Water Mixtures . . . . . . . . 110
5.1 Schematic Diagram of the Filtration Unit 120
5.2 Solubility of Oxacillin Sodium at 21 Degrees Centigrade · · · · · · · · · · · · · · · · 121
5.3 solubility of Oxacillin Sodium at 12 Degrees centigrade · · · · · · · · · · · · · · · · 122
5.4 Solubility of Oxacillin Sodium at 5 Degrees centigrade · · · · · · · · · · · · · · · · 123

10
LIST OF ILLUSTRATIONS- Continued
Figure page
5.5 Solubility of Oxacillin Sodium at -6 Degrees centigrade •••••••••••••.•• 124
5.6 Solubility of Oxacillin Sodium at -14.5 Degrees centigrade • . • • • • • • • •• 125
5.7 Solubility of Oxacillir. Sodium at -26 Degrees Centigrade • •• • • •• •••• • • 126
5.8 DSC Thermogram of 50\ Aqueous suspension of Oxacillin Sodium • • • • • • • • • • • • 127

11
LIST OF TABLES
Table Page
2.1 Drying Data for Product with and without the Device • • • • . • • • • • • • • . • 61
2.2 Weight Loss after Three Different Time Periods during Drying • • • . • • • • • • • • . • •• 62
3.1 Convection Data . 91
3.2 Calculated Values of Thermal Resistances 92
3.3 Thermal Resistances for the Systems with and without the Device •• • • • • • ..' 93
3.4 Weight Loss Data for the Product with and without the Fluid Cushion Device ••. • 94
3.5 Effect of Size and Type of Vials on Drying of the Product with and without the Fluid Cushion Device . . . • • • . . . . . . . . . • . .. 95
4.1 Slopes of Log S <gm/ml) versus f Plots for Electrolyte and Nonelectrolyte Solutes . .• 111
4.2 Correlation Coefficient (r) of Log S vs f Plots for Electrolyt~ Solutes . . . • . • 112
5.1 Log Solubility vs Volume Fraction of Methanol
5.2
1 n Wa t e r • • • . . . • . . . . • • • . • . . 12 8
Log Solubility (Mole Fraction) versus Reciprocal of Temperature . . . . • . 129

12
ABSTRACT
The medium offering the greatest resistance to
heat transfer frorr the freeze-drying shelf to the moving
and subliming surface is the space between the flat shelf
top and the concave vial bottom. The resistance to heat
transfer can be greatly reduced by improving the thermal
conductivity of the intervening space. Several heat
transfer augmentation devices, including a multilayered
corrugated aluminum quilt and a conformable fluid cushion
device, which fill this gap are described.
The devices are inexpensive and easy to use.
Experimental data show that the resistance of the
intervening space is reduced appreciably and the drying
rate is greatly increased. The fluid cushion device is
superior to the aluminum quilt as it reduces the
consequences of spillage of solution and provides greater
intervial uniformity among the same batch of vials.
Drying times obtained in experiments with and without the
fluid cushion device are compared here for different
sizes and different types of vials. Product evaluation is
conducted by measuring the reconstitution time and
observing the product under a microscope.

13
The solubilities of two univalent electrolytes,
sodium chloride and potassium chloride, have been
measured in eight cosolvent-water binary systems. The
solubility of both the solutes has been found to be
adequately described by the log-linear solubility
equation, log Sm = log Sw + fu. The rank order of the
desolubilization slopes obtained for the electrolyte
solutes is compared with the solubilization of
nonelectrolyte solutes. These results indicate that a
cosolvent which is most effective in solubilizing a
nonelectrolyte is also most effective in desolubilizing
an electrolyte.
The solubility of oxacillin sodium in methanol
water mixtures has been determined at various
temperatures ranging from +21 to -26 degrees centigrade.
The data has been fitted to the log-linear relationship
as proposed by Yalkowsky et. ale The heat of solution is
determined using the van't Hoff equation and was found to
be nearly constant at 1.2 Kcal/mole. There appears to be
no dependency of the slope of the log Sm vs. fraction
cosolvent plot to the temperature. The data suggests that
there is a polymorphic or amorphic transition of
oxacillin at -14.5 degrees centigrade.

14
CHAPTER 1
INTRODUCTION
Drying of materials in order to preserve stability has
been in use since the early ages of mankind. Undoubtedly,
the first attempts involved the sun drying of food. From
a historical standpoint the process of freeze-drying,
often referred to as lyophilization, received its initial
thrust during World war II when whole blood and blood
plasma became lIfesaving necessitIes, and adequate
supplies were jeopardized because of stability and
shIpping problems. Soon after World War II, the
pharmaceutical Industry began considering the process
for the preparatIon of sterile injectable dosage forms
which could not be formulated into stable solutions. At
the same time the food industry began employing freeze
drying to process and package foods, an application that
continues to grow. Another application that has been
receiving research attention is the preservation of
biological substances, especially those of high value or
in short supply. Vital organs and tissues are also
preserved by freeze-drying.
Substances that degrade in solution are
candidates for freeze-drying. This is superior to storage
of the product ina deep-frozen state which presents

15
solubility problems, is costly, and always has the risk
of degradation. often, freeze-drying offers the only
means to stabilize the product and of course shipment and
storage of dry material is less expensive than that of a
solution.
Although there are those who would consider
freeze-drying only as the last resort, there are others
who view it as a panacea - a way to get into clinical
trials quickly or a way to exclude contaminants and inert
particles, especially in comparison with powder filling.
Certainly, freeze-drying does offer the advantage over
powder filling for dosage accuracy, since the drug is
filled into the final container as a solution. Microgram
quantities can be filled precisely. Powder filling is
used where the required dosage is represented by a large
quantity of the drug or where the solubility is not
adequate to freeze and sterilization of the powder is
possible prior to filling.
THEORETICAL CONSIDERATIONS
Freeze-drying is a process of drying in which
water is sublimed from the product after it is frozen.
There are four conditions which are essential to the
practical freeze-drying technique.
(1) The product must be solidly frozen below its eutectic
point.

16
(2) A condensing surface lower than -40oC must be
provided.
(3) The system must be capable of evacuation to an
absolute pressure of between 5 and 100 microns of
mercury.
(4) A source of heat input to the product, controlled
between -40oC and +650 C, must be employed to drive
the water from the solid to the vapor state (Heat of
Sublimation).
The freeze-drying system (figure 1.1) generally
has six basic components: the vacuum drying chamber (3)
containing a shelf (1) that is refrigerated or heated to
cool or heat the product (2), a compressor (4) to
circulate the refrigerant through pipes within the shelf
and to chill the condenser (5) surface to convert water
vapor to ice (6), a vacuum pump (7) to evacuate the
chamber.
PROCESS OF FREEZE-DRYING:
The freeze-drying process can be divided into
five· stages: sample preparation, freezing, primary drying
or ice sublimation, secondary drying or water desorption,
and stoppering. The five stages are described below.
sample Preparation:
Sample preparation involves several steps-
(a) dissolving the drug and excipients in a suitable

17
solvent, generally water;
(b) sterilizing the bulk solution by passing it through
a bacteria-retentive filter; and
(c) filling the bulk solution into individual sterile
containers (usually vials), and then partially
inserting the stoppers into the vial necks
(semistoppered position), such that openings for
vapor flow are present.
Freezing:
The freezing stage involves the cooling of the
solution at a temperature below its lowest eutectic
temperature (i.e. temperature of complete solidifi
cation). Freezing of the solution is most conveniently
accomplished in the chamber to be employed for drying, by
placing the containers of solution on a shelf that is
cooled by a circulating refrigerant. During the freezing
stage, the material is cooled until it· is completely
frozen.
Primary prying:
The primary drying stage involves the sUblimation
of free ice from the product, usually accomplished by
reducing the pressure in the drying chamber and providing
heat to the product. In this stage:
(a) Heat is transferred from the shelf to the frozen
product and conducted to the drying surface (ice

interface).
(b) The ice sublimes and the water vapor formed
through the dried portion of the product
surface.
18
passes
to the
(c) The water vapor is transferred from the surface of
the product thr'ough the chamber to the condenser.
(d) The water vapor condenses on the condenser.
Secondary Drying:
The secondary drying stage involves the removal
of bound water from the frozen product. This is the water
which did not separate out as free ice during freezing,
and so did not sublime. To accomplish the removal of this
water, the product temperature is usually raised and the
chamber pressure reduced further. The product is usually
processed until there is less than 1% moisture left in
the dried product.
stoppering:
After completion of the drying cycle, a hydrauli
cally operated plate or an expandable rubber diaphragm
presses the closures firmly into the neck of the vials
and seals them under vacuum.
MECHANICS OF FREEZE-DRYING:
The mechanics of a freeze-drying process may be
explained briefly by using a simple binary phase diagram
of a drug in water as shown in figure 1.2. The freezing

19
point of pure water is designated by G; H corresponds to
the melting point of the pure drug. The lines Ge and He
show the temperatures at which solutions of various
compositions are in equilibrium with pure solid water and
pure solid drug, respectively. The horizontal straight
line Is the temperature below which no liquid phase
exists. It is instructive to consider what happens when
solutions of various concentrations are cooled and dried
during the freeze-drying process. On cooling a solution
(initially at point A) during the freezing stage, as the
temperature falls, a temperature (point B) is ultimately
reached when ice starts to form. As the temperature
progressively falls (point B to e), more ice comes out of
solution and the remaining solution, referred to as
"interstitial fluid" (Rey, 1964), becomes more
concentrated .with the solute drug. A concentration of
drug is eventually reached where the remaining solution
of drug and water freezes as a mixture (point. e). The
concentration of drug at this point is known as the
eutectic concentration and the temperature at which total
solidification of this mixture occurs, the eutectic
temperature. The total composition of the frozen product
at this stage is denoted by point D.
During the primary drying stage, the system is
evacuated and the shelf temperature is increased so as to
20
keep the product temperature at the inside container
bottom a few degrees below the eutectic temperature of
the product to avo id "me 1 tback" (1. e. a change from the
solid to the liquid state). As more water is removed
from the product, the composition of the product will be
dec~eased from that of point D. Primary drying is
continued until point E is reached. The primary drying
stage usually accounts for approximately 95% of the total
water to be removed and about 80% of the drying time.
Secondary drying which involves the removal of
bound water is started once the composition reaches point
E. The product temperature is raised to point F and
drying is continued until the desired amount of moisture
is left inside the product. The temperature to which the
product is raised during secondary drying depends on the
thermal characteristics of the frozen product. This stage
of drying accounts for the remaining 5% of water and 20%
of drying time.
ECONOMIC FACTORS
As a rule, freeze-drying produces the highest
quality product obtainable by any drying method. However,
freeze-drying is an expensive form of dehydration of
foods and pharmaceuticals because of the slow drying rate
and the use of vacuum. Thus, the major disadvantage of
freeze-drying relates to energy costs and the lengthy

21
drying times encountered.
Energy costs are high because the material to be
dried must first be frozen, followed by freeze-drying
proper where heat must be supplied to sublime the ice and
remove bound water. Thus, the latent heat of fusion must
first be removed from the product and then resupplied to
it. Energy must also be supplied during the freeze-drying
process to refrigerate a moisture condensing plate, which
provides the driving force for water vapor mass transfer.
While it may be possible to recover some of the heat
(e.g. by rejecting the condenser heat to the heating
surfaces in order to provide the sUblimation energy) it
is obvious that the process is inherently energy and
capital intensive. Also, a significant amount of energy
is used to power the vacuum pump for the long periods
required for up to 99% moisture removal.
The lengthy drying times are caused by
resistances to heat and mass transfer and other factors,
which have been investigated extensively (Mellor, 1978;
Flink and To, 1978; Liapis and Litchfield, 1979;
Litchfield, Liapis and Farhadpour, 1981; Liapis and
Marchello, 1984; Flink and Karel, 1972; Flink and
Modelina, 1982). A reduction in the drying time can
result in reduced energy and labor costs, since
throughput may be increased proportionately. Many

22
different designs and operating procedures of freeze
driers have been proposed (Goldbllth, Rey, and Rothmayr,
1975; Mellor, 1978) not all of which are optimal (Llapis
and Marchello, 1984). It should be noted that the total
drying time must be long enough so that the final
moisture content is below about 1 weight percent (wt%) to
prevent degradation of the final material during storage.
The total residence time of the product within the
chamber can range from 24 hours to as long as seven or
eight days (Flamberg, 1986).
The following chapters will describe the means by
which the freeze-drying process can be made more
efficient, so that both time and cost can be reduced.

23
FIGURE 1.1: TYPICAL FREEZE-DRYING SYSTEM 1. HEATED SHELF 2. VIAL 3. CHMmER 4. COlvlPRESSOR 5. CONDENSER 6. ICE 7. VACUUM PUMP

0 0
tal c:: ::I E-t ~G tal elf ::E: r.::I E-t
t l- -----~--------D
a DRUG IN 1'1ATER (% BY WEIGHT)
FIGURE 1.2: BINARY PHASE DIAGRAM OF DRUG IN WATER
24
00
tal c:: ::I
~ Fr+ tal elf
I :E tal
I E-t
I I
100

25
CHAPTER 2
IMPROVING HEAT TRANSFER IN VIAL FREEZE-DRYING I: ALUMINUM QUILT
Freeze-drying is an operation involving a series of rate
processes, and the rate of drying is determined by the
rate-limiting steps in this series (Perry, 1963):
(1) heat flow from the source to the sUblimation
interface;
(2) sublimation, or the change from a solid phase to a
gas phase at constant temperature;
(3) transport of water vapor from the vaporizing zone to
the condensing zone;
(4) desublimation, or the change from the vapor phase to
a solid phase at constant temperature; and
(5) heat flow from the condensed vapor.
Rational optimization of freeze-drying cycles
requires a knowledge of which process is inherently
slowest for a particular process configuration. This
research is based on the configuration illustrated in
figure 2.1, where vials of the frozen product are
contained on a metal tray which is placed on a heated
shelf in an evacuated chamber. Karel (1973) has shown
that sUblimation (step 2) is much faster than, and is
thus limited by, the transfer of heat from the source to

26
the sUblimation interface. Using the same argument,
desubllmation (step 4) can be disregarded as the rate
limiting step. Flow of heat from the condensed vapor
(step 5) will not limit the process, provided that the
condenser is designed correctly and that the condenser is
defrosted at regular intervals to prevent a large build
up of ice.
Mass transfer (step 3) and heat transfer (step 1)
are the two potentially rate-limiting processes which are
involved during freeze-drying. While passing from the
frozen product to the condenser, the mass transport of
water vapor is impeded by three barriers or resistances:
(a) resistance of the dried product layer above the
frozen product,
(b) resistan~e of the semi stoppered vial openings, and
(c) resistance in transfer from the drying chamber to
the condenser.
Fluted stoppers designed to rest on the top of
the vials during lyophilization will generally not impede
vapor flow enough to limit the overall process, provided
that the stopper is properly oriented on the vial. The
resistance of the dried product is the limiting
resistance, accounting for nearly 80% of the mass
transfer resistance (Pikal, Shah, Senior, and Lang,
1983). Mass transfer is an important consideration that

27
can be rate-limiting in certain situations. For example,
when materials with relatively high salt and low protein
content such as crude bacterial toxins are freeze-dried,
a glassy layer may form on the surface hampering the
release of water vapor.
Despite these considerations, heat transfer from
the source to the sUblimation interface is usually the
rate-limiting process, and thus is the process upon which
optimization efforts should focus. The importance of heat
transfer can be attributed to: (a) the large heat
requirement of about 670 calories per gram of ice,
(b) the limited temperature difference between the shelf
and the product which is allowable without melting the
product in contact with the vial, and (c) the high
resistance to heat transfer in vial freeze-drying.
Modes ~ ~ Transfer:
In the lyophilization of pharmaceuticals, the
transfer of heat to the product is generally done by
circulating a fluid through the shelf on which vials are
placed. Thus, the heat Is supplied from below and is
transferred mainly by conduction (Nail, 1980) through the
frozen matrix to the sublimating front. Although other
forms of heating have been tried, e.g., microwave heating
(Copson, 1958) and radiant heating from above the product
(Greaves, 1960), they do not find wide application in the

28
drying of solutions.
Referring to figure 2.1, it can be seen that heat
must be transferred from the shelf to the sublimation
interface through a series of resistances:
(1) the shelf,
(2) the tray,
(3) the bottom of the glass vial,
(4) the frozen solution, and
(5) the gaps which are present due to lack of intimate
contact between the shelf and the tray, and the tray
and the glass vial.
The work of Pikal (1984) and Nail (1980) has shown that
the medium offering the greatest resistance to the
transfer of heat to the subliming surface is the
intervening space between the tray and the shelf (nearly
33\), and between the vial bottom and the tray (nearly
50\). Resistances of the tray and the intervening space
between the shelf and the tray are removed if the vial is
placed directly on the shelf. It only involves the
resistance of the space between the vial bottom and the
shelf (nearly 93\).
Approaches ~Optimize ~Freeze-Drying Cycle:
Nearly all of the previous approaches to optimize
the freeze-drying cycle have been directed at
applications in the food industry. Because of significant

differences between the freeze-drying of food
and pharmaceuticals, these approaches find
applicability in the pharmaceutical industry.
29
products
limited
Normally,
the heat supply for freeze-drying foods is accomplished
by radiative heating of the dried product and subsequent
conduction through the dried product to the subliming
ice. Second, foods are frequently processed at higher
chamber pressures, presumably to maximize heat transfer
without scorching the dried product. Third, foods are
usually processed in bulk on the tray itself.
One of the first approaches to improving
pharmaceutical freeze-drying was made (Pikal, 1987) by
pouring nonvolatile oil in the tray before loading it
with vials. The oil fills up the space between the vial
bottom and the tray. Since the oil is morp. heat
conductive than the gases present at the intervening
space, it improves the heat transfer from the tray to the
vial bottom. Eventhough it reduces the drying time, it
is messy and impractical. The requirement of cleaning the
freeze-dried vials alone would outweigh the advantage
gained.
Irregular contact of the vials with the shelf
surface due to the buckling of the tray bottom on which
the vials rest may cause nonuniformity of drying
throughout the lot. This problem can be eliminated by

30
using a tray assembly developed by seligmann and Berkeley
(1965) which has a movable frame to hold vials securely
in place regardless of the number in the tray. It is
constructed so that the bottom may be withdrawn from
under the vials, thus allowing them to rest directly on
the shelf. When drying is complete and the vials are to
be removed from the chamber, the tray bottom should be
slid under the frame. Using this bottomless tray the
resistances offered by the intervening space between the
tray and shelf, and the tray itself can be eliminated.
Nail (1980) found that by increasing the total
pressure in the chamber, the primary drying rate is
greatly increased because of more efficient transfer of
heat to the product arising from a higher concentration
of gas molecules conducting heat from the shelf to the
vial through the intervening space. In support of Nail's
work, Pikal et ale (1984) reported that the rate at which
water vapor sublimates from a vial increases as the
chamber pressure is increased. Similar observations have
been made with regard to foods (Oetjen, Ehlers,
Hackenberg, Moll, Neumann, 1962), where it was found that
increasing the pressure of water vapor within the
material greatly increases the internal heat transfer.
Rieutord (1960) showed that increasing the pressure of
noncondensable gases increases the heat transfer between

31
the heat source and the product.
Although increasing the chamber pressure results
in more efficient transfer of heat to the product, other
considerations place a limit on how far the chamber
pressure can be raised. Mass transfer can limit the rate
of heat transfer in two ways. By increasing the chamber
pressure there will be an increase in the number of gas
molecules in the intervening space underneath the vial
bottom and so there will be enhanced heat transfer from
the heat source to the product at the vial bottom. But at
the same time, the number of water molecules above the
product will also increase due to the increase of the
chamber pressure. These molecules will cause return of
some of the evaporated molecules to the product surface.
So there will be a decrease in the vapor pressure
gradient· across the free product surface resulting in a
decreased mass transfer. Some of the excess heat energy
supplied is used up as sensitive heat and the product
temperature ultimately rises above the permissible
temperature. Thus there is a need to optimize the chamber
pressure to prevent the product melting.
Since the product temperature has to be
maintained below the eutectic temperature to avoid
melting, the low eutectic temperature product will have a
small number of water molecules coming out of the

32
product. So in comparison to the high eutectic point
product, the mass transfer will become rate-limiting at a
much lower chamber pressure for the low eutectic point
product. Thus the upper limit of the chamber pressure
during the primary drying needs to be controlled
according to thermal properties of the product.
There are many solutions which, because of their
low eutectic point, must be dried at very low
temperatures. Drying at very low temperatures may prolong
the cycle so that the whole process becomes time
consuming and uneconomical. Ito's studies (1970, 1971)
suggest that this problem may be solved by adding another
solute which has a high eutectic temperature (if it forms
a true eutectic). For example, he found that the collapse
temperature of a sorbitol solution can be increased
significantly by reducing the sorbitol concentration and
adding sufficient mannitol to keep the total solute
concentration the same. The resulting ternary solution
could be dried at a much higher product temperature
without collapse (Ito, 1970).
The bottomless tray and the increased chamber
pressure are the two most widely used approaches in the
freeze-drying of pharmaceuticals at present. using the
bottomless tray, most of the heat transfer resistance
comes from region I as shown in figure 2.2. In

33
comparison to Nail's approach, heat transfer through
this region can be accelerated by filling up this region
with a heat conducting medium without affecting the mass
transfer of water vapor molecules. The objective of this
research is to investigate the feasibility of using
a heat transfer augmentation devIce, namely a
multilayered corrugated aluminum quilt.
EXPERIMENTAL
Materials:
The product used for the determination of drying
time was a 10% solutIon of mannitol in glass-distIlled
water. Mannitol! was used as received from the supplier.
solutions were prepared by dissolving the appropriate
amount of mannitol in water and then filtering through a
0.45 um filter to remove particulate matter. The aluminum
foi1 2 and the plate used were of commercial grade. The
vials used were of commercial origin3 and were selected
to yield a representative cross section of vials produced
during production. All of the vials were usp type I,
molded clear glass vials.
Differential Scanning Calorimetry:
A preliminary study was carried out to determine
the eutectic temperature of the mannitol solution used
for this study. This information is necessary to ensure
that subsequent drying is carried out by SUblimation

34
rather than evaporation which will maintain the desired
product quality.
An approximate volume (5 ul) of mannitol solution
was placed in a dIfferential scanning calorimeter 4 sample
pan using a micropipette. The sample pan was then placed
into the sample holder along with an empty cell as a
reference sample. The sample was then cooled to -40oC by
using dry ice and acetone, and then heated at 20 C per
minute rate while the thermograms were recorded.
prying Procedure:
A research freeze-dryerS was used for this
investigation. The unit contains 3 heating and cooling
shelves, and 3 manual temperature measurement ports. All
the basic freeze-drying components are the same as
illustrated in figure 1.1.
The product used for testing the device was 10%
w/v solution of mannitol in glass-distilled water.
Mannitol was used in this study since it is often used as
a bulking agent and has a high e"utectic point. As it is
important to keep the product temperature below the
1. Aldrich Chemical Co., Milwaukee, WI, 53201 2. Reynolds Metals Company, Richmond, VI 23261 3. Wheaton Glass Company, Millville, New Jersey 4. DuPont model 1090 Differential Scanning
Calorimeter, DuPont Co., Analytical Instrument Division, Wilmington, DE 19898.
5. virtis model 15 SRC-3X sublimator, The Virtis Co., Inc., Gardiner, NY 12525.

35
eutectic point, the use of a high eutectic point model
compound is convenient. The fill volume was 3 milliliters
of mannitol solution in a 10 cc molded glass vial
resulting in a cake thickness of approximately 1
centimeter. Only the middle shelf was used in all the
experiments. Half of the shelf was used for testing the
disposable devices and the remaining half was used
without the device. For each experiment, half of the
vials were placed over the device and the rest of the
vials were placed qirectly on the shelf. The shelf was
used to its fullest capacity to simulate the actual
production run. Thermistor.probes were placed directly on
the shelf as well as in the product at the center inside
bottom of the vials by using the probe holders. Good
thermal contact between the probe and the shelf surface
was obtained by applying a thin coat of high-vacuum
silicone grease to the contact place. Without grease at
the interface the probe could give readings that are
dependent on chamber pressure (~ikal, 1984). Thermal
contact between the vial bottom and the shelf was
improved
of the
by applying the mechanical pressure at the neck
vials. This was done by sliding a perforated
aluminum plate over the neck of the vials and then
tightening this plate to the flat aluminum plate which
was inserted underneath the shelf as shown in figure 2.3.

36
The product was frozen to -400 C for_:4 hours. After the
chamber was evacuated to the predetermined pressure the
shelf temperature was increased to Soc to supply heat of
sUblimation. The shelf temperature was kept constant for
all the experiments. The condenser temperature was -55 +
5°C. The product temperatures and the shelf temperature
were recorded on a six point strip chart recorder 6 . When
the product temperature merged with the shelf temperature
drying was terminated.
Preparation 2L ~ Perforated Plate:
An aluminum plate, 10 x 10 x 1/4 inches in
dimension, was cut with circular holes arranged
diagonally so as to accomodate a maximum number of vials
on the shelf.
Preparation 2L ~ pevice:
Sheets of heavy duty aluminum foil, 10 x 10 x
0.01 inches, were first wrinkled and then stacked into
multiple layers. These layers were then stapled together
at regular distances.
Chamber Pressure Control:
A manually adjusted controlled-leak valve and a
calcium carbonate moisture trap were used to bleed dry
air into the chamber to maintain a pre-set pressure.
6. Clears pan P600, Kent Process Incorporated, Edison, NJ 08818.
Control

37
Pressure was measured by a mercury manometer with a range
of 10-2 to.3 mm mercury. Experiments were carried out at
pressures ranging from 20 to.1000 micrometer of mercury.
No device was used in this study.
weight ~ petermination:
For each experiment, 10 vials were numbered and
weighed after being filled with 3 cc of mannitol
solution. These vials were then randomly distributed on a
freeze-drying shelf along with the rest of the vials.
Since the freeze-drier is not equipped with a sample
thief assembly, drying was terminated immediately after
the predetermined time period. The vials were stoppered
and then weighed immedlately to prevent the product from
absorbing moisture. These samples were then discarded and
another set of fresh samples were used for determining
the weight loss at the next time period for the same
experiment. This study was carried out for the device at
20 micron pressure, and also without the device at
various chamber pressures.
RESULTS AND DISCUSSION
~ Analysis:
When an aqueous solution is cooled, the water in
the solution almost always undergoes some degree of
supercooling before crystallizing out as ice. The
magnitude of supercooling is an important factor in the

38
lyophilization process and is largely dependent on the
cooling rate (Jennings, 1980). Since the samples are
frozen at 2 degrees per minute in the freeze-drying
chamber, 10 % mannitol solution was cooled and then
heated at 2 degrees per minute in a differential scanning
calorimeter (DSC). The DSC thermogram obtained is shown
in figure 2.4. The cooling (upper) thermogram shows an
exothermic peak for ice beginning at -10oC, followed by
another exotherMic peak which begins at -32°C for the
eutectic phase, during the cooling of the solution. This
is the temperature at which no liquid state exists in the
product and that is why the product was frozen to -40oC.
While the heating (lower) thermogram shows a small
endothermic peak for the eutectic phase followed by
another endothermic peak for ice during the heating of
the frozen solution. During heating, the supercooling
effect was avoided and the true eutectic temperature was
found to be around -2oC. This agrees well with the value
reported by Gatlin and Deluca (1960). Product temperature
was maintained below this temperature to avoid melting
and thus evaporation of the product.
~ Transfer Mechanism:
It is well known that super insulation consists
of a number of highly reflecting metal layers. To
minimize the heat transfer between these layers one uses

39
either metal coated plastic foils or fibrous spacer
materials between the metal foils (Kutzner, Wietzke, and
Schmidt, 1972, 1973). By limiting the number of uncoated
metal layers, the same approach can be used to enhance
heat transfer. Since aluminum foil is a good conductor of
heat, inexpensive, and can easily conform to the shape of
a vial bottom, it was used to make the quilts. Thermal
conductivities of various materials are listed in the
appendix. The foils were wrinkled first to improve the
thermal contacts between them, and also between the
device and the concave vial bottom.
The mechanism of heat transfer from the heated
shelf through the device to the vial bottom can be
explained using figure 2.5. The heat flow through the
device consists largely of two modes, heat radiation and
heat conduction, since the contribution of heat
convection is negligible at low pressure (Nail, 1980).
The heat flow by radiation occurs through the space
between concentric surfaces of adjacent layers. The heat
flow by conduction between adjacent foils consists of the
heat conduction by the residual gas, the heat transfer at
points of contact between the foils, and the heat
conduction along the foils. Since the foils touch each
other at different points, the heat must flow along the
zig-zag lines as indicated in the figure, i.e. from one

contact point to the next contact point and then
the foils itself. It is true that an increase
40
through
in the
thickness of the aluminum layer or the increase in the
number of layers increases the thermal conductivity
between the points of contact and thus increases the
conductive component of the heat flow. But the space
available between the vial bottom and the shelf, and the
separation caused by introducing the device at the
circular vial bottom contact from the shelf limits this
increase in foil thickness or the number of foil layers.
Accordingly, when the number of layers was increased in
the aluminum quilt from 2 to 5, the drying time was
decreased. But when the number was increased to 10,
drying time was increased.
prying ~:
The products with the device as well as without
the device were freeze-dried using identical drying
conditions in the same experimental run to avoid the
interexperimental variations.
The pressure profile obtained for the freeze
dried product is presented in figure 2.6. The product was
cooled to -400 C at 1 atmosphere chamber pressure. At the
start of drying the chamber was evacuated for about 15
minutes until it reached the pressure of 20 microns
mercury. The chamber pressure increased to a maximum

41
value as soon as the shelf temperature was increased to
+5 0 C.
At the start of drying, there is no dried product
present above the subliming interface to inhibit the mass
transfer. This will allow the chamber pressure to attain
a maximum value. The chamber pressure decreased with
further increase in drying time. Initially the decrease
is more rapid as it involves the removal of free water.
The free water usually accounts for 95% of the total
water content. Also the subliming water vapor has to pass
through the increasing depth of dried product.
The decrease in chamber pressure becomes more
gradual during the later phase of the drying. During this
phase of drying most of the bound water is removed. This
bound water accounts for approximately 5% of the total
water content.
The temperature profile ·obtained is presented in
figure 2.7. Negative values have been assigned for
freezing times while positive values have been assigned
to drying times. The shelf temperature, product
temperature with the device, and the product temperature
without the device are presented as the upper, middle,
and lower curves, respectively. The product with the
device cools
temperature in
faster and attains a lower freezing
comparision to the product without the

device. While during heating this pattern is
reversed indicating that the product with
42
completely
the device
achieves higher temperature faster. Also the product with
the device dries faster. Merging of the product
temperature lines with the shelf temperature line was
taken as the drying end point. This criterion is based on
the fact that at the end of drying no more water vapor
molecules are coming out of the product. Thus it requires
no heat of sublimation and the product temperature rises
to the shelf temperature. By the weight loss
determination it was confirmed that the product contained
less than 0.7% water at the end of drying. Most
pharmaceuticals are processed until less than 1.0%
moisture is left behind in the product. The product with
the device dries in 10.5 hours while without the
device it takes as long as 17 hours.
The advantage gained by using the device is much
less during freezing than drying. The freezing and drying
of the solution were carried out at atmospheric
and 20 micron pressure, respectively. And the
conductivity of air increases linearly with
pressure
thermal
linear
increase in pressure (Hirschfe1der, Curtiss,
1954). So in comparision to drying, the
temperature curve without the device is closer
with the device during freezing.
and Bird,
product
to that

43
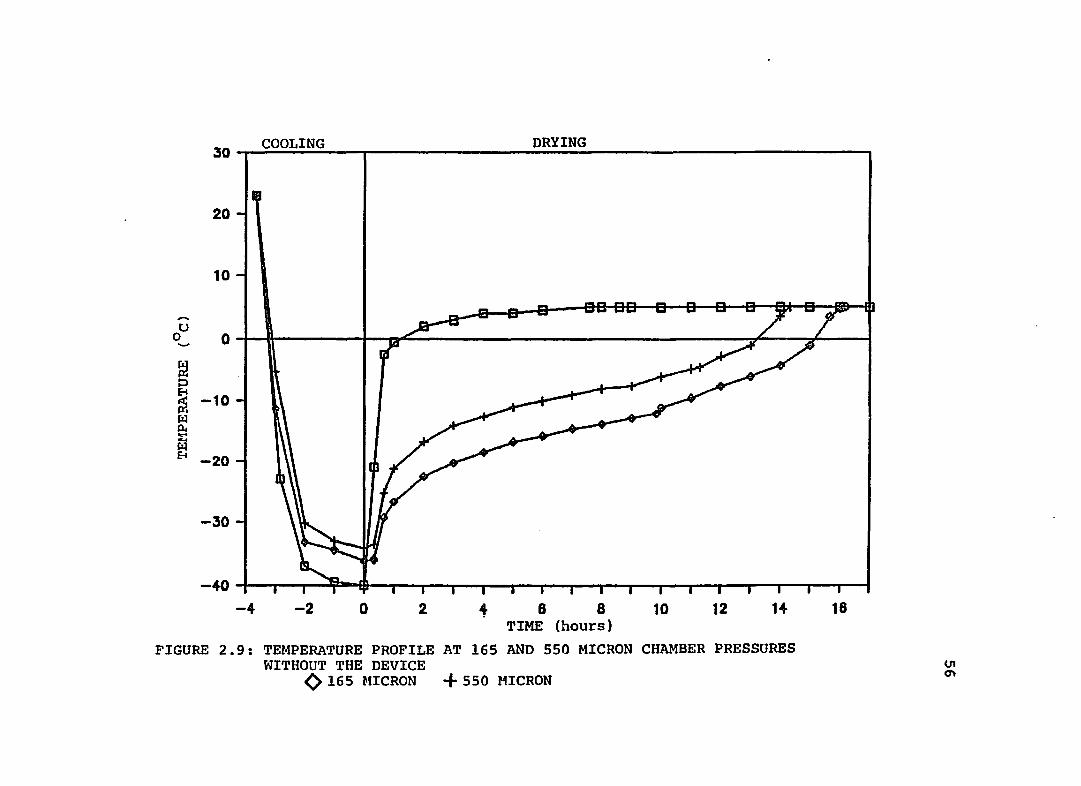
To compare the results of our approach with
Nail's increased chamber pressure approach, experiments
were carried out at the pressures ranging from 20 microns
to 1000 microns without the device. The temperature
profiles obtained at five different pressures are shown
in figures 2.8-2.9. Since the geometry of the vial
bottoms differ significantly, the temperature
obtained during freezing are not identical
profiles
for the
different chamber pressures. As the chamber pressure is
increased the product attains a higher temperature faster
and also the drying time is decreased. This is due to the
fact that by increasing the chamber pressure, the number
of heat carrying molecules also increases in the
intervening space between the vial bottom and the shelf.
Weight ~:
The weight loss obtained at three different time
periods for the device as well as without the device at
four different chamber pressures is pr,esented in figure
2.10. In all the curves there is a rapid increase in the
weight loss rate at the beginning. Then there is a
gradual increase as drying continues. Since there is no
dried layer present above the frozen product initially,
the mass transfer is not affected by this resistance. But
as the dried layer thickness increases the increase in
mass transfer decreases and so does the weight loss. Also

44
at any time point there is an increase in weight loss as
the chamber pressure is increased. Maximum water loss is
obtained by drying the product with the device. By
introducing the device, in comparision with increased
chamber
transfer
pressure approach, there is no effect on mass
of water vapor molecules and so there is a
greater increase in weight loss.
To evaluate the effect of increasing chamber
pressure on mass transfer, the weight loss obtained after
5.5 hours is plotted against chamber pressure in figure
2.11. Since at low pressures mass transfer is not
affected significantly and also the heat flux increases
linearly with the pressure in the free molecular flow
region, there is an increase in weight loss with increase
in pressure. At higher chamber pressures, resistance to
mass transfer becomes increasingly significant and the
flow region moves from free molecular to transition to
viscous flow region (Dushman and Lafferty, 1962), the
weight loss becomes relatively insignificant.
The weight loss and the drying time data
are presented in table 2.1 along with average
temperatures from the shelf to the product at the vial
bottom. This temperature difference was obtained by
calculating the area between the product temperature
curve and the shelf temperature curve using the linear

45
trapezoidal rule and dividing it by the total drying
time. The initial sUblimation rate obtained from the
three data points are also presented for comparision. The
correlation coefficients obtained using linear regression
analysis are presented in table 2.2. As the chamber
pressure (without the device) is increased the average
temperature difference and the drying time are decreased
and there is an increase in the initial sublimation rate.
Similar results were also obtained with the device,
indicating its efficiency.
Device Modifications:
To enhance the heat transfer through the aluminum
quilt the device was modified by changing the geometry
and material of the filling in the following ways:
- foils were corrugated first, stacked into multi layers
and then made into a quilt,
- aluminum bag filled with strips of aluminum foil and
then varying the size of the strips,
- strips of aluminum foil formed into small balls and
then filled into an aluminum bag,
- aluminum bag filled with steelwool fibers placed
horizontally or vertically.
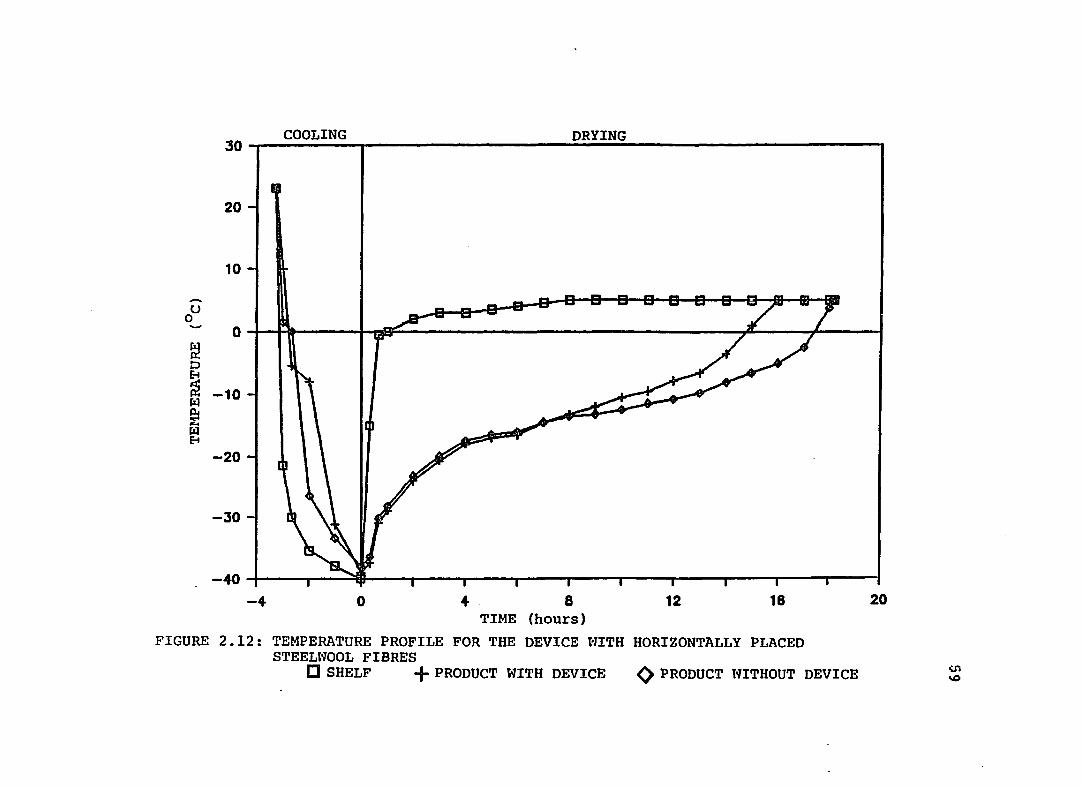
All of the above modifications excluding the last one
proved to be less effective than the parent device. The
temperature profiles obtatned for the product dried using

46
the last modification are presented in figure 2.12 and
2.13. The results of this study could lead to a more
efficient heat transfer device. Placing the steelwool
fibers vertically, the product dried faster than placing
them horizontally. The total resistance through the
vertically placed fibers is smaller than that with the
horizontally placed fibers. This is due to the fact that
the reciprocal of the total resistance through the device
is the sum of the reciprocals of the individual
resistance offered by each steelwool fiber. While in the
case of the horizontally placed fibers the total
resistance is the sum of individual resistance. An
interesting point to note from figure 2.10 and 2.11 is
the heat transfer behavior of steelwool fibers observed
during freezing and drying of the product. Since freezing
is carried out under atmospheric conditions the device
acts as an insulator in comparision to the one without
the device. While during drying it acts as a heat
enhancer, as drying is carried out at 20 micron chamber
pressure. It is concluded from this experiment that
improved heat transfer can be achieved by attaching the
heat conducting fibers to the lower foil with loose upper
ends just like carpet.
In summary, using the device the ·temperature
difference across the intervening space between the vial

47
bottom and the shelf is reduced. The sublimation rate was
increased. The drying time is decreased due to the faster
cooling and drying of the product. In comparision to
Nail's approach, there is no need to modify the device
with the change in the product eutectic temperature.

48
~~?7~~77.~tJ ___________ FROZEN SOLUTION
SHELF
~ __________ GLASS VIAL
~~~-----INTERVENING
SPACES
FIGURE 2.1: HEAT TRANSFER RESISTANCES

49
~~~~~~~~---- DRIED PORTION
~~-----FROZEN SOLUTION
..... ~...::=::::::::......J5:::..::~:.:f!=:;--- GLASS VIAL
I---REGION I
FIGURE 2.2: HEAT TP~SFER RESISTANCES USING BOTTOMLESS TRAY

__ -----PERFORATED • • PLATE
I~ CLAMP
.... II VIAL
II.=L~ ~'*;II ,DEVICE
C::' I : IE BOTTOM PLATE
FIGURE 2.3: ARRANGEHENT OF VIALS INSIDE FREEZE-DRYING CHAMBER
<.n o

60
40
20 C COOLING
-~ 0 -~ 0 ..:I rz..
~ -20 ~ ::
-40
-60
-80 -40 -30 -20 -10 0 10 20
TEMPERATURE (OC)
FIGURE 2.4: DSC THERHOGRAM OF 10% w/v W..NNITOL SOLUTION COOLED AND HEATED AT 2 DEGREES PER MINUTE
51
30

1< VIAL
~ ~c J DEVICE
HEAT FLOW
FIGURE 2.5: MECHANISM OF HEAT TRANSFER THROUGH THE DEVICE (ALUMINUM QUILT)
U1 ~

760 Iii a a B !iii
-01 0.05 J:
'0
~ 0.04 -1&1
u:
~ 0.03 0.
0.02
0.01 I I :;:- ~ ~ , ."
-3.7-3 -1 o 0.3 1 3 5 7 9 11 13
nME (HOURS)
FIGURE 2.6: C~lBER PRESSURE DURING FREEZING AND DRYING FOR THE PRODUCT WITH AND WITHOUT DEVICE
15 17
..." W

30 COOLING UAE+UU
20
10
o I EIi' ... pc ;haC ,"""'-
-10
-20
-30
-40 I >$ -4 -2 o 2 4 6 8 10 12 14 16 18
TIME (hours)
FIGURE 2.7: TEMPERATURE PROFILE FOR.THE PRODUCT WITH AND WITHOUT DEVICE (ALUMINUM QUILT) [J SHELF TEMPERATURE +PRODtTCT WITH DEVICE
() PRODUCT WITHOUT DEVICE
(J1
~

30 COOLING yt"~~t'V
20
10
tJ 0 0
~ P 8
~ -10 J:.;I ~ ~ r.:I Eol
-20
-30
-40 I y- III -4 -2 o 2 4 6 8 10 12 14 16
TIME (hours)
FIGURE 2.8: TEMPERATURE PROFILE AT 20, 270, AND 1000 MICRON CHk~BER PRESSURES WITHOUT THE DEVICE
+20 MICRON ¢ 270 rUCRON /1A 1000 lUCRON (11 (11
30 COOLING DRYING
20
10
u 0 0 -
t! p
~ -10 fiI ~ ..... .... fiI 8 -20
-30
-40 I "ljk ED
-4 -2 0 2 ... 8 8 10 12 14 TIME (hours)
FIGURE 2.9: TEMPERATURE PROFILE AT 165 AND 550 MICRON CHAMBER PRESSURES WITHOUT THE DEVICE <> 165 ~UCRON + 550 MICRON
16
U'I 0\

1.8
1.7
1.6
1.5
1.4
- 1.3 rn j=; ItS 1.2 J..I Cl
1.1 [J) [J) 0 ..:I
1
E-t 0.9 :t: C) H 0.8 ~
0.7
0.6
0.5
0.4
0.3
2.2 2.6 3 3.4 3.8 4.2 4.6 TIME (hours)
FIGURE 2.10: WEIGHT LOSS VERSUS TIME PLOTS CALUMINUM QUILT )r1000 MICRON ~ 550 MICRON ¢ 270 MICRON +20 MICRON
5 5.4
(S1 ..,2

1.5 ~--------------------------------------------------------------~
~ 1.4 .c:: ltl . ltl ~ 1.3 QJ 4J 11-1 ItS
1.2 til til 0 H
&; 1.1 t!i H
~ 1
0.9
0.8-r---r--~--~~--r---T---~--~---r--~--~----r---T---~--~--~
o 0.+ 0.8 1.2 1.6 (Thousands)
PRESSURE (microns) FIGURE 2.11: PRESSURE VERSUS WEIGHT LOSS
2 2.4 2.8
U1 CD
30 _
~_C~O~O~L~I~N~G~~ __________________ ~D~R_Y_I_N_G~ ________________________ I
20
10
u 0
0
~ t:l E-t
~ -10 M ~ .... M E-t
-20
-30
-40 I -" -4 o 4 8 12 18
TIME (hours)
FIGURE 2.12: TEMPERATURE PROFILE FOR THE DEVICE WITH HORIZONTALLY PLACED STEELloJOOL FIBRES
[] SHELF + PRODUCT WITH DEVICE <:> PRODUCT t'lITHOUT DEVICE
20
0'1 'i)

30 COOLING DRYING
20
10
o I 11 \ I sa=: v r ,c
-10
-20
-30
-40 I 'Ii -4 o 4 8 12
TIf.fE (hours)
FIGURE 2.13: TEMPERATURE PROFILE FOR THE DEVICE NITH VERTICALLY PLACED STEELl'lOOL FIBRES
18
CJ SHELF + PRODUCT WITH DEVICE <> PRODUCT WITHOUT DEVICE en o

TABLE 2.1: DRYING DATA FOR PRODUCT WITH ~~D WITHOUT THE DEVICE
DEVICE/ PRESSURE IN" MICRONS
Aluminum QUILT
p C= 20
p C= 165
pC= 270
pC= 550
pC= 1000
Ta ave
(oC)
7.4
20.2
19.5
lS.7
18.3
17.2
DRYING TIME (hours)
10.5
17.0
16.2
15.5
14.3
13.0
WEIGHT LOSS AFTER 5.5 HRS (GRAMS)
1.70 (0.2S0)b
0.S4 (0.155)b
0.S7
0.95 (0.173)b
1.05 (0.180)b
1.33 (0.232)b
a average temperature difference from the shelf top to the product at the vial bottom
bsub1imation rate (gms/hr) after 5.5 hours of drying
cchamber pressure in microns for the product with no device .:r. .....

TABLE 2.2: WEIGHT ~OSS (IN GRAMS) AFTER THREE DIFFERENT TIME PERIODS DURIN~ DRYING - MEAN (S.D.)
DEVICE/ WEIGHT LOSS AFTER PRESSURE 2.25 ·HRS 3.75 HRS 5.5 HRS
Aluminum 0.7818 1.3879 1. 7019 Quilt (0.068) (0.086) (0.112)
P = 20 Jl 0.3416 0.5507 0.8445 (0.011) (0.091) (0.029)
P = 165 n 0.8692 (0.034)
P = 270 Jl 0.3900 0.6544 0.9539 (O.OlB) (0.022) (0.043)
P = 550 Jl 0.4590 0.8031 1. 0482 (0.011) (0.019) (0.049)
P = 1000 II .0.5454 0.9233 1.3313 (0.022) (0.037) (0.134)
P =.2000 11 1. 4605 (1).076)
* P = 3000 11 1. 4800
r is the correlation coefficient * melting of product observed
r
0.975
0.998
0.999
0.990
0.999
en N

63"
CHAPTER 3
IMPROVING HEAT TRANSFER IN VIAL FREEZE-DRYING II: FLUID CUSHION DEVICE
Freeze-drying is generally the most expensive
single unit operation in the production of a lyophilized
product, and is a significant factor in the final cost of
that product. For this reason, there is a continuing
interest in the optimization of production freeze-drying
cycles; that is, minimizing freeze-drying cycle times
while providing a reliable and uniformly high quality
product.
The theoretical arguments of Nail (1980) indicate
that the temperature differences across the frozen
product, across the glass at the vial bottom, and across
the metal tray bottom are small and, therefore, the
largest temperature differences, or thermal resistances,
are across the intervening spaces between surfaces. The
previous chapter showed the feasibility of using a heat
conducting device. Using the deVice, the temperature
difference across the intervening space is greatly
reduced and a significant decrease in drying time is
obtained due to faster cooling and drying.
Although the aluminum quilt offers several
advantages, it is inefficient in some aspects. It is
difficult to sterilize and if improperly handled

64
accidental flattening of device could result before use.
It is not likely to be effective in eliminating the
consequences of spillage and in fact may worsen them.
This chapter will describe an improved device to enhance
the heat transfer from the shelf to the glass vial
bottom.
EXPERIMENTAL
Materials:
Mannito11 was used as received from the supplier.
DSC analysis revealed a purity of greater than 99 mole'.
The aluminum foi1 2 and the aluminum plate used were of
commercial grade. Polyethylene layered aluminum foil was
purchased so that it can be heat sealed to form a bag. It
has nylon and polyethylene layers on one side while only
a polyethylene layer on the other side. This gives
strength to the normally brittle aluminum foil to
withstand the handling of the device during processing.
Reagent grade glycerln 3 was purchased and was vacuum
treated before use. Glass-distilled water was used in the
preparation of test solutions. All the vlals 4 used were
of USP type I tubing or molded clear glass vials.
1. Aldrich Chemical Co., Milwaukee, WI 53201 2. Ludlo corporation, Louisiana 3. Burdick & Jackson Laboratories, Inc., Muskegan,
HI 49442 4. Wheaton Glass Company, Millville, New Jersey

65
Preparation ~ ~ DeVice:
As sh9wn in figure 3.1, two layers of aluminum
foil laminated with polyethylene were sealed together on
four sides using a heat sealer, leaving a small opening
for alr/gas removal. The top side of the device was
designed as shown in figure 3.1 for easy removal of air
from the bag. Dissolved gases and air were removed from
the glycerin as well as the bag sealing by applying
vacuum for 24 hours. Excess of glycerin was removed by
pressing the bag between two flat plates and then the
opening was sealed right into the glycerin to avoid the
entrapment of air.
prylng Procedure:
A research freeze-dryer was used for this
investigation. The product used for testing the device
was 10% w/v solution of mannitol in glass-distilled
water. Flil volume was 3 milliliters in a 10 cc molded
glass vial resulting in a cake thickness of approxlmately
1 centimeter. The middle shelf was used for all the
experiments. For each experiment, half of the vials were
placed over the device and the rest of the vials were
placed directly on the shelf. Thermistor probes were
placed directly on the shelf as well as in the product at
the center inside bottom of the vial. The probes were
held in position inside the vials by using probe holders.

66
Thermal contact between the vial bottom and the shelf was
improved by sliding a perforated aluminum plate over the
neck of the vials and then tightening this plate to the
flat aluminum plate which was inserted underneath the
shelf. The product was frozen to -40 0 C for 4 hours. The
chamber was then evacuated to a predetermined pressure.
The shelf temperature was then increased to Soc and was
kept constant for all the experiments. The condenser
temperature was -55 + Soc. When the product temperature
merged with the shelf temperature, drying was terminated.
The product temperatures and the shelf temperature were
recorded on a six point strip chart recorder.
Weight ~:
For each experiment, 10 vials were numbered and
weighed after being filled with 3 cc of mannitol solution
in 10 cc clear molded glass vials. Then the vials were
randomly distributed on a freeze-drying shelf with the
rest of the vials and were freeze-dried using the same . . .
procedure as described above. Since the freeze-drying
equipment was not equipped with a sample thief assembly,
drying was terminated immediately after the end of the
predetermined time period. The vials were stoppered and
then weighed immediately to prevent the product from
absorbing the moisture. These samples were then discarded
and another set of fresh samples were used for

67
determining the weight loss at the next time period for
the same experimental conditions. This study was carried
out with the device as well as without the device at a
chamber pressure of 20 microns.
~ ~ ~ Uniformity:
To study the nonuniformity in heat transfer from
the shelf to the proQuct at the center of the vIal bottom
among the set of 10 cc molded vials, thermistor probes
were placed at the center of the vial bottoms. The
product was then freeze-dried the same way as described
above. The maximum temperature dIfference among the set
of vials was calculated for the product both with the
device as well as and without the device. To obtain a
temperature profile for the maximum number of vials with
a limited number of thermistor probes, the product with
the device was dried separately from those without the
device.
~~an.d~:
Drying times were also obtained for different
sizes and different types of vials for the product with
the device as well as without the device.
Spill Experiment:
In order to simulate the effects of an accidental
spill, the surfaces above the device as well as the shelf
were partially puddled with 25 milliliters of the test

68
solution. Vials were placed over the spilled and the
nonspilled areas on the shelf and the device. The product
was then freeze-dried as before while monitoring the
shelf and product temperatures. The temperature
difference was obtained for the vials placed over the
spilled area against the nonspilled area.
~ Experiment:
Flat bottom aluminum boats were made using a thin
aluminum foil. They were then filled with glycerin to
achieve a thin layer of glycerin just enough to cover the
the space between the vial bottom and the shelf. Vials
were carefully placed inside these glycerin filled boats
and were then freeze-dried using the same procedure as
described before. A temperature profile was obtained by
monitoring the shelf and product temperatures.
Product EyaluatioA:
Reconstitution time and cake appearance were
noted after each experiment. Reconstitution time was
measured in the following way: Product was freeze-dried
as before and the product vials were immediately
stoppered and sealed. Five milliliters of distilled water
were added to the inverted stoppered vial using a
syringe. The vial was inverted to avoid the initial
contact of water with the freeze-dried product and to
remove the needle. The product was then agitated on a

69
roller test tube rotator at a controlled constant speed
until completely dissolved. The reconstitution time
obtained for the product dried with the device was
compared to that without the device.
Cake (i.e. dried product) appearance and the
internal porosity were noted under an optical microscopeS
and a scanning electron microscope 6 .
RESULTS AND DISCUSSION
Liquid is used so the device can easily conform
to the shape of the vials just as a water bed conforms to
the shape of its occupant. The liquid is contained in a
aluminum foIl bag which is inexpensive, durable,
flexible, and easily sealed. Glycerin is used as a heat
conducting liquid in the preparation of the fluid cushion
device. Glycerin was chosen because it has a low freezing
point and a high boiling point (low vapor pressure) 50 it
will not freeze or evaporate under vacuum. Also it is
high in thermal conductivity and heat capacity so it can
pick up and give off the required amount of heat of
sUblimation without appreciable temperature change. It is
nontoxic, nonflammable, noncorrosive, inexpensive, and
water washable.
5. Olympus optical Co., Tokyo, Japan 6. International Scientific Instrument, Model
DS 130, Santa Clara, California

70
~ Transfer Mechanism:
The physical situation to be studied is shown
schematically in figure 3.2. In an ideal case, the fluid
is contained between two flat horizontal conducting
surfaces distance d apart. The upper surface is held at
the temperature Tc and the lower surface at the higher
temperature In the absence of motion (1. e.
convection) the temperature distribution is determined
solely by the thermal conductivity and is indicated by
the heavy line connecting Th and Tc (Malkus, Veronis,
1958). To determine the contribution of convection, one
needs to determine the Rayleigh number
R = (3.1)
where g is the acceleration due to gravity (in cm/s 2 ), a is the coefficient of volume expansion (in °C-1 ), d is
the thickness of the fluid layer (in cm), ~ T is the
temperature di ffer~:nce between the top and bottom plates
(in °C), ~ is the kinematic viscosity (in cm2/s) and « is
the thermal diffusivity (in cm2/s).
An empirically derived plot for any fluid system
contained between two flat horizontal plates is given in
figure 3.3 (Catton, 1966). The plot describes the change
in the Nusselt number (Nu) with change in the Rayleigh

71
number. The Nusselt number is a dimensionless ratlo of ,
heat flow by both conduction and convection to the heat
flow solely by conduction. When the Nusselt number is
equal to un~ty, there is no convection and heat Is
transferred entirely by conduction. The bottom curve in
figure 3.3 is for the system with a fluid contained
between two flat horizontal plates. A break in the curve
is obtained when it exceeds the critical Rayleigh number.
This number has to be achieved for convection to occur.
For the system with the fluid contained between the top
concave plate and the bottom flat plate, the curve will
look like ~he upper curve in figure 3.3. The maximum
separation distance of the vial bottom from the shelf and
the average temperature across the device were
determined experimentally to estimate the Rayleigh
number. These data are presented in table 3.1 along with
the other property values obtained from the literature.
The calculated Rayleigh number is extremely low
suggesting that the Nusselt number will be near unity.
Therefore the heat flow through the device is largely by
conduction and convection is negligible.
Theoretical Calculation:
Referring to figure 3.1, it can be seen that heat
must be transferred from the heated shelf to the
subliming interface of frozen product through a series of

72
resistances: the bottom of the glass vial, the frozen
product layer, and the device (aluminum foil, glycerin,
and aluminum foil in series). In the absence of device
the resistance due to the device _is replaced by the
intervening gas phase. The contribution of each
resistance, with or without the device, is estimated in
the following way.
If one takes into consideration the equation
governing heat transfer by conduction, under steady-state
flow:
~T a = k A ( 3. 2)
X
where Q (cal/hr) is the heat flow, k (cal cm- 2 hr-1 °C)
is the thermal conductivity of material, A Ccm2> is the
area normal to the heat flow, ~ T (°C) is the
temperature difference across the material, and X (em) is
the thickness of material. For unidirectional conduction
through n parallel slabs of material where the cross
sectional area is constant, equation 1 can be written for
each of these layers and the overall temperature
difference is expressed by:
( 3 • 3 )
where Xi/ki is a measure of the resistance to heat flow,

73
(3.4)
where q = a/A in cal cm- 2 hr-1 . The total resistance, RT,
may be expressed as the sum of four terms:
RT = Rg + Rv + Rs (3.5)
where Rg is the gas phase resistance between the shelf
and the vial bottom, Rv and Rs are the resistance of the
glass vial and frozen solution, respectively. In the case
where the gas boundary is filled with aluminum foil and a
heat conducting fluid (glycerin), the term Rg is replaced
in equation 4 by the sum of the resistances of the
aluminum foil (Ra) and the fluid (Rl).
Based on thermal conductivity values and the
thickness of the layers, for the system with aluminum
foil and a heat conducting fluid glycerin, one can
calculate the resistance of each material. These values
are included in table 3.2. The contribution of each of
the three phases to the total heat flow resistance was
calculated
reported
Replacing
and is presented in table 3.3 along with the
values (Nail, 1980) of the gas phase system.
the gas phase system with the heat conducting
fluid system the resistance of the shelf-vial boundary is
reduced by half. So an improvement in heat transfer can

74
be accomplished by introducing a heat conducting system
in the intervening space. And the faster drying will be
achieved by minimizing the temperature difference between
the shelf and the frozen product
Drying ~:
The products with the fluid cushion device and
without the device were freeze-dried using identical
drying conditions in the same experimental run to avoid
the interexperlmental variations. The temperature profile
obtained is presented in figure 3.4. Negative values have
been assigned for freezing while positive values have
been assigned to the drying portion of the time scale.
The shelf temperature, product temperature with the
device, and the product temperature without the device
are presented with the upper, middle, and lower curves,
respectively. As with the aluminum quilt the product with
the fluid cushion device cools faster and attains a lower
freezing temperature in comparison to the product without
the device. During heating this pattern is completely
reversed as expected, indicating that the product with
the device achieves a higher temperature faster. Also the
product with the device dries faster. Merging of the
product temperature curves with the shelf temperature
curve was taken as the end point of the drying cycle.
This criterion is based on the fact that at the end of

75
drying no more water molecules are coming out of the
product. Thus it requires no heat of sUblimation and the
product temperature rises to the shelf temperature. The
product with the fluid cushion device dries in 11 hours,
while without the device it takes as long as 17 hours.
The drying time with the aluminum quilt is 10.5 hours.
An important piece of information missing from
figure 3.4 is the supercooling effect observed during
freezing of the solution. It is not included in the
figure since the degree of supercooling observed was not
consistent in all the product vials. This is due to the
fact that the degree of supercooling is dependent on a
number of parameters involving the product, container,
and cooling process. Configuration of the container and
defects, scratches and other surface irregularities as
well as particulate matter can serve to limit the degree
of supercooling (Jennings, 1980). But the degree of
supercooling observed for the product with the device is
consistently greater than that without the device. Since
the product with the device is cooled faster, it does not
allow enough time for the ice nuclei to grow into
crystals. Thus crystals will grow at a relatively lower
temperature and a higher degree of supercooling is
obtained.

76
We ight I..2U.:
The weight loss experiments were carried out the
same way as described for the aluminum quilt in chapter
two. The weight loss data obtained at three different
time periods for the fluid cushion device are presented
in table 3.4. Data obtained at different chamber
pressures without the device are included here for
comparision. There is an increase in weight loss at any
particular time period using the device. The sUblimation
rate was also increased with a consequent decrease in the
drying time. The 'average temperature differences from the
shelf to the product at the vial bottom, calculated using
the linear trapezoidal rule, are presented in table 3.4.
It is true that the increase in the weight loss obtained
requires a higher amount of heat energy and so the
average temperature difference between the product and
the shelf should increase. In contrast, a decrease in the
average temperature difference was- obtained. This can be
explained by using Fourier's law which states that
q = k (3.6) x
where heat flux q (w m-2 ) is the heat transfer rate per
unit area, k (W m-I oK-I), X em) and ~ T (oK) are the
thermal conductivity,thickness, and temperature

77
difference across the medium, respectively. By increasing
the chamber pressure or introducing a device, thermal
conductivity of the intervening space is increased
greatly (see appendix). This will more than offset the
decrease in the temperature difference. Thus the heat
flux across the intervening space will be much more than
the sublimation heat required for increased weight
loss. The product temperature will increase resulting
in decreased temperature difference between the shelf and
the product.
~ ~ ~ Uniformity:
The vial Is an extremely important variable in
the freeze-drying process. Although the direct effect of
the vial on mass transfer (via closure resistance) is
slight, the nature of the vial does significantly affect
the rate of heat transfer to the product. The magnitude
of variation in the vial heat transfer rate is sensitive
to the geometry of the vial bottom. While the thickness
of the glass in the vial bottom is not Important
(Pika1, Roy, Shah, 1984), both the average separation
distance between the vial bottom and the shelf and the
degree of physical contact between the vial and the shelf
are critical factors. It Is true that large differences
In the vial heat transfer rate exists between different
types of vials. Even vials of nominally the same

specifications,
78
manufactured by different suppliers,
differ significantly in their heat transfer
characteristics. A freeze-drying cycle, optimized using
one type of
satis'factor ily
vial, cannot be expected to
with a different vial.
perform
Indeed,
circumstances may arise where a product is routinely
freeze-dried with an excellent yield, but a change of
supplier for the vial stock results in significant
product loss arising from eutectic melt. Results of the
nonuniforrnity in heat transfer from the shelf to the
product at the inside center of vial bottom, among the
set of vials, are presented in figure 3.5. Maximum
product temperature differences obtained among the same
lot of vials with and without the device are plotted
against time. Temperature difference is plotted only upto
three hours, as the product temperature ultimately
becomes constant with the shelf temperature. In actual
practice the shelf temperature is constantly decreased
with automatic controls. The temperature variation
observed without the device is significantly greater than
that observed with the device. Since drying is carried
out under vacuum the distance between the two curves is
increased as shown in figure 3.5. Also the device is
equally effective during freezing as well as drying
(identical vertical distances) indicating near perfect

79
contact of the device with the vial bottoms. Therefore it
is concluded from this study that by using the device,
more even heat transfer can be achieved. It is likely
that nonuniformity in heat transfer among the vials
manufactured by different suppliers or different lots can
also be reduced using the device.
~ llz.e. 5Ul4 ~:
The device was tested for different sizes of
vials and the data obtained are listed in table 3.5. The
intervening space created between the concave vial bottom
and the flat shelf top was measured in terms of weight.
This was done by filling the space on the vial bottom
with modeling clay and removing the excess by pressing
the vial bottom against a flat surface. To account for
variations caused in the drying time by using different
sizes of vials, the ratio was obtained by dIviding the
drying time without the device to that with the device.
The drying time ratio increased with the increase in vial
size. The concavity of the vial bottom increases with the
increase in vial size. Thus there is an increase in the
importance of space on the vial bottom with the increase
in the vial size. The drying time without the device
increased more in comparision to that with the device,
indicating increased efficiency of the device with
increase in the vial size.

80
Data are also presented for tubing vials in table
3.5. Although the device is equally effective in filling
the space at the bottom of the tubing or molded vials,
the drying time ratio is decreased for tubing vials in
comparision to the same size molded vials. Since the
vials manufactured from tubing are generally superior to
molded ones, as they have relatively uniform and flat
bases, the importance of the space on the vial bottom is
decreased. This decrease in importance causes a smaller
decrease in drying time for the product with the device
and so the drying time ratio decreases. But judicious use
of these vials is required as they are more expensive,
less resistant to thermal or physical shock, and with
materials like mannitol, vial breakage is higher
(Williams, Lee, Polli, and Jennings, 1986).
Spill Experiment:
One of the commonly encountered problems of the.
freeze-drying process is the spillage of solution 'over
the surface containing the vials due to improper filling
or handling of vials. If this spilled solution is not
properly wiped out, it could cause uneven heat transfer
from the shelf to the product at the vial bottom. To
check the efficiency of the device in alleviating this
problem, a spill experiment was carried out. The data
obtained for the vials placed on the spilled and the

81
nonspilled areas with or without the device are presented
in figures 3.6 and 3.7. The vials placed in the spilled
area freeze and dry much faster compared to those placed
on the nonspilled area without the device. While using
the device the freezing portion of both curves are almost
identical and also the nonuniformity caused by the
spilled solution during drying is considerably reduced.
The temperature differences between the vials placed on
the spilled area against the nonspilled area were
calculated for the vials dried with or without the device
and are plotted against time as shown in figure 3.8.
Using the device the temperature difference Is
considerably smaller during freezing as well as drying.
The fluid cushion device essentially removes or does not
allow the spilled solution to remain underneath the vial.
The aluminum quilt will make it worse as it entraps the
spilled solution between the device and the vial bottom.
~ Experiment:
The purpose of the boat experiment was to check
how good the device makes contact with the vial bottom as
compared to the vials in direct contact with glycerin. No
significant decrease in drying time (half an hour) was
observed. This decrease may be due to the contact made by
the excess of glycerin in the boat with the outside of
the vial wall. This study suggests the near perfect

contact of the device with the vial bottom.
Product Evaluation:
82
In all cases, the resultant freeze-dried cake
(i.e. product) was white and uniform in color,
approximately the same shape and size as the solution.
The cake was observed under the optical and scanning
electron microscope for the appearance and the quality of
the product. No wet spot or observable differences in
quality between the product dried with or without the
device was detected. The cake was reconstituted by adding
water, but no measurable difference in reconstitution
time was observed.
In conclusion, the device has been shown
to increase the heat transfer from the shelf to the vial
bottom by filling up the intervening space .. It reduces
the freezing and drying times and increases the
SUblimation rate. Also it provides greater vial to vial
uniformity. In contrast to the aluminum quilt, it offers
easy sterilizability and physical stability, and reduces
the consequences of spillage. It is likely that the fluid
cushion device will also increase the intravial and the
batch to batch uniformity.

(a)
AIR/GASES
GLYCERINE __ ~EALING
FIGURE 3.1 - FLUID CUSHION DEVICE (a) PREPARATION OF THE DEVICE (b) HEAT TRANSFER THROUGH THE DEVICE
(b)
VIAL
t HEAT FLOW
I DEVICE
CD W

14 VIAL
IIIJJJ;rIJJJJJ}}}JJJJIJJIIIIIIIIIIIIIIII~'111111111 HEAT~D ~\fu\\\\\\~ HEATED
Th SHELF SH~LF
(A) (B)
FIGURE 3.2: HEAT TRANSFER BETWEEN TWO SURFACES (A) HEAT TRANSF~R BETWEEN TWO PARALLEL PLATES (HYPOTHETICAL CASE) CB) HEAT TRANSFER BETWEEN A FLAT SHEL~ TOP A!JD A CONCAVE VIAL
BOTTOM (ACTUAL CASE)
co A

ACTUAL CASE
,/+--HYPOTHETlCAL CASE
11-====::::'--1
100 1707 RAYLEIGH NUMBER (R)
FIGURE 3.3: NATURAL CONVECTION PLOT FOR AN ACTUAL CASE ~~D A HYPOTHETICAL CASE
65

30 COOLING DRYING
20
10
~,
aU o I " I ~ ;;;' ,r
t1 tJ E-t ~ -10 rz1
i! rz1 E-t
-20
-30
-40 ~
-4 -2 o 2 468 TIME (hours)
10 12 14 16
FIGURE 3.4: TEMPERATURE PROFILE FOR FLUID CUSHION DEVICE AT 20 MICRON PRESSURE IJ SHELF + PRODUCT WITH DEVICE ¢ PRODUCT WITHOUT DEVICE CD
en

4-
3.5
3
2.5
u 0
2
t1 0 E-f ~ 1.5 ~ III ~ ~ 1 E-t
0.5
0 -4
COOLING
-2 o TIME (hours)
DRYIN
2
FIGURE 3.5: INTERVIAL VARIATION IN PRODUCT TEMPERATURE [] PRODUCT WITH DEVICE ~ PRODUCT WITHOUT DEVICE
CD ...:I

COOLING DRYING 30~----------~------------------------------------------------~
20
10
0 CJ
0
~ -10 p
~ fil ~ -20 :E: fil E-t
-30
-40 ~.
-4 -2 o 2 488 TIME (hours)
FIGURE 3.6: SPILL EXPERIMENT.tHTHOUT THE DEVICE <> VIAL PLACED ON SPILLED APEA i-VIAL PLACED ON NONSPILLED AREA o SHELF
10 12 14 18
co co

30 COOLING DRYING
20
10
tJ 0 0
riI p::; ::> E-t -10 ~ riI Pol :E: riI E-t -20
-30
-40 =;:sa -4 -2 o 2 4 8 8 10
TIME (hours)
FIGURE 3.7: SPILL EXPERIMENT WITH FLUID CUSHION DEVICE C SHELF + VIAL PLACED ON SPILLED AREA <>VIAL PLACED ON NONSPILLED AREA
12 14 18
CD r,o

24 COOLING DRYING
22
20
18
18
14 -u 0_12
~ 10 ~ ~ 8 fLI
S 8 ~
4
2
o~ ~I fp~~Ii1Ii1~ -4
FIGURE 3.8:
-2 0 2 4 8 8 10 12 14 TIME (hours)
SPILL EXPERIMENT WITH AND WITHOUT FLUID CUSHION DEVICE C PRODUCT WITH DEtlICE + PRODUCT tlITHOUT DEVICE
18
\D o

TABLE 3.1: CONVECTION DATA
Viscosity (gm crn- l sec-I)
Density (gm crn-3)
Kinematic Visc,osi ty (crn2 sec-I)
2 -1 Thermal Diffusivity (crn sec )
Coefficient of Volume Expansion (ok-I)
Gravitational Constant (crn sec-2 )
Thickness of,Device (crn)
Temperature Difference (ok)
Rayleigh Number
91
6.8300
1. 0800
6.3240
1.0000
0.0005
980.6650
0.1000
6.2000
0.481 x 10⁻³

TABLE 3.2: CALCULATED VALUES OF THERMAL RESISTANCES
MATERIAL THICKNESS THERMAL CONDUCTIVITY
(em) 2 0 (cal em/ em hr C)
Frozen solution 0.80 18.70
Glass (vial) 0.24 9.40
Glycerin 0.10 2.43
Aluminum- 0.01 2581.0
Gas phase 0.11
RESISTANCE 2 0 (em hr C/eal)
4.3 x 10 -2
2.6 x 10 -2
4.1 x 10 -2
3.87 x 10 -6
1. 08
\D l\,)

TABLE 3.3: THERMAL RESISTANCES FOR THE SYSTEMS WITH AND WITHOUT THE DEVICE
SYSTEM CONTRIBUTION TO HEAT FLOW RESISTANCE, % OF TOTAL SHELF-VIAL VIAL FROZEN SOLUTION BOUNDARY
Gas phase 94 2 4
Device 37 24 39
0,0 eN

DEVICE/ PRESSURE
Device
P = 20 U
P = 1000
94
TABLE 3.4 : t-mIGHT LOSS DATA FOR THE PRODUCT WITH AND WITHOUT THE FLUID CUSHION DEVICE
Ta DRYING WEIGHT LOSS ave TIME AFTER 5.5 HRS ( C) (hrs) (grn)
6.2 11.0 1.54· (0.278)b
20.2 17.0 0.84 (0.155)b
U 17.2 13.0 1.33 (0.232)b
aAverage temperature difference from the shelf top to the product at the vial bottom
bSublimation rate (gms/hr) after 5.5 hrs

VIAL SIZE (cc)
lOa
lOb
20a
TABLE 3. 5: EFFECT OF SIZE AND TYPE OF VIALS ON DRYING OF THE PRODUCT WITH AND WITHOUT THE FLUID CUSHION DEVICE
WEIGHT OF THE DRYING TIME DRYING TIME INTERVENING SPACE WITH DEVICE WITHOUT DEVICE
(grns) (A:hrs) (B:hrs)
0.25 11.0 17.0
0.20 10.0 14.0
0.43 15.2 25.0
DRYING TIME RATIO
(B/A)
1.55
1.40
1.65
30a 0.98 14.7 26.7 1.82
aMolded Vials
bTubing Vials
\0 0'1

96
CHAPTER 4
IMPROVING HEAT TRANSFER IN VIAL FREEZE-DRYING III SALT SOLUBILITY
The application of the fluid cushion device to
enhance the heat transfer from the freeze-drying shelf to
the glass vial bottom has been the subject of chapter
three. Glycerin has been used as a heat conducting fluid
in this device. The device was shown to make near perfect
contact with the vial. The only way to make the device
more heat conductive is either by changing the fluid or
by increasing the thermal conductivity of the fluid.
It is known that the conductivity of water can be
increased by dissolving inorganic salts (Perry, 1963).
These salts dissociate into cations and anions, and the
ions conduct the heat as effiCiently as they conduct
electricity. Because of its hydroxyl groups glycerol has
solubility charactristics similar to those of water,
glycols, and alcohols.
Cosolvents such as ethanol, propylene glycol, and
polyethylene glycol are routinely used to solubilize
drugs in aqueous vehicles. In some cases, the use of an
appropriate cosolvent can increase the aqueous solubillty
of a drug by several orders of magnitude. In other cases,
the solubilizing effect Is much smaller or even
negligible, and in still other cases the addition of a

97
cosolvent will reduce the solubilIty of solute in the
aqueous vehicles.
It is observed that the solubility of
nonelectrolytes increases exponentIally as the volume
fraction of cosolvent is increased in binary cosolvent
water mixtures (Yalkowsky and Roseman, 1981; Chawla,
Pinal, Morris, and Yalkowsky, 1987; Rubino, Blanchard,
and Yalkowsky, 1984). This is described mathematically
by:
log Sm = log Sw + fu (4.1)
where Sm is the solubility of drug in the mixed aqueous
system containing the volume fraction f of nonaqueous
cosolvent, Sw is the solubility in water, and u is the
slope of the log Sm vs f plot. It was found in these
studies that q is dependent on the solute as well as the
cosolvent polarities. Recently, Rubino and Yalkowsky
(198Sa and 1985b) have successfully used the above
equation for estImating the solubility of weak organic
electrolytes. However, its applicability to strong
electrolytes has received only minimal consideratIon.
This study was undertaken to determine the
solubility of electrolytes in cosolvents as well as to
test the validity of Equation 4.1 for strong electrolytes
and to determine if u is in any way predictable.

98
EXPERIMENTAL
Materials:
All solutes were obtained in the highest
available purity from commercial sources and used as
received. The cosolvents were selected to cover a wide
range of polarity. These included propylene glycol (PG),
ethylene glycol (EG), polyethylene glycol 400 (PEG),
dimethylacetamide (OMA), dimethylformamide (OMF), .
dimethylsulfoxide CDMSO), methanol (MEOH), and ethanol
(ETOH). All solvents were of reagent grade or better and
were used as received. Distilled water was used in all
experiments.
Sample Preparation:
The solubilities of sodium chloride (NaCI) and
potassium chloride CKCI) were determined in different
cosolvent-water mixtures. The cosolvent-water mixtures
were prepared by mixing 10, 20, 30, ... 70, 80, 90
mililliters of cosolvent with 90, 80, 70, ... 30, 20, 10
millillters of water, respectively. The volumes of
cosolvent and water were measured separately and combined
so that the volume fraction of cosolvent, as defined
here, would not change if volume shrinkage occurred upon
mixing.
Saturated solutions of solute were prepared in
the following way: An excess amount of solute was placed

99
in each of several screw-capped culture tubes containing
1 milliliter of specified amounts of cosolvent-water
mixture. These tubes were rotated on a test tube rotator
for 24 hours at 2SoC and were then centrifuged for 15
minutes. The aliquots of
diluted with distilled water,
solute as described below.
the clean supernatant
and assayed for the
Sodium Chloride petermination:
were
given
Mohr's argentimetric titration (Beckett and
Stenlake, 1975) was used to determine the sodium chloride
content In the various cosolvent-water mixtures.
Potassium chromate solution (5 per cent w/v; 1 milli
liter), used as an indicator, was added to a conical
flask containing the diluted sample, and was then
titrated with 0.1 N silver nitrate solution. During the
titration the flask was continuously shaken for faster
reaction. Dropwise addition of silver nitrate was
continued until a permanent faint reddish-brown color was
obtained. The silver nitrate used contained 99.9 +
percent silver nitrate and therefore was used as a
primary standard. Quantitation of sodium chloride was
obtained using the following equations:
AgN0 3 + NaCI AgCI J, + NaN03 ( 4 . 2 )
0.01699 9 A9N03 = 0.005845 9 NaCl 1 ml of 0.1 N A9N03

100
Potassium Chloride petermination:
Volhard's method (Beckett and Stenlake, 1975) was
used to determine the potassium chloride content in the
various cosolvent-water mixtures. Dilute nitric acid (15
ml), dibutyl phthalate (5 ml) and 0.1 N silver nitrate
(50 ml) were added to the diluted sample contained in . a
conical flask, and was shaken vigorously for a minute.
Ferric ammonium sulphate solution (5 ml) was added to the
above solution and then titrated with 0.1 N ammonium
thiocyanate (NH4SCN). Addition of ammonium thiocyanate
with shaking was continued until a reddish-brown color,
which did not fade away in five minutes, was obtained.
Quantitation of potassium chloride was achieved using the
following equations:
KCI + AgN03
AgN0 3 .. NH4SCN
0.00535 Cj RCI =
AgCI J + KN03
AgSCN ~ + NH4N03
1 mL of 0.1 N A9N03
(4.3)
( 4 • 4 )
The blank reading was subtracted from the sample reading
to account for any impurity left behind in the distilled
water. The validity of the above two methods was obtained
by spiking a known amount of solute In the sample. Linear
regression analysis was performed on the data using a
statistical analysls program (SAS User's Gulde, 1982).

101
RESULTS AND DISCUSSION
The solubilization curves of sodium chloride and
potassium chloride in the various binary mixtures of
cosolvents and water are presented in figures 4.1-4.6.
solubilities in acetonitrile, acetone, and isopropanol
could not be determined as the solute salts out the
cosolvent from the mixture. In general two kinds of
profiles were obtained. One being nearly linear
throughout the concentration range as shown by ethylene
glycol, propylene glycol, and polyethylene glycol. The
other profile as seen in the cases of dimethylacetamide,
dimethylformamide, dimethylsulfoxide, methanol, and
ethanol systems, where the initial linearity is followed
by a downward concavity. Downward concavity was also
observed in the case of nonelectrolyte solutes (Chawla,
Pinal, Morris, and Yalkowsky, 1987).
In nearly all cases there is roughly a linear
relationship between log Sand f indicating the useful
ness of equation 4.1 in describing the electrolyte
solubility data. There is an exponential decrease in the
solubility of both solutes with a linear increase of
cosolvent in the cosolvent-water mixture. The maximum
decrease observed is two orders of magnitude for
potassium chloride in dimethylacetamide-water mixture.
This is due to the fact that the addition of increasing

102
amount of cosolvent causes the decrease in the polarity
of cosolvent-water mixture, and since salts are more
polar than these mixtures, the solubility decreases with
the addition of cosolvent.
The slopes and the correlation constants for both
solutes are presented in tables 4.1 and 4.2. In all cases
the value of the correlation coefficient is greater than
0.92.
The addItIon of cosolvent to water decreases the
solubility of elecrolyte solutes. The order of the
desolubilizing power of cosolvent obtained from the slope
of log S vs £ (table 4.1) 1s listed below. The degree of
solubilization is similar for both the solutes as would
be expected.
NaCl:
KCI
DMA > DMF > ETOH > DMSO > MEOH > PEG > PG > EG
DMA > DMF ~ ETOH > DMSO > MEOH > PEG > PG > EG
While the addItion of cosolvent to water increases the
solubility of nonelectrolyte solutes. The slopes of log S
versus f plots for various nonelectrolytes as reported by
Yalkowsky et ale (1987) were averaged and are presented
in table 4.1. The solubilization order obtained for
various cosolvent-water mixtures is listed below.
DMA > DMF > ETOH > DMSO > MEOH > PG > EG

The above order is the same for the electrolyte
indicating that the solvents which salt in
103
solutes
the non-
electrolyte solute will also salt out the electrolyte
solutes in the same order. The desolubilization order
obtained in individual groups of compounds, like glycols
and mono-hydroxy alcohols, agree with the expected order
of polarity (dielectric constant) of the cosolvents.
Regression analysis of the data shown in table
4.1 gives the following results.
(1) Nonelectrolyte slopes (NE) vs NaCI slopes (NACL)
NACL = - 2 . 185 ( NE ). + O. 676 ( 4 . 5 )
n = 7, r = -0.998
(2) Nonelectrolyte slopes (NE) vs KCI slopes (KCL)
KCL = -2.33 (NE) + 0.698 (4.6)
n = 7, r = -0.958
(3) NaCI slopes (NACL) vs KCI slopes (KCL)
KCL = 1.0955 (NACL) + 0.0655 (4.7)
n = 8, r = 0.944
Good correlation is obtained in all three cases,
suggesting the validity of equation 4.1. The
solubilization and desolubilization behavior observed for
nonelectrolyte, as well as, electrolyte solutes appear to
depend upon the cosolvent in a similar manner.
The solubilities of sodium chloride and
potassium chloride are exteremely low in all the solvents

except water.
decrease the
solubility is
conductivity
1987).
104
Even though dissolving the salts will
vapor pressure of the solvent, the
not sufficient to increase the thermal
significantly (Pearlstein and Pourier,
In summary, the solubility of both the
electrolyte solutes has been found to be adequately
described by the log-linear solubility equation. A
cosolvent which is most effective in solubilizing a
nonelectrolyte is also most effective in desolubilizing
an electrolyte. The solubility of salts in neat organic
solvents is insignificant, and therefore would not
increase the thermal conductivity of the solvents.

-0.4
-0.5
-0.8
-0.7
-0.8
-0.9
-1 -r-I ~ -1.1
~ -1.2
til -1.3 t!J 3 -1.4
-1.5
-1.8
-1.7
-1.8
-1.9
0 0.1 0.2 0.3 0.4 0.5 0 .. 8 0.7 0.8 VOLUME FRACTION COSOLVENT
FIGURE 4.1: SOLUBILITY OF SODIUM CHLORIDE IN POLYOL-WATER MIXTURES [] EG + PG <) PEG
0.9 1
~ o U1

-0.8
-0.8
-1
-1.2
~ -1.4 ~
& -1.8 -til
t!J -1.8 0 ..:1
-2
-2.2
-2.4-
-2.8
-2.8 0 0.1 0.2 0.3 0.4 0.5 0.8 0.7 0.8
VOLUME FRACTION COSOLVENT
FIGURE 4.2: SOLUBILITY OF SODIUM CHLORIDE IN HYDROALCOIIOLIC UIXTURES IJ MEOH + ETOH
0.9 1
I-A o 0'\

-0.4
-0.8
-0.8
-1
-1.2
-1.4
-1.8
r-f -1.8 ~ ~ -2 -til -2.2 t!J 8 -2.4-
-2.8
-2.8
-3 0 0.1 0.2 0.3 0.4 o.s 0.8 0.7 0.8 0.9
VOLUME FRACTION COSOLVENT
FIGURE 4.3: SOLUBILITY OF SODIUM CHLORIDE IN DMA, DMF, AND Df1S0-WATER MIXTURES + DMA <> DMF IJ DMSO
1
1-6 o ..,J

-0.5
-0.8
-0.7
-0.8
-0.9
-1
r-I e -1.1
" ~ -1.2
(J)
g -1.3 H
-1.4
-1.5
-1.8 0 0.1 0.2 0.3 0.4 0.5 0.8 0.7 0.8
VOLUME FRACTION COSOLVENT
FIGURE 4.4: SOLUBILITY OF POTASSIUM CHLORIDE IN POLYOL-NATER MIXTURES +EG [] PG <> PEG
0.9 1
.... o Q)

-0.5 -0.6 -0.7 -0.8 -0.9
-1 -1.1 -1.2 -1.3 -1.4 -1.5 -1.8
~ -1.7 ~ -1.8 ~ -1.9 til -2 t!) -2.1 0 H -2.2
-2.3 -2.4 -2.5 -2.8 -2.7
0 0.1 0.2 0.3 0.4 0.5 0.6 0.7 0.8 0.9
VOLUME FRACTION COSOLVENT
FIGURE 4.5: SOLUBILITY OF POTASSIUM CHLORIDE IN HYDROALCOHOLIC MIXTURES [J MEOH + ETOH
1
~ o 1.0

-0.4-
-0.6
-0.8
-1
-1.2
-1.4-
-1.6 r-f E -1.8
" E -2 ~
til -2.2 Cl S -2.4
-2.6
-2.8
-3
-3.2
-3.4-
0 0.1 0.2 0.3 0.4 0.5 0.8 0.7 0.8 0.9
VOLUME FRACTION COSOLVENT
FIGURE 4.6: SOLUBILITY OF POTASSIUM CHLORIDE IN DMA, DMF, AND DMSO-WATER MIXTURES <> DMA C DMF + DMSO
1
.... .... o

TABLE 4.1: SLOPES OF LOG S VERSUS f PLOTS FOR ELECTROLYTE AND NONELECTROLYTE SOLUTES
111
SOLVENT NaCl KCl NONELECTROLYTE
DMA -2.440 -2.644 1.41
DMF -2.380 -2.278 1.40
ETOH -2.150 -2.274 1.30
DMSO -1.644 -2.127 1.07
MEOH -1.460 -1.852 1.00
PEG -1.306 -1.083
PG -1.057 -0.977 0.76
EG -0.654 -0.582 0.62
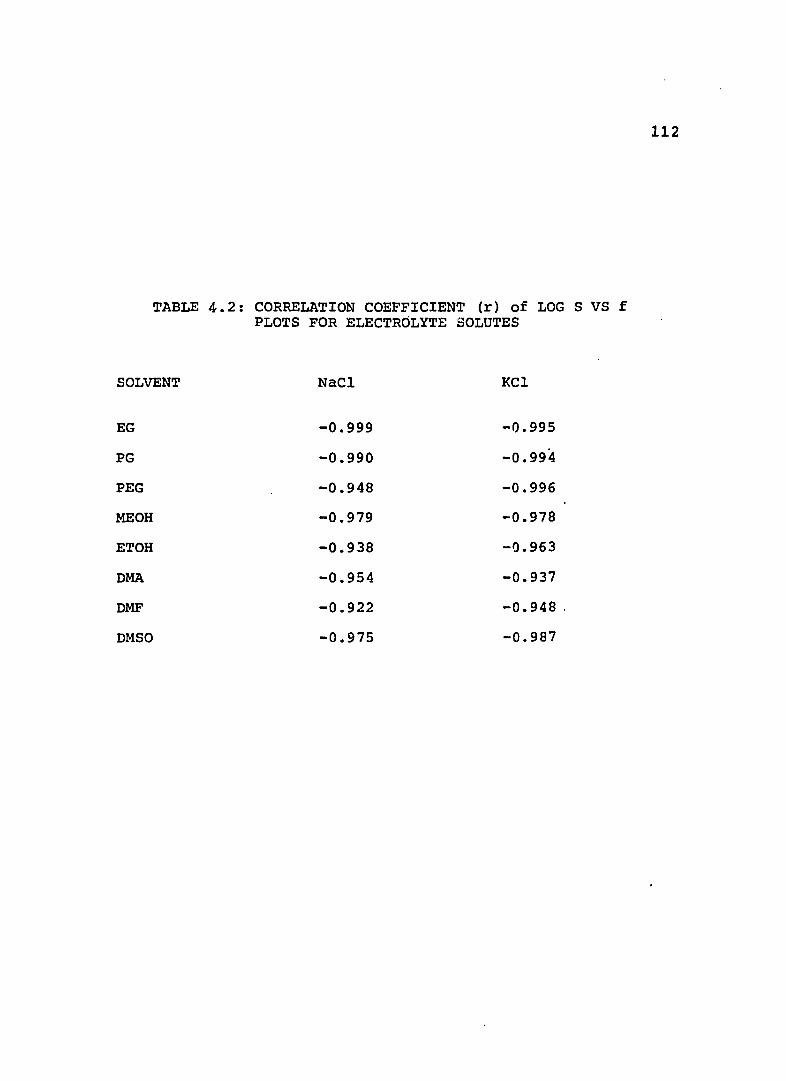
TABLE 4.2: CORRELATION COEFFICIENT (r) of LOG S VS f PLOTS FOR ELECTROLYTE SOLUTES
SOLVENT NaCl KCl
EG -0.999 -0.995
PG -0.990 -0.994
PEG -0.948 -0.996
MEOH -0.979 -0.978
ETOH -0.938 -0.963
DMA -0.954 -0.937
DMF -0.922 -0.948 .
DMSO -0.975 -0.987
112

113
CHAPTER 5
LOW TEMPERATURE SOLUBILITY OF ANTIBIOTICS: OXACILLIN SODIUM
Aqueous solutions of antibiotics are usually very
unstable at ambient temperature. One common way to
increase the stability is to freeze-dry the product.
However, this approach has several disadvantages
including the problems with reconstitution, and high
processing cost. Another way to increase the stability is
to decrease the temperature of the solution. The decrease
in solution temperature slows the reaction velocity, and
if the solution freezes the reactIon will further be
diffusion limited by the reduced molecular motion in the
frozen solution.
The speed of many reactions decreases about 2 to
3 times with each 100 decrease in temperature. The effect
of temperature on the reaction rate is given by the
equation, first suggested by Arrhenius,
log k = log A - (5.1) 2.303 T
in which k is the specific reaction rate, A is a constant
known as the frequency factor, Ea is the energy of
activation, R is the gas constant, and T is the absolute
temperature. The decrease in temperature may also lead to

114
a decrease in solubility which will lead to increased
solutIon stabIlIty.
The purpose of this investIgation is to estimate
the aqueous solubility of oxacillin sodium at sub
freezing temperatures. The determination of the
solubility of any drug in water below zero degrees
centigrade is experimentally impossible due to the
freezIng of water. Cosolvents, like methanol, can be used
to get InformatIon about the solubIlIty of the drug in
aqueous solution at temperatures below zero degrees, as
they depress the freezing point of water.
EXPERIMENTAL
Materials:
Oxacillin sodium was obtained from Travenol
Laboratories (Morton Grove, Illinois) and was used as
received. All other reagents and chemicals used were
spectral grade. Double distilled water was used in all
the experiments. water-cosolvent mixtures were prepared
by mixing 10, 20, 30, 40, etc., milliliters of cosolvent
with 90, 80, 70, 60, etc., millIlIters of water. The
volumes of cosolvent and water were measured separately
and combined so that the mole fraction of cosolvent would
not change if volume shrinkage occurred upon mixing.
SolubIlIty Determination:
Solubility determination was conducted in aqueous

115
methanol by the following procedure: Excess of sodium
oxacillin was added to 2 ml of 0, 10, 20, •.• , 100 %
v/v methanol-water mixture contained in screw-capped
culture tubes. The samples were then rotated on a test
tube rotator for 6 hours at 21, 12, and 5 degrees, and
for 24 hours at -6, -14.5, and -26 degrees centIgrade.
The samples which did not freeze during equilibration
were used for the solubility determinations.
The equilibrated solution was then fIltered
through a 0.45 micron millipore filter which was
thermally equilibrated for 24 hours under similar
conditions. The syringe used in the filteration was
wrapped with an insulating material as shown in figure
5.1 and was equllibrated for 24 hours. This was done to
prevent heat transfer from the atmosphere during
filteration. ,The filteration process was completed in
about 15 seconds. The drug was then analysed using a
Beckman DU-8 spectrophotometer at 240 nm and the
solubility from the standard curve.
pifferential Scanning Calorimetry (PSC):
DSC analysis was performed on a Du Pont 1090
thermal analyzer with a 910 DSC module. Aqueous
suspension (SO % w/v) of oxacillin sodlum was heated from
-40 to 15 degrees centigrade at 2 degree per minute rate.

116
RESULTS AND DISCUSSION
Methanol was chosen as the cosolvent because of
its ability to depress the freezing point of water. Also
the viscosity of the methanol-water system is low and
does not inhibit filteration. The reported stability of
oxacillin sodium in aqueous solution at room temperature
is only 24 hours (Chatterji, Hiranaka, and Galleli,
1975). The samples were equilibrated for only 6 hours at
higher temperatures. Since the stability of oxacillin
sodium at refrigerated temperature is greater, the
equilibration time was increased for subzero
temperatures.
The solubility data obtained are plotted semi
logarithmically against volume fraction of methanol in
figures 5.2-5.7. A linear relationship is observed at all
temperatures as expected by the following equation
proposed by Yalkowsky and Roseman (1981).
log Sm = log Sw + fu ( 5 . 2 )
where Sm is the molar solubility of drug in cosolvent
water mixture, Sw is the molar solubility of the drug in
water, f is the volume fraction of cosolvent and u is the
slope of the log Sm vs f plot. Since the solubility in
water is higher than in the cosolvent, the solubility in
cosolvent-water mixture shows an exponential decrease

117
with increasing cosolvent fraction.
Linear regression analysis was performed on the
data using SASe The dependent variable log Sm was
regressed against the independent variables, the volume
fraction of cosolvent and the reciprocal of temperature.
Tables 5.1 and 5.2 give the slope, lntercept, and the
correlation coefficient for the regression analysis of
log Sm vs fraction cosolvent and log X vs reciprocal of
temperature, respectively.
The regression slope of log Sm vs fraction cosolvent
was found to be nearly constant with an average value of
-0.54. The slope u is the solubilizing power of the
cosolvent, and does not depend on temperature. The
intercept of the regressions is the solubility of
oxacillin sodium in water at a given temperature. The
solubility in water at -14.5 degrees was found to be the
lowest at 213.8 milligrams per milliliter. Solubility
generally decreases until -14.5 degrees and then goes up
with further decrease in temperature for all methanol
water mixtures. This experiment was repeated three times
and gave the same result suggesting the existence of some
other form o£ the drug at that temperature. The DSC curve
(figure 5.8) obtained for an aqueous solution oxacillin
sodium from -50 to 15 degrees centigrade shows an
exothermic transition at -13.8 de9rees centigrade. This
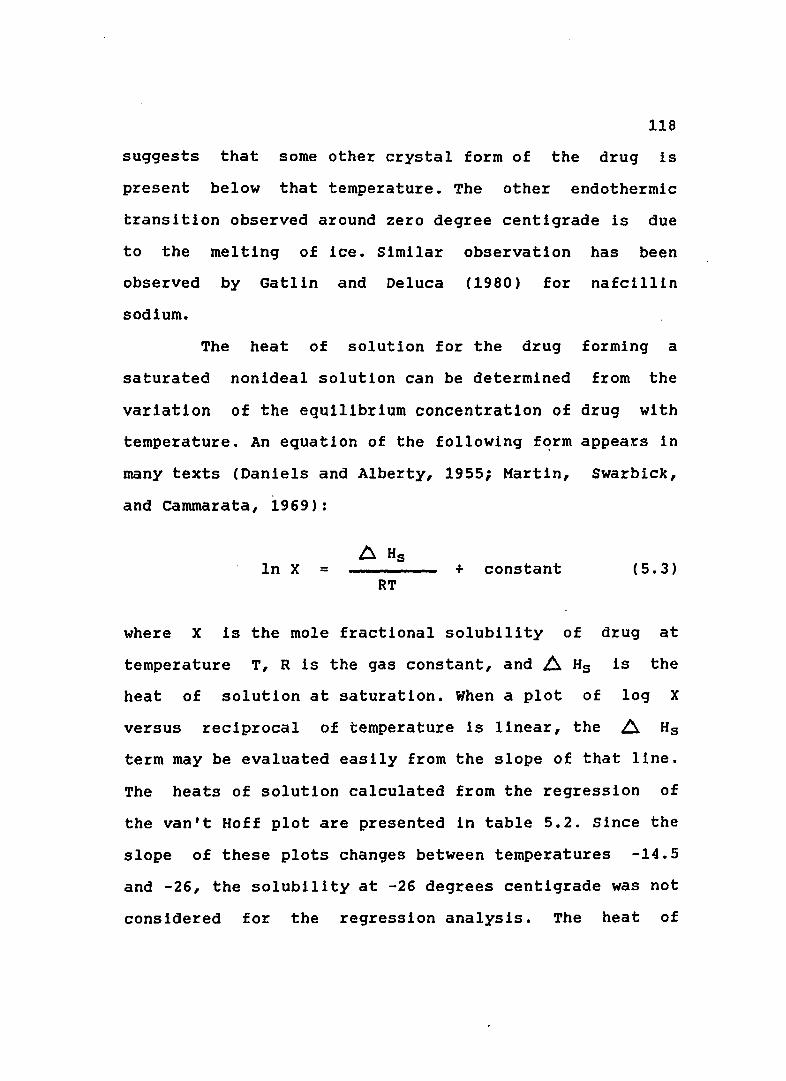
118
suggests that some other crystal form of the drug is
present below that temperature. The other endothermic
transition observed around zero degree centigrade is due
to the melting of ice. Similar observation has been
observed by Gatlin and Deluca (1980) for nafcillin
sodium.
The heat of solution for the drug forming a
saturated nonideal solution can be determined from the
variation of the equilibrium concentration of drug with
temperature. An equation of the following f~rm appears in
many texts (Daniels and Alberty, 1955; Hartin, Swarbick,
and cammarata, 1969):
In X = + constant (5.3) RT
where X is the mole fractional solubility of drug at
temperature T, R is the gas constant, and ~ Hs is the
heat of solution at saturation. When a plot of log X
versus reciprocal of temperature is linear, the Ll Hs
term may be evaluated easily from the slope of that line.
The heats of solution calculated from the regression of
the vantt Hoff plot are presented in table 5.2. Since the
slope of these plots changes between temperatures -14.5
and -26, the solubility at -26 degrees centigrade was not
considered for the regression analysis. The heat of

119
solution does not depend on composition or temperature in
the +21 to -14 temperature range. The heat of solution is
nearly a constant at 1.2 kcal per mole. The solubility is
largely independent of temperature in this temperature
range. This is expected as the heat of solution is low.
In summary, the present study indicates that the
solubility of oxacillin sodium decreases slightly with
temperature. However, the results show an increase in
drug solubility at temperatures below -14.5 degrees
centigrade. This is attributed to a different form of
drug and is corroborated by the thermal analysis.
Therefore decreasing temperature below -14.5 degrees may
improve stability by reducing the reaction rate but not
by reducing the drug solubility.

120
~A---~ SYRINGE
~J--"""~ INSULATOR
1 ..... ---1-,. FILTER
FIGURE 5.1: SCHE~~TIC DIAGRAM OF FILTRATION UNIT

2.5~--------------·------------------------------------------~
2.4
2.3
~ e ~ - 2.2 til
t!) 0 ~
2.1
2
1.9 -tl--,r--,---,---..,.....--.--r--r--,..---~ . 1 o 0.2 0.4 0.8 0.8 1
VOLUME FRACTION COSOLVENT
FIGURE 5.2: SOLUBILITY OF OXACILLIN SODIUM AT 21 DEGREES CENTIGRADE
J-o-& N J-o-&

2.4.--------------------
2.3
2.2 ,....j
E ...... 2.1 S, -til
g 2 ..:I
1.9
1.8 !"I--.---,----.---r--.---,---.,---.,..----J 0.1 0.3 0.5 0.7 0.9
VOLUME FRACTION COSOLVENT
FIGURE 5.3: SOLUBILITY OF OXACILLIN SODIUM AT 12 DEGREES CENTIGRADE ~
'" '"

~5~----------------------------------------------------__
2.4
2.3
.-f 2.2
~ 6, ....
2.1 tJ)
t!) 0 ~
2
1.9
1.B~I~--~----~----~----r---~-----r----~----r---~----~
o 0.2 0.4 0.8 O.B 1 VOLUME FRACTION COSOLVENT
FIGURE 5.4: SOLUBILITY OF OXACILLIN SODIUM AT 5 DEGREES CENTIGRADE
.... N (.0)

.-I e
~~ -2.2
2.i~
2.1
g 2.05 FROZEN REGION
tJ'l
[J)
t!> o ..:I
2
1.95
1.9
1.85 -tl---r---.---t---..-----.---....----,.---r---.---t o 0.2 0 .... 0.8 0.8 1
VOLUME FRACTION COSOLVENT
FIGURE 5.5: SOLUBILITY OF OXACILLIN SODIUM AT -6 DEGREES CENTIGRADE ~ t\)
~

2.15 ----- -----,---------------------,
2.1
2.05
J FROZEN o-f REGION ~ S, -til 1.95 t!) 0 ..:I
1.9
1.85
1.8 -+I--........ --..--~._-....... -___r--...._-_?_-_,.--_r_--I o 0.2 0.4 0.8 0.8 ,
VOLUME FRACTION COSOLVENT
FIGURE 5.6: SOLUBILITY OF OXACILLIN SODIUM AT -14.5 DEGREES CENTIGRADE .to.)
<.n

2.12
2.1
2.08
2.08
2.04
2.02 FROZEN REGION -M
~ 2 &
1.98 [I)
(!) 1.98 0 H
1.94
1.92
1.9
1.88 0 0.2 0.4 0.8 0.8
VOLUME FRACTION COSOLVENT
FIGURE 5.7: SOLUBILITY OF OXACILLIN SODIUM AT -26 DEGREES CENTIGRADE
1
.... t-J en

127
20 0
-
............
o ,
-12a+-~--~~--~--~·0~--~~~~~~~--+ -4frl -sa -2RJ -11:5 B lEI
TEMPERATURE (oC)
FIGURE 5.8: DSC THER.'10GRAM OF 50% AQUEOUS SUSPENSION OXACILLIN SODIUM (HEATING CURVE)

128
TABLE 5.1: LOG SOLUBILITY (gm/rn1) VERSUS VOLUME FRACTION OF r-mTHANOL IN WATER
TEMPERATURE (oC)
SLOPE INTERCEPT R SQUARE
21 -0.49 2.43 0.98
12 -0.51 2.43 0.97
5 -0.54 2.41 0.99
-6 -0.67 2.49 0.92
-14.5 -0.49 2.33 0.98
-26.0 -0.54 2.44 0.95

TABLE 5.2: LOG SOLUBILITY (MOLE FRACTION) VERSUS RECIPROCAL OF TEMPERATURE
129
COMPOSITION R SQUARE .6HS (Kca1/rno1e) INTERCEPT
0.3 0.99 0.869 -1.42
0.4 0.92 1.232 -1.22
0.5 0.99 1.133 -1.34
0.6 0.89 1.356 -1.19
0.7 0.94 1.315 -1.29
0.8 0.87 1.356 -1.33
0.9 0.93 1.516 -1.28
1.0 0.93 0.929 -1.78

130
CHAPTER 6
SUMMARY
Freeze-drying, or lyophilization, is frequently
regarded as an expensive process due to often long
process times and high 'capital equipment costs. So there
is considerable economic motivation to minimize process
times. Indeed, the objective of the freeze-drying process
development is to minimize the process time while
maintaining high product quality.
Heat transfer from the source to the sublimation
Interface is usually the rate limiting process and thus
leading to lengthy drying cycles. The gas phase resulting
from lack of intimate contact between the heat source and
the frozen product presents a largest resistance to heat
transfer during the lyophilization of parenteral
solutions.
Several heat transfer augmentation devices,
including a multilayered corrugated aluminum quilt and a
conformal fluid cushion device, which fills this gap were
described. Using these devices the temperature difference
across the embedding space between the vial bottom and
the shelf top was reduced due to enhanced heat transfer.
The sUblimation rate was increased. The drying time was
decreased due to the faster cooling and drying of the

131
product. The fluid cushion device was found to be
superior to the aluminum quilt as it does not allow the
accidently spilled solution to stay underneath the vials
and it provided greater vial to vial temperature
uniformity among the same batch of vials. It is likely
that it will also increase the batch to batch temperature
uniformity and reduce the probability of meltback due to
decreased intravial temperature variation.
The solubility behavior of the nonelectrolyte
solutes in cosolvent-water mixtures can be expressed by
the following expression:
log Sm = log Sw + fu
where f is the volume fraction of cosolvent and u is a
coefficient characteristic of a particular cosolvent. The
solubilities of sodium chloride and potassium chloride
were meassured in eight cosolvent-water mixtures using
argentimetric titrations. The solubility of both the
electrolyte solutes was found to obey the above log
linear relationship. A cosolvent which was most effective
in solubilizing the nonelectrolyte solutes was also found
to be most effective in desolubilizing the electrolyte
solutes.
The solubility of oxacillin sodium was determined
in methanol-water mixtures at various temperatures

132
ranging from +21 to -26 degrees centigrade. The
solubility of oxacillin sodium decreased slightly with a
decrease in temperature. However, the results showed an
increase in drug solubility at temperatures below -14.5
degree centigrade. This anomalous behavior can be
attributed to a diffrent form of drug and was
corroborated by the thermal analysis. Therefore,
decreasing the temperature of the drug solution below
14.5 degrees centigrade might improve the drug stability
by reducing the reaction velocity.

APPENDIX
PHYSICOCHEMICAL PROPERTIES OF
SOME MATERIALS OF INTEREST
133

THERMOPHYSlCAL PROPERTIES OF SOME LIQUIDS
LIQUID TEMPERATURE THERMAL CONDUCTIVITY BOILING POINT
CoC) -1 sec-l COC)-l) CoC) Cca1 em3 x 10
Glycerin 2 0 0.674 290 27 0.684
Ethylene 2 0 0.578 197 Glycol 27 0.602
Mercury 2 0 19.6 357
27 .20.4
Water 1 0 1.374 100 27 1.454
1. Weast, R.C., CRC Handbook of Chemi~try and Physics, 66th edition, 1980.
2. Incropera, F.P., and Dewitt, D.P.; 'Introduction to Heat Transfer, 1985.
HEAT CAPACITY (cal gm-l (OC)-l
0.5399 0.5796
0.5478 0.5767
0.0335 0.0333
1.0042 0.9975
.... w .::.

MATERIAL
Borosilicate Glass 1
Aluminum 2
Copper 3
Steel 3
Air2
Ice 2
Polyethylene
THERMAL CONDUCTIVITIES SOME MATERIALS COI~ON TO LYOPHILIZATION
TEMPERATUP.E COC)
-100 0
-73 27
-73 27
18 100
-23 23
-20 0
20
THERMAL CONDUCTIVITY X 103
(cal em-1 sec-1 (OC)-l)
205.0 260.0
566.45 566.45
987.0 958.0
112.0 107.0
0.053 0.063
4.85 4.49
0.833
1. Weast, R.C., CRe Handbook of Chemistry and Physics, 66th edition, 1980.
2. Incropera, F.P., and Dewitt, D.P., Introduction to Heat Transfer, 1985.
3. Bird, R.B., Stewart, W.E., and Lightfoot, E.N., Transport Phenomena, 1960. .(.0) (It

THERMAL CONDUCTIVITIES OF SOME NONVOLATILE OILS NEAR ROOM TEMPERATURE
OIL TEMPERATURE THERMAL CONDUCTIVITY X 103
(oC) (cal em -1 sec-1 (oC)-l)
Mineral Oil 1 20 0.313 40 0.308
Petroleum 011 1 20 0.359
2 Silicone Oil (MW 162) 60 0.237 (MW 1200) 60 0.316 (MW 15800) 60 0.382
Transformer Oil 1 0 0.325 20 0.320
Castor Oil 1 20 0.425
Cylinder Oi11 81 0.290
Olive Oil 1 15.7 0.4515
Turpentine Oil 1 12 0.260
1. Incropera, F.P., and Dewitt, D.P., Introduction to Heat Transfer, 1985.
2. Dean, J.A., Lange's Handbook of Chemistry, 11th edition, 1973. .... w en

137
REFERENCES
Beckett, A.H. and Stenlake, J.B., Practical Pharmaceutical Chemistry. Athlone Press, London, Chapter 9, 1975.
Catton, I., "Natural convection in horizontal liquid layers," Physics of Fluids, 9, P. 2521, 1966.
Chatterji, D., Hiranaka, P.K., and Galleli, J.F., Am. J. Hosp. Pharm., 32, P. 1130, 1975.
Chawla, H., Pinal, R., Horris, K.R., and Yalkowsky, S.H., "Cosolvency I: Some non-hydrogen bonding solutes with non-hydrogen bonding solvents," J. Toxicol. and Environ. Chern., in press.
Copson, D.A., "Microwave Sublimation of Foods," Food Technol., 12, P. 270, 1958.
Daniels, F., and Alberty, R.A., Physical Chemistry, 2nd edition, wiley, New York, N.Y., chapter 10, 1955.
Deluca, P.P., "Freeze drying of pharmaceuticals," J. Vac. Sci. Technol., 14, No.1, P. 620, 1977.
Dushman, S., and Lafferty, J.M., Scientific foundations QL vacuum technigue, Wiley and Sons, New York, NY, P. 53, 1962.
Flamberg, D.W., "Manufacturing considerations in the lyophilization of parenteral products," Pharm. Manufacturing, P. 29, March 1986.
Flink, J.H., and Karel, M., "Mechanisms of organic volatiles in freeze-dried Food Tech., 7, P. 199, 1972.
retention of systems", J.
Flink, J.M., and To, E.C., "Collapse, a structural transition in freeze dried carbohydrates," J. Food Tech., 13, P. 551, 1978.
Flink, J.H., and Hodelina, K.H., "Freeze drying at high temperatures: product quality and drying characteristics", Proceedings of the 3rd International Drying Symposium, University of Birmingham, U.K., Vol. 2, P. 497, 1982.

138
Gatlin, L., and Deluca P.P., "A study of the phase transitions in frozen solutions by differential scanning calorimetry," J. Parent. Drug Assoc., 34, No.5, P. 398, 1980.
Goldbli th, S .. A. , Rey, L., and Rothmayr, w. W., Drying and Adyanced ~ Technology, Academic Press, 1975.
Greaves, R.I.N., "The application of heat to drying systems," Ann. N.Y., Acad. ScL, 682, 1960.
Freeze London:
freeze-85, P.
Hirschfelder, J.O., Curtiss C.F., Molecular theorv 2f gases and New York, 1954.
and Bird liQuids,
R. B., Wiley,
Ito, K., "Freeze-drying of pharmaceuticals. On the change in the macroscopic appearance during freezing and the critical temperature necessary for freezedrying," Chern. Pharm. Bull., 18, P. 1509, 1970.
Ito, K., "Freeze-drying of pharmaceuticals. On the macroscopic appearance of frozen and dried samples in connection with the growth of eutectic crystals," Chern. Pharm. Bull., 18, P. 1519, 1970.
Ito, K., "Freeze-drying of pharmaceuticals. Eutectic temperature and collapse temperature of solute matrix upon freeze-drying of three component systems," Chern. Pharm. Bull., 19, P. 1095, 1971.
Jennings, T.A.," Optimization of the lyophilization schedule," Drug and Cosmetic Industry, P.43, Nov., 1980.
Jennings, T.A., "Effect of pressure on the SUblimation rate of ice," J. Parent. Sci. Tech., 40, No.3, P. 95, 1986.
Joseph, A., Pomeranz, K., Prince, J., and "Physics ~ Engineering Technology, Sons, Inc., New York, 1966.
Sacher, D., John Wiley &
Karel, M., "Heat and Mass Transfer in Freeze Drying," Proc. Sixth International Course on Freeze Drying and Advanced Food Technology, Burgenstock-Lucerne, Switzerland, P. 17, June, 1973.
139
Kutzner, K., and Wietzke, I., Vakuum-Technik, 21, P. 54, 1972.
Kutzner, K., Schmidt, F., and Wietzke, I., "Radiative and conductive heat transmission through super insulations experimental results for aluminum coated plastic foils," Cryogenics, P. 396, July 1973.
Liapis, A.I., and Litchfield, R.J., "Optimal control of a freeze dryer I: Theoretical development and quasi steady state analysis," Chern. Eng. sc1., 34, P. 975, 1979.
and Marchello, J.M., "Advances in the and control of freeze-drying," in in prying, Vol. 3 (edited by A.S.
Liapis, A.I., modeling Advances Mujumdar), Hill, 1984.
Washington, D.C.: Hemisphere/Mcgraw-
Litchfield, R.J., Liapis, A.I., and Farhadpour, F.A., "Cycled pressure and near-optimal pressure policies for a freeze dryer", J. Food Tech., 16, P. 637,1981.
Malkus, W.V. R., and Veronis, cellular convection," J. 3, P. 225, 1958.
G., "Finite amplitude Fluid Mechanics, 4, No.
Martin, A.N., Swarbick, J., and Cammarata, A., Physical Febiger, Pharmacy, 2nd edition, Lea and
Philadelphia, Pa., 1969.
Mellor, J.D., Fundamentals 2L freeze dryIng, London: Academic Press, 1978.
Nail S.L., "The effect of chamber pressure on heat transfer in the freeze-drying of parenteral solutions," J. Parent. Drug Assoc., 34, No.5, P. 358, 1980.
Nail, S.L., and Gatlin, L.A., "Advances in control of production freeze dryers," J. Parent. Sci. Tech., 39, No.1, P. 16, 1985.
oetjen, G.W., Ehlers, H., Hackenberg, U., Moll, J., and Neumann, K.H., "Temperature measurements and control of freeze drying processes," in Freeze Drying 2L Foods, National Acad. of Sciences, National Research Council, Washington, D.C., P. 25, 1962.

140
Pearlstein, A.H., and Pourier, P .T., Private communication, 1987.
Perry, J.H., Chemical engineer's handbook, 4th edition, McGraw-Hill, New York, NY, P. 17, 1963.
Pikal, M.J., Shah, S., Senior, D., and Lang, J.E., "Physical chemistry of freeze-drying: Measurement of sublimation rates for frozen aqueous solutions by a microbalance technique," J. Pharm. Sci., 72, No.6, P. 635, 1983.
Pikal, M.J., Roy, M.L., and Shah, S., "Mass and Heat transfer in vial freeze drying of pharmaceuticals," J. Pharm. Sci., 73, No.9, P. 1224, 1984.
Pikal, M.J., "Use of laboratory data in freeze drying process design: Heat and mass transfer coefficients and the computer simulation of freeze drying," J. Parenteral Science and Tech., 39, No. 3, P. 115, 1985.
Pikal, M.J., PrIvate communIcatIon, 1987.
Rey, L. "Fundamentals Aspects of LyophilIzation," in Aspects TheQrlgues ~ Industriels ~ la Lyophilisation, Rey, L. (Ed.), Hermann, Paris, P. 23, 1964.
Rieutord, L., Brevets d'Inventlon Usifroid, Paris, 1960.
Rubino, J.T., Blanchard, J., and Yalkowsky, S.H., ilization by cosolvents II: Phenytoin in and ternary solvents," J. Parenteral Sci. 38, P. 215, 1984.
"Solubbinary· Tech. ,
Rubino, J.T., and Yalkowsky, S.H., "Solubilization by cosolvents III: Diazepam and benzocaine in binary solvents," J. Parenteral Sci. Tech., 39, P. 106, 1985.
Rubino, J.T., and Yalkowsky, S.H., "SolubIlization by cosolvents I: Organic solutes in propylene glycolwater mixtures," J. Pharm. Sci., 74, P. 416, 1985.
~ User's Guide; Basics, SAS Institute, cary, N.C., 1982.

141
seligmann, E.B., Jr., and Berkeley, W.H., "Direct contact tray assembly for freeze drying", Appl. Mic~obiol., 5, P. 830, 1965.
Williams, N.A., Lee, Y., Polli, G.P., and Jennings, T.A., "The effects of cooling rate on solid phase transitions and associated vial breakage occuring in frozen mannitol solutions," J. Parent. Sci. Tech., 40, No.4, P. 135, 1986.
Yalkowsky, S.H., and Roseman, T.J., Technigues ~ solubilization ~ drugs, Ed. Yalkowsky, S.H., Marcel Dekker Inc., N.Y., Chapter 3, 1981.