u,me~'nlo assistance programme - world...
TRANSCRIPT

u,me~'nlo Assistance Programme
.. . C
.0 . f - -. -. f .. . - - E.
- - . . v.- - *No. U320 NA
. ... OF'wM |ec'
Pub
lic D
iscl
osur
e A
utho
rized
Pub
lic D
iscl
osur
e A
utho
rized
Pub
lic D
iscl
osur
e A
utho
rized
Pub
lic D
iscl
osur
e A
utho
rized
JOINT UNDP / WORLD BANKENERGY SECTOR MANAGEMENT ASSISTANCE PROGRAMME (ESMAP)
PURPOSE
The Joint UNDP/World Bank Energy Sector Management Assistance Programme (ESMAP) waslaunched in 1983 to complement the Energy Assessment Programme, established three yearsearlier. ESMAP's original purpose was to implement key recommendations of the EnergyAssessment reports and ensure that proposed investments in the energy sector represented the mostefficient use of scarce domestic and external resources. In 1990, an international Commissionaddressed ESMAP's role for the 1990s and, noting the vital role of adequate and affordable energyin economic growth, concluded that the Programme should intensify its efforts to assist developingcountries to manage their energy sectors more effectively. The Commission also recommendedthat ESMAP concentrate on making long-term efforts in a smaller number of countries. TheCommission's report was endorsed at ESMAP's November 1990 Annual Meeting and promptedan extensive reorganization and reorientation of the Programme. Today, ESMAP is conductingEnergy Assessments, performing preinvestment and prefeasibility work, and providing institutionaland policy advice in selected developing countries. Through these efforts, ESMAP aims to assistgovernments, donors, and potential investors in identifying, funding, and implementingeconomically and environmentally sound energy strategies.
GOVERNANCE AND OPERATIONS
ESMAP is governed by a Consultative Group (ESMAP CG), composed of representatives of theUNDP and World Bank, the governments and institutions providing financial support, andrepresentatives of the recipients of ESMAP's assistance. The ESMAP CG is chaired by the WorldBank's Vice President, Finance and Private Sector Development, and advised by a TechnicalAdvisory Group (TAG) of independent energy experts that reviews the Programme's strategicagenda, its work program, and other issues. ESMAP is staffed by a cadre of engineers, energyplanners and economists from the Industry and Energy Department of the World Bank. TheDirector of this Department is also the Manager of ESMAP, responsible for administering theProgramme.
FUNDING
ESMAP is a cooperative effort supported by the World Bank, UNDP and other United Nationsagencies, the European Community, Organization of American States (OAS), Latin AmericanEnergy Organization (OLADE), and countries including Australia, Belgium, Canada, Denmark,Germany, Finland, France, Iceland, Ireland, Italy, Japan, the Netherlands, New Zealand, Norway,Portugal, Sweden, Switzerland, the United Kingdom, and the United States.
FURTHER INFORMATION
For further information or copies of completed ESMAP reports, contact:
ESMAPc/o Industry and Energy Department
The World Bank1818 H Street N.W.
Washington, D.C. 20433U.S.A.

For Official Use
Report No. 11320-NAM
NAMIBIA
Issues and Options in the Energy Sector
March 1993
ESMAPc/o Industry and Energy DepartmentThe World Bank1818 H Street NWWashington D.C. 20433USA


ABSTRACT
Namibia is fortunate in that the energy sector is not a constraint on growth,as it is in so many developing countries. Indeed, through the exploitation of Namibia'shydroelectric and/or hydrocarbon resources for export, the sector may well become amajor engine of growth. At present, industry, commerce and the country's populationcenters are adequately supplied with commercial energy (electricity and petroleumproducts) at realistic prices. However, many households lack access to modem energysupplies and, especially in rural areas, still rely on wood and other traditional fuels.While fuelwood is increasingly difficult to come by in some areas, there are few signs ofresulting hardship, or that fuelwood cutting is contributing significantly to deforestation.
While the present strengths and resource potential of the energy sectorgive good grounds for optimism about its future development, much will depend on howeffectively the policy, investment and institutional issues that are the focus of this reportare addressed. Critical decisions will soon have to be made concerning the Epupahydroelectric project and the Kudu offshore gas field, as well as such issues as ruralelectrification and the least cost means of meeting future domestic power needs. Inaddition, the growing size and complexity of the sector will inevitably call for a moresystematic and sophisticated approach to regulation. On the petroleum side there is aneed to consider the possible dismantling of the present system of domestic priceregulation while, in the virtually unregulaed power sector, a whole new regulatory systemneeds to be devised and put in place. High priority also should be given to therestructuring of the institutionally fragmented and inefficient electricity distributionsystem.


Currency Equivalents
June, 1992
1 Rand = 0.36 US$1 US$ = 2.75 Rand
Abbreviations
MLGH Ministry of Local Governmentand Housing
MME Ministry of Mines and EnergyNISER Namibian Institute for Social and
Economic ResearchNAMCOR National Petroleum Corporation of
NamibiaR/Rc Rand/Rand centsRSA Republic of South AfricaSWAWEK South West Africa Water and
Electricity Corporation
Measurements
GWh gigawatt hourkg kilogramkan kilameterkW kilowattkWh kilowatt hoursMCF thousand cubic feetMJ megajouleMMBTU million British thermal unitsMMCFD million cubic feet per dayMW megawattTCF trillion cubic feettoe tons of oil equivalent


CONTENTS
EXECUTIVE SUIMMARY
I. INTRODUCTION 1
II. ENERGY AND THE ECONOMY 2The Economic Setting 2Energy Consumption 3
Im. HOUSEHOLD ENERGY 5Fuelwood 5Household Use of Conventional Fuels 9Small Scale Renewable Energy Sources 10Wood and Charcoal from Brush Clearing 13Rural Electrification 13
IV. MEETING NAMIBIA'S ENERGY NEEDS 17Power 17Petroleum Supply 28
V. EXPORT OPPORTUNITIES 34Epupa Hydropower Project 34Kudu Offshore Gas Field Development 36The Way Ahead 39Oil Exploration 40
VI. INSTITUTIONAL ISSUES 42Strengthening the MME 42Regulating the Power Sector 43Rationalizing Power Distribution 44Petroleum Product Pricing 45
ANNEX A 47Energy Balances, 1989-91ANNEX B 50Cost Comparison Of Short And Medium Term Power Supply OptionsANNEX C 54Epupa Hydropower Project


i
EXECUTIVE SUMMARY
1. Namibia is fortunate in that the energy sector is not a constraint on growth, as it is inso many developing countries. Indeed, through the exploitation of Namibia's hydro-electricand/or hydrocarbon resources for export, the sector may well become a major engine ofgrowth. At present, industry, commerce and the country's population centers are adequatelysupplied with commercial energy (electricity and petroleum products) at economic prices.However, many households sLill lack access to modem energy supplies and, especially inrural areas, still rely on wood and other traditional fuels, particularly for cooking.
2. Per capita energy use in 1991 amounted to 0.51 toe, which is well above that of mostSub-Saharan Africa. However, traditional fuelwood (non-commercial energy) plays a muchmore limited role in energy consumption (around 14%) in Namibia than in most othercountries on the continent. The predominance of commercial energy in the Namibianenergy balance reflects the importance of the energy-intensive mining industry in thecountry's economic structure as well as the relatively high incomes enjoyed in the modem,urban areas and the ready availability there of commercial energy at reasonable prices. Theincrease of energy consumption in the next few years is likely to parallel the modest growthrate foreseen for the economy and, thus, to arerage some 3.0-3.5% per annum.
3. While the energy sector today serves Namibia well, and much has beenaccomplished since independence, its future will depend in good measure on effectivelyaddressing the policy, investment and institutional issues that are the focus of this report.
Household Energy
Household Fuels
4. Fuelwood is the main energy source in rural areas, where it is frequentlysupplemented by dung and agricultural residues. Electricity is the main cooking fuel in theurban areas, where bottled gas and paraffin are also used to a limited extent. A householdenergy survey conducted in preparation for the assessment indicates that, while fuelwood isincreasingly difficult to come by in some areas, there are few signs of resulting hardshipand that energy in general does not take a disproportionate share of household budgets.
5. Widespread deforestation is clearly taking place in the north, where the bulk of therural population lives. However, the amounts of wood used in homestead construction aremany times greater than those used for fuelwood. Clearing for agriculture can also destroyconsiderably more forest than fuelwood cutting. Indeed, even if fuelwood consumptionwere to cease completely, deforestation would continue rapidly as a result of cutting treesfor homesteads and agricultural clearing. Any resolution of the deforestation problem willthus require a coordinated approach involving a wide variety of non-energy inputs andinitiatives.
6. The fact that the majority of families appear able to manage satisfactorily with theenergy resources freely available to them greatly limits the potential and the need forintervention in the rural fuelwood sector. Promoting tree growing for fuelwood is unlikelyto be successful. Investing time and effort in a woodlot is not an attractive option to afamily which can readily obtain brush wood, agricultural residues and animal dung assubstitutes if traditional supplies of fuelwood become scarce. Where fuelwood is purchased,there may, however, be some scope for the introduction of improved cooking stoves in orderto help families reduce the amount they spend on fuelwood. The mission recommends that

a preliminary assessment be made of the potential for introducing improved stoves in thenon-electrified urban areas as well as in the north.
7. Electricity is more or less universally available in the urban areas. It is the maincooking fuel for the great majority of families even in the lower income areas because it ismarkedly cheaper than fuelwood, paraffin, or bottled gas. The provision of electricity cantherefore bring significant savings to families who purchase their fuelwood.
Renewable Energy
8. The Namibian renewable energy sector appears to be in an unusually strongposition. Photovoltaics and wind are well developed and filling the niches for which theyare presently suited both effectively and competitively. The private sector is active andcompetent; it should continue to play the major role in renewable energy development. Thisshould be facilitated by increased government support focused on data gathering anddissemination, the commissioning of studies and pilot projects and the establishment ofperformance and design standards.
Rural Electrrficadon
9. Rural electrification is an important element in the government's policy of redressingthe long neglect of the communal lands under the previous administration and directlyassisting Namibia's rural poor. As presently carried out, it mainly involves the provision ofgrid extensions to government facilities and other selected rural centers, most of which werepreviously supplied by isolated diesel generators. The largest rural electrification programat presently underway is in the northern province of Owamr.bo and is funded by NORAD.The transmission component of the program consisted of 530 km of high voltage line andassociated transformers and was completed in early 1992, almost a year ahead of scheduleand with a saving of more than 25% of the project budget. Progress on the local distributionsystem has, however, been slow.
10. It is unlikely that the Owambo project, and others like it, can be justified on stricteconomic grounds. Their primary justification must be social and political, which is entirelylegitimate but does not obviate the need to carefully evaluate such benefits. The direct socialbenefits may well be limited. Most of the government facilities already have electricity andtheir functioning will not be substantially altered although they will benefit from morereliable power supply and there will be substantial fuel cost savings. Internationalexperience generally indicates that the provision of grid electricity is unlikely, in itself, tobring about economic development which would otherwise not occur. Furthermore, thenumber of domestic connections is also likely to be low. Even if there is a high connectionrate in the electrified centers themselves, the number of households supplied will inevitablybe a small proportion of the total population of the region, which outside the few towns iswidely dispersed.
11. The undoubted need to address the needs of long-neglected rural people should beweighed against these uncertainties about the actual economic and social impact of presentrural electrification programs. The mission believes that sound decisions about furthermajor investments in Owambo-like rural electrification programs will only be possible whenimproved institutional arrangements for distribution are in place and when the economicviability and social benefits of the Owambo program can be better evaluated. As discussedbelow, Namibia's electricity distribution system needs to be restructured institutionally; inthis context, special attention should be paid to arrangements for rural electrificationincluding, perhaps, the creation of a special distribution agency for the north. While the

iii
administrative and population centers will remain a natural priority for grid connections,consideration of future rural electrification investments should address the question of howthe more dispersed rural population can also be provided with at least some of the benefitsof electrification. A study should be made of such options as small photovoltaic systemsfor lighting and radio; commercial battery charging systems using photovoltaics or smalldiesel generators; and local community management of small supply systems.
Meeting Namibia's Energy NeedsPower
12. The power sector today presents a picture of good health. An extensive nationalgrid supplies urban and industrial consumers with ample supplies of power at tariffs which,while low by international standards, are more than adequate to keep the national powercompany financially flush. However, Namibia is heavily dependent on power imports fromthe RSA and, with demand beginning to press on capacity, it will soon have to faceimportant decisions, involving major investments, concerning how best to meet future needs.Other pending questions include revision of the tariff structure; the finances of the powercompany and their relationship to investment needs; whether to press ahead with large scalehydropower development for export to the RSA; and institutional refonm .
13. The operating institutions in the power sub-sector consist of a national generatingand transmission company and 46 municipal and local distribution agencies. The normativeinstitution is the Ministry of Mines and Energy (MME), which has broad regulatory andpolicy-making responsibility. The national power company, the South West African Waterand Electricity Company (SWAWEK), is responsible for generation and transmission ofpower in areas covered by the national grid. SWAWEK supplies the national gridprincipally from its Ruacana hydropower plant and with imports from the RSA. It can bereasonably assumed that the system's guaranteed capacity is effectively reduced to 260-300MW during the dry season, including the imports contribution but excluding the high costthermal reserve. Peak demand would tend to exceed this capacity by 1995/96, whenNamibia's dependency on energy imports would reach around 40% of total electricityconsumed. Even with demand growing more slowly than in the past, at about 3.5% perannum, additional generating and/or import capability would be required at that time.
14. SWAWEK's plans for meeting Namibia's power needs in the short-medium termhave been focused mainly on an increase of imports. It has been planning to build anadditional 400kV line as soon as additional import capacity becomes necessary, assumingthat this line will be required in the early years of the next century to carry exports from theproposed Epupa hydropower project to the RSA. The mission's analysis indicates thatother options, although limited in scope, may be more attractive. They may make it possibleto defer major investments in transmission, which could be a great advantage so long as thefate of Epupa remains uncertain, as may well be the case for some time. It is thereforerecommended that these options be investigated further in the following order of priority:
--A peak/off-peak tariff for large consumers. This demand side option should begiven the highest priority because it could bring benefits equivalent to adding 10-20MW of capacity at very low cost.
--Adding a Fourth Unit at Ruacana. Investigating the technical feasibility of thisoption should be accorded first priority on the supply side.

iv
--Gas turbines for peaking capacity. Although a relatively high cost solution, thiscould become a viable option if a time-of-use tariff is adopted.
15. These three options, as well as the plans for transmission for increasing importsfrom the RSA, should be the objects of a study aimed at defining a least-cost generation-transmission plan for meeting Namibia's power needs in the short and medium term.Indeed, such a study could mark the initiation of a much needed more systematic approachto power planning for optimizing sector investment decisions on the basis of a full range ofsupply and demand side options.
16. SWAWEK's costs are very low (0.053 R./kWh in 1991, i.e. less than 2 UScents/kWh), so that even with tariffs that are modest by international standards, income fromoperations substantially exceed operating expenditure. However, the tariff structure for bulksales and final consumers leaves much to be desired economically. It does not reflect thestructure of Namibia's hydro-thermal power supply costs which are strongly affected bypeak and off-peak hours and, probably more important, by the period of the year (i.e. wetand dry seasons). Since capital expenditures have been relatively low, SWAWEK has beengenerating a sizable cash surplus in recent years. The continued piling up of surpluses inSWAWEK's coffers would not be in the best interest either of the government, which facesserious budgetary problems, or of SWAWEK, which could discover that a cash cow's life isnot necessarily a happy one. Much will depend on the decisions to be taken about thepower sector investment program. If major new investments are to be made in the nearfuture, SWAWEK will need all the resources it can generate; if investment remains limited,SWAWEK's resources might be regarded as surplus to its requirements and a case couldbe made for having it fund rural electrification programs, and pay increased taxes and/ordividends to the government.
Petroleum Supply
17. There is as yet no indigenous source of petroleum in Namibia, and no refinery;hence, all products must be imported. The present system which relies on private firms toimport products and distribute them, but with the government closely controlling prices,profits and other aspects of their operation, has evolved from that used in the RSA. Itworks well in meeting the needs of the Namibian market; products of appropriate quality arereadily available throughout the country (except in some remote areas) at economicallyrealistic prices. Since independence, one of the government's major objectives has been thediversification of product supply away from complete dependence on the RSA, and in 1991the portion of Namibia's supplies coming from the RSA was reduced to about 65%. Thegovernment has, at least informally, decided not to press for further diversification of supplyat the present time. This decision seems wise since experience to date appears to indicatethat a significant increase in purchases from non-RSA sources might come only atappreciably higher cost in terms of price, security of supply and product quality.
18. While small in absolute size, Namibia's petroleum consumption per capita is high byAfrican standards. Given the already high consumption level, and tde modest prospects foreconomic growth in the near term, gasoline demand is forecast to grow at only 4% per year,and diesel at 2% per year. Six private companies are now active in the Namibian marketSince the prices of the major products are controlled, competition must be based on servicein lieu of price. This has put a premium on the expansion and modernization of thecompanies' network of service stations. As a result, the country is well served, but"overpumped" - -i.e., there has been over-investment in an excessive number of overlyelaborate service stations.

v
19. In June 1991, it was announced that the government had agreed to the constructionof a refinery proposed by private parties. Little is known about the proposal but theeconomic and financial viability of the project appears highly questionable because of itssmall size (15,000 b/d), a likely product mix that would not match the needs of theNamibian market and inland location. The risk to Namibia from the project appears to havebeen minimized by the requirement that it be constructed without public funds and operatedwithout public subsidy. Moreover, no implementation activity has been evident since theproject was announced and there is no indication of when, if ever, the sponsors intend toproceed with the project
Export Opportunities
Epupa Hydropower Project
20. The hydropower potential of the Kunene river, shared with Angola, constitutes oneof the main energy resources of Namibia. SWAWEK has identified a promising site for thedevelopment of a major hydro plant in the vicinity of the Epupa falls. Given Namibia'spresent generating and import capability, the capacity and energy to be supplied by theproject, particularly for its larger and costwise more attractive size (i.e. 450-500 MW) wouldnot be absorbed by Namibia's power market before the year 2010. Therefore, the project'seconomic viability in the medium term has been considered to rest heavily on its potentialfor exports to the RSA. However, the RSA currently has excess capacity of around 7,000MW and so will most probably not need additional capacity until early in the next century.ESKOM has indicated that it is interested, in principle, in purchasing power from Epupawhen it needs additional capacity but that Epupa would have to be competitive with low costcoal-fired generation in the RSA and with other potential sources in the region such as theKudu gas field and the Cahora Bassa plant in Mozanbique.
21. Until the results of the pre-feasibility study SWAWEK commissioned in 1992become available, there will be no basis for assessing the project other than SWAWEK'sown preliminary studies, which appear optimistic. Using capital costs based on Bankexperience indicates that energy from Epupa would cost 4.0-6.0 US cents/kWh, comparedto the 3.5 US cents/kWh resulting from SWAWEK's preliminary estimates. Although eventhe higher costs may appear attractive by international standards, they suggest that Epupawould have serious difficulty in competing in the RSA market. ESKOM estimates thatcoal fired generation there presently costs only about 2.0 US cents/kWh; the missionestimates the cost of new coal-fired plants to be about 3.0 US cents/kWh.
Kudu Offshore Gas Field Development
22. The evidence to hand suggests that this is a world-scale gas field, with characteristicsindicating that few problems should be encountered in its development and exploitation. Themost recent and thorough examination of the prospects for developing Kudu concludes thatgas can be delivered to shore at after tax prices in the range of $1.34 to $1.14 MCF(MMBTU) at flow rates of 275 and 1,000 MMCFD respectively. Prices in this rangewould compare favorably with those of other, similar gas fields and indicate that it should bepossible to develop Kudu commercially if a market can be found. The Namibian market isfar too small to absorb a meaningful quantity of gas and the likely economic returns onusing it to produce products for sale on world markets (i.e., as feedstock to produce urea ormethanol, or as a fuel for use in aluminum or iron refining) appear low. The government hasreportedly received a proposal from a major international oil company for the developmentof Kudu based on using the gas in a 1300MW combined cycle generating plant on theNamibian coast that would produce for the RSA grid. On the basis of international

vi
experience, a combined cycle plant burning gas priced in the range indicated in the studywould have costs of about $0.03-0.035/kWh (excluding transmission). This appears to bemarginally competitive with coal fired generation in the RSA. However, ESKOM isreportedly interested in purchasing gas, not power, and it is believed that negotiations havefocused on whether Kudu gas can be provided in the Cape at a price that would make itpossible for ESKOM to build a gas fired plant that would compete with coal.
23. Kudu may also have the potential economically to serve a large industrial market inthe Cape that should be ripe for conversion to gas delivered at the price it can offer. Also,since gas field development and production is a type of project eminently suitable for privatesector development and financing, Namibia could reap the very handsome benefits ofKudu's development without having to put public funds at risk or encumber its internationalcredit. To bring the prospects for Kudu into sharper focus, high priority should be given toexploring the feasibility of alternate development plans to include low cost fielddevelopment options, and to more detailed market studies for gas supply to Cape industrialusers. If the results are positive, it should be possible to develop a project that is attractive toprivate investors. A crucial component of such a project is likely to be a marketing strategythat focuses on getting Kudu's foot in the door by bringing gas to the Cape and offering itat the lowest possible price in order to quickly develop the market. Such a strategy wouldentail both risk and the deferral of returns. Namibia's petroleum legislation containsimportant elements of flexibility and the govemment may, given its interest in seeing thecommencement of development of its natural resources, wish to consider deferring its taxtake from the project to make it more attractive to investors.
Oil Exploraion
24. The discovery of oil would, needless to say, change the entire energy picture, andmuch else. One of the government's primary objectives in the sector has been to promotepetroleum exploration and, to this end, it moved rapidly after independence to strengthen thegeologic data base, enact an attractive contractual and fiscal framework and organizeinternational bidding for licenses. Results to date suggest that the promotion program isgoing extraordinarily well. Licenses for offshore exploration have been negotiated with fourconsortia of international oil companies, and NAMCOR, the state petroleum company,appears to have succeeded in obtaining minimum work commitments totaling some$110million, including the drilling of 8 wells. Based on international experience, efforts onthis scale should be sufficient to define the commercial potential of Namibia's hydrocarbonendowment. NAMCOR is presently planning to open a second promotion round in late1993-early 1994.
Institutional Issues
25. While the present strengths and resource potential of the energy sector give goodgrounds for optimism about its future development, much will depend on the effectivenessof policy-making and administration in the sector. As is inevitable in so new a nation, a greatdeal needs to be done to strengthen policy analysis and decision making capabilities, tobuild an appropriate the legal and regulatory framework, to rationalize the institutionalstructure, and to enhance the professional and technical capacities of those working in thesector. The outstanding institutional issues that appear most pressing to the mission arediscussed below. The MME is well aware of the importance of these issues and intends to26. give high priority to addressing them in 1993 and later years.

vii
Strengthening the MME
26. While still a fledgling institution, the MME has done much to strengthen itsorganizational structure and to bolster its staff. To date, it has played L much moreimportant role in petroleum than in power, where practical and historical considerations havelimited its role as regards both policy and regulation. Legal and institutional changes, suchas those discussed below, can contribute much to strengthening the ministry's hand inpower regulation. To enhance its role in policy-making, the MME will need to equip itselfwith more comprehensive, current and systematic data on all aspects of the sector andincrease its analytical capabilities, especially on the economic and financial side. For bothpurposes, it will need to further upgrade its staff, not so much quantitatively as qualitatively.The MME is working closely with NORAD and other donor agencies on training programsand other technical assistance that will help it meet these needs.
Regulating the Power sector
27. A number of factors have limited the MME's effectiveness in the power sector. Asa well established, technically proficient and financially strong institution with forcefulleadership, SWAWEK has naturally tended to have a major, even dominant, voice in policy-making. In addition, the lack of a regulatory framework for generation and transmission,and the fact that other government agencies have primary responsibility for distribution,have limited the MME's role in power regulation. The MME reviews tariff changesproposed by SWAWEK, but since there are no publicly established criteria, and the MME'sanalytical resources are limited, it is not surprising that SWAWEK's proposals seeminvariably to be approved. The challenge facing the government is to establish a frameworkunder which it can provide policy direction and regulatory oversight in a meaningful fashionwhile enabling SWAWEK to continue functioning efficiently and on a financially sound,commercial basis. As regards tariffs, the government might be well advised to give firstconsideration to a simple rate of return based approach to the overall level of tariffs, and toestablishing a time of day tariff structure that differentiates between peak and off-peaksupply costs.
Rationaliing Power Distribution
28. The involvement of three sets of institutions --the municipalities, the Ministry ofLocal Government and Housing (MLGH), and the Peri-Urban Development Board-- inelectricity distribution in a country with as small a population as Namibia's has resulted inan atomization of responsibility and a variety of diseconomies and inequities. Even the bestequipped of the three, the municipalities, vary widely in competence and the service they canoffer and none of the distributing institutions runs its system as a financially responsiblecommercial enterprise. The MLGH, which is responsible for distribution in rural areas,incurs a significant loss on its operations as a result of the very high level of unpaid bills(arrears) owed by its customers and high technical losses in its distribution systems.Distribution is, therefore, a major weak point in Namibia's power system and one thaturgently requires attention, particularly in view of the growing importance of householdconsumption in the system. The objective should be to restructure the system with a view to(i) putting the operation of the system on a commercial, preferably private basis insofar aspossible (ii) centralizing operations so as to obtain greater economies of scale and toequalize service while (iii) maintaining and enhancing local responsibility. A thoroughstudy of the distribution system and the options for its rationalization is recommended.

vii
Petrokum Product Pricing
29. The prices of the major petroleum products (petrol, diesel and kerosene) arecontrolled by the government under a system essentially similar to that in the RSA. Pricesare reasonable and the system works smoothly; it is quite transparent and there appear to beno inherent conflicts of interest. Nevertheless, prices are almost certainly higher than theywould be if the market were competitive, and price control seems a hangover from pre-independence times with little or no economic benefits today. In the absence of pricecontrols, with margins no longer assured, it is likely that one or more of the less efficientdistribution companies will withdraw from the market. It is generally agreed that sixcompanies are too many for Namibia's small market and that only three or four wouldremain after deregulation. This should be sufficient to maintain competition. It is thereforerecommended that the government move to phase out price controls

L. INTRODUCTION
1.1 Namibia is fortunate in that the energy sector is not a constraint on growth, as it is inso many developing countries. Indeed, thrugh the exploitation of Namibia's hydro-electricand/or hydrocarbon resources for export, the sector may well become a major engine ofgrowth. At present, industry, commerce and the country's population centers are adequatelysupplied with commercial energy (electricity and petroleum products) at economic prices.However, many households still lack access to modern energy supplies and, especially inrural areas, still rely on wood and other traditional fuels, particularly for cooking. Ahousehold energy survey conducted in preparation for the assessment indicates that, whilefuelwood is increasingly difficult to come by in some areas, there are few signs of resultinghardship and that energy in general does not take a disproportionate share of householdbudgets.
1.2 That Namibia's energy sector works so well owes much to the fact that the sector'smajor public and private institutions operate on commercial principles and that energy pricesare sufficient to ensure the financial soundness of the operating agencies, to provide fundsfor investment and, in most cases, to send the "right" economic signals to producers andconsumers. While maintaining this essential framework, Namibia needs to pursue four keyobjectives in further developing its energy sector.
* increasing access to modem energy supplies for households,
* ensuring that commercial energy supplies expand to meet the growing needs of theeconomy,
e developing its export potential, and
* strengthening the institutional structure of the sector in order to facilitate moreeffective policy-making and implementation.
1.3 This report presents the findings and recommendations concerning issues in theseareas of a mission that visited Namibia in June-July, 1992. The mission was led by Mr.Richard S. Dosik (consultant) and included Mr. Thomas O'Connor, Oil and Gas Specialist;Mr. Enrique Crousillat, Power Specialist, Mr. Gerald Foley (consultant), Household EnergySpecialist; and Mr. Amadou Cisse, Energy Economist. While the energy sector todayserves Namibia well, and much has been accomplished since independence, its future willdepend in good measure on effectively addressing the policy, investment and institutionalissues that are the focus of this report. The mission's recommendations are generally limitedin scope and quite tentative in nature, reflecting both the limited information available to it insome areas, as well as the mission's feeling that, in the case of the Namibian energy sector, itwould best to be guided by the adage "If it ain't broke, don't fix it.".
2 Issues and Options in the Energy Sector, Namibia
I. ENERGY AND THE ECONOMY
The Economic Setting
2.1 Namibia's energy sector reflects the sharp (even for Africa) contrast between themodem/commercial and ruraVtraditional sectors of the economy. Looking at just themodem sector, Namibia appears much like a prosperous middle income country; it has anestimated GNP per capita of nearly $1200 and much physical infrastructure (in transportand telecommunications, as well as energy) of which an industrial country would be proud.However, the majority of Namibia's approximately 1.5 million people has an income perhead of about $85 per year and lives under primitive conditions without adequate housing,water or health or education services. Mining (chiefly for diamonds, uranium and copper)is the mainstay of the modem economy, accounting for some three-quarters of exportearnings, four-tenths of public revenue, and nearly one-third of GDP. Agriculture is,however, the major source of employment, supporting some 70% of the population. Itscontribution to GDP and exports (about 12% in both cases) comes mainly from the largecommercial cattle and sheep ranches that occupy the arid southern two-thirds of the country,whereas the bulk of the rural population is engaged in subsistence farming in the somewhatless arid north.
2.2 Namibia's dependence on primary production, which all told accounts for nearly45% of GDP, makes its economy subject to significant fluctuations resulting frominternational market conditions, the weather and other external forces. The mining industrygenerally calls the tune and the depressed state of the minerals markets had much to do withthe sluggish growth of the Namibian economy during most of the 1980s. Stabilizinginfluences on Namibia's economy come from the secondary (21% of GDP) and tertiarysectors (35% of GDP). Government expenditures on goods and services, including thegrowing civil service (19% of GDP) are particularly important in smoothing the otherwiseerratic impact of the primary sector. The role played by government expenditures can beexpected to grow, in part because Namibia's membership in the Common Monetary Area(CMA) with the RSA effectively takes monetary policy out of the government's hands andmakes fiscal policy the default policy tool. In addition, the government's concern withreducing the inequality in income distribution seems bound to increase its role in theeconomy.
2.3 Since the 1960s, when the GDP growth rate was some 9.0%, there has been littleforward momentum in the economy. Growth was weak in the 1970s and the 1980s was aperiod of fluctuation between boomlets and busts, with net growth of only about 1% overdecade. However, a modest revival of growth appears to have taken place in 1990 and 1991,when GDP rose by 3. 1% and 5.1%, respectively. In 1991, diamond production jumped byalmost 56% and gold extraction increased by around 16%, although the rest of the country'smining output (uranium, copper, lead, zinc, silver) declined by 20%. The fishing industry,which is expected to become a significant growth pole in the primary sector, also had a goodyear in 1991, when the catch grew by no less than 84%! However, one or even two goodyears do not a growth trend make, especially since one-time factors in the form of theopening of a new diamond mine and the extension of Namibia's territorial waters had much

Issues and Options in the Energy Sector, Namibia 3
to do with the economy's improved performance in 1991. All told, the growth rate willprobably average 3-4% over the next few years.
2.4 Namibia's balance of payments appears quite strong. The boost to exports resultingfrom the aforementioned windfall gains in the diamond and fishing industries helped to cutthe trade deficit by more than 50% in 1991 and this, together with higher transfer paymentsand service earnings, resulted in a substantial surplus on current account. Inflation in 1991was held to the 1990 level of about 12%, but there were disquieting developments in thelatter part of the year when the monthly rate of increase in the price indices, which had beendeclining, reportedly began to move up. This turn-around was attributed mainly to risingconsumer demand resulting from an expansion of consumer credit coupled with inflationarywage settlements.
Energy Consumption
2.5 Per capita energy use in 1991 amounted to 0.51 toe, which is well above that of mostSub-Saharan Africa. However, traditional fuelwood (non-commercial energy) plays amuch more limited role in energy consumption (around 14%) in Namibia than in most othercountries on the continent. 1 The predominance of commercial energy in the Namibianenergy balance reflects the importance of the energy-intensive mining industry in thecountry's economic structure as well as the relatively high incomes enjoyed in the modern,urban areas and the ready availability there of commercial energy at reasonable prices.
2.6 As the summary balance below shows, petroleum products account for the largestshare of energy use (over 65%), followed by electricity (around 17%). Annex A containsdetailed energy balances for 1989-91.
Final Energy Consumption, 1989-91 (TOE)
1989 1992 191Oil Products 563,132 463,919 466,190Electricity 111,091 116,573 122,168Fuelwood 70,013 80,404 81,831Coal 43,160 43,160 43,160Total 796,396 704,056 713,349Per Capita 0.603 0.517 0.509Consumption per SectorIndustry 34,752 32,770 34,130Transport 71,617 59,385 45,306Household/Public 394,316 342,232 349,135Agriculture 50,947 50,26 52,457Mining 199,098 180,662 176,435
45,666 38,916 55,887
1 Data onffuelwood consumption are sparse and must be regarded with caution.

4 Issues and Options in the Energy Sector, Namibia
2.7 After dropping off sharply in 1990, in the wake of the departure of the RSA and UNforces at the time of independence, energy consumption recovered modestly last year whenit grew by some 1.55%2 The increase of energy consumption in the next few years islikely to parallel the modest growth rate foreseen for the economy and, thus, to averagesome 3.0-3.5% per annum. With a continuing decline in Uranium production at theRossing mine and the impending closure of the Tsumeb copper mine offsetting the impactof the planned new operations, the demand for electricity in the mining sector is, at best,likely to remain flat. However, demand from the municipalities, the government and forrurl electrification can be expected to continue to expand rapidly and to largely account foran overall growth in electricity consumption of around 3.5% per annum. The demand forpetroleum products is projected to grow somewhat more slowly, at about 3.0% per annum,with new requirements coming only from the fishing industry. In the fuelwood sector,demand is likely to grow only modestly, if at all, since the impact of population growth islikely to be mostly offset by a continuing switch to electricity and other modern fuels forcooking.
2 The continued sharp decline in consumption in the transport sector in 1991 was mainly theresult of a further sharp reduction in jet fuel sales as the last of the major UN operations wounddown.

Issues and Options in the Energy Sector, Namibia 5
III. HOUSEHOLD ENERGY
3.1 Fuelwood is the main rural energy source in Namibia and is frequentlysupplemented by dung and agricultural residues. Electricity is the main cooking fuel in theurban areas. Bottled gas and paraffin are also used to a limited extent.
3.2 A survey of household energy consumption was carried out for ESMAP by theNamibian Institute for Social and Economic Research (NISER)3. The study focused onOwambo, which accounts for about 70% of the rural population, and on the large townshipof Katutura outside Windhoek4. Table 1 shows the breakdown of household cookingenergy consumption for Owambo and Katutura.
Table I
FUEL OWAMBO KATUTURA
Fuelwood 90 11.7Ag. residues, dung 7.5Electricity 1 84.5Bottled gas 1.5 2.8Paraffin -
Fuelwood
The Owambo region
3.3 Fuelwood consumption is concentrated in the Owambo region of northern Namibiawhich, with a population of about 600,000, is the most densely inhabited region of thecountry. The density is nevertheless low in absolute terms. In Owambo as a whole it isonly about 12 persons per square kilometer though it is higher towards the center where thewater supplies are most plentiful.
3.4 Owambo is crossed by a large number of seasonal rivers draining in a deltaformation, known as the Cuvelai system, towards the Etosha Pan. Rainfall increasestowards the north east but over most of Owambo is 400-500 mm per year. The naturalvegetation varies from grassland to tree savanna depending on rainfall.
3.5 Central Owambo is the main area of crop cultivation in the country. Farms aresmall, with a typical cultivated area of two to three hectares. Drought is common and themain subsistence crop is millet (muhango). Fruit trees are grown but there is no significanttree planting for other purposes.
3.6 The ground water in most of the area is highly saline but people are able to obtainfresh water from shallow hand dug wells. These tap into an aquifer fed by the Cuvelai
3 "Household Energy Consumption, Distribution and Marketing Survey of the Owambo Region ofNorthern Namibia and Katutura, Windhoek" , 1992 .
4 Further information on family fuel consumption is available in the NISER report: "Socio-economic study of the OndangwalOshakati nexus area." Research Report No 8, Feb 1992.

6 Issues and Options in the Energy Sector, Namibia
system but isolated from the lower saline ground water by a hard calcareous layer.Pipelines from the Kunene river provide supplies to the main population centers as well asstock watering points.
3.7 Land is held under traditional tenure rules administered by local chiefs. Individualsare allocated a holding for life but are not allowed to pass it on within the family. Outsidethe cultivated fields the land is open to everyone for grazing and tree cutting.
The household energy study
3.8 The NISER study divided Owambo into four ecological zones: grassland, palm-tree,savanna, and woodland; and the peri-urban OshakatiVOndangwa area. The sample consistedof 200 families, all within a 100 km radius of Oshakati. The average household size was8.13 persons. The average annual family expenditure was estimated to be R3,514.
3.9 The survey showed that fuelwood was the main cooking fuel of 90% of families.Dung and agricultural residues were widely used as supplementary fuels but were theprincipal fuels of 7.5% of families. Fuelwood use varied in accordance with its availability;in the grassland area, 75% of families used other fuels occasionally or all the time whereasin the woodland areas only fuelwood was used. The great majority of families (94%) usingfuelwood collected it from their surroundings. On average, collection was every four daysand took about 90 minutes. A small number of families (6%) were found to purchase someor all of their fuelwood.
3.10 The quantities of fuelwood used were calculated by asking households how longsample bundles would last. This gave an average daily consumption per head of 0.50 kg forthe rural areas, varying from 0.31 kg in the grassland area up to 0.56 kg for the woodlandareas. These figures appear low in comparison with other African countries5 though thefact that they show a plausible pattern of variation between ecological zones adds to theircredibility. But depending, as they do, on subjective estimations, they must be subject toconsiderable reservation.
3.11 The survey of the Ondangwa/Oshakati nexus found that fuelwood consumptionfalls off within the peri-urban area with 56% of households relying on it as their maincooking fuel. About 70% of these purchased their supplies. The mean annual householdexpenditure was R9,754 and the mean annual expenditure on fuelwood was R750, or about7.7% of total expenditure.
Fuelwood consumption in Katutura
3.12 Katutura is a township established in 1968 on the edge of Windhoek. It has apopulation of around 90,000. Dwelling plots are officially designated and the majorityhave water, electricity and sanitation. About 90% of the houses are of brick or block withiron roofs and about 50% are privately owned. In the past few years an increasing numberof squatter settlements have been established around Katutura. The dwellings are ofmakeshift construction and do not have electricity.
5 Figures of over 2 kglhead/day have been found in Tanzania, south Sudan, Kenya and theGambia, though 0.8-1.0 kglhead per day is more typical of the drier areas in these countries.Figures from Mali give 0.7-0.9 kglhead/day for the arid areas and 1.7-2.4 kglhead/day for thehigher rainfall areas.

Issues and Options in the Energy Sector, Namibia 7
3.13 In the NISER survey, a total of 103 families were interviewed. The average familysize was 6.37. The average annual family expenditure was estimated to be R10,699. Justunder 15% of families use fuelwood most or all of the time. The estimated consumptionwas 0.64 kg per head per day. The average annual expenditure on fuelwood per family wasR740, about 7% of total expenditure.
3.14 Large amounts of wood are available within the open lands and commercial farmsimmediately around and within a few tens of kilometers of Windhoek. A proportion of thesupplies to Katutura are collected, or stolen, from these areas. There are also sales fromcommercial farms to fuelwood dealers. Reports that fuelwood is transported to Windhoekfrom Owambo are almost certainly exaggerated. Wood prices are based on the bundle sizerather than the weight and unit prices vary greatly, ranging from RO.40 cents per kg toR1.20 per kg.
Fuelwood consumption in other rural areas
3.15 Fuelwood is also used in the communal areas to the south, east and northeast of thecountry. In general, population densities are extremely low - less than one person persquare kilometer in Kaokaland, Keetmanshoop, and Hereroland East and about five personsper square kilometer in East Caprivi. In such areas, the available wood, or other burnablebiomass, is generally likely to be adequate for local people's needs.
3.16 The mission was, however, informed by the MME that there are some fuelwoodshortages in parts of Keetmanshoop and Marienthal though no details were available. It isrecommended that a rapid appraisal be made of the position in these areas to establishwhether a more detailed investigation of the problems and available options should be made.
Overall household consumption offuelwood
3.17 Bearing the reservations about the consumption figures in mind, and assuming atotal of 1.1 million consumers, total household consumption of fuelwood is around230,000 tons per year. This is equivalent to about 80,000 tons of oil equivalent.
Fuelwood consumption and the natural environment
3.18 Widespread deforestation is clearly taking place in Owambo. Records from the1950s show that many communities were separated from each other by tracts of forest. Inthe more heavily populated areas, this forest has now vanished. Around the towns andalong the livestock routes by the main roads, not only trees but the whole vegetation coverhas disappeared.
3.19 One of the largest uses of wood is construction of traditional homesteads. Theseconsist of a series of huts and compounds, separated by fences and surrounded by a highstockade. The total length of stockade may be 300 meters or more, made up of logs 2-3meters long and 6-9 cm in diameter. In addition, there may be up to 1.5 km of fencingmade of smaller poles and sticks around the cultivated fields and stock pens.Measurements made in 1990 of a typical homestead near Oshigambo found about 100cubic meters of wood had been used. Traditionally, homesteads have tended to be movedevery five or six years, with most of the poles being replaced in the process.

8 Issues and Options in the Energy Sector, Namibia
3.20 The wood for homesteads is taken from the nearby forests if suitable trees still exist.In areas where the larger trees have been cut, families use a cart or hire or borrow a pick-uptruck to obtain the wood from further away. Otherwise, alternative construction methods areused, with fences being made of thorn brush or bound bundles of millet stalks.
3.21 The amounts of wood used in homestead construction are many times greater thanthose used for fuelwood. Using the NISER survey figure of 0.5 kg per head per day, atypical family uses about 1500 kg per year or about 2 cubic meters. The construction of theOshigambo homestead above is equivalent to 50 years supply of fuelwood for such afamily.
3.22 Clearing for agriculture can also destroy considerably more forest than fuelwoodcutting. The wood "consumption" of a family clearing 3 hectares of intact woodland everyfive years is about 15 tons or 21 cubic meters per year, ten times its fuelwood consumption.
3.23 Attempts to slow deforestation through energy initiatives are thus unlikely to haveany significant effect. Indeed, even if fuelwood consumption were to cease completely,deforestation would continue rapidly as a result of cutting trees for homesteads andagricultural clearing. Any resolution of the deforestation problem will require a coordinatedapproach involving a wide variety of non-energy inputs and initiatives.
Recommendadons
3.24 The fact that the majority of families appear able to manage satisfactorily with theenergy resources freely available to them greatly limits the potential and the need forintervention in the rural fuelwood sector.
3.25 Promoting tree growing for fuelwood is unlikely to be successful. There is notradition of cultivating indigenous trees for fuel and exotic species such as eucalyptus,leucaena or others tend to require watering and considerable care over at least the first twoyears6. Investing time and effort in a woodlot is not an attractive option to a family whichcan readily obtain brush wood, agricultural residues and animal dung as substitutes iftraditional supplies of fuelwood become scarce.
3.26 Where fuelwood is purchased, there may, however, be some scope for theintroduction of improved cooking stoves. These, it should be noted, will not have anysignificant effect on deforestation but can help families reduce the amount they spend onfuelwood. A number of attempts have already been made to introduce such stoves but theeffect has been slight The mission recommends that a preliminary assessment be made ofthe potential for introducing improved stoves in the non-electrified parts of Katutura as wellas Oshakati and Ondangwa. This assessment should be carried out, in collaboration withthe MME, by one of the well-established international stove organizations with a provenrecord of field success.
6 A total of about 100 hectares of eucalyptus plantations have been established at various timesover the past 20-30 years. Growth and survival have been relatively poor. There is, forexample, a poorly growing 45 ha plantation established in the 1970s beside the main road atOnankali to the north of Tsumeb.

Issues and Options in the Energy Sector, Namibia 9
Household Use of Conventonal Fuels
3.27 Electricity is more or less universally available in the urban areas. It is the maincooking fuel for the great majority of families even in the lower income areas. In Katutura,the NISER survey found it was the main cooking fuel of 84.5% of households. It is alsoused for lighting, TV and other household uses.
3.28 Appliances are readily available and relatively affordable in relation to averagehousehold incomes. A two plate cooker, for example, is about Rl3. The NISER surveyfound that average annual consumption per household was 3,841 kWh. The average outlayon electricity was R944, about 9% of family expenditure.
3.29 In the Oshakati/Ondangwa nexus, where electricity is confined to a smallproportion of households, bottled gas is the most popular cooking fuel next to fuelwood. Itis used as the main cooking fuel by almost 30% of families. In Katutura, it is used by about10% of families.
3.30 The NISER survey found that paraffin was used by 52.5% of Owambo families forlighting. A small proportion of households (6%) also used it for cooking. The averageannual consumption was 67.5 liters per family. The price was in the range R1.67 - 1.94 perliter and average family expenditure was Ri 13 per year.
3.31 Candles are the other main lighting source in the rural areas. Dry cell batteries arewidely used for radios and torches. Car batteries are used for lights, radios and other lowvoltage appliances and are recharged in vehicles or service stations where a fee is charged.
Prices and supplies
3.32 Domestic fuel prices, except for electricity, tend to vary widely even within the samelocality. Fuelwood, however, even at the low end of the retail price range, is considerablymore expensive than conventional fuels, especially electricity, for cooking as can be seen inTable 2.
Table 2
Fuel Unit price Price/MJ Efficiency Price/end-Rcents % use MJ
Fuelwood 3.33 Rc/kg 3.34 3.35 3.36Paraffin 3.37 R/ltr 3.38 3.39 3.40Electricity 3.41 Rc/kWh 3.42 3.43 3.44Botded gas 3.45 R/kg 3.46 3.47 3.48
3.33 Electricity's marked price advantage goes far to account for its popularity as acooking fuel wherever it is available. The provision of electricity can therefore bringsignificant savings to families who purchase their fuelwood. The impact on the pooresturban families, however, is generally less since they tend to collect rather than purchase theirfuelwood. This is also true of the great majority of families in the rural areas.

10 Issues and Options in the Energy Sector, Namibia
3.34 There do not appear to be any significant problems in the supply of conventionalfuels. In areas where a demand exists, there is every indication that the distribution andmarket systems already in place are able to meet it satisfactorily as well as supply any likelyfuture increases.
Small Scale Renewable Energy Sources
Solar energy
3.35 Namibia has around 3300 hours of sunshine per year, one of the highest figures inthe world. Insolation levels reach 8 kWh per square meter per day and even in the rainyseason there are normally 4-5 hours of bright sunlight.
3.36 The main user of photovoltaic systems is the Department of Posts and Telegraphswhich has installed a total of about 180kW for use in relay stations and other remoteapplications. The Department calculates that the savings in comparison with diesel enablethe capital costs of a typical installation to be amortized in 14-26 months.
3.37 The Ministry of Wildlife, Conservation and Tourism has installed a total of 18photovoltaic pump systems for game water holes in Etosha National Park with a totalcapacity of about 25 kW. A further 33 installations are planned. The NamibianBroadcasting Company is also a major user.
3.38 A number of photovoltaic systems have been installed for lighting and pumping atschools, clinics and other government facilities and such applications are under increasinglyactive consideration. Sales in the commercial farming areas for farm and householdapplications are also rising. Studies by NISER and the Department of Water Affairs intothe potential for wider application of photovoltaics are to be carried out later in 1992.
3.39 Despite the abundance of solar energy, solar water heaters are little used. The mainreason is that the majority of potential consumers are connected to the SWAWEKelectricity supply system. The low level of tariffs makes solar water heating at aroundR4000 per installation an unattractive option. There would appear, however, to beopportunities for the installation of heaters in government facilities not served by gridelectricity. In some cases diesel generated electricity is apparently being used for waterheating. This deserves to be investigated.
3.40 The private sector is active in the supply and installation of photovoltaic systems.Most of the components are imported but the design, assembly and testing of systems iswell within the capacity of local companies.
3.41 The market appears to be competitive, with at least three active local companies andothers based in South Africa willing to tender for work. Government projects are generallybased on performance specifications and are subject to competitive bidding. There is a highlevel of awareness of the need for testing of designs and vulnerable components and of theimportance of adequate repair and maintenance.
3.42 The following are sample retail prices for a number of systems. They do notinclude installation or Government sales tax.

Issues and Options in the Energy Sector, Namibia 11
Siemens (Namibia?20 Wp lighting kit for 2 lights R835.0055 Wp 3 light kit 2,225.0055 Wp 6 light kit 2,743.00
Solar Age (Namibia)11 Wp lighting kit for 1 light 900.003 Wp rechargeable portable lamp 550.0060 Wp panel, 4 lights, 12V B+W TV 3,200.002x60 Wp panels + inverter 7,000.00
3.43 These prices appear rather high by international standards, but are comparable withZimbabwe, for example, where a significant local photovoltaic supply industry alreadyexists.
Wind power
3.44 Wind power is well established and is the main source of energy for water pumpingin the commercial farm area. It is estimated that there may be 30,000 or more functioningwindmills in the country, many of which have been working for decades.
3.45 The potential use of wind pumps in the communal lands has yet to be explored indepth though it is likely to be less than in the commercial farm areas because of the lessfavorable wind regimes. The possibility that combined wind and photovoltaic installationsmight be able to replace some of the smaller diesel generators presently being maintained bythe Department of Works has been suggested by the Research Section of the MME. Underthis scheme, pumping would be provided by the windmill and electricity by the photovoltaicsystem. The possibility deserves more detailed investigation.
3.46 Apart from the use of a small number of wind chargers for batteries, wind power isnot used for electricity generation. This is likely to remain the case as wind speeds aregenerally below the figure of 4 meters per second at which electric power generationbecomes a potentially attractive option.
3.47 The exception is the coastal area where wind speeds are high and relatively constant.A proposal has been made to investigate the possibility of establishing a wind farm tosupply the grid at Luderitz and is reported to be under sympathetic consideration by anumber of donor agencies. Although the technical potential for such a project may exist,there is no reason to suppose it would be able to compete with SWAWEK's very low costs.
Biogas
3.48 Although biogas has attracted some interest in Namibia, its potential role is minor.The shortage of water is a key limitation. The free range grazing of cattle also makes itdifficult and time consuming to collect the dung required for the digester. In general, theexpense and complexity of constructing and managing digesters coupled with theirrelatively low and unpredictable energy yields make them unattractive options in most ruralNamibian applications.

12 Issues and Options in the Energy Sector, Namibia
Renewable energy recommendations
3.49 The Namibian renewable energy sector appears to be in an unusually strongposition. Photovoltaics and wind are well developed and filling the niches for which theyare presently suited both effectively and competitively. The private sector is active andcompetent; it should continue to play the major role in renewable energy development.
3.50 This should be facilitated by increased government support. Within the MME,renewable energy sources are handled by the Research Section in the Electricity Division ofthe Directorate of Energy. The Section presently has a staff of two with the position ofhead unfilled. The mission feels that its present role could usefully be extended to includethe following:
3.51 Assembly and publication of meteorological data on wind and insolation. Thereare gaps in the available infornation, especially in the communal lands. It would be usefulfor renewable energy designers to have comprehensive and reliable data. This task wouldrequire liaison with the Meteorological Office and renewable energy suppliers anddesigners.
3.52 Assembly of data on renewable energy experience. This would primarily be basedon experience within the government sector but would incorporate available data from theprivate sector. It would provide a publicly accessible data bank, helping researchers avoidduplication and enabling them to build upon the results of previous work. The Sectioncould also act as a clearing house for small scale donor-funded projects in the renewablesarea
3.53 Conmissioning studies and pilot projects. The Section could identify gaps in theexisting knowledge and commission studies or pilot projects to obtain the necessaryinformation.
3.54 Raising awareness of renewable energy sources anong government decisionmakers. Awareness of the potential and limitations of renewable energy sources is stilllimited among many government decision makers. The Section could help raise the level ofawareness by providing general information and carrying out case studies of particularapplcations.
3.55 Setting performance and design standards for renewable energy equipment.Performance and design standards are necessary to protect consumers. The standardsshould be based upon those already accepted elsewhere, adapted where necessary forNamibian conditions. The standards should be set in conjunction with private sectorsuppliers, the Department of Trade and Industry and relevant professional and academicorganizations.

Issues and Options in the Energy Sector, Namibia 13
Wood and Charcoalfrom Brush Clearing
Charcoal making
3.56 Farmers also use brush wood for charcoal making. The charcoal is made in mildsteel vertical retorts 10-15 meters high built by farmers themselves to a local design. Theyoperate on a semi-continuous process and have a production of about 35-40 tons per monthof good quality charcoal. The yield is about one ton of charcoal per five tons of wood.The bulk of the charcoal is sold to the TCL mine at Tsumeb for ore smelting. Consumptionis about 500 tons per month and the mine pays R180 per ton.
3.57 A South African company is at present exploring the possibility of investing in asophisticated Lambiotte-type retort at a reputed cost of R36 million. This would have anannual output of about 16,000 tons of charcoal of sufficiently high quality to meet EuropeanCommunity import standards and would require a guaranteed supply of 80,000 tons ofwood per year. The resource availability and possible contractual arrangements forobtaining supplies from farmers are being examined.
3.58 Such a project, if it can be established, would bring a variety of benefits: increasedlocal employment, encouragement to farmers in their brush clearing, and export earnings.The investment decis3.54 Some 8-10 million hectares of grazing land are seriouslyaffected by brush encroachment in the center and north of the commercial farm areas. As aresult, the grazing area is reduced by up to 50%, with some places becoming completelyimpassable for livestock.
3.59 Clearing the brush from the encroached land is an extremely labor-intensive anddifficult operation but yields about 6 tons of wood per hectare. Wood production costs arein the range R45-65 per ton. The TCL mine at Tsumeb has provided a market of about3000 tons per month at a price of R65 per ton, though there have been serious problems inloading the fuel into the existing coal-fired boilers. While scarcely profitable in its ownright, the opportunity to sell the wood helps offset the heavy costs of brush clearing forfarmers.
3.60 The run down of Tsumeb mine has considerably reduced the market for boiler fuelbut similar quantities will be required when the new Kombat mine about 90 km fromTsumeb comes into production. Management of the mine is determined to resolve theloading problem so that local wood supplies can be used.ions must be left to the private sector, but the many potential benefits from the project makeit important that its implementation be encouragedi and facilitated as much as possible.
Rural Electrification
3.61 Rural electrification is an important element in the government's social and politicalpolicies aimed at redressing the long neglect of the communal lands under the previousadministration and directly assisting Namibia's rural poor. As presently carried out, itmainly involves the provision of grid extensions to selected rural centers, most of whichwere previously supplied by isolated diesel generators.

14 Issues and Options in the Energy Sector, Namibia
Rural electification policy
3.62 SWAWEK, according to its annual report, carries out rural electrification "whereverit is possible to do so and whenever funds are available". In practice, this appears to meanproviding rural electricity supplies wherever this meets normal commercial criteria. Whennon-commercial projects are carried out at the government's request, SWAWEK expects thecapital costs to be covered by a grant.
3.63 Priority is given to centers with existing government facilities such as schools,hospitals, police stations, clinics or administrative offices. The majority of these alreadyhave an electricity supply from isolated diesel sets provided and maintained by theDepartment of Works. These vary in capacity from units of 10-20 kW used to supplysmall schools and clinics through to 250 kW units for larger schools and hospitals. TheDepartment is responsible for a total of 450 units many of which are in poor condition. Theaverage estimated cost of the electricity supplied is RO.66 per kWh.
3.64 In carrying out rural electrification programs, SWAWEK acts only as a bulkelectricity supplier. The construction and management of the local distribution system is theresponsibility of the Ministry of Local Government and Housing (MLGH) and is generallycarried out with technical support from a consulting fimn. The MLGH purchases electricityfrom SWAWEK at RO.048/kWh and is responsible for setting its own retail tariffs. Theseare generally in the range RO.15-0.20/kWh and are heavily subsidized in the case ofsupplies from isolated diesel sets.
3.65 As rural electrification proceeds in the northern part of the country, the burden onthe MLGH is increasing. One of the options being considered as an alternative tostrengthening the MLGH capacities in the construction and management of localdistribution systems is the establishment of an autonomous electricity distribution authorityfor northern Narnibia.
3.66 The largest rural electrification program at present under way is in Owambo and isfunded by NORAD. Preliminary designs have been drawn up for further programs inKavango and Caprivi but no commitment of donor funds has yet been made for eitherprogram. In Kavango, certain distribution lines are already being built to supply centersalong the Okavango river west of Rundu. This work is funded by the government and isbeing undertaken without foreign assistance.
Owambo rural electrification program
3.67 An outline program for the electrification of 29 centers in Owambo was drawn upby the government in 1990. This was presented to NORAD which, following a study byconsultants, agreed to provide NK48.5 (about $8.Omillion) to fund the transmissionfacilities to be constructed by SWAWEK.
3.68 The SWAWEK component of the program consisted of 530 km of high voltage lineand associated transformers and was completed in early 1992, almost a year ahead ofschedule and with a saving of more than 25% of the project budget. Progress on the localdistribution system has, however, been slow with five centers completed by mid-May 1992and a further three half-completed. Arrangements are being made to transfer some of thesavings from the SWAWEK component to the MLGH to speed up the work on thedistribution systems.

Issues and Options in the Energy Sector, Namibia 15
3.69 As part of the program, two important innovations are being introduced. The first isa "Redi-board" incorporating a light and three socket outlets, from which extension cordscan be safely run to appliances and other rooms, making it unnecessary to hard-wire ahome. Domestic consumers are given an electronic pre-payment meter with which they payin advance for the electricity they use. They do this by purchasing from machines, locatedin local shops or other facilities, electronically coded cards available in sums ranging from afew Rand to a hundred or more. When inserted in their home meter these cards enable theconsumer to use the amount of electricity purchased. A display on the meter shows theamount of electricity available and indicates the rate of consumption.
3.70 No connection fees are charged, the cost of the connection and the meter being builtinto the retail tariff of R.0.20/kWh. The pre-payment meter also prevents consumers fromusing more electricity than they can afford at any time, while helping them to economize onelectricity costs by showing them visually how quickly they are using what they paid for.For the distributor, these meters have the advantage of eliminating meter reading, billing andcollection costs, and the problem of unpaid bills. They are being successfully used in theRSA, from which they are imported.
Rural electri:ficadon overview
3.71 The NORAD economic analysis of the Owambo program assumed a high growth inelectricity demand in all the centers. The benefits were calculated on the basis that, in theabsence of the program, the projected energy demand would be met 60% by dieselgenerated electricity at RO.70/kWh and 40% by bottled gas at R0.05/MJ (RI 10/kg). Underthese conditions and a 5% discount rate the project had a positive NPV over 20 years butnot with an 8% and 10% discount rate.
3.72 SWAWEK, however, is of the view that the NORAD demand forecasts areunrealistically high. But it also observes "..if a grant is received, the returns should be ableto cover the maintenance and direct operating costs as well as the generating and distributioncost of electricity. There should also be some money left over for a contribution towardsdepreciation and replacement."
3.73 The mission inclines towards the SWAWEK view of the demand forecast and feelsit is unlikely that the project, and others like it, can be justified on strict economic grounds.The primary justification for such projects will therefore tend to be social and political. Thisis entirely legitimate, particularly in view of the fact that the capital costs are clearlyidentified and separately funded (largely by foreign grants), but it leaves questions aboutwhether the expected social benefits are being realized.
3.74 The direct social benefits are, in fact, likely to be limited. The government facilities,in general, already have electricity and their functioning will not be substantially altered.However, they will benefit from more reliable power supply and the government will reapsubstantial fuel cost savings. Intemational experience generally indicates that the provisionof grid electricity is unlikely, in itself, to bring about economic development which wouldotherwise not occur. Furthermore, the number of domestic connections is also likely to below. Even if there is a high connection rate in the electrified centers themselves, the numberof households supplied will inevitably be a small proportion of the total population of theregion, which outside the few towns is widely dispersed.
16 Issues and Options in the Energy Sector, Namibia
Looking to thefuture
3.75 The future course of rural electrification is dependent in good measure on (i) thedevelopment of improved institutional arrangements to ensure that the construction andsubsequent management and expansion of rural distribution systems are effectively handledand (ii) whether the benefits of electrical service actually come to reach a substantial portionof the rural population. At present, there is considerable uncertainty on both scores. Tospeed completion of the Owambo project, the MME has taken over responsibility forconnecting consumers from the MLGH as a temporary measure. A more permanent fix ofthe institutional arrangements for power distribution is being planned but will depend, interalia, on the direction taken by the presently planned reform of local and municipalgovernment, which is still unclear. It is also still far too early to assess the rate at whichconsumers will be connected and the load will actually grow in Owambo.
3.76 The undoubted need to address the needs of long-neglected rural people should beweighed against these uncertainties about the actual economic and social impact of presentrural electrification programs. The mission believes that sound decisions about furthermajor investments in Owambo-like rural electrification programs will only be possible whenimproved institutional arrangements for distribution are in place and when the economicviability and social benefits of the Owambo program can be better evaluated.
3.77 While the administrative and population centers will remain a natural priority forgrid connections, to extend the social impact of rural electrification consideration of futureinvestments should address the question of how the more dispersed rural population that isnot within reach of the grid can also be provided with at least some of the benefits ofelectrification. It is unlikely that there is any uniform "solution" and that a multipleapproach will be the most effective. Among the initiatives which could usefully beconsidered are the promotion of:
* small photovoltaic systems for household lighting and radio;
* commercial battery charging systems using photovoltaics or small dieselgenerators;
* local community management of small supply systems.
3.78 Photovoltaic systems, despite their high initial price, may be cost effective inproviding small amounts of power to meet household needs in areas that are too thinlysettled to make grid connections feasible. Any study of the potential for such systemsshould be based upon collaboration between the MME, other relevant ministries, localorganizations and NGOs, as well as private sector interests. In all cases, the institutionaldimension - the means by which programs are initiated, coordinated, paid for, and managedin a sustainable manner - needs to be given prime attention. In any discussion of a newrural electrification agency for northern Namibia, its potential for acting as a coordinator ofsuch programs should beseriously considered.

Issues and Options in the Energy Sector, Namibia 17
IV. MEETING NAMIBIA 'S ENERGY NEEDS
Power
4.1 The power sector today presents a picture of good health. An extensive nationalgrid supplies urban and industrial consumers with ample supplies of power at tariffs which,while low by international standards, are more than adequate to keep the national powercompany financially flush. However, Namibia is heavily dependent on power imports fromthe RSA and, with demand beginning to press on capacity, it will soon have to faceimportant decisions, involving major investments, concerning how best to meet future needs.Other pending questions include revision of the tariff structure; the finances of the powercompany and their relationship to investment needs; whether to press ahead with large scalehydropower development for export to the RSA (discussed in Chapter V); and institutionalreform (discussed in Chapter VI).
Institutional Framework
4.2 The operating institutions in the power sub-sector consist of a national generatingand transmission company and 46 municipal and local distribution agencies. The normativeinstitution is the Ministry of Mines and Energy (MME), which has broad regulatory andpolicy-making responsibility. The national power company, the South West African Waterand Electricity Company (SWAWEK), is responsible for generation and transmission ofpower in areas covered by the national grid. SWAWEK supplies bulk energy to localdistribution authorities, mines and larger industries, as well as commercial farmers. It is astate owned utility but one that enjoys a high degree of autonomy and operates according tocommercial principles. SWAWEK's organization has remained virtually the same as underthe ownership of the Industrial Development Corporation of South Africa Ltd., beforeNamibia's independence.
4.3 Municipal authorities are responsible for distribution in 15 large and medium sizetowns. Power distribution in communal areas is the responsibility of the Ministry of LocalGovernment and Housing, through 21 local authorities. In addition, the Peri-UrbanDevelopment Board is responsible for power distribution in 10 small towns (non-communalareas). With the exemption of a few large distributors, most notably the municipality ofWindhoek, most of the distributors are small, supplying only few hundred consumers.
Demand and Supply
4.4 In 1991, electricity consumption totaled 1550 GWh per year, with a peak demand of250 MW. As the Table 1 below shows, the mining sector is the major consumer,accounting for nearly 50% of SWAWEK's sales. The municipalities, which distributepower to households, industries and commercial consumers in their jurisdictions, are itssecond largest customer. Among the municipalities, the city of Windhoek accounts for70%o of total consumption, followed by Swakopmund (9%). These two are also the fastestgrowing cities in the country. The Windhoek municipality serves 32,200 customers, ofwhich 3,700 are industrial and commercial.

18 Issues and Options in the Energy Sector, Namibia
Table I
Energy Consumption by Consumer Groups (in GWh/year)
1987 1988 1989 1990 1991 Growthrate (%)
Municipalities 505 561 591 619 659 6.9Mines 684 699 716 736 757 2.6Rural areas 1 79 89 85 91 102 6.6Total Consump. 1268 1349 1392 1446 1518 4.6Sales to Eskom 173 233 267 166 201 3.8Total Sales 1441 1582 1659 1612 1719 4.5
I Includes small localities served by Local Government and the Peri-Urban Board.
4.5 Although electricity demand rose at an average annual rate of 5% over the past 10years, growth is expected to be slower in the near future. The mining sector is not expectedto experience any significant growth in the short and medium term in view of the almoststagnant world market demand for many mineral products. Accordingly, there are noexpansion plans in Namibia's mining sector which would result in an important increase inpower demand. Future power load growth may be expected to come mainly from themunicipalities and, to a lesser extent, the other public distribution agencies, including ruralelectrification. Assuming that the municipalities' demand will continue growing at historicalrates, i.e. the city of Windhoek at 8% and the rest at an average of 5%, the overall powerload would likely grow at around 3.5% per year. Accordingly, the mission's estimate is thatdomestic power demand, including 10% energy losses, would reach a maximum demand of278 MW and energy demand of 1925 GWh in 1995, and 330 MW and 2295 GWh duringthe year 2000.
4.6 Installed capacity in the main grid is 384 MW. A breakdown of this capacity andexisting transmission facilities is shown in Table 2. In addition, SWAWEK's transmissionsystem is connected to the RSA grid through a double circuit 220kV transmission line thatadds an import capability of 150-200 MW. There is also captive generating capacitycomposed of a large number of small diesel-fueled units. This capacity is estimated to be inthe order of 45 MW, almost 90% belonging to the Department of Works, Ministry ofWorks Transport and Communication, which operates about 450 generators for publicbuildings (schools, hospitals and other govemment buildings).
Issues and Options in the Energy Sector, Namibia 19
Table 2Main Grid Generation and Transmission
Generating Plant
Plant Type Installed Capacity
Ruacana hydro 240 MWVan Eck thermal; coal-fired 120 MWWalvis Bay thermal; diesel - gas 24 MW
Total 384 MW
Transmission Lines
330kV 512Km220 kV 1495 Km132 kV 1099 Km66 kV and below 5453 Km
4.7 The Ruacana plant is a run-of-river hydropower plant located in the Kunene river.The plant is operated at full capacity, subject to its natural hydrological constraint. The Govedam, a seasonal regulating reservoir located in the upper Kunene, in Angola, was damagedduring the Angolan civil war and is being operated at low water levels. This constraintreduces Gove's regulating capability thus affecting all downstream water users, including theRuacana plant.
4.8 The demand remaining after Ruacana's energy is dispatched is supplied throughimports from the RSA generating company (ESKOM), which amounted to an average ofabout one-third of SWAWEK's total production during 1988-91(see Table 3). Generallyspeaking, the power system is planned and operated in an efficient manner. Overalltransmission losses are around 10%, which is considered a technically acceptable level for asystem characterized by long distances and relative small loads. Good quality service isoffered to most consumers, but there are indications that reliability may be rather uneven.While the central and southern regions benefits from a highly reliable power supply, thenorthern region consumers, including major mining operators in Tsumeb and distributors inthe Owambo region, report a relatively high number of power interruptions. These outagesare apparently caused by the low operating reliability of the Ruacana - Windhoektransmission line, and related stability problems. Although the economic and financial costsof these outages are not well known, they may be considerable and thus justify furtherattention.

20 Issues and Options in the Energy Sector, Namibia
T4bk 3Energy Producion (GWh)
1988 1989 1990 1991Total Production 1763 1835 1790 1919
Ruacana 1086 1308 1053 1322Van Eck 124 90 96 46Walvis Bay 0 0 1 2Lmports-Eskom 533 437 640 549
Total Sales 1582 1659 1612 1719In Namibia 1349 1392 1446 1518Exports-Eskom 233 267 166 201
Losses (%) 10.3 9.6 9.9 10.4
4.9 The extremely high operating costs of the existing thermal plants reduce their use tothat of reserve capacity for emergency conditions. In addition, during average hydrologicalyears Ruacana's average generating capability is reduced to almost half of its rated capacity(130 MW) and during the driest quarter falls to 65 MW. Although Ruacana's hydraulicoperation provides for an hourly regulation to cover limited peaks, it can be reasonablyassumed that the system's guaranteed capacity could be reduced to 260-300 MW during thedry season, including the imports contribution but excluding the high cost thermal reserve.Peak demand would tend to exceed this capacity by 1995/96, when Narnibia's dependencyon energy imports would reach around 40% of total electricity consumed. By that time,additional generating and/or import capability should be required.
Supply Options
4.10 Thus, even with demand growing more slowly than in the past, additional generatingcapacity and/or import capability would be required by 1995/96 in order to satisfy withreasonable reliability Namibia's growing power needs. This section discusses three shortand medium term power supply options, as well as demand side solutions. Two larger andhence long-term export-oriented supply options, namely the Epupa hydropower project andKudu gas field development, are discussed in a Chapter V, which addresses exportopportunities.
The three power supply options for the period 1995/96 are:
* Increased imports from the RSA* Adding capacity at the Ruacana hydropower plant* Gas turbines for peaking capacity and medium load.
4.11 These options are analyzed below, and their likely costs compared. It should benoted, however, that due to limited access to technical and economic data on SWAWEK'ssystem, the analysis could only be conducted at a very preliminary level and serves mainlyto identify the options meriting further study. Assumptions and more detailed results of thisanalysis are included in Annex B.

Issues and Options in the Energy Sector, Namibia 21
4.12 Increased imports from the RSA. It is most likely that the RSA power system willcontinue having excess capacity and an energy surplus at least until the beginning of thenext century. However, to permit expanded imports the strengthening of the interconnection(currently a double circuit 220 kV transmission line) will be required. This could cost inexcess of US$ 100million, depending on its capacity and construction sequence. Thiswould be a major investment for Namibia and it is important that the design of the newtransmission line be carefully optimized taking into account the system's peak and energyneeds, as well as the possible timing of future export projects (i.e. Epupa and/or Kudu). Inaddition, Namibia will have to carefully consider the fact that choosing this option willmean a further increase in dependence on power imports, which could account for 50% ofnational consumption by the end of the decade. Few, if any, other countries depend onimports for so large a portion of their electricity supply.
4.13 SWAWEK currently purchases bulk energy from ESKOM at an average price of2.9 US. cents/kWh. Under the terms of SWAWEK's current purchase agreement withESKOM, this price is adjusted according to movements in RSA price indexes, so that therehas presumably been no major increase in real terms in recent years. However, the real costof imports would be significantly increased by the new investments required to strengthenthe interconnection . How much costs would increase will depend on two main factors: (i)whether and when the Epupa hydro project is implemented, since Epupa would require newtransmission lines to export power to the RSA and (ii) the technical characteristics of theselines, i.e. whether the voltage chosen is 220 kV or 400 kV. The main findings are asfollows:7
* If there are no firm plans for Epupa, or if it is deferred until after 2006, a 220kVdouble circuit transmission line, constructed in phases, could prove to be the leastcost solution since the second circuit would not be needed before 2006.
* If the Epupa hydroplant is to be in operation by 2002-2006, the best solutionappears to be the installation of a 400 kV line. This would imply a saving in presentvalue of US$ 6.3million vis-a-vis the 220kV double circuit, in addition to energysavings achieved through reduced losses.
* Strengthening the interconnection would increase the cost of imported energy by 1.1to 1.4 US. cents/kWh, depending on whether the 220 or 400kV option is chosen,bringing the total cost of additional imports to 4.0 to 4.3 US cents/kWh. Should thetariffs structure of the agreement with ESKOM, which is presently being re-negotiated, be revised to introduce a time-of-use system, it is likely that peak hourtariffs would range between 9 and 10 cents/kWh and off-peak tariffs would bearound 3 cents/kWh.
4.14 Adding Capacity at Ruacana. A fourth 80 MW unit can be installed in the Ruacanahydro plant at a relatively low cost since all required civil works were completed duringinitial construction. Judging from the Kunene river flows of the last 7 years, the fourth unitcould operate at an annual utilization factor of 22%. This factor would increase if the GoveDam in Angola is repaired and operated normally. Under current conditions this unit wouldbe able to operate at full capacity during 2 to 3 months per year generating about 155 GWh.
7 Unless otherwise indicated, thefollowing cost estimates are in constant 1992 dollars.

22 Issues and Options in the Energy Sector, Namibia
However, the most important contribution of the fourth unit would be the increased pealdngcapability of Ruacana during the rest of the year.
4.15 The hydraulic structures of the Ruacana plant include a reservoir volume at theintake dam which enable the plant with an hourly regulation to cover peaks. This regulatingcapability should be carefully examined in order to confirm its potential for undertakinglarger peaks if a fourth unit is installed. In addition, an apparent hydraulic operationproblem in the tailrace tunnel, which may indicate a need for additional civil works for theinstallation of a fourth unit, should be investigated in evaluating this option.
4.16 Taking into account recent experience of developing countries in the implementationof similar hydroelectric installations, the unit cost of energy supplied by the fourth unitcould vary between 1.4 and 2.3 US cents/kWh. If additional civil works are required in thetailrace tunnel, unit costs could reach 2.8 US cents/kWh.
4.17 Gas turbines for peaking capacity. The installation of open-cycle gas turbinescould prove to be an attractive solution for peak loads and to provide a cheaper and moreefficient reserve capacity. A set of diesel-fueled turbines, to be located on the coast, wouldoffer the following advantages: (i) low investment cost in the order of US$300/kW, (ii)short lead-time that allows the phasing of relatively small units (around 25 to 38 MW)according to actual load growth, and (iii) the possibility of switching to low cost natural gasshould this resource become available, or to convert them to base load gas-fueled combinedcycle plants.
4.18 Costs of generation of gas turbine plants are a function of fuel costs, utilizationfactor and country conditions. For diesel-fueled turbines, unit energy costs would vary from7.2 to 6.1 US cents/kWh for plant factors of 25% and 50%, respectively. If natural gas isavailable at low cost (US$ 1.2/thousand cubic feet) these costs would be reduced to 3.7 and2.5 US cents/kWh, respectively.
4.19 Cost Comnparison The following table compares preliminary energy cost estimatesfor the above mentioned options.

Issues and Options in the Energy Sector, Namibia 23
Table 4Costs of Alternative Supply Option
Option Energy cost Capital cost(US cents/kWh) (US$ million)
Imports from ESKOM- Excluding transmission 2.9 average cost noneexpansion costs
- Including transmission 4.0 - 4.3 average cost 92 to 116expansion costs 9.0 - 10.0 peak hours purchases 1
3.0 off-peak hours purchases
Ruacana 4th unit- equipment 1.4 - 2.3 mostly peak energy 15 to 24- equipment + civil works 2.8 "t " " 29
Gas turbines- diesel fueled 7.2 peak energy 12.5 for unit
6.1 medium load energy of 38 MW- gas fueled 3.7 peak energy
2.5 medium load energy
1 Assuming that new agreement with ESKOM will adopt time-of-use option 72 tariff.
4.20 These values indicate clearly that, if technically viable, a fourth unit at Ruacana maybe the least cost peak supply option. At this stage, the import costs estimates for a time-of-use tariff shown above are rather speculative. However, they may be an indication that, ifsuch a tariff structure is agreed, peak options like the fourth unit at Ruacana unit, and evendiesel-fueled gas turbines, would become specially attractive for supplying Namibia'smedium term energy needs.
Demand-side opdons
4.21 Future requirements could also be met partially through demand side solutions.Although Namibia's power system has a relatively high load factor (78%), there is room forpeak shaving benefits. The winter peak reaches 50 MW during evening hours, when themaximum demand of residential and several major mining consumers coincide. There isevidence that major mining consumers may have the flexibility for adjusting their maximumdemand to off-peak hours. However, this is not being done because the current tariffstructure does not include any provisions for peak, off-peak or time-of-use tariffs.CwTlsequently, although major consumers may have an incentive for reducing theirmaximum demand, they have no incentives for moving off peak hours.
4.22 The main mechanism for achieving peak shaving benefits at low cost appears to be apeak/off-peak tariff policy, since the response of a few major mines could quickly reducemaximum demand by a considerable amount. Such a response is likely, since in its presentdifficult circumstances, the mining industry is seeking every opportunity to cut costs. Inaddition, residential consumption, another main contributor to peak demand, may also have

24 Issues and Options in the Energy Sector, Namibia
potential for peak reduction if consumers are offered suitable savings on their electricitybills.
Recommendatons for meeting Namibia's power needs
4.23 SWAWEK's plans for meeting Namibia's power needs in the short-medium termhave been focused mainly on increasing imports until the Epupa project can be built. It hasbeen planning to build an additional 400kV line as soon as additional import capacitybecomes necessary, assuming that this will be required in the early years of the next centuryto carry exports from Epupa to the RSA. The foregoing analysis indicates that otheroptions although limited in scope, may be more attractive. They may make it possible todefer major investments in transmission, which could be a great advantage so long as thefate of Epupa remains uncertain, as may well be the case for some time. It is thereforerecommended that the following options be investigated further:
* A peak/off-peak tariff for large consumers. This demand side option should begiven the highest priority because it could bring benefits equivalent to adding 10-20MW of capacity at very low cost.
* Ruacana Fourth Unit. Investigating the technical feasibility of this option shouldbe accorded first priority on the supply side.
* 3Gas turbines for peaking capacity. Although a relatively high cost solution, thiscould become a viable option if a time-of-use tariff is adopted. In addition, gasturbines may be specially attractive in an uncertain environment (about the growth ofdemand as well as Epupa) since they offer a low capital cost way of plugging-inadditional capacity, as needed, and at short notice.
4.24 These three options, as well as the plans for transmission for increasing importsfrom the RSA, should be the objects of a study aimed at defining a least-cost generation-transmission plan for meeting Namibia's power needs in the short and medium term.Indeed, such a study could mark the initiation of a much needed more systematic approachto power planning for optimizing sector investment decisions on the basis of a full range ofsupply and demand side options.
Tariffs and Finances
4.25 SWAWEK's tariff system is simple, consisting only of two categories: large powerusers, including mines and large industries, municipalities and other public distributionauthorities; and small power users, which include individual commercial farms and a fewsmall localities. In 1991 SWAWEK earned approximately US cents 3.0/kWh (0.08Rand/kWh), based on the following tariff structure:
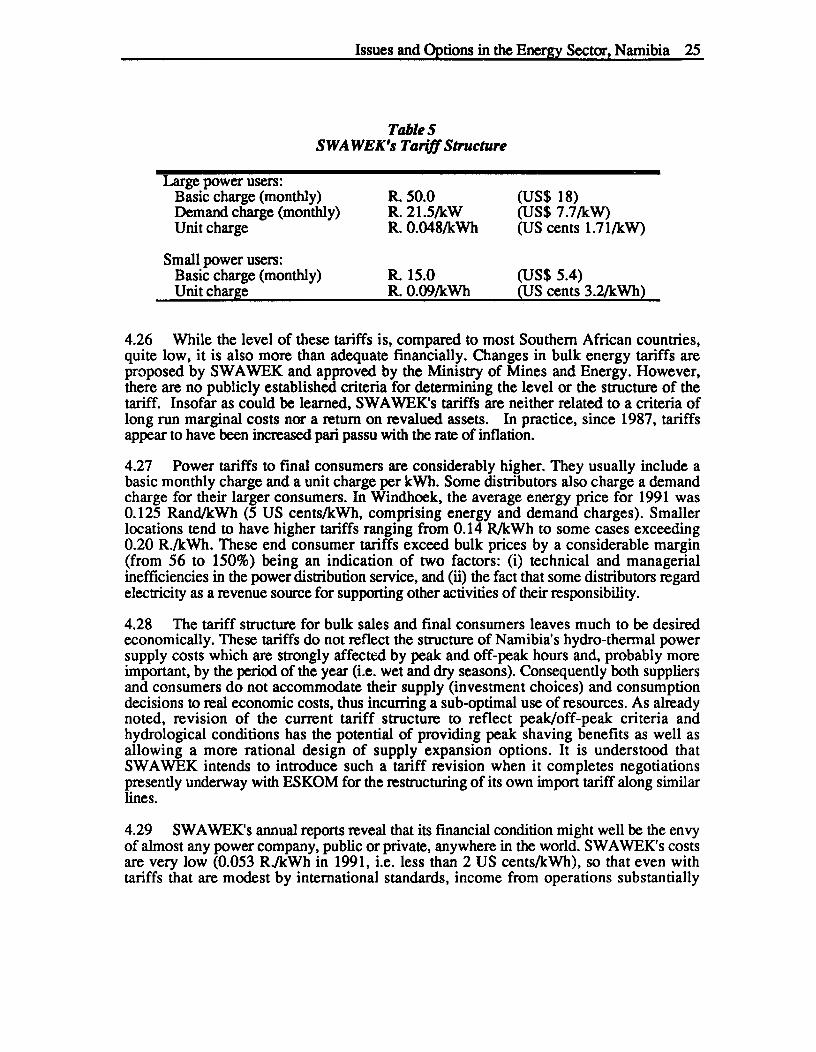
Issues and Options in the Energy Sector, Namibia 25
TableSSWAWEK's Tariff Structure
Large power users:Basic charge (monthly) R. 50.0 (US$ 18)Demand charge (monthly) R. 21.5/kW (US$ 7.7/kW)Unit charge R. 0.048/kWh (US cents 1.71/kW)
Small power users:Basic charge (monthly) R. 15.0 (US$ 5.4)Unit charge R. 0.09/kWh (US cents 3.2/kWh)
4.26 While the level of these tariffs is, compared to most Southern African countries,quite low, it is also more than adequate financially. Changes in bulk energy tariffs areproposed by SWAWEK and approved by the Ministry of Mines and Energy. However,there are no publicly established criteria for determining the level or the structure of thetariff. Insofar as could be learned, SWAWEK's tariffs are neither related to a criteria oflong run marginal costs nor a return on revalued assets. In practice, since 1987, tariffsappear to have been increased pari passu with the rate of inflation.
4.27 Power tariffs to final consumers are considerably higher. They usually include abasic monthly charge and a unit charge per kWh. Some distributors also charge a demandcharge for their larger consumers. In Windhoek, the average energy price for 1991 was0.125 Rand/kWh (5 US cents/kWh, comprising energy and demand charges). Smallerlocations tend to have higher tariffs ranging from 0.14 R/kWh to some cases exceeding0.20 R./kWh. These end consumer tariffs exceed bulk prices by a considerable margin(from 56 to 150%) being an indication of two factors: (i) technical and managerialinefficiencies in the power distribution service, and (ii) the fact that some distributors regardelectricity as a revenue source for supporting other activities of their responsibility.
4.28 The tariff structure for bulk sales and final consumers leaves much to be desiredeconomically. These tariffs do not reflect the structure of Namibia's hydro-thermnal powersupply costs which are strongly affected by peak and off-peak hours and, probably moreimportant, by the period of the year (i.e. wet and dry seasons). Consequently both suppliersand consumers do not accommodate their supply (investment choices) and consumptiondecisions to real economic costs, thus incurring a sub-optimal use of resources. As alreadynoted, revision of the current tariff structure to reflect peak/off-peak criteria andhydrological conditions has the potential of providing peak shaving benefits as well asallowing a more rational design of supply expansion options. It is understood thatSWAWEK intends to introduce such a tariff revision when it completes negotiationspresently underway widh ESKOM for the restructuring of its own import tariff along similarlines.
4.29 SWAWEK's annual reports reveal that its financial condition might well be the envyof almost any power company, public or private, anywhere in the world. SWAWEK's costsare very low (0.053 R./kWh in 1991, i.e. less than 2 US cents/kWh), so that even withtariffs that are modest by international standards, income from operations substantially

26 Issues and Options in the Energy Sector, Namibia
exceed operating expenditure (see Table 6). And, since capital expenditures have beenrelatively low, SWAWEK has been generating a sizable cash surplus in recent years. Thus,while SWAWEK pays a small annual dividend to the govemment, it has been able to buildup large cash reserves and financial assets which reached 285 million Rand by 1991 (100US$ million). Actually, SWAWEK now earns more than 26% of its revenue from sourcesother than electricity sales.
4.30 While SWAWEK benefits financially from its exemption from income tax andfrom the fact that its major financial obligations carry very low interest rates8, its financialperformance mainly reflects its tight management and the ability it has had to swifdy adjusttariffs to keep abreast of inflation. However, the continued piling up of surpluses inSWAWEK's coffers would not be in the best interest either of the govemment, which facesserious budgetary problems, or of SWAWEK, which could discover that a cash cow's life isnot necessarily a happy one. Much will depend on the decisions to be taken about thepower sector investment program. If Epupa and/or a major new transmissioninterconnection are to be built in the near future, SWAWEK will need all the resources itcan generate if there is to be sufficient element of self-financing. However, if investment isto be limited to the lower capital cost options, SWAWEK's resources might be regarded assurplus to its requirements and a case could be made for having it fund rural electrificationprograms, and pay increased taxes and/or dividends to the government.
8 These debts stem from the arrangements made with the RSA for Namibia to take over SWAWEKat the time of independence; they are either interestfree or bear interest at 4-5%.

Issues and Options in the Energy Sector, Namibia 27
Table 6SWAWEK's Operating Results
(current R. '000)
1988 1989 1990 1991
Operating Inme 89421 105481 122145 138234Sales of electricity 88534 104309 117072 135775Other income 887 1172 5073 2459
Operating Expenditure 66887 65667 89111 91307Generation & distribution 49764 47340 69103 69402Management & administration 5940 6651 7640 8368Interest paid 846 767 684 600Depreciation 10337 10909 11684 12937
Net Operating Income 22534 39814 33034 46927Interest earned by funds 21402 30462 40267 40135Net Income 43936 70276 73301 960662Available for investment 54273 8115 84985 108999Capital Expenditure 11900 30259 31289 42063Available for distribution 42373 50926 53696 66936Dividend 6500Increase in funds 35873 44426 47196 60436
Fixed Assets 252903 271702 291113 319982Financial assets 172957 195865 231575 285341
Fixed deposits and money on call 30038 28341 45604 104585Return on fixed assets (%)
Total 17A 25.9 25.2 30.0Power operations 8.9 14.7 11.3 14.7
Return on financial assets (%) 12.4 15.6 17.4 17.2Energy Sales (Gwh) 1582 1659 1612 1719Generation cost (R/kWh) 0.042 0.040 0.055 0.053Average tariff (R/kWh) 0.056 0.056 0.073 0.079
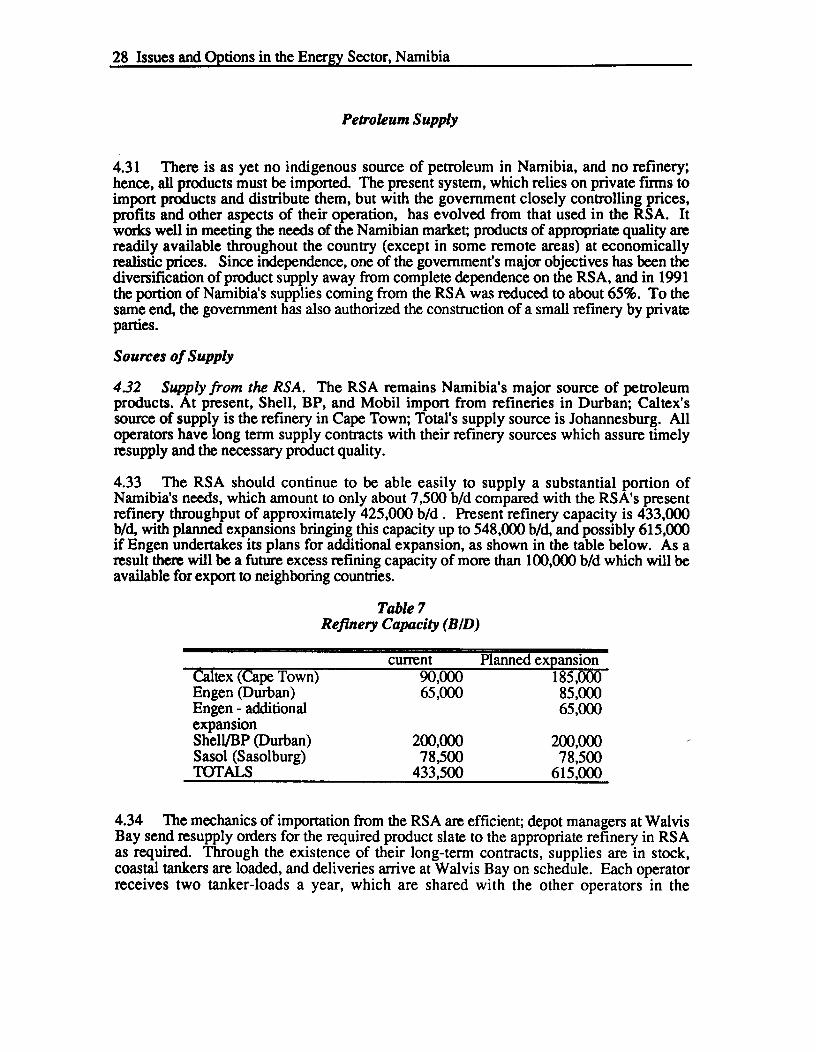
28 Issues and Options in the Energy Sector, Namibia
Petroleum Supply
4.31 There is as yet no indigenous source of petroleum in Namibia, and no refinery;hence, all products must be imported. The present system, which relies on private firms toimport products and distribute them, but with the government closely controlling prices,profits and other aspects of their operation, has evolved from that used in the RSA. Itworks well in meeting the needs of the Namibian market; products of appropriate quality arereadily available throughout the country (except in some remote areas) at economicallyrealistic prices. Since independence, one of the government's major objectives has been thediversification of product supply away from complete dependence on the RSA, and in 1991the portion of Namibia's supplies coming from the RSA was reduced to about 65%. To thesame end, the government has also authorized the construction of a small refinery by privateparties.
Sources of Supply
432 Supply from the RSA. The RSA remains Namibia's major source of petroleumproducts. At present, Shell, BP, and Mobil import from refineries in Durban; Caltex'ssource of supply is the refinery in Cape Town; Total's supply source is Johannesburg. Alloperators have long term supply contracts with their refinery sources which assure timelyresupply and the necessary product quality.
4.33 The RSA should continue to be able easily to supply a substantial portion ofNamibia's needs, which amount to only about 7,500 b/d compared with the RSA's presentrefinery throughput of approximately 425,000 b/d . Present refinery capacity is 433,000b/d, with planned expansions bringing this capacity up to 548,000 b/d, and possibly 615,000if Engen undertakes its plans for additional expansion, as shown in the table below. As aresult there will be a future excess refining capacity of more than 100,000 b/d which will beavailable for export to neighboring countries.
Table 7Refinery Capacity (BID)
current Planned expansionCaltex (Cape Town) 90,000 185,000Engen (Durban) 65,000 85,000Engen - additional 65,000expansionShell/BP (Durban) 200,000 200,000Sasol (Sasolburg) 78,500 78,500TOTALS 433,500 615,000
4.34 The mechanics of importation from the RSA are efficient; depot managers at WalvisBay send resupply orders for the required product slate to the appropriate refinery in RSAas required. Through the existence of their long-term contracts, supplies are in stock,coastal tankers are loaded, and deliveries arrive at Walvis Bay on schedule. Each operatorreceives two tanker-loads a year, which are shared with the other operators in the

Issues and Options in the Energy Sector, Namibia 29
communally owned and managed supply depot at Walvis Bay. The cargo size andfrequency of shipment closely match the harbor and depot size at Walvis Bay, and areclosely attuned to the country's supply requirements.
4.35 Diversification of Supply While recognizing the efficiency of supply from the RSA,the government has been concerned about over-dependence on a single source of supplyand has been seeking to diversify petroleum product imports. Towards this end, it requestedthe operating companies to purchase at least 30% of their supplies from new sources. Thisrequest was honored and in 1991 35% of petroleum products imported into Namibia camefrom sources other than the RSA. While the shift to new import sources (mainly Angola,Bahrain and Curacao) has been accomplished swiftly and without disrupting the market,there were some difficulties in obtaining supplies of adequate quality at competitive prices.As reported by the companies, these included problems with respect to:
Shipping. The size of Namibia's product market lends itself to supply through theuse of coastal tankers which are commonly 30,000 tons or less in size. For reasonsof seaworthiness, the use of these tankers is restricted to the West African coast,from the refineries at Abidjan to those at Durban. Supply points further afield, suchas Trinidad, Rotterdam, the Mediterranean or the Gulf, normally use larger tankers,commonly above 70,000 tons. Not only are shipments of this size inappropriate forthe Namibian market, but the harbor at Walvis Bay cannot accommodate vessels ofthis size.
* Currency fluctuations. When bidding for products on the international spot market,rather than through long term contracts which specify terms and currency ofpayment, prices are agreed, usually in US dollars, at time of purchase, with paymentmade at time of delivery. Income is earned, in Rand, at the point of retail sale, weeksor months later. Fluctuations in the value of the Rand expose the companies topossible exchange rate losses, or gains, to which they are not exposed whenpurchasing from the RSA in Rand. They report that protection against suchexposure is not readily available and involves significant additional cost.
i Transport Costs. Purchases made from farther afield than Abidjan or Durban incura higher transportation cost both because of the greater distances involved andbecause the tanker size restriction at Walvis Bay requires some form oftransshipment to smaller draft vessels. In a market in which retail prices arecontrolled, these costs must be born at least initially by the operator.
* Cabinda. Geographically, the Cabinda refinery in Angola is the most logicalalternative to the RSA refineries. However, it poses problems as regard the securityof supply and product quality. The refinery produces largely for domestic use andproduct stocks available for export are generally low. Moreover, experience with thepurchase of Cabinda products has been that they do not meet Namibianspecifications for RON ratings and other quality factors. This has led to shipmentsbeing refused on delivery at Walvis Bay with resulting delays and costs whilesubstitute stocks were obtained from the RSA.
4.36 As a result, the government has, at least informally, decided not to press for furtherdiversification of supply at the present time. This decision seems wise since experience todate appears to indicate that a significant increase in purchases from non-RSA sources

30 Issues and Options in the Energy Sector, Namibia
might come only at appreciably higher cost in terms of price, security of supply and productquality.
The Import and Distribution System
4.37 Walvis Bay, the only commercial harbor on the Namibian coast, is the key link inthe petroleum products supply chain. The harbor's capacity is well matched to the existingtank depot and inland rail distribution requirements. These in turn are matched to thecountry's product requirements, which include a de facto strategic reserve of at least 30 daysof product supply, which should be sufficient The port's capacity restriction to 30,000 tontankers does not constrain Namibia's product importation requirements. Should demandincrease significandy, capacity may be easily met by bringing in additional 30,000 ton cargoloads. Should storage capacity need to be increased, the existing depots may be expandedthrough the addition of more tanks.
4.38 There is no commercial reason to either deepen Walvis Bay, or to construct a newpetroleum harbor, with its costly ancillary facilities and supporting infrastructure. Thedifficulty with Walvis Bay is political, not physical. As an enclave retained by the RSA, it isstill officially regarded by most sub-Saharan governments as part of the RSA, rather thanthe entry port for Namibia. Although economic sanctions are largely a thing of the past, therelevant laws still remain in force, and the operating companies are reluctant to put theirinterests in some countries at risk by purchasing products from refineries there for export toNamibia through Walvis Bay.
4.39 The development of alternatives to shipping through Walvis Bay, such as enlargingthe harbor at Swakopmund, have been proposed as a solution to the political problem.However, any such solution would be costly, indeed, owing to the strong offshore currentsand other physical difficulties in constructing a new petroleum harbor, and to the need forexpensive ancillary facilities and costly infrastructure.
4.40 The Market. The Namibian petroleum product market, which was artificiallyinflated by the needs of the RSA and UN forces during the war years, has contracted bysome 20% since independence to its present size of some 450 million liters/year. Whilesmail in absolute size, Namibia's consumption per capita is high by African standards. Atabout 432kg/pa in 1990, per capita consumption was well in excess of that in such otherhigher income countries in the region as Botswana and Swaziland, and several times higherthen in Angola and Zimbabwe. Given the already high consumption level, and the modestprospects for economic growth in the near term, gasoline demand is forecast to grow at only4% per year, and diesel at 2% per year. It is, thus, unlikely that the levels of petroleumconsumption which occurred during the war will be seen again in the near future.

Issues and Options in the Energy Sector, Namibia 31
4.41 The composition of products marketed in Namibia during the first quarter of 1992is shown in the following table.
Table 8Saks Volumes
Petroleum product Volume Percentage(k4trs) of market
LPG 1,787.5 1.3Aviation gasoline 9,043.9 6.9Motor gasoline 52,867.8 40.3Kerosene 1,098.7 0.8Diesel fuel 55,883.7 42.6Fuel oil 7,098.4 5.4Lubricants 2,419.4 1.8Bitumen 750.4 0.6Other 95.7 0.0
TOTAL 131,045.5 100.0
4.42 Six companies are now active in Namibia; BP, Shell, Caltex, Engen/Mobil, Trek andTotal, and a seventh, Lenoil, is attempting to enter the market The first four represent themajors, and are active in most markets in the world. Of these, BP and Shell are operated asindependent Namibian companies, as a protective measure against the economic sanctionsagainst the RSA. Mobil in contrast divested itself of its South African assets, selling itsmarketing operations to a subsidiary of Consolidated Gold Mines; the company name is inthe process of being changed in RSA to that of its energy subsidiary, Engen, known inNamibia by its trade name, Noble. The other companies function as district offices, withadministrative support from their headquarters offices outside of Namibia. Trek andAfrox are South African companies which mostly market specialized lubricants andindustrial gases, including LPG, in Namibia. The companies, and their market share duringfirst quarter 1992 are as follows:
Table 9Market Shares
Company volume of all market shareproducts (%)(kloliter)
BP 28,182.0 21.5Shell 31,726.0 24.2Caltex 29,666.0 22.6Noble 24,309.8 18.6Total 13,043.4 10.0Trek 3,468.3 2.6
TOTAL 131,045.5 100.0
32 Issues and Options in the Energy Sector, Namibia
4.43 Since the prices of the major products are controlled, as described in Chapter VI,competition must be based on service in lieu of price. This has put a premium on theexpansion and modernization of the companies' network of service stations, as well as onpromotional campaigns featuring "free" gifts, and other offers. As a result, the country iswell served, but "overpumped" - -i.e.,there has been over-investment in an excessive numberof excessively elaborate service stations. Recognizing this, the MME has agreed with thecompanies on a five year rationalization plan aimed at preventing the proliferation of retailoutlets by requiring that more old service stations be closed than new ones are opened.
The Refinery
4.44 As part of its concern with reducing Namibia's dependence on imported oilproducts, particularly from the RSA, the government has been interested in the constructionof a refinery in the country. In June 1991, it was announced that the government had agreedto the construction of a refinery proposed by private parties. The agreement between thegovernment and the project sponsors reportedly provides, inter alia, that the funding betotally private; that there be no government guarantee concerning the refinery throughput;that product prices be equal to or lower than import parity, with no subsidies; that Namibiancrude (if discovered) be utilized as feedstock; that quality match existing Namibianstandards, and that pollution will be kept in line with World Health Organization guidelines.
4.45 The refinery would be built on the outskirts of Usakos, a small town located some140km from the coast. It would have a throughput capacity of 15,000 b/d and be of modulardesign. The project is sponsored by a firm known as Enerkor (Namibia) Pty. Enerkorannounced that the plant is to be designed by the German engineering firm Montan, andbuilt in South Korea by Sunkyong. Construction would, it said, take two years and costapproximately US$ 130 million. However, no activity was evident at the site during themission's visit in June, 1992 and there is no indication of when, if ever, the sponsors intendto proceed with the project
4.46 This summarizes about all that is known about the refinery. Given the lack ofinformation on the technical characteristics of the refinery, the feedstock to be used, theproduct mix, the financial plan and the identity and capabilities of the sponsors, even apreliminary quantitative assessment of the project would be foolhardy. However, theeconomic and financial viability of the project appears highly questionable for a number ofreasons:
Size: The refinery is too small to achieve the economies of scalenecessary to produce at competitive cost
Product mix: As the Table below shows, the usual yield of a"simple" refinery (which Usakos would presumably be) does notmatch the needs of the Namibian market. It would produce less ofthe major fuels (petrol and diesel) required in Namibia and muchmore fuel oil and other products than Namibia can consume. Thelatter would presumably have to be exported to neighboringcountries in competition with their present sources of supply.
Inland location: The need to transship crude at Walvis Bay and thecosts of inland transportation (presumably by rail) to Usakos appearto further handicap the economics of the refinery.

Issues and Options in the Energy Sector, Namibia 33
Tabk 10Market vs. Refinery Mix
Namibian Market Typical RefineryDemand as a Output as a
Percentage PercentageSimple Complex
Motor gasoline 35 15 27Kerosene/jet fuel 10 5 6Diesel 50 20 20Fuel Oil 5 54 37
Other 0 6 10TOTAL 100 100 100
4.47 It is, thus, not surprising that preliminary analyses by objective third parties havereportedly concluded that the refinery is unlikely to be viable. The risk to Namibia from theproject appears to have been minimized by the requirement that it be constructed withoutpublic funds and operated without public subsidy. However, risk remains in that experiencein a number of developing countries shows that uneconomic refineries, once built, can easilybe transmuted through pressure from the sponsors, the workers and the surroundingcommunity into valuable national assets requiring government assistance. In a number ofdeveloping countries, governments have in similar circumstances felt impelled to take overor subsidize uneconomic refineries at great public cost.

34 Issues and Options in the Energy Sector, Namibia
V. EXPORT OPPORTUNITIES
Epupa Hydropower Project
5.1 The hydropower potential of the Kunene river, shared with Angola, constitutes oneof the main energy resources of Narnibia. SWAWEK has identified a promising site for thedevelopment of a major hydro plant in the vicinity of the Epupa falls. Although the studiesare still at a very early stage, morphological and hydrological conditions seem to befavorable for the construction of a hydro plant of 250-500 MW installed capacity that couldsupply 1200-1800 GWh per year. The pre-feasibility study currently being undertaken withNORAD's support should:
* Confirm the technical viability of the project, particularly regarding geologicalconditions and their impact on costs.
* Identify two or three alternative schemes for further study during the feasibilityphase. Given the existing uncertainty regarding the project's market and the non-intensive geological investigations to be undertaken during the pre-feasibility study,it is not advisable to select a single alternative at this stage.
* Analyze the potential environmental and social impact of the projecL
* *Clearly identify the Nanibia-Angola agreements required for the development of theproject. Issues to be addressed are land use, water rights and operation, plantownership and financing.
* Examine the financial implications of the Epupa project for both countries.
5.2 Given Namibia's current generating and import capability, the capacity and energysupplied by the project, particularly for its larger and costwise more attractive size (i.e. 450-500 MW) would not be required by the domestic power market before the year 2010.Therefore, the project's economic viability in the medium term has been considered to restmainly on its export potential.9
The RSA power market.
5.3 The RSA currently has excess capacity of around 7,000 MW and so will mostprobably not need additional capacity until early in the next century. It is estimated that,under a medium growth scenario, the RSA would not need additional power until the year2002, a date which coincides with a realistic lead time for the commissioning of Epupa ifconstruction is begun in the near future. However, this scenario implies a revival of growthin the RSA economy that is unlikely to materialize unless the economic and politicaluncertainties which currently cloud the country's future are quickly dissipated. A recentstudy of the power market indicates that, under a continued low-growth scenario, the RSAwould not need additional power before the year 2010. A decision to invest in an exportoriented Epupa project would necessarily be contingent on SWAWEK's ability to reachagreement with ESKOM on a suitable long term arrangement for energy sales. The
9 A smaller but more costly (in unit terms) Epupa to serve only the Namibian market wouldprobably not be justified unless the real cost of imports from the RSA were to rise sharply.

Issues and Options in the Energy Sector, Namibia 35
prospects for such an agreement have been discussed with ESKOM, which has indicatedthat it is interested, in principle, in purchasing power from Epupa when it needs additionalcapacity. However, ESKOM reportedly has also made clear that Epupa would have to becompetitive with low cost coal-fired generation in the RSA and with other potential sourcesin the region such as the Kudu gas field and the Cahora Bassa plant in Mozambique.
Project costs
5.4 Until the results of the pre-feasibility study become available, SWAWEK's ownpreliminary studies provide the only basis for assessing the project. SWAWEK'spreliminary cost estimate, presumably for the large size scheme of 450 MW, is that thecapital cost would be around $450million. This estimate of approximately $1,000 /kWappears unduly optimistic. In fact, it falls outside the lower end of a wide range of costs thatappears realistic on the basis of international and Bank supported experience in projects ofthis type.
5.5 Based on the Bank's general experience in supporting hydropower projects duringthe last 20 years, and on recent experience in projects of similar characteristics, the missionestimates that the capital cost for a large 450 MW plant could range between $525 and$800 million ($1160-1777/kW), where the lower value would correspond to an efficientlymanaged project in better than average site conditions. As shown in Table 1 below, thesecapital costs imply energy costs between 4.0 to 6.0 US cents/kWh, which compare to the3.5 US cents/kWh resulting from SWAWEK's preliminary estimates.
Tabke IEpupa Project - Energy Cost Estimates
(in US cents/kWh)
SWAWEK Missionestimate estimate
low high
Large Epupa (450 MW) 3.5 4.0 6.2Small Epupa (240 MW) -- 5.0 6.8
5.6 Although even the higher set of costs may appear attractive by internationalstandards, they suggest that Epupa would have serious difficulty in competing in the RSAmarket. ESKOM estimates that coal fired generation there presently costs less than 2.0 UScents/kWh and, while a number of factors may drive up this cost in the long term (e.g., thepossible opening up of international markets to RSA coal; the imposition of more stringentpollution control requirements), it seems unlikely to exceed the realistic cost of power fromEpupa.10
10 The ESKOM estimate appears to be on the low side since it is reportedly assumes an 8%discount rate, 50 year project life and lower than average capital costs. LRMC is estmated byESKOM to be in the order of 2.7 US cents/kWh. The mission estimates the cost of energyfromnew coal-fired plant at 3.1 US cents/kWh using prevailing coal costs, heat content and thermalefficiency, a capital cost of $10001kW and a 10% discount rate.

36 Issues and Options in the Energy Sector, Namibia
Environmental considerations
5.7 The Epupa Project would be located on the Angola-Namibia border, in a wildemessarea sparsely populated by nomadic groups and characterized by vast non-productive lands.In spite of these factors the magnitude of the project, particularly its gigantic 5,000 millioncubic meters reservoir, and its intemational character justify a serious and early approach inassessing its potential environmental and social impact.
5.8 An international project of this magnitude will certainly attract the attention of theenvironmental community due to its possible impact on the area's wildlife and humanpopulation . The ongoing pre-feasibility study places special emphasis on these issues incalling for a well designed analysis addressing environmental and socio-economic impacts.In fact, the study is expected to thoroughly examine important environmental issues such asthe alteration of flow regimes, potential erosion and sedimentation, transport of nutrients,flora and fauna, as well social and economic issues related to land flooded and requiredpopulation resettlements, health, agriculture and livestock, pollution during construction andcultural values. It is the mission's view that the high priority given to environmental issuesby the pre-feasibility study is clearly justified. The successful completion of this study isessential to identifying and designing mitigating measures as well as for dealing withpressures from the domestic and international environmental community, which are sure tocome.
Kudu Offshore Gas Field Development
5.9 The evidence to hand suggests that this is a world-scale gas field, with characteristicsindicating that few problems should be encountered in its development and exploitation.The Kudu field was discovered in 1973 by Chevron which, largely due to the politicalsituation in the country, did not pursue its development. Appraisal drilling was undertakenby the government in 1985-88 during which time two wells (Kudu 9A-2 and 3) were drilled.The latter encountered good quality aeonian sandstones within the volcanic sequence, andtested dry gas at rates up to 38 MMCFG/D. The gas bearing sandstones are in an uppermarine unit and a lower volcanic/aeonian sand unit. The field is located in approximately170 meters of water, 180 km from the coast at Orangemund, on the Namibian/South Africanborder.
Reservoir conditions and reserve determinations
5.10 The upper reservoirs are poor quality, but the lower reservoir is extremely good,although apparently subdivided into three separate reservoir pressure units. Watersaturation is low, and the reservoir pressure is approximately 7,800 psi. The gas/watercontact in the 9A-2 well is at -4458 meters; and gas saturations of 40% are present in thenon-producible reservoirs of 9A-2 to a depth of -4464.3 meters. A gas column of some268 meters is present, but engineering and geological data suggest that the gas is not asingle accumulation in pressure communication. The gas is nearly pure methane, with asmall quantity of ethane and traces of propane and butane, with no heavier hydrocarbonsnor sulfur. There is therefore no scope for Liquid Petroleum Gas (LPG) recovery, or therecovery of associated natural gas liquids. The absence of condensate, water or sulfur willlikely allow the gas to be delivered to shore without expensive offshore treatment. The highreservoir pressure obviates the need for offshore compression; the resulting simplicity ofproduction makes it likely that the offshore production facilities need not be manned,thereby further reducing their complexity and cost.

Issues and Options in the Energy Sector, Namibia 37
Detailed seismic study of the reservoir section in the area of the Kudu field indicate that thesandstones are sealed to the east by an onlap onto an underlying unconformity; with theirnorthern and southern extent as yet undefined. The field thus is represented as a very largestratigraphic trap, rather than the more conventional structural entrapping situation. As such,the reserves of the field are difficult to determine with any degree of engineering precision.Initial studies indicated producible reserves of dry gas would be in the range of 2.5 to 8Trillion cubic feet of gas (TCF). Subsequent, more sophisticated seismic sequence studieshave raised this range to 5.0 to 55.0 TCF. Although no long term production tests havebeen conducted, and the capability of the field to deliver on a sustained basis is unknown,Kudu appears to represent a major resource but one whose exact dimensions and reservesstill need to be accurately defined. This will require the drilling of several field delineationwells.
Field Development
5.11 The most recent and thorough examination of the prospects for developing Kuduare contained in the Kudu Gas Utilization Study prepared for NAMCOR in 1991 by PencolEngineering Consultants (London). In order to evaluate the economics of producing thefield, two reserve cases were taken, 2 TCF and 10 TCF. On the basis of these choices, dailygas deliverability, production plateau duration, and decline rates were determined byreference to PetroConsultants' global data base from analogous fields elsewhere in theworld. On this basis, the smaller case will produce at a plateau rate of 275 MMCFD, andthe 10 TCF case's plateau production rate will be 1 Billion cubic feet per day. Both caseshave a plateau duration of 14 years, followed by declining rates. Should the field reservesprove larger than this, the plateau would be extended by the appropriate amount of time, orheld steady, with the rate of production increased. With the exception of the pipeline toshore, the development of the field can be accomplished largely in modular fashion, oneplatform cluster of wells at a time. In this fashion, the rate of production will follow marketgrowth.
5.12 The Study concludes that, based on the development costs of similar fieldselsewhere, exploration and development costs would amount to some $353million for thesmaller reserve case, and more than $1. lbillion for the larger one. Given these costs, Kudugas can be delivered to shore at after tax prices in the range of $1.34 to $1.14 MCF(MMBTU) at flow rates of 275 and 1,000 MMCFD respectively. Prices in this rangewould compare favorably with those of other, similar gas fields and indicate that it should bepossible to develop Kudu commercially if a market can be found.
5.13 It is important to note, moreover, that the study's conclusions do not necessarilyreflect optimization of development for the conditions which exist in the Kudu field. Rather,they represent conventional development programs, and average costs associated with theseprograms based on world-wide experience. The essence of these programs is the use offixed platforms, each of which contain a cluster of deviated wells which drain a roughlycircular portion of the reservoir, the radius of which is defined by the maximum deviation ofthe wells out from the platform.
5.14 It is possible that recent developments in field exploitation, which utilize theconcepts of floating production facilities, wells drilled horizontally along the reservoir,subsea completions coupled to the floating vessels by seabed gathering lines and flexiblerisers may significantly increase the radius of drainage for each cluster, and materially lowerthe unit cost of gas production, delivered to the shore. These technologies are starting to be

38 Issues and Options in the Energy Sector, Namibia
employed in the development of marginal oil fields in the North Sea. They have never beenused in the commercial production of offshore gas fields however, and hence theirapplicability, and the associated risks involved, are unknown. Nevertheless there is reasonto believe that the use of low cost development programs for the field is being intensivelyconsiderd by the international oil company most interested in Kudu.
Market Prospects
5.15 Given the promising outlook for producing gas and pipelining it to the mainland atan attractive price, the major questions surrounding the development of Kudu concern themarket. The Namibian market is far too small to absorb a meaningful quantity of gas andthe likely economic returns on using it to produce products for sale on world markets (i.e.,as feedstock to produce urea or methanol, or as a fuel for use in aluminum or iron refining)appear low. Thus, the most promising markets appear to be in the RSA, where the potentialfor using Kudu gas to supply electricity to the Cape and/or as an industrial fuel there havebeen the focus of most recent interest.
5.16 The government has reportedly received a proposal from a major international oilcompany for the development of Kudu based on using the gas in a 1300MW combinedcycle generating plant on the Namibian coast that would produce for the RSA grid. Whilesuch interest on the part of an international "major" is certainly a positive sign, the RSA isnot, as already noted, likely to need additional capacity until, at least, the early years of thenext century. Moreover, on the basis of international experience, a combined cycle plantburning gas priced in the range indicated in the Gas Utilization Study would generate powerat a cost of about $0.03-0.035/kWh (excluding transmission costs). This could bemarginally competitive with coal fired generation in the RSA. However, ESKOM isreportedly interested in purchasing gas, not power, and it is understood that negotiationshave focused on whether Kudu gas can be provided in the Cape at a price that would make itpossible for ESKOM to build a gas fired plant that would compete with coal.
5.17 While the base case analyzed in the Gas Utilization Study also incorporates powergeneration in Namibia (on a smaller scale, 500MW), it also finds an attractive market forKudu gas in the Cape. It concludes that, with the construction of a 780 km onshore 30"pipeline requiring an initial investment of some $500 million, gas could be delivered to theCape at $1.80-2.00/MCF and that, at this price, it would be competitive as a fuel in a widerange of industries (e.g., baking, cement, brick, fertilizer) and for existing power plants.However, the total Cape gas demand foreseen in this scenario would amount to155MMCFD in 1996 and 178MMCFD in 2002 and it seems questionable whether thiswould be a market of sufficient size to justify the development of the field and constructionof the pipeline at the cost and on the terms assumed."1 Moreover, it should be noted thatsome 65MMCFD of the projected market would come from the conversion of two coal-fired power plants that are presently used for stand-by purposes, not base load generation.
The Gas Utilization Study unfortunately makes no effort directly to analyze the economic orfinancial returns from the development of Kudu.
Issues and Options in the Energy Sector, Namibia 39
Environmental Considerations
5.18 A considerable number of gas fields of similar magnitude to Kudu have beendeveloped in the UK, Netherlands and Norwegian sectors of the North Sea, under varyingconditions of habitual sea state and weather. There have been collisions, fires andexplosions in this development area, which also lies across one of the world's most heavilytraveled shipping routes. Through the planning and preparations that have been undertakenby the industry in its own interest, the environmental impact of these disasters has beenminimized. The role of the governments has been to set environmental standards, and toreview individual company plans for compliance.
5.19 Similar government/company efforts can be put into place in the development of theKudu field, and the exploration of the remainder of the Namibian continental shelf.Evidence to date suggest that the government is proceeding in this direction. Contracts forthe exploration and development of hydrocarbons offshore (see below) containenvironmental protection clauses which require that each company identify theenvironmental risks which its proposed activities entail, and formulate plans to avoid them.Compliance with these plans will be overseen jointly by the MME and the Ministry andWildlife and Conservation, Namibia's principal environmental regulatory agency.
5.20 The North Sea fields are located within the rich fishing beds of this area. In thenearly thirty years that have elapsed since the first gas development well was drilled, theimpact on the fishing industry has, if anything, been favorable. An active workingrelationship between the gas industry and the fishermen has developed to their mutualbenefit. In particular, the fishermen have noted that the production platforms tend to serveas artificial reefs on which grow a number of organisms to which the fish are attracted,resulting in a marked improvement in fishing in the development area.
The Way Ahead
5.21 Prospects for the development of Epupa and Kudu, as generally conceived, dependheavily on the RSA market. While Kudu would appear to have the competitive edge, asalready noted, the difference between their generating costs seems to be well within thelikely margin of error of the guesstimates that can be made at this time. They both,therefore, seem to falter in the face of the problem of meeting low-cost competition in aglutted market. There is likely to be a market for gas-fired power generation in the RSAearly in the next century, as new capacity is required and environmental imperatives becomestronger, but not within the economic life of projects started in this decade.
5.22 However, as the Utilization Study indicates, Kudu may also have the potentialeconomically to serve a large industrial market that should be ripe for conversion to gas atthe price it can offer. Kudu also differs from Epupa in that it could be developed muchmore quickly, perhaps within 3-5 years, whereas it would probably require 10 years or so tobring Epupa on line. Environmentally, it may be easier, as indicated above, to contain therisks posed by the development of Kudu and the substitution of gas for coal in thegeneration of power would be a long run environmental plus. Finally, since gas fielddevelopment and production is a type of project eminently suitable for private sector

40 Issues and Options in the Energy Sector, Namibia
development and financing, Namibia could reap the very handsome benefits of Kudu'sdevelopment without having to put public funds at risk or encumber its intemational credit.
5.23 To bring the prospects for Kudu into sharper focus, priority should be given toinvestigating the feasibility of alternate development plans to include low cost fielddevelopment options which do not require the large initial capital oudays for productionplatforms and which may make it possible to develop the field in a more modular fashion,bringing on capacity as additional market develops. At the same time, more detailed marketstudies for gas supply to Cape industrial users need to be undertaken in order to moreclosely define not only the price at which delivered gas can be sold in this market, but thevolumes of gas which this market can be reasonably expected to absorb. With a clearerview of optimized costs of production and the volume of industrial demand, the project'seconomic and financial retums need to be carefully evaluated.
5.24 If the results are positive, it should be possible to develop a project that is attractiveto private investors. A crucial component of such a project is likely to be a marketingstrategy that focuses on getting Kudu's foot in the door by bringing gas to the Cape andoffering it at the lowest possible price in order to quickly develop the market. Such astrategy would entail both risk and the deferral of retums. Namibia's petroleum taxationlegislation contains elements of flexibility and the govemment may, given its interest inseeing the commencement of development of its natural resource base, wish to considerdeferring its take from the project. In this fashion, the initial costs of bringing the gas tomarket will indirecdy be shared by the government dtrough deferred receipt of its taxes androyalties as a means of initiating the development. As market penetration develops, and theunit costs of production decrease, the government take would, by previous agreement,progressively increase, ultimately recovering what had initially been deferred.
Oil Exploration
5.25 The discovery of oil would, needless to say, change the entire energy picture, andmuch else. One of the government's primary objectives in the sector has been to promotepetroleum exploration and, to this end, it moved rapidly after independence to strengthen thegeologic data base, enact an attractive contractual and fiscal framework and organizeinternational bidding for licenses. The state-owned Namibia Petroleum Company(NAMCOR), also contracted in 1989-90 for the acquisition of some 10,000km of seismic,gravity and magnetic data offshore, together with an integrated field evaluation, by Britishconsultants (ECL). This resulted in the identification of three additional geologic basinswhich were deemed to offer a variety of attractive oil and gas plays although, like Kudu,most of the prospects appear to lie in deep water.
5.26 Complementing the geologic program was the passage early in 1991 of newlegislation governing petroleum exploration and production and taxation drafted with theassistance of international consultants. The exploration/production law provides for thegranting of reconnaissance, exploration and production licenses under terms established in amodel agreement that generally follows accepted industry practice. The fiscal framework,which follows the profit-sharing rather than production-sharing model, provides for:

Issues and Options in the Energy Sector, Namibia 41
* 12.5% royalty* 42% income tax* additional profits tax: 25% when rate of return reaches 15%, negotiably
higher at higher rates of return* immediate expensing of exploration costs; three-year depreciation of
development expenses; unlimited carry forward of losses.
These terms were well received by the industry as providing investment incentives thatcompare favorably with those offered elsewhere.
5.27 Armed with its new geologic information and new legislation, the government inMarch, 1991 announced the opening of a first licensing round. The response wasenthusiastic. Representatives of more than 70 companies attended promotional sessionsheld in London and in Houston, and NAMCOR received sixteen license applications(including one for Kudu) by the time the bidding ended in November. Negotiations werebegun with the exploration block that had proved most attractive to bidders and inMarch,1992 a license was granted to a consortium of firms led by Norsk Hydro. Shortlythereafter, a second block was licensed to a group led by Ranger Oil. Both licenses involvesubstantial commitments by the companies; together, they include agreements to do some10,000km of seismic work and to drill at least 5 deep wells over a four year period. InSeptember, the MME announced the award of two additional licenses, to a joint venture ledby Chevron and to Sasol of the RSA.
5.28 Results to date, therefore, suggest that the promotion program is goingextraordinarily well. During the first round NAMCOR appears to have succeeded inobtaining minimum work commitments totaling some $1 10millon, including the drilling of8 wells. Based on international experience, efforts on this scale should be sufficient todefine the commercial potential of Namibia's hydrocarbon endowment. NAMCOR ispresently planning to announce a second promotion round in late 1993-early 1994. Thetiming midway in the first round work period seems apt, since any initial successes in thefirst round will serve to incase industry interest while making it possibleeffectively to spread both negotiations and ensuing evaluation work.

42 Issues and Options in the Energy Sector, Namibia
VI. INSTITUTIONAL ISSUES
6.1 While the present strengths and resource potential of the energy sector give goodgrounds for optimism about its future development, much will depend on the effectivenessof policy-making and administration in the sector. As is inevitable in so new a nation, a greatdeal needs to be done to strengthen policy analysis and decision making capabilities, tobuild an appropriate the legal and regulatory framework, to rationalize the institutionalstructure, and to enhance the professional and technical capacities of those working in thesector. The outstanding institutional issues that appear most pressing to the mission arediscussed below. The MME is well aware of the importance of these issues and intends togive high priority to addressing them in 1993 and later years.
Strengthening the MME
6.2 While still a fledgling institution, the MME has done much to strengthen itsorganizational structure and to bolster its staff. Energy policy and regulation are theresponsibility of the Directorate of Energy which contains Power and Petroleum Divisionsthat are each, in tum, divided into units responsible for resource development and for supplyand distribution. At the time of the mission's visit, the Directorate had eighteen positions, ofwhich thirteen were filled; staff were generally well qualified academically but many, notsurprisingly, lacked experience. In addition, NAMCOR, although structured as a state-owned company, functions de facto as part of the ministry. It has been responsible for theplanning and implementation of the petroleum exploration promotion program, includingthe negotiation of contracts with the international oil companies. With a staff of only fivewell qualified professionals, it has done a great deal with very little.
6.3 While the MME's responsibilities for petroleum and power are similar, in principle,its role in the two sub-sectors has so far been very different in practice. In petroleum, theministry has played an effective policy-making role beginning with its early decisions togive exploration high priority, to quickly take the measures necessary to create an attractivelegal and financial framework, and to undertake a vigorous promotion program. It alsoeffectively and efficiently regulates the private sector in supply and distribution. Bycontrast, the MME's role in the power sector has been much more limited, for a number ofreasons. As a well established, technically proficient and financially strong institution withforceful leadership, SWAWEK has naturally tended to have a major, even dominant, voicein policy-making. In addition, the fact that other government agencies (i.e., themunicipalities and the MLGH) have primary responsibility for distribution, have limited theMME's role in the power sector.
6.4 Legal and institutional changes, such as those discussed below, can contribute muchto strengthening the ministry's hand in power regulation. Enhancing its policy making roleis likely to be a slower process heavily dependent on the development internally of highprofessional standards and the capacity to exercise them. The MME has so far beenmoving in the right direction by basing its decision-making, for the most part, oncommercial and professional criteria, by insisting on thorough study of the issues, byobtaining technical assistance from a variety of sources, and by accepting and acting on thebest advice available. Nevertheless, to provide better support for policy-making the MME

Issues and Options in the Energy Sector, Namibia 43
will need to equip itself with more comprehensive, current and systematic data on allaspects of the sector and increase its analytical capabilities, especially on the economic andfinancial side. For both purposes, it will need to further upgrade its staff, not so muchquantitatively as qualitatively. The emphasis should be on training, both in-house by havingstaff work closely with consultants and technical advisers, and in the form of in-service andacademic training abroad.
6.5 The MME is working closely with NORAD and other donor agencies to directfuture technical assistance along these lines. To strengthen its role in the sector, theministry is also working to bring about the establishment of the National Energy Council,an advisory and coordinating body called for in existing law. The Council would be chairedby the MME and would be composed of representatives of other ministries concerned withthe sector and of various sector institutions.
Regulating the Power Sector
6.6 SWAWEK presently functions largely as a self-regulated public utility. There isno discernible legal framework governing the way in which tariff, investment and othercritical decisions are reached and the relationship between SWAWEK and its nominalregulator, the MME, seems to be mainly one of informal consultation concerning particularissues as they arise. Tariff changes are proposed by SWAWEK to meet its perceivedfinancial requirements. The MME reviews the proposed changes but, since there appear tobe no publicly accepted tariff criteria, and the MME's technical capabilities are limited, it isnot surprising that SWAWEK's proposals seem invariably to have been approved with littleor no alteration. While tariff increases have been relatively infrequent and generally quitemodest, SWAWEK's major customers see themselves as on the receiving end of a unilateralprocess and express little confidence that they are getting a fair deal.
6.7 While there is, thus, a clear need to establish an effective regulatory framework forpower, it is important that this be approached in full recognition of the fact that over-regulation can be, and most often is, more harmful than under-regulation. The challengefacing the government is to establish a framework under which it can provide policydirection and regulatory oversight in a meaningful fashion while enabling SWAWEK tocontinue functioning efficiently and on a financially sound, commercial basis. This will notbe easy, and there are no tried and tested models readily adaptable to Namibian conditions,but experience in the developing and developed countries suggests that effective regulationusually is based on the following:
* Legislation --The roles and responsibilities of the government, the operatingagencies in the sector, and consumers need to be clearly spelled out in a law or othermeasure with firm legal standing.
* Policy and Autonomy --The law should establish both the government's right tocontrol sector strategy and policy and the operating agencies' right to control theirday-to-day operations and intemal administration without political interference.
* Accountability --While free to conduct daily operations, the operating agenciesshould be held accountable for their technical and financial performance inaccordance with agreed standards and targets.

44 Issues and Options in the Energy Sector, Namibia
* Regulation --Should be limited to the principal matters of public concern such astariffs, expenditure budgets, investment programs and financial plans, and include"full-disclosure" reporting requirements necessary for the exercise of suchregulation.
* Entry --Since competition can be the best form of regulation, entry to the sectorshould be open to private firms, cooperatives and other non-governmental entitieswilling to provide generation, transmission or distribution and able to meetestablished service standards.
6.8 As regards tariffs, the principal components of effective regulation are economicallyand financially sound tariff-setting criteria; a systematic and transparent mechanism forperiodic tariff adjustment; and a regulatory body capable of obtaining, and criticallyanalyzing, all relevant information. The tariff criteiia in use around the world vary widely intheory and practice and there are options ranging from the more economically sophisticatedapproaches based on marginal cost pricing to the more traditional financial ones using ratesof return or cash generation targets. While much can be said (and generally is said) in favorof the more sophisticated approaches, given the relatively straightforward structure of thesector and its finances in Namibia, the government might be well advised to give firstconsideration to a simple rate of return based approach. As normally employed, this wouldmean establishing as the primary criterion that tariffs be set at a level that enables theoperating companies to earn a return on fixed assets sufficient to enable them to operatesoundly and to obtain capital for investment on market terms. It is also important that tariffsbe structured on a time-of-day basis to reflect the difference between peak and off-peaksupply costs. The adjustment mechanism should provide that requests for tariff revisionfrom the operating companies be fully justified in terms of the established criteria; thatconsumers and the public be given notice of requested changes and adequate opportunity toregister their views; and that tariff decisions be handed down within a reasonable timeframe.
6.9 It is generally considered good practice to try to insulate the regulatory process frompolitical influence by placing it in the hands of a separate agency, board or commission.However, given the small size of the sector and the limited administrative resources available,it seems clear that the most sensible and practical option in Namibia today is to keep theregulatory function in the MME.
Rationalidng Power Distribution
6.10 The involvement of three sets of institutions --the municipalities, the Ministry ofLocal government and Housing, and the Peri-Urban Development Board-- in electricitydistribution in a country with as small a population as Namibia's has resulted in anatomization of responsibility and a variety of diseconomies and inequities. Even the bestequipped of the three, the municipalities, vary widely in competence and the service they canoffer. While Windhoek's service apparently leaves little to be desired, some of the smallermunicipalities cannot employ full-time professional staff and must rely on consultants andcontractors from whom they frequently cannot afford to secure adequate support. Thegeneral inefficiency of the distribution system is reflected in the overall high level of losses,ranging up to 20% according to information obtained by the mission.
6.11 None of the distributing institutions runs its electricity service as a financiallyresponsible commercial enterprise. The municipalities regard electricity primarily as a

Issues and Options in the Energy Sector, Namibia 45
revenue source and generally seek to maximize tariffs so as to generate a "profit" to supportother activities. While the municipalities seem to make money on their electricity sales, thenet revenue available for other purposes after the electricity departments' investment needsare met is probably a good deal less than they think it is. The Peri-Urban DevelopmentBoard also seems to have some net earnings from electricity sales, but the LocalGovernment and Housing Ministry's situation is very different. It advised the mission thatin 1991, when it paid SWAWEK some R 9 million for its bulk purchases, it collected onlyR 3 million from sales. This reflects both the very high level of unpaid bills (arrears) owedto the Ministry and the very high technical losses in its distribution systems. It implies alarge and growing burden on the national budget
6.12 Distribution is a major weak point in Namibia's power system and one that urgentlyrequires attention, particularly in view of the growing importance of household consumptionin the system. The objective should be to restructure the system with a view to (i) puttingthe operation of the system on a commercial, preferably private basis insofar as possible (ii)centralizing operations so as to obtain greater economies of scale and to equalize servicewhile (iii) maintaining and enhancing local responsibility. This is a tall order and one thatcan only filled by considering a wide range of options.
6.13 One option, for example, might be to establish a power distribution company tooperate the systems in areas not served by the municipalities. It might use its own staffand/or contractors whose services would be procured by competitive bidding. The companymight also contract to operate the distribution systems of at least the smaller municipalities.It should be structured as a commercial venture to attract private investors and established aseither a wholly private company or a joint venture. Northern Namibia would be theprincipal focus of the company's operations and it might be established either as a regionalone, as suggested in Chapter m, or with a national franchise.
6.14 There are a number of variations on this theme, as well as other attractiveapproaches, that merit consideration. None should be chosen without careful considerationof the political, social and institutional issues involved, as well as of the technical, economicand financial ones. To this end it is recommended that the government commission athorough study of the distribution system and the options for its rationalization.
Petroleum Product Pricing
6.15 The prices of the major petroleum products (petrol, diesel and kerosene) arecontrolled by the government under a system essentially similar to that in the RSA. Retailselling prices are fixed for each locality on the basis of (i) a basic list price for each product,known as IBLC, equivalent to an estimated landed cost, set on the basis of Singapore andBahrain refinery prices, (ii) a fuel tax, (iii) duties and special levies, (iv) wholesale and retailmargins intended to provide a 15% rate of return and (v) transport costs and othergeographic differentials. Prices are readjusted periodically and a "slate" is used tocompensate for over or under-recovery in previous periods as a result of differencesbetween the list price and actual import costs. Although all petroleum product prices wereinitially included in this system, prices for lower volume products (jet fuel, LPG andlubricating oils) are no longer controlled.
6.16 In January, 1993 petrol cost R 1.43 and diesel R 1. 35 per liter (equivalent to about$ 1.80 per gallon) in the Swakopmund area near Walvis Bay. Regional price differencesmainly reflect transport costs, with fuel in the most remote localities costing 15-20% more

46 Issues and Options in the Energy Sector, Namibia
than it does near Walvis Bay. The overall price level, not surprisingly, closely reflects thatin the RSA and in similarly situated countries (i.e., Botswana, Lesotho), although pricesseem to be a bit lower in Namibia. Prices in Namibia are about 20-25% higher than in theUSA but substantially lower, especially for petrol, than in Europe.
6.17 This system works smoothly, and both the companies and their customers are wellprotected and well served. There is a clear, well understood mechanism through which theprivate sector distributors can document and propose required price changes to the MME.The latter acts on well defined lines of authority, negotiates with the industry from a wellinformed position, and a mutually agreed pricing pattern is usually quickly and amicablyagreed. The system is quite transparent and there appear to be no inherent conflicts ofinterest.
6.18 In other respects, however, price control is costly to both consumers and thecompanies. While prices are not unreasonable, they are almost certainly higher than theywould be if there was price competition. And, as noted in Chapter IV, with pricecompetition ruled out, competitive pressures have led the companies to over-invest in retailoutlets and over-spend on marketing schemes. More fundamentally, price control seems ahangover from pre-Independence times with little or no economic benefits today. Its majorostensible purpose is to ensure that prices are reasonable and supplies adequate throughoutthe country, even in the more remote areas that the companies might serve only at very highprices. However, available evidence indicates that the price differentials in remote areas foruncontrolled products are no greater than for the controlled ones, and that supplies areequally adequate.
6.19 There appear, then, to be good reasons for believing that commercial forces willeffectively control the market behavior of the companies under competidve conditions. Thelikely initial impact of deregulation would be lower retail prices. However, with margins nolonger assured, it is equally likely that one or more of the less efficient distributioncompanies will withdraw from the market. The MME and the companies agree that sixcompanies are too many for Namibia's small market and that only three or four wouldremain under competitive conditions. This should be sufficient to maintain competition. Itis therefore recommended that the government move to phase out price controls
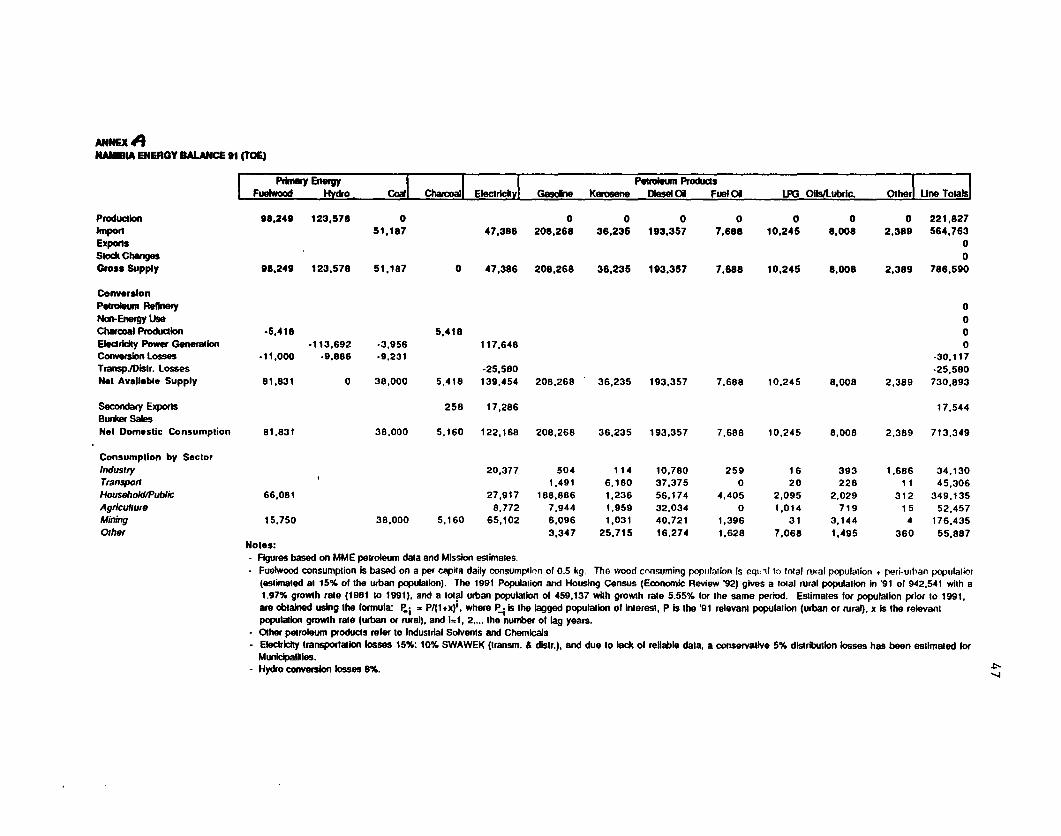
ANNEX 49NHAIA ENERGY BALANCE 91 (TOE)
priary EnrY l Ptroleum Products| Fuetwood Hvdro . Codl Chacoall Electricky Gasolne Kerosne DIsel 01 Fuel 01 LP'G Oll/Lubric. sther Une Totals
ProductIon 98.249 123.578 0 0 0 0 0 0 0 0 221,827Import 51,187 47,386 208,268 36,235 193.357 7,688 10,246 8,Wo8 2,389 564,763Exports 0Stotk Changmes 0Gross Supply 98.249 123,578 51.187 0 47,386 208,268 36,235 193.3'7 7.688 10,245 8,008 2,389 786,590
ConversionPetroleum Relnei
0Non-Enegy Use 0Charcoal Production -5,418 5,418 0Eledricky Power Generalion -113.692 -3,956 117,648 0Conversion Losses .11,000 -9,886 -9,231
-30,117Transpi0tisir. Losses -25,580 -25.580Net Avallable Supply 81.831 0 38,000 5,418 139,454 208,268 36,235 193,357 7.688 10,245 8,008 2,389 730,893Secondary Exports 258 17,286 17,544Purker SalesNet Domestic Consumplion 81,831 38.000 5,160 122,168 208,268 36,235 193.357 7.688 10,245 8,008 2,389 713.349Consumption by Sectorlndusfry 20,377 504 114 10.780 259 16 393 1,686 34,130Transport 1,491 6,180 37,375 0 20 228 11 45,306Househokd/Pubic 66,081 27,917 188,886 1,236 56,174 4,405 2,095 2,029 312 349,135Agriculture 8,772 7,944 1,959 32.034 0 1,014 719 15 52,457Mining 15.750 38,000 5,160 65,102 6,096 1,031 40,721 1,396 31 3,144 4 176,435Other 3,347 25,715 16,274 1,628 7,068 1,495 360 55,887Notes:
- Figures based on MME peiroleum data and Mission estimales.- Fuelwood consumption is based on a per cWrpha daily consumprlon of 0.5 kg. The wood-consuming population is equ,il to total rural poputlalion * peri-umhan populalior(estimalted at 15% ot the urban populalion). The 1991 Population and Housing Census (Economic Review '92) gives a total rural population In 91 ol 942,541 with a1.97% growth rate (1981 lo 1991), and a lotal urban population of 459,137 with growth rate 5.55% lor the same period. Estimales for populalion prior to 1991,are oblaied using the formula: P; = P/(1+x);, where P. is the lagged popultion of hlnerest, P is the '91 relevant populaion (urban or rural), x is the relevantpopulation growth rate (urban or rural), and l=1, 2,... the number of lag years.- Other petroleum products refer to Indusirial Solvents and Chemicals- Elecricity transportation losses 15%: 10% SWAWEK (transm. & disir.), and due to lack of reliable data, a conservative 5% disrbution losses has been estimated forMunidcpalkles.- Hydro conversIon losses 8%.
14
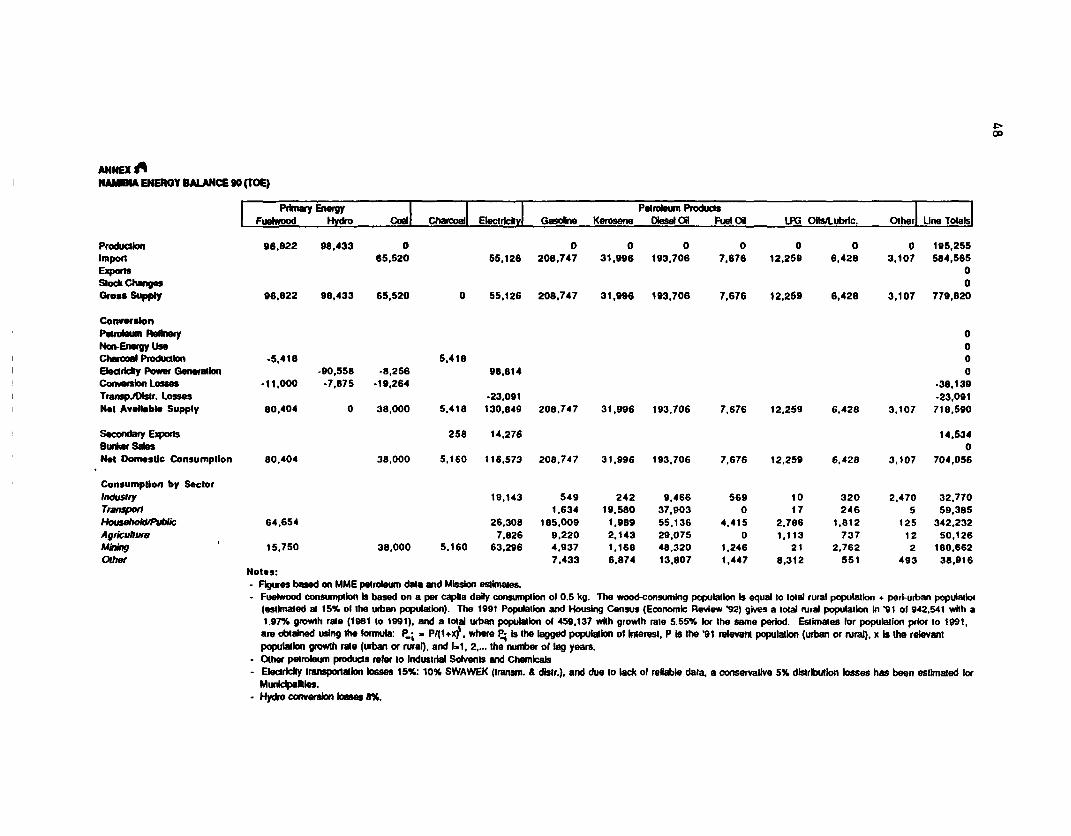
X.-
ANNEX AAIi A ENERGY BALANCE 0 (OE)
PuY Energy Petrolum ProduclsFuOwood Hydro Cod Chasoail EiectriY G Gale Keroee iesOi Fuel Ois LFU 0ls/Lubric. Otherl Una Totals
Produclion 96.822 98,433 0 0 0 0 0 0 0 0 195,255Impon 65,520 55,126 208.747 31.996 193.706 7.676 12.259 6,428 3.107 584,565Eps
0Slodu Change 0Grea Supply 96.822 98,433 65,520 0 55,126 208.747 31,996 193.706 7,676 12.269 6,428 3.107 779.820
ConvwrsionPiolm nety 0No iEnergy Use
0Chrwal Prdubin -5,418 5.418 0Elmariky Powr Geation -90,558 -8.256 98.814 0Conersion Losses -11.000 -7,875 -19,264 -38,139TranspJDlelr. Losses -23,091 -23,091Not Available Supply 80,404 0 38.000 5.418 130.849 208.747 31.996 193.706 7.676 12.259 6.428 3.107 718.590
Secondary Epr 258 14,276 14.534Bunker Sals 0Net Domestic Consumption 80.404 38,000 5,160 116.573 208.747 31.996 193.706 7,676 12.259 6.428 3.107 704,056
Consumptlon by SectorIndustry 19,143 549 242 9.466 569 1 0 320 2.470 32,770Tramp, r 1,634 19.580 37,903 0 17 246 5 59.3851 4ousolt# lic 64.654 26,308 185,009 1.989 55.136 4.415 2,786 1.812 125 342.232Agrkulure 7,826 9.220 2,143 29.075 0 1,113 737 12 50,126M)Wkg 15,750 38.000 5.160 63,296 4.937 1.168 48.320 1.246 21 2.762 2 180,662Other 7,433 6.874 13.807 1.447 8,312 551 493 38.916Notes:
- Figures based on MME ptroeum dala and Mbison estimates.- Fuetwood consumption Is based on a per caha daly consumptIon oi 0.5 kg. The wood-consuming population Is equal to total rural population * peri-uFban populatloi
(estinated at 15% ol the urban population). The 1991 Population and Housing Census (Economic Review '92) gives a total rural population In .91 of 942.541 with a1.97% growth rate (1981 to 1991), and a total urban popubtion of 459.137 with growth rate 5.55% for the same period. Estimates for popuilaon prir to 1991,are obtalned using the lormula: P.; - PI(l+x). where P Is the bggedp putiont ol Interest, P Is the '91 relevart poputation (urban or tral), x Isthe relevanlpopultion growth rats (urban or rural), and 1.1, 2,... Ihe numbor of lag years.
- Other petroleum products reler lo Indusirbi Solvents and Chemnicab- Electricity transportation iosses 15%: 10% SWAWEK (Iransm. & distr.). and due to lack of rellalle data, a conserafive 5% distribuion losses has been estimated lorMunkipamies.- Hydro caworlon iba 8%.

ANNXdIq1AH1A ENERGY sDANCE n9 (TOE)
Prlmay Energy Petoun ProduasFuivood Hydro Cod ChaDoal Electricky Gamde Kerosene Died ONl Fuel 01 LPG Oflslubrlc. Other Une Totals
Producilon 95,431 122,270 0 0 0 0 0 0 0 0 217,701Impon 63,227 37,754 229.928 47.181 251.731 10,183 12,304 7,395 4,410 664.113Exports 0Slod Changes 0Oress Supply 95.431 122.270 63.227 0 37,754 229.928 47.181 251,731 10,183 12,304 7.395 4,410 881.814
ConverslonPerolum Rumwy 0Non-Enrgy Us 0Charcoal Praduclon -5.418 5.418 0Elearlhy Powr Genration -112,488 -7,468 119.956 0Convemon Losses -11.000 -9.782 -17,659 -38.441TranspiDbtr. Losses -23.657 -23,657Net Available Supply 79,013 0 38,000 5.418 134.053 229.928 47.181 251.731 10.183 12.304 7,395 4,410 819,616
Secondary Exports 258 22.962 23.220Bu*e Sales 0
Not Domestic Consumption 79.013 38.000 5,160 111.091 229.928 47.181 251.731 10,183 12.304 7,395 4.410 796,396
Consumption by SectorIndustry 17,304 795 439 9,638 2.836 31 414 3,295 34,752Transpor 1,634 19.529 50.169 18 45 204 18 71,617HoushokIPub1ic 63,263 24,901 199,126 16.176 81,073 4,340 2.411 2,569 457 394,316Agnculture 7,310 9.369 2,514 29,664 0 1,264 815 11 50,947UhMg 15,750 38,000 5,160 61,576 9,015 1.007 65,011 793 21 2.763 3 199,098Othe, 9.989 7,517 16,177 2,196 8.532 629 626 45.666
Notes:- FIures based on MME petolum data and Msion estimates.- Fuswood consumption Is based on a per capha daly consumption ol 0.5 kg. The wood-consumig populaion Is equal to lotal rural population + pod-urban populalkx
(esthiated at 15% of the urban population). The 1991 Popuation and Housing Census (Econonic Review '92) gives a total rural population In '91 of 942.541 vih a1.97% growth rale (1961 to 1991). and a total urban popubtion oa 459,137 wkh growth rate 5.55% tor Ihe same period. Esilmales tor populatlon prior to 1991,are oblalned using the bonmula P; . P/(I(x?X, where P4 Is the agged populatin of Iterest. P is the '91 relevant popultion (urban or rural), x Is the relevantpopuibion gmwth rate (uban or ur)al, and 1., 2,... the number ol lag yar.
- Other petroleum products rehr lo Industril Svents wnd Chemicals- Electricity transporation kess 15%: 10% SWAWEK (Irar m. & dbtr.), and due to ladc dl rekble data, a conservatIve 5% dbstrblon losses has been estimated tor
Munddpables. J- Hydro convion ases 8%. 0

50 Issues and Options in the Energy Sector, Namibia
ANNEX B
COST COMPARISON OF SHORT AND MEDIUM TERM POWER SUPPLYOPTIONS
Increased Imports from THE RSA
SWAWEK currently purchases bulk energy from ESKOM at an average price of 2.9 UScents/kWh, based on ESKOM's tariff "E" for large customers consisting of a demandcharge of 9.22 $tkW-month, and an energy charge of 1.78 cents/kWh. In addition, largecustomers pay a basic charge of 95 $/month.
To permit expanded imports the strengthening of the interconnection will be required by1995/96. This implies a new transmission line of 850 Km, to be built by SWAWEK andESKOM. It is considered that 80% of the costs will be covered by SWAWEK.
Two basic scenarios are examined. These are:
- The implementation of the Epupa hydro project by 2002.T he development of the power system without Epupa.
Accordingly, the costs of 3 alternatives were estimated for comparison purposes.
- Alternative 1. A 220 kV single circuit implemented by 1996, with no furtherexpansion. Capital cost: US.$ 92.5 million.
Alternative 2. A 400 kV single circuit implemented by 1996. Capital cost: US.$115.6 million. The cost of an early implementation of this alternative, advanced from theyear 2002 (date probably required for Epupa) to 1996 was also estimated.
- Alternative 3. A phased 220 kV double circuit, first circuit in 1996 and secondcircuit in 2002. Capital cost: US$ 148.2 million.
Comparisons refer only to present value of capital costs. No estimates are made for theeconomic impact of different energy losses, since no information is available at this stageand an appropriate estimate would be difficult to do without sufficient data and properanalytical models. It should be noted however, that alternatives adopting a higher voltage(400 kV) would tend to reduce energy losses.
Alternatives 2 and 3 provide information for the comparison of 220 kV vs. 400 kV,assuming that Epupa would be implemented by 2002, and that the alternatives aretechnically appropriate. The comparison of alternatives 1 and 2 provides information on theadditional cost incurred in a 400 kV transmission line, instead of 220 kV, if Epupa is notbuilt. Finally, the costs of an early implementation of alternative 2 are useful for estimatingtransmission costs to be charged to energy imports during the period 1996-2001.

Issues and Options in the Energy Sector, Namibia 51
The present value costs of the 3 alternatives, plus the early implementation of alternative 2(named alt. 2.1) are:
Discount Alternative Cost (US$ million)Rate (%) 1 2 2.1 3
8 73.7 91.9 34.0 101.510 69.8 87.1 37.9 93.412 66.2 86.2 40.8 86.3
- If Epupa is built by 2002, the installation of a 400 kV single circuit (Alt. 2) would bethe least cost solution. Compared to a phased 220 kV double circuit (Alt. 3), Alt. 2 wouldcost 6.3 US$ million less.
- If Epupa is not implemented, the construction of a 400 kV transmission line (Alt. 2)would imply an additional cost of 17.3 US$ million compared to a 220 kV single circuit(Alt. 1).
Transmission costs per kWh
The incremental energy to be transmitted through the new transmission lines is estimated asfollows:
1996 908 GWh1997 9901998 10751999 11632000 12542001-10 14011
1 Limited to a 80% utilization factor for a 200MW capacity.
Costs per kWh:
- If Epupa is built by 2002. Cost of early implementation of 400 kV transmissionline.
discount US cents/kWhrate (%)
10 1.1512 1.42
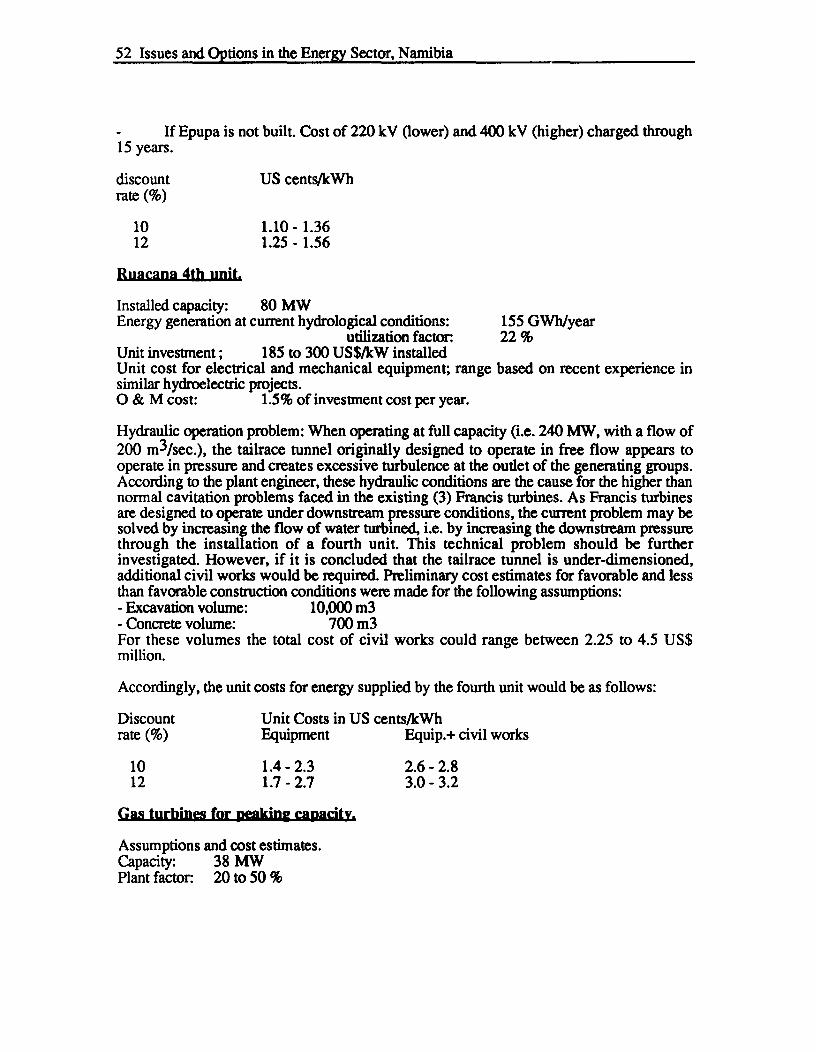
52 Issues and Options in the Energy Sector, Namibia
- If Epupa is not built. Cost of 220 kV (lower) and 400 kV (higher) charged through15 years.
discount US cents/kWhrate (%)
10 1.10 - 1.3612 1.25 - 1.56
Ruacana 4th unit.
Installed capacity: 80 MWEnergy generation at current hydrological conditions: 155 GWh/year
utilization factor. 22 %Unit investment; 185 to 300 US$/kW installedUnit cost for electrical and mechanical equipment; range based on recent experience insimilar hydroelectric projects.O & M cost: 1.5% of investment cost per year.
Hydraulic operation problem: When operating at full capacity (i.e. 240 MW, with a flow of200 m3/sec.), the tailrace tunnel originally designed to operate in free flow appears tooperate in pressure and creates excessive turbulence at the outlet of the generating groups.According to the plant engineer, these hydraulic conditions are the cause for the higher thannormal cavitation problems faced in the existing (3) Francis turbines. As Francis turbinesare designed to operate under downstream pressure conditions, the current problem may besolved by increasing the flow of water turbined, i.e. by increasing the downstream pressurethrough the installation of a fourth unit. This technical problem should be furtherinvestigated. However, if it is concluded that the tailrace tunnel is under-dimensioned,additional civil works would be requird. Preliminary cost estimates for favorable and lessthan favorable construction conditions were made for the following assumptions:- Excavation volume: 10,000 m3- Concrete volume: 700 m3For these volumes the total cost of civil works could range between 2.25 to 4.5 US$million.
Accordingly, the unit costs for energy supplied by the fourth unit would be as follows:
Discount Unit Costs in US cents/kWhrate (%) Equipment Equip.+ civil works
10 1.4 - 2.3 2.6- 2.812 1.7 - 2.7 3.0 - 3.2
Gas turbines for ocaking capacity.
Assumptions and cost estimates.Capacity: 38 MWPlant factor 20 to 50 %

Issues and Options in the Energy Sector, Namibia 53
Unit investment cost: US$ 300/kWCost contingency: 10% of investment costAnnual O&M cost 3% of investment costFuel: diesel oil, at US$ 25/barrel
natural gas, at US$ 1.2/thou.CFThermal efficiency: 30%Implementation period: 2 yearsEconomic life: 20years
- Gas turbine generation costs (US cents/kWh)
Plant Factor Diesel-fueled Gas-fueled(%) discount rate discount rate
10% 12% 10% 12%
20 7.8 8.1 4.3 4.625 7.2 7.5 3.7 4.030 6.8 7.1 3.3 3.535 6.6 6.8 3.0 3.240 6.3 6.5 2.8 3.045 6.2 6.3 2.6 2.850 6.1 6.2 2.5 2.7

54 Issues and Options in the Energy Sector, Nanibia
ANE C
EPUPA HYDROPOWER PROJECT
The Epupa hydropower project is located in the Kunene river, in the vicinity of the Epupafalls. SWAWEK has identified a promising site for a hydropower development where aarch dam could be built creating a large reservoir for multi-annual regulation. A pre-feasibility study is underway with NORAD's support. In a preliminary report, SWAWEKformulated three alternative schemes for the same site, and a common dam. Thecharacteristics of these dam are:
Storage capacity: 5,000 million m3
Dam wall;Type: double curvature archHeight: 130 mConcrete volume: 800,000 m3
Crest length: 650 m
The three altematives have the following technical characteristics:
AlternativeI II III
Installed capacity (MW) 240 350 450Head (m) 120 165 180Pressure tunnel (Km) -- 2.7 7.35Power output (GWh/yr.) 1200 1650 1800Plant factor (%) 57.1 53.8 45.7Capital Cost
R. billion 1.25US$ million 450
Construction period (years) 5 to 7
- Cost Estima
SWAWEK's cost estimates appear to be, though not impossible, very optimistic. Comparedto international experience this estimate of approximately 1,000 US$/kW would be in thelower level of a wide range of costs. The cost estimates provided below are based onfollowing two approaches:
- Higher cost: on the basis of actual capital costs of more than 40 hydropowerprojects financed by the World Bank. This approach uses factor analysis for estimatingcosts for a project of average conditions, in terms of site potential as well as implementationperformance. It does not address specific technical characteristics.- Lower cost: based on a comparison of Epupa with a project of similar characteristics(Berke project in Turkey), particularly in its main structure: a double curvature arch dam.

Issues and Options in the Energy Sector, Namibia 55
Preliminary cost estimates are shown in the following table:
AlternativeI II m
Installed capacity (MW) 240 350 450Capital cost (US$ million)
Low value 455 500 525High value 615 715 800
Energy cost (US cents/kWh)Lowvalue; r10% 5.0 4.2 4.0
r.12% 6.1 5.2 5.0High value; r:10% 6.8 6.0 6.2
r. 12% 8.3 7.4 7.6


- 56 -
Joint UNDP/World BankENERGY SECTOR AMANAGEMENT ASSISTANCE PROGRAMME (ESMAP)
LIST OF REPORTS ON COAPLETED ACTIVITIES
Region/Country Actdvity/Report This Date Number
SUB-SAHARAN AFRICA (AFR)
Africa Regional Anglophone Africa Household Energy Workshop (English) 07/88 085/88Regional Power Seminar on Reducing Electric Power System
Losses in Africa (English) 08/88 087/88Institutional Evaluation of EGL (English) 02/89 098/89Biomass Mapping Regional Workshops (English - Out of Print) 05/89 -
Francophone Household Energy Workshop (French) 08/89 103/89Interafrican Electrical Engineering College: Proposals for Short-
and Long-Term Development (English) 03/90 112/90Biomass Assessment and Mapping (English - Out of Print) 03/90 -
Angola Energy Assessment (English and Portuguese) 05/89 4708-ANGPower Rehabilitation and Technical Assistance (English) 10/91 142/91
Benin Energy Assessment (English and French) 06/85 5222-BENBotswana Energy Assessment (English) 09/84 4998-BT
Pump Electrification Prefeasibility Study (English) 01/86 047/86Review of Electricity Service Connection Policy (English) 07/87 071/87Tuli Block Farms Electrification Study (English) 07/87 072/87Household Energy Issues Study (English - Out of Print) 02/88 -Urban Household Energy Strategy Study (English) 05/91 132/91
Burkina Faso Energy Assessment (English and French) 01/86 5730-BURTechnical Assistance Program (English) 03/86 052/86Urban Household Energy Strategy Study (English and French) 06/91 134/91
Burundi Energy Assessment (English) 06/82 3778-BUPetroleum Supply Management (English) 01/84 012/84Status Report (English and French) 02/84 011/84Presentation of Energy Projects for the Fourth Five-Year Plan
(1983-1987) (English and French) 05/85 036/85Improved Charcoal Cookstove Strategy (English and French) 09/85 042/85Peat Utilization Project (English) 11/85 046/85Energy Assessment (English and French) 01/92 9215-BU
Cape Verde Energy Assessment (English and Portuguese) 08/84 5073-CVHousehold Energy Strategy Study (English) 02/90 110/90
Central AfricanRepublic Energy Assessement (French) 08/92 9898-CAR
Comoros Energy Assessment (English and French) 01/88 7104-COMCongo Energy Assessment (English) 01/88 6420-COB
Power Development Plan (English and French) 03/90 106/90C6te d'Ivoire Energy Assessment (English and French) 04/85 5250-IVC
Improved Biomass Utilization (English and French) 04/87 069/87Power System Efficiency Study (Out of Print) 12/87 -
Power Sector Efficiency Study (French) 02/92 140/91Ethiopia Energy Assessment (English) 07/84 4741-ET
Power System Efficiency Study (English) 10/85 045/85

- 57 -
Region/Counny Acdiity/Report Rtk Date Nwmber
Ethiopia Agricultural Residue Briquetting Pilot Project (English) 12/86 062/86Bagasse Study (English) 12/86 063/86Cooking Efficiency Project (English) 12/87 -
Gabon Energy Assessment (English) 07/88 6915-GAThe Gambia Energy Assessment (English) 11/83 4743-GM
Solar Water Heating Retrofit Project (English) 02/85 030/85Solar Photovoltaic Applications (English) 03/85 032/85Petroleum Supply Management Assistance (English) 04/85 035/85
Ghana Energy Assessment (English) 11/86 6234-GHEnergy Rationalization in the Industrial Sector (English) 06/88 084/88Sawmill Residues Utilization Study (English) 11/88 074/87
Guinea Energy Assessment (Out of Print) 11/86 6137-GUIGuinea-Bissau Energy Assessment (English and Portuguese) 08/84 5083-GUB
Recommended Technical Assistance Projects (English &Portuguese) 04/85 033/85
Management Options for the Electric Power and Water SupplySubsectors (English) 02/90 100/90
Power and Water Institutional Restructuring (French) 04/91 118/91Kenya Energy Assessment (English) 05/82 3800-KE
Power System Efficiency Study (English) 03/84 014/84Status Report (English) 05/84 016/84Coal Conversion Action Plan (English - Out of Print) 02/87 -
Solar Water Heating Study (English) 02/87 066/87Peri-Urban Woodfuel Development (English) 10/87 076/87Power Master Plan (English - Out of Print) 11/87 -
Lesotho Energy Assessment (English) 01/84 4676-LSOLiberia Energy Assessment (English) 12/84 5279-LBR
Recommended Technical Assistance Projects (English) 06/85 038/85Power System Efficiency Study (English) 12/87 081/87
Madagascar Energy Assessment (English) 01/87 5700-MAGPower System Efficiency Study (English and French) 12/87 075/87
Malawi Energy Assessment (English) 08/82 3903-MALTechnical Assistance to Improve the Efficiency of Fuelwood
Use in the Tobacco Industry (English) 11/83 009/83Status Report (English) 01/84 013/84
Mali Energy Assessment (English and French) 11/91 8423-MLUHousehold Energy Strategy (English and French) 03/92 147/92
Islamic Republicof Mauritania Energy Assessment (English and French) 04/85 5224-MAU
Household Energy Strategy Study (English and French) 07/90 123/90Mauritius Energy Assessment (English) 12/81 3510-MAS
Status Report (English) 10/83 008/83Power System Efficiency Audit (English) 05/87 070/87Bagasse Power Potential (English) 10/87 077/87
Mozambique Energy Assessment (English) 01/87 6128-MOZHousehold Electricity Utilization Study (English) 03/90 113/90
Namibia Energy Assessment (English) 03/93 11320-NAM

- 58 -
Region/Country Acdvyl/Rcport ltkh Date Number
Niger Energy Assessment (French) 05/84 4642-NIRStatus Report (English and French) 02/86 051/86Improved Stoves Project (English and French) 12/87 080/87Household Energy Conservation and Substitution (English
and French) 01/88 082/88Nigeria Energy Assessment (English) 08/83 4440-UNIRwanda Energy Assessment (English) 06/82 3779-RW
Energy Assessment (English and French) 07/91 8017-RWStatus Report (English and French) 05/84 017/84Improved Charcoal Cookstove Strategy (English and French) 08/86 059/86Improved Charcoal Production Techniques (English and French) 02/87 065/87Commercialization of Improved Charcoal Stoves and Carbonization
Techniques Mid-Term Progress Report (English and French) 12/91 141/91SADCC SADCC Regional Sector: Regional Capacity-Building Program
for Energy Surveys and Policy Analysis (English) 11/91 -
Sao Tomeand Principe Energy Assessment (English) 10/85 5803-STP
Senegal Energy Assessment (English) 07/83 4182-SEStatus Report (English and French) 10/84 025/84Industrial Energy Conservation Study (English) 05/85 037/85Preparatory Assistance for Donor Meeting (English and French) 04/86 056/86Urban Household Energy Strategy (English) 02/89 096/89
Seychelles Energy Assessment (English) 01/84 4693-SEYElectric Power System Efficiency Study (English) 08/84 021/84
Sierra Leone Energy Assessment (English) 10/87 6597-SLSomalia Energy Assessment (English) 12/85 5796-SOSudan Management Assistance to the Ministry of Energy and Mining 05/83 003/83
Energy Assessment (English) 07/83 4511-SUPower System Efficiency Study (English) 06/84 018/84Status Report (English) 11/84 026/84Wood Energy/Forestry Feasibility (English - Out of Print) 07/87 073/87
Swaziland Energy Assessment (English) 02/87 6262-SWTanzania Energy Assessment (English) 11/84 4969-TA
Peri-Urban Woodfuels Feasibility Study (English) 08/88 086/88Tobacco Curing Efficiency Study (English) 05/89 102/89Remote Sensing and Mapping of Woodlands (English) 06/90 -
Industrial Energy Efficiency Technical Assistance(English - Out of Print) 08/90 122/90
Togo Energy Assessment (English) 06/85 5221-TOWood Recovery in the Nangbeto Lake (English and French) 04/86 055/86Power Efficiency Improvement (English and French) 12/87 078/87
Uganda Energy Assessment (English) 07/83 4453-UGStatus Report (English) 08/84 020/84Institutional Review of the Energy Sector (English) 01/85 029/85Energy Efficiency in Tobacco Curing Industry (English) 02/86 049/86Fuelwood/Forestry Feasibility Study (English) 03/86 053/86

- 59 -
RegionfCountry Acdvity/Report lti. Date Number
Uganda Power System Efficiency Study (English) 12/88 092/88Energy Efficiency Improvement in the Brick and
Tile Industry (English) 02/89 097/89Tobacco Curing Pilot Project (English - Out of Print) 03/89 UNDP Terminal
ReportZaire Energy Assessment (English) 05/86 5837-ZRZambia Energy Assessment (English) 01/83 4110-ZA
Status Report (English) 08/85 039/85Energy Sector Institutional Review (English) 11/86 060/86Power Subsector Efficiency Study (English) 02/89 093/88Energy Strategy Study (English) 02/89 094/88Urban Household Energy Strategy Study (English) 08/90 121/90
Zimbabwe Energy Assessment (English) 06/82 3765-ZIMPower System Efficiency Study (English) 06/83 005/83Status Report (English) 08/84 019/84Power Sector Management Assistance Project (English) 04/85 034/85Petroleum Management Assistance (English) 12/89 109/89Power Sector Management Institution Building
(English - Out of Print) 09/89 -
Charcoal Utilization Prefeasibility Study (English) 06/90 119/90Integrated Energy Strategy Evaluation (English) 01/92 8768-ZIM
EAST ASIA AND PACIFIC (EAP)
Asia Regional Pacific Household and Rural Energy Seminar (English) 11/90 -
China County-Level Rural Energy Assessments (English) 05/89 101/89Fuelwood Forestry Preinvestment Study (English) 12/89 105/89
Fiji Energy Assessment (English) 06/83 4462-FL/Indonesia Energy Assessment (English) 11/81 3543-IND
Status Report (English) 09/84 022/84Power Generation Efficiency Study (English) 02/86 050/86Energy Efficiency in the Brick, Tile and
Lime Industries (English) 04/87 067/87Diesel Generating Plant Efficiency Study (English) 12/88 095/88Urban Household Energy Strategy Study (English) 02/90 107/90Biomass Gasifier Preinvestment Study Vols. I & II (English) 12/90 124/90
Lao PDR Urban Electricity Demand Assessment Study (English) 03/93 154/93Malaysia Sabah Power System Efficiency Study (English) 03/87 068/87
Gas Utilization Study (English) 09/91 9645-MAMyanmar Energy Assessment (English) 06/85 5416-BAPapua New
Guinea Energy Assessment (English) 06/82 3882-PNGStatus Report (English) 07/83 006/83Energy Strategy Paper (English - Out of Print) - -
Institutional Review in the Energy Sector (English) 10/84 023/84Power Tariff Study (English) 10/84 024/84

- 60 -
Region/Counhy Acdtvky/Repol This Date Nunber
Solomon Islands Energy Assessment (English) 06/83 4404-SOLEnergy Assessment (English) 01/92 979/SOL
South Pacific Petroleum Transport in the South Pacific (English-Out of Print) 05/86 -
Thailand Energy Assessment (English) 09/85 5793-THRural Energy Issues and Options (English - Out of Print) 09/85 044/85Accelerated Dissemination of Improved Stoves and
Charcoal Kilns (English - Out of Print) 09/87 079/87Northeast Region Village Forestry and Woodfuels
Preinvestment Study (English) 02/88 083/88Impact of Lower Oil Prices (English) 08/88 -
Coal Development and Utilization Study (English) 10/89 -
Tonga Energy Assessment (English) 06185 5498-TONVanuatu Energy Assessment (English) 06185 SS77-VAWestem Samoa Energy Assessment (English) 06/85 5497-WSO
SOUTH ASIA (SAS)
Bangladesh Energy Assessment (English) 10/82 3873-BDPriority Investment Program 05/83 002/83Status Report (English) 04/84 015/84Power System Efficiency Study (English) 02/85 031/85Smmdl Scale Uses of Gas Prefeasibility Study (English -
(Out of Print) 12/88 -
India Opportunities for Commercialization of NonconventionalEnergy Systems (English) 11/88 091/88
Maharashtra Bagasse Energy Efficiency Project (English) 05/91 120/91Mini-Hydro Development on Irrigation Dams and
Canal Drops Vols. I, II and III (English) 07/91 139/91WindFarm Pre-Investment Study (English) 12/92 150/92
Nepal Energy Assessment (English) 08/83 4474-NEPStatus Report (English) 01185 028/84
Pakistan Household Energy Assessment (English - Out of Print) 05/88 -
Assessment of Photovoltaic Programs, Applications, andMarkets (English) 10/89 103/89
Sri Lanka Energy Assessment (English) 05/82 3792-CEPower System Loss Reduction Study (English) 07/83 007/83Status Report (English) 01/84 010/84Industrial Energy Conservation Study (English) 03/86 054/86

- 61 -
Region/Country Actviy/Repoil 7Tie Date Number
EUROPE AND CENTRAL ASIA (ECA)
Eastern Europe The Future of Natural Gas in Eastern Europe (English) 08/92 149/92Poland Energy Sector Restructuring Program Vols. I-V (English) 01/93 153/93Portugal Energy Assessment (English) 04/84 4824-POTurkey Energy Assessment (English) 03/83 3877-TU
MIDDLE EAST AND NORTH AFRICA (MNA)
Morocco Energy Assessment (English and French) 03/84 4157-MORStatus Report (English and French) 01/86 048/86
Syria Energy Assessment (English) 05/86 5822-SYRElectric Power Efficiency Study (English) 09/88 089/88Energy Efficiency Improvement in the Cement Sector (English) 04/89 099/89Energy Efficiency Improvement in the Fertilizer Sector(English) 06/90 115/90
Tunisia Fuel Substitution (English and French) 03/90 -
Power Efficiency Study (English and French) 02/92 136/91Energy Management Strategy in the Residential and
Tertiary Sectors (English) 04/92 146/92Yemen Energy Assessment (English) 12/84 4892-YAR
Energy Investment Priorities (English - Out of Print) 02/87 6376-YARHousehold Energy Strategy Study Phase I (English) 03/91 126/91
LATIN AMERICA AND THE CARIBBEAN (LAC)
LAC Regional Regional Seminar on Electric Power System Loss Reductionin the Caribbean (English) 07/89 -
Bolivia Energy Assessment (English) 04/83 4213-BONational Energy Plan (English) 12/87 -National Energy Plan (Spanish) 08/91 131/91La Paz Private Power Technical Assistance (English) 11/90 111/90Natural Gas Distribution: Economics and Regulation (English) 03/92 125/92Prefeasibility Evaluation Rural Electrification and Demand
Assessment (English and Spanish) 04/91 129/91Private Power Generation and Transmission (English) 01/92 137/91
Chile Energy Sector Review (English - Out of Print) 08/88 7129-CHColombia Energy Strategy Paper (English) 12/86 -
Costa Rica Energy Assessment (English and Spanish) 01/84 4655-CRRecommended Technical Assistance Projects (English) 11/84 027/84Forest Residues Utilization Study (English and Spanish) 02/90 108/90
DominicanRepublic Energy Assessment (English) 05/91 8234-DO
Ecuador Energy Assessment (Spanish) 12/85 5865-ECEnergy Strategy Phase I (Spanish) 07/88 --
Energy Strategy (English) 04/91Private Minihydropower Development Study (English) 11/92 --

- 62 -
Region/Country Ach'iiy/Report ltk Date Number
Haiti Energy Assessment (English and French) 06/82 3672-HAStatus Report (English and French) 08/85 041/85Household Energy Strategy (English and French) 12/91 143/91
Honduras Energy Assessment (English) 08/87 6476-HOPetroleum Supply Management (English) 03/91 128/91
Jamaica Energy Assessment (English) 04/85 5466-JMPetroleum Procurement, Refining, and
Distribution Study (English) 11/86 061/86Energy Efficiency Building Code Phase I (English-Out of Print) 03/88 -
Energy Efficiency Standards andLabels Phase I (English - Out of Print) 03/88 -
Management Information System Phase I (English - Out of PRint) 03/88 -
Charcoal Production Project (English) 09/88 090/88FIDCO Sawmill Residues Utilization Study (English) 09/88 088/88Energy Sector Strategy and Investment Planning Study (English) 07/92 135/92
Mexico Improved Charcoal Production Within Forest Management forthe State of Veracruz (English and Spanish) 08/91 138/91
Panama Power System Efficiency Study (English - Out of Print) 06/83 004/83Paraguay Energy Assessment (English) 10/84 5145-PA
Recommended Technical Assistance Projects (English-(Out of Print) 09/85 -
Status Report (English and Spanish) 09/85 043/85Peru Energy Assessment (English) 01/84 4677-PE
Status Report (English - Out of Print) 08/85 040/85Proposal for a Stove Dissemination Program in
the Sierra (English and Spanish) 02/87 064/87Energy Strategy (Spanish) 12/90 -
Saint Lucia Energy Assessment (English) 09/84 5111-SLUSt. Vincent andthe Grenadines Energy Assessment (English) 09/84 5103-STV
Trinidad andTobago Energy Assessment (English - Out of Print) 12/85 5930-TR
GLOBAL
Energy End Use Efficiency: Research and Strategy(English - Out of Print) 11/89 -
Guidelines for Utility Customer Management andMetering (English and Spanish) 07/91 -
Women and Energy-A Resource GuideThe International Network: Policies and Experience (English) 04/90 -
Assessment of Personal Computer Models for EnergyPlanning in Developing Countries (English) 10/91 -
Long-Term Gas Contracts Principles and Applications (English) 02/93 152/93
032593


IBRD 2289t
I2S, i It I.S 5*
n;ene R EANGOLA -8toll S X ATLMric 9a \ R ; K vDA Es GOBABBSNA IZAMBIA
KAOKOLNORt X RJNC.
-. PIBTOU 1 TJPOTr
Rfl'EREROLAND-
I $ T R K HEERROLAND- BOTSWANA
.0 ~~~ GOBABIS ~~~NAMIBIARIBIS BANS-~~ ADMINISTRATION AND
TRANSPORTATIONKolahari MAJOR ROADS
I-I ~~~~HER~RO- SECONDARY ROADS
SWAKOPMUND s ~~~~~~~~~~~- RAIL.ROADS
SELECTED VILLAGES
W;;~~~~~~~~~~~~~~~~EO Desert 0 CM -~ -'%ARIE'NTAL (@ MAGISTERIAL DISTRICT CAPITALS
MALTAH611E C-PdQ~~~~~~~~~ NATIONAL CAPITAL
MALTA H4HE MAGISTERIAL DISTRICr BOUNDARIES
- NTRNATIONAL BOUNDARIES
Doort~~~~~~~~~~~~~~~~~~~~NrtlrdOs n aaad
55 S
MAkRCH 1991